Application of Portable Air Purifiers for Mitigating COVID-19 in Large Public Spaces
←
→
Page content transcription
If your browser does not render page correctly, please read the page content below
Article

Application of Portable Air Purifiers for Mitigating COVID-19
in Large Public Spaces
Zhiqiang (John) Zhai 1,*, He Li 2, Robert Bahl 3 and Keith Trace 3

                                          1 Department of Civil, Environmental and Architectural Engineering, University of Colorado at Boulder,
                                            80309 Boulder, CO, USA
                                          2 School of Environmental Science and Engineering, Donghua University, 201620 Shanghai, China;

                                            2151225@mail.dhu.edu.cn
                                          3 Engineering & Facilities, Global Operations, , Marriott International, Inc., 20817 Bethesda, MD, USA; rob-

                                            ert.bahl@marriott.com (R.B.);
                                            keith.trace@marriott.com (K.T.)
                                          * Correspondence: john.zhai@colorado.edu; Tel.: +1-3034924699

                                          Abstract: This study investigated, using validated computational fluid dynamics techniques, the
                                          actual performance of portable air purifiers for reducing the infection risks of airborne respiratory
                                          diseases such as COVID-19, by properly installing air purifiers in complicated large public spaces
                                          of primary concern, such as restaurants and ballrooms. The research results reveal that portable air
                                          purifiers with HEPA filtration provide an effective solution to help mitigate virus-carrying parti-
                                          cles/droplets in large spaces where the central air conditioning system with HEPA filtration may
                                          not provide adequate dilution and/or effective ventilation. Deploying portable air purifier changes
                                          the local flow directions, and thus, reduces the cross-table airflows that may enhance the possibility
                                          of cross-infection. A field experiment was further conducted in a restaurant and a ballroom to verify
                                          the on-site performance. This study indicates that each space is unique in furniture, occupant and
                                          system layouts and capacities, and thus, requires individualized investigation of appropriate puri-
                                          fier number, capacities, and locations. Flexible solutions such as portable air purifiers are important
                                          and low-cost supplements to more elaborate solutions installed in central air systems.
Citation: Zhai, Z.; Li, H.; Bahl, R.;
Trace, K. Application of Portable Air     Keywords: portable air purifier; computational fluid dynamics; field experiment; public space;
Purifiers for Mitigating COVID-19 in      COVID-19
Large Public Spaces. Buildings 2021,
11, x. https://doi.org/10.3390/xxxxx

Academic Editor: Francesco Nocera         1. Introduction
                                                In less than two years since the coronavirus disease 2019 (COVID-19) emerged, the
Received: 24 June 2021
Accepted: 26 July 2021
                                          pandemic has changed how we live, work, study, and interact as social distancing guide-
Published: date
                                          lines have led to a more virtual world, both personally and professionally. This became a
                                          more severe concern when scientific data supported the possibility that the COVID-19
Publisher’s Note: MDPI stays neu-         virus may be transmitted by aerosols (so-called airborne transmission) [1]. It was high-
tral with regard to jurisdictional        lighted that aerosol transmission may more likely occur in particular environments, such
claims in published maps and institu-     as indoor, crowded, and inadequately ventilated spaces, where the infected person(s)
tional affiliations.                      spend a relatively long period of time with others (e.g., over 30 min), such as classrooms,
                                          restaurants, choir practices, fitness classes, nightclubs, offices, and places of worship.
                                          Therefore, how to reduce the infection risks of airborne respiratory diseases in a public
                                          place becomes an urgent task for epidemiologists and public health experts.
Copyright: © 2021 by the authors.
                                                The results in the survey study of Fabisiak et al. [2] indicated that 55% of respondents
Submitted for possible open access
                                          will be afraid to use public spaces after the COVID-19 lockdown. Restrictions on the use
publication under the terms and con-
                                          of public spaces and physical distancing have been key policy measures to reduce the
ditions of the Creative Commons At-
tribution (CC BY) license (https://cre-
                                          transmission of COVID-19 and protect public health [3]. Despite the concerns and the dif-
ativecommons.org/licenses/by/4.0/).
                                          ficulties faced throughout the pandemic, those who were committed to investigating the

Buildings 2021, 11, x. https://doi.org/10.3390/xxxxx                                                                  www.mdpi.com/journal/buildings
Buildings 2021, 11, x FOR PEER REVIEW                                                                                        2 of 14

                                 new approaches to infection prevention demonstrated that they have managed to find
                                 promising solutions in their studies. Air purifiers, as traditional air pollution purification
                                 equipment, exhibit an excellent potential to reduce the infection risk of airborne transmis-
                                 sion [4–7]. The Centers for Disease Control and Prevention (CDC) of the U.S. has contin-
                                 ued to update guidance on airborne transmission, with the most recent update occurring
                                 on December 8th, 2020, which stated “Portable HEPA (high-efficiency particulate absorb-
                                 ing) filtration units that combine a HEPA filter with a powered fan system are a great
                                 option for auxiliary air cleaning.” In one example, the CDC concluded that “Adding the
                                 portable HEPA unit increased the effective ventilation rate and improved room air mix-
                                 ing. This resulted in over a 75% reduction in time for the room to be cleared of potentially-
                                 infectious airborne particles.” [4]. The American Society of Heating, Refrigerating and Air-
                                 Conditioning Engineers (ASHRAE) also provides some guidance on using portable air
                                 purifiers in confined spaces where ventilation is poor or where it is hard to keep social
                                 distancing, such as fitness centers, small public spaces, employee break rooms, or em-
                                 ployee locker rooms [5]. Meanwhile, the U.S. Environmental Protection Agency (EPA)
                                 says “Consider using portable air cleaners to supplement increased Heating, ventilation,
                                 and air conditioning (HVAC) system ventilation and filtration, especially in areas where
                                 adequate ventilation is difficult to achieve. Directing the airflow so that it does not blow
                                 directly from one person to another reduces the potential spread of droplets that may
                                 contain infectious viruses” [6]. Furthermore, a few researchers have explored the use of
                                 air purifiers in specific rooms to reduce infection risks. For instance, Zhao et al. [7] studied
                                 and suggested the application of an air purifier as a supplementary protective measure in
                                 dental clinics during the COVID-19 pandemic. To improve indoor domestic environments
                                 in future pandemics, urgent action should be taken around indoor air quality (IAQ) to
                                 protect residents from respiratory ailments [8].
                                       Air purifiers remove small particles/droplets that may carry viruses, whose efficiency
                                 is rated by the infiltration material. HEPA filters can theoretically remove at least 99.97%
                                 of dust, pollen, mold, bacteria, and any airborne particles with a size of 0.3 microns (µm).
                                 The diameter of 0.3 microns represents the worst case; particles of larger or smaller sizes
                                 are trapped with even higher efficiency. A pilot experiment showed that the flow of water
                                 mist into an air purifier inlet depended on the height of the source [9]. Proper design of
                                 air purifier installation (i.e., number, capacity, and location of units) is crucial to effectively
                                 remove airborne particles in spaces, particularly challenging in large public spaces. The
                                 actual performance of air purifiers can be affected by many factors, including indoor fur-
                                 niture and occupant layouts, existing mechanical system arrangements, and space open-
                                 ings such as doors, windows, connections, and leakages. This study explores the place-
                                 ment of two types of air purifiers (i.e., floor-standing air purifier (FAP) and table air puri-
                                 fier (TAP)) in two typical large public places (i.e., restaurant and ballroom) via both com-
                                 putational simulation and a field experiment to evaluate the performance of purifiers in
                                 mitigating the dispersion of particles/droplets released from the human mouth while
                                 breathing, talking or coughing.

                                 2. Methodologies
                                       The actual performance of air purifiers can be determined through either a physical
                                 test or a validated numerical experiment. While providing first-hand data, a physical test
                                 in a real space is often challenging, due to many uncontrollable variables, especially for
                                 pollutant/virus-related studies. A validated numerical experiment using computational
                                 flow dynamics (CFD) techniques provides a great alternative and is applied widely in the
                                 field. This study simulated the airflow pattern and contaminant transport in the spaces
                                 using a steady-state RANS (the Reynolds-Averaged Navier–Stokes equations) method.
                                 The RNG k-ε turbulence model in the commercial CFD code ANSYS Fluent 19.2 [10,11]
                                 was used to represent turbulence characteristics. The particle simulation assumed mono-
                                 dispersed non-interacting spherical particles. The momentum transfer from the particles
                                 to the air turbulence has a negligible impact on the flow [12–14].
Buildings 2021, 11, x FOR PEER REVIEW                                                                                        3 of 14

                                     Equations (1) and (2) describe the governing equations of the fluid phase [12]. The
                                 buoyancy effect of air is modeled with the Boussinesq approximation.
                                                                                 ∂
                                                                                    ( vi ) = 0                                   (1)
                                                                                ∂xi

                                                            ∂               ∂p    ∂       ∂v ∂v
                                                       ρ
                                                           ∂xi
                                                               ( vi v j ) =
                                                                          −     +
                                                                            ∂x j ∂xi
                                                                                     [ µ ( i + j ) − ρ vi 'v j ' )
                                                                                          ∂x j ∂xi
                                                                                                                                 (2)

                                 where vj is the velocity component in three perpendicular coordinate directions (xj, j = 1,
                                 2, 3), m/s; ρ is the air density, kg/m3; p is the air pressure, Pa; μ is the kinematic viscosity
                                 coefficient of air; vi’vj’ is the Reynolds stress tensor.
                                       When tracking the virus-carrying particles (in solid phase), the effect of the air drag
                                 force, gravity, and buoyancy were taken into account. The discrete particle model in Flu-
                                 ent (CFD-DPM) was used to track the individual particles [13]. The flow-governing equa-
                                 tions of the solid phase single particle are described by Equations (3)–(6) [14]:
                                                                         →         →                        →
                                                                              FD + m p ( ρ p − ρ ) g ρ p
                                                              m p dv p v p dt =                                                  (3)

                                                                                        →       →   →   →
                                                                             π d p2CD ( v − v p ) v − v p
                                                                     →                                                           (4)
                                                                    FD =
                                                                                            8
                                                                     CD = a1 Re p + a2 Re 2p + a3                                (5)

                                                                         Re
                                                                          = p ρ v − v p Dp µ                                     (6)
                                          →
                                 where FD is the air drag force acting on the particle, N, the second term on the right side
                                                                                                                               →
                                 of Equation (3), represents gravity and buoyancy; mp is the mass of the particle, kg; v p is
                                 the velocity vector of the particle, m/s; ρp is the particle density, kg/m3; v is the air velocity,
                                 m/s; vp is the particle velocity, m/s; Dp is the particle diameter, m; μ is dynamic viscosity,
                                 N s/m2; a1, a2, and a3 are coefficients determined by Rep.

                                 3. Validation of the CFD Model
                                       Exhaled air of an infected person is the primary source of contagious viruses. Exhaled
                                 air comes from various respiratory-related activities, such as breathing, coughing, singing,
                                 and talking. Accurate information on the release and diffusion process of exhaled airflow
                                 and particles is, thus, critical for the precise prediction of infectious disease transmission.
                                 This study focused on the talking scenario—the main concern during the dining and ball-
                                 room events when facial masks cannot be used. Studies showed that talking may release
                                 2600 droplets per second at a speed of 1–5 m/s [15]. The range of the total airflow rate from
                                 a mouth when speaking is about 284–759 cm3/s [16]. Using an average of 500 cm3/s and
                                 assuming a mouth opening area at 1.8 cm2 [16] leads to an average talking airflow speed
                                 of 2.77 m/s, which meets the particle image velocimetry (PIV) test result at the order of 3.1
                                 m/s [17].
                                       This study first conducted a test, via both physical experiment and CFD simulation,
                                 in the calm lab environment using a single table case with four occupants, including one
                                 infected person (Manikin 1) who intermittently talks, as shown in Figures 1 and 2. Table
                                 1 lists the test case geometries. The thermal manikins of 70 Watt each have an average
                                 head/face temperature of 27 °C and an average body (with clothes) temperature of 22 °C.
                                 The space has no active air conditioning system, and the ambient room air, wall, ceiling,
                                 floor, and table surface temperatures are kept at 19 °C.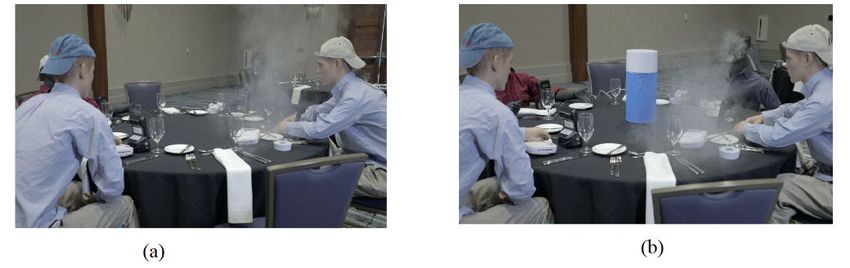
Buildings 2021, 11, x FOR PEER REVIEW                                                                                             4 of 14

                                      The mock-up physical experiment simulated the virus pollutant emitted from the
                                 mouth (with an inner size of 1.37 cm) of Manikin 1 by using stage fog (water-glycerin-
                                 mixture) as the tracer gas. The exit velocity of the fog from the mouth was controlled at
                                 around 2.77 m/s, representing a scenario where people are talking loudly. The supply time
                                 of the fog from the mouth is 20–25 s in the experiment and each test runs 2–5 min. A
                                 commercially available portable air purifier with a clean air delivery rate (CADR) of 166
                                 m3/h was tested for the performance, with the most effective placement location as shown
                                 in Figures 1 and 2. The sizes of the portable air purifier are listed in Table 1.

                                 Figure 1. Lab experiment of the single table case: (a) without air purifiers; (b) with air purifiers.

                          Figure 2. CFD model of the single table case: (a) axonometric view; (b) top view

                                 Table 1. Geometries of the single table case.

                                                      Variable                                                Value
                                                    Table height                                              0.76 m
                                                    Table length                                              2.13 m
                                                    Table width                                               0.91 m
                                    Distance between centers of manikin 1 and 4                                1.3 m
                                    Distance between centers of manikin 1 and 2                                1.1 m
                                              Floor to manikin mouth                                           1.1 m
                                               Floor to manikin head                                           1.3 m
                                                 Air purifier height                                          0.25 m
                                               Air purifier diameter                                          0.15 m
                                                   Ceiling height                                              3.1 m

                                      Figure 2 illustrates the created CFD model for the single table case. The virus particle
                                 details simulated in CFD are presented in Table 2. The number of the particles released
                                 from the mouth was assumed as 5000 to ensure that the deviation of the particle statistical
                                 results is less than 1% [18]. Particles larger than 10 micron tend to drop quickly, while
                                 smaller particles tend to flow with air. The mean particle size during talking was 3 micron,
                                 which was thus used in the CFD model [19].
Buildings 2021, 11, x FOR PEER REVIEW                                                                                   5 of 14

                                 Table 2. Particle release conditions [16,20].

                                                       Variable                                          Value
                                           Open area of the talking mouth                                1.8 cm2
                                         Airflow rate from the talking mouth                           500 cm3/s
                                            Average talking airflow speed                               2.77 m/s
                                   Temperature of the airflow from the talking mouth                      27 °C
                                       Aerodynamic diameter of the particles                              3 μm
                                               Density of the particles                                600 kg/m3
                                     Number of particles released from the talking
                                                                                                          5000
                                                         mouth

                                      The CFD simulation first performed the grid sensitivity analysis to ensure the inde-
                                 pendence of the numerical results. Three numerical grids, 410,000, 770,000, and 1,000,000,
                                 were tested and compared using the normalized root mean square error (NRMSE) of the
                                 velocity at the pole shown in Figure 2 (30 points). The NRMSE of the velocity at the pole,
                                 respectively, between 410K and 1000K grids and between 770K and 1000K grids, are cal-
                                 culated as shown in Figure 3a. There is generally a great improvement in the error with
                                 the 770K grid, and the computational uncertainty is overall below 15%. By balancing the
                                 computational accuracy and cost, the 770,000 grid was, thus, chosen for the simulation.
                                 Among the 770,000 cells, fine grids were allocated around the mouths of the occupants, as
                                 shown in Figure 3b.

                                 Figure 3. (a) NRMSE comparison between 410K/1000K grids and 770K/1000K grids; (b) Grid refine-
                                 ment with a 770K grid.

                                      The mock-up experiment exhibits clearly, in Figure 1, that the fog exhaled from Man-
                                 ikin 1 can easily arrive at the face of Manikin 4, who is right across the table, and Manikin
                                 3, who is diagonally across the table, when no air purifiers are used. When air purifiers
                                 were used, most of the fog exhaled from Manikin 1 was attracted towards the air purifiers,
                                 effectively containing the turbulent spread of the contaminant.
                                      The similar dispersion processes of the particles were observed in the CFD simula-
                                 tion with and without air purifiers, as shown in Figure 4. Both mock-up test and CFD
                                 modeling indicate that the particle concentration at Manikin 4 (across the table from the
                                 source person) is less than those near Manikins 2 and 3, confirming the effectiveness of
                                 the air purifier placed between Manikin 1 and 4. Most of the particles can be directly re-
                                 moved by the purifier or blown away by the upward air from the top exit of the purifier.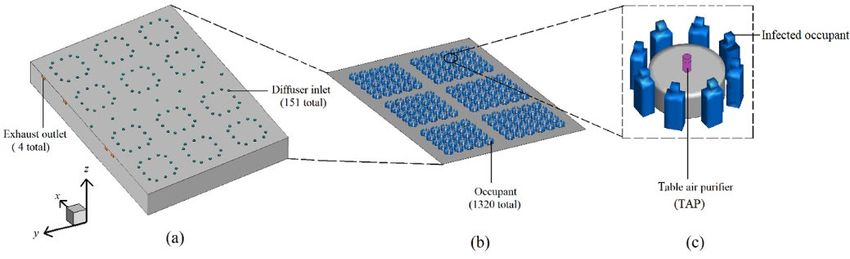
Buildings 2021, 11, x FOR PEER REVIEW                                                                                                        6 of 14

                                 Figure 4. Dispersion of virus particles predicted by CFD: (a) without air purifier; (b) with air puri-
                                 fiers.

                                      The comparison between simulation and experiment is quantitatively analyzed by
                                 calculating the reduction rate of the particle numbers (Mreduction) detected at the three loca-
                                 tions of the sensors (Figure 1). Mreduction can be defined as follows:

                                                                                  M without air purifier,i − M with air purifier,i
                                                              M reduction,i =                                                        ×100%      (7)
                                                                                              M without air purifier,i
                                 where Mwithout air purifier, i is the number of particles sensed at the ith point (i = 1, 2, 3) for the
                                 case without air purifiers and Mwith air purifier, i is the number of particles sensed at the ith
                                 points (i = 1, 2, 3) for the case with air purifiers. Figure 5 compares the results obtained
                                 from the simulation and test.

                                            100
                                                      Measured reduction for small particles (PM2.5)
                                                      Simulated reduction of this study
                                                 60
                                                 40
                                                 20
                                                 0
                                                      Point 1                     Point 2                     Point 3
                                 Figure 5. Comparison of simulated and measured reduction rate of particle numbers.

                                      Both the qualitative and quantitative comparisons between the mock-up experiment
                                 and the CFD simulation verify that the simulation model can project reasonable results to
                                 track the virus-carrying particles’ trajectories. Therefore, a sophisticated CFD model that
                                 is made of many similar tables and occupants should be able to predict the transportation
                                 of the virus-carrying particles in a complex large built environment.

                                 4. CFD Simulation and Analysis of Large Public Spaces
                                      This study used the validated CFD model to simulate a restaurant and a ballroom as
                                 two representative public places to evaluate the effect of using portable air purifiers to
                                 mitigate COVID-19 in large spaces. Steady-state air circulation conditions were simulated
                                 to determine the best location, air exchange rate requirement, and quantity of air purifiers.
                                 The restaurant and the ballroom are conditioned with a central HVAC system, which sup-
                                 plies clean air from the ceiling inlets and exhausts room air from the ceiling/upper-level
                                 outlets. To assess the actual performance of the commercial purifier on mitigating COVID-
                                 19, virus-carrying particles released from one infected occupant in the restaurant and the
                                 ballroom were simulated and tracked, using the same settings as used in the validation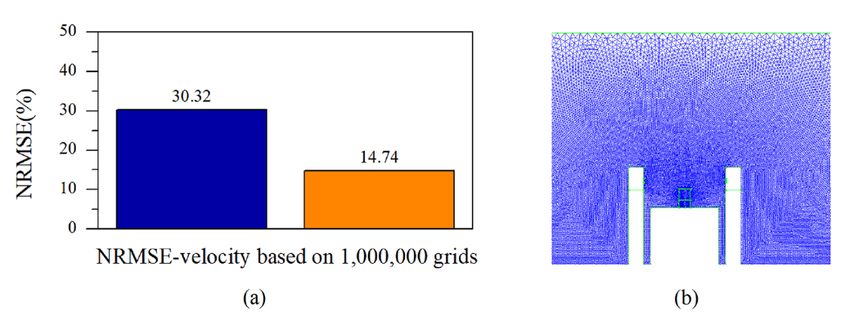
Buildings 2021, 11, x FOR PEER REVIEW                                                                                      7 of 14

                                 model. A grid sensitivity analysis was also performed to ensure the accuracy of the nu-
                                 merical results. The suitable total grid cells were determined to be about 650,000 and
                                 4,470,000 for the restaurant and the ballroom, respectively.

                                 4.1. Restaurant Case
                                 4.1.1. Case Description
                                      A CFD model (shown in Figure 6) of a restaurant (total space area 370 m2) was built
                                 in ICEMCFD (Integrated Computer Engineering and Manufacturing code for CFD). The
                                 specifications of the restaurant are summarized in Table 3.

     Figure 6. Computer model and components of the restaurant: (a) the placement of exhaust outlets and diffuser inlets; (b)
                           the locations of all occupants; (c) the location of the infected occupant

                                 Table 3. Restaurant specifications.

                                             Object                         Dimensions              Boundary Conditions
                                          Diffuser inlet                   1.22 × 0.30 m2               Tin = 17.6 °C
                                              Table                     0.87 × 0.87 × 0.75 m3            Adiabatic
                                          Exhaust outlet                   0.61 × 0.61 m2               Tex = 20 °C
                                           Diner body                    0.3 × 0.43 ×1.3 m3                 27 °C
                                              light                                                     10.7 W/m2
                                         Air change rate                                                 5 times/h
                                        Supply air velocity                                             0.3429 m/s

                                      To evaluate the effectiveness of air purifiers on reducing the potential infection risk
                                 to the healthy occupants, floor-standing air purifier (FAP), and table air purifier (TAP)
                                 were arranged in the restaurant. As listed in Table 4, two kinds of commercial purifiers
                                 [21,22] were employed to purify indoor air. Indoor air flows into the purifier from the side
                                 of the purifier and then flows out from the top of the purifier. Eight FAPs are placed at
                                 both ends of the restaurant (Figure 6). The restaurant was operated at full capacity, with
                                 177 occupants, in which one was the virus-carrier, as shown in Figure 6c. One TAP was
                                 placed at the center of the dining table occupied by the infected occupant.

                                 Table 4. Purifier specifications.

                                                      Floor-Standing Air Purifiers (FAP)          Table Air Purifier (TAP)
                                   Dimensions                 0.56 × 0.33 × 0.61 m3                  0.2 × 0.2 × 0.42 m3
                                     Inlet size                      0.13 m2                               0.19 m2
                                    Outlet size                      0.05 m2                               0.03 m2
                                  Clean air deliv-
                                                                       554.4 m3/h                         197.7 m3/h
                                      ery rate
Buildings 2021, 11, x FOR PEER REVIEW                                                                                         8 of 14

                                      Particle release conditions were the same as those in the validation case (Table 2).
                                 Particle trajectories were investigated, respectively, under three ventilation conditions: (1)
                                 central air-conditioning system (CA); (2) central air-conditioning system with floor-stand-
                                 ing air purifiers (CAF); and (3) central air-conditioning system with both floor-standing
                                 air purifiers and table air purifier (CAFT), to analyze the fate of the particles exhaled from
                                 the infected occupant.

                                 4.1.2. Flow Field and Particle Trajectory Analysis
                                      The movement of airflow is deterministic to the particle trajectory. Under the three
                                 ventilation conditions (i.e., CA, CAF, and CAFT), the velocity vector of airflow near the
                                 infected occupant (Figure 6c) at the height of the breathing zone (Z = 1.1 m) is shown in
                                 Figure 7. Installing portable air purifiers changes the local flow directions and mitigates
                                 the cross-table airflow that may cause cross-infection. The table unit, with proper capacity,
                                 displays explicit and favorable air inflow towards the purifier. The dispersion processes
                                 of the particles under the three flow fields are shown in Figure 8. The flow paths of the
                                 viral particles exhaled from the infected occupant are different for the three ventilation
                                 conditions. The particles under the CA system can easily arrive at the breathing zone of
                                 the opposite occupant. For the CAF system, the particles move up first and are then
                                 sucked by the floor-standing air purifier placed at the back, which purifies the air with the
                                 particles. The CAFT system presents a better purification performance, because most of
                                 the particles are directly sucked into the table purifier as well as pushed upwards due to
                                 the strong upward outflow from the top air exit of the unit.

                                 Figure 7. The velocity vector of airflow near the infected occupant under different ventilation con-
                                 ditions (Z = 1.1 m).

     Figure 8. The dispersion processes of virus-carrying particles under three ventilation conditions: (a) CA; (b) CAF; (c)
     CAFT.

                                 4.1.3. Fate Analysis of the Virus-Carrying Particles Exhaled from the Infected Occupant
                                      Figure 9 compares quantitively the percentage of particles that are, respectively, dis-
                                 charged from the central exhausts, purified by the purifiers, and deposited on different
                                 surfaces under different ventilation conditions. Particles released from the mouth of the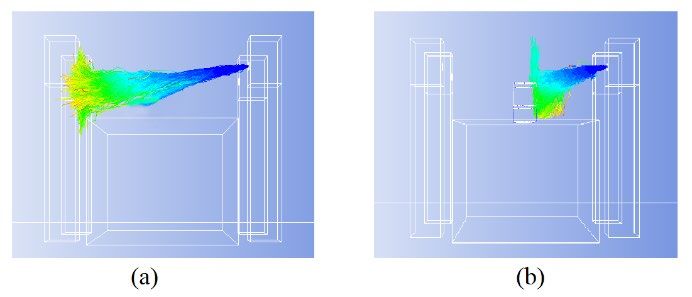
Buildings 2021, 11, x FOR PEER REVIEW                                                                                                     9 of 14

                                 infector are convenient to spread in the horizontal direction under the central air-condi-
                                 tioning system (CA), especially at the height of the breathing zone. A small fraction of the
                                 particles is discharged through the exhaust outlets under CA. Most of them are spread
                                 out in the indoor space and then deposited on the diners (33%), the table (25%), the ground
                                 (25%), and the walls (11%). The floor-standing purifiers (FAP) can purifier 28% of the par-
                                 ticles while increasing the particle deposition on the walls (48%) due to the redirected air
                                 inflow and outflow around the purifiers. The particle concentration at the height of the
                                 breathing zone under the CAFP system is smaller than that under the CA system. With
                                 the CAFP system, most of the viral particles are purified by the table air purifier (TAP)—
                                 about 76% of particles can be purified by TAP, a remarkable performance in purifying
                                 particles.

     Figure 9. Particle distribution statistics for CA, CAF, and CAFT, respectively: (a) percentage of particles discharged from
     the exhaust outlets and purified by the purifiers; (b) percentage of particles deposited on different surfaces.

                                        To assess the quantitative performance of air purifiers on reducing infection risks,
                                 the reduction rate of the number of particles deposited on the surrounding occupants (Nre-
                                 duction) is calculated by comparing the cases with and without air purifiers. Nreduction is de-

                                 fined as in Equation (8):

                                                                         N without air purifiers − N with air purifiers
                                                         N reduction =                                                    ×100%              (8)
                                                                                    N without air purifiers
                                 where Nwithout air purifiers is the number of particles deposited on the occupants for the case
                                 without air purifiers, Nwith air purifiers is the number of particles deposited on the occupants
                                 for the case with air purifiers. Using Equation (8) and the data in Figure 9, Nreduction is ob-
                                 tained for the CAF and CAFT cases, respectively, compared to the CA case, as seen in
                                 Table 5. Nreduction of CAFT is greater than that of CAF, which verifies that the table air pu-
                                 rifier (TAP) has a superior performance in mitigating the infection risk. The optimal loca-
                                 tion of the air purifier will be in proximity where people are seated, congregated or in a
                                 queue. The study of Mousavi et al. [23] indicated that the best location of a single portable
                                 air purifier unit is inside the isolation room and near the patient’s bed. The result of this
                                 study is, thus, consistent with the suggestion in the literature [23].

                                 Table 5. Nreduction for CAF and CAFT as compared to CA.

                                                                                         CAF                                      CAFT
                                            Nreduction                                  87.4%                                     94.7%

                                 4.2. Ballroom Case
                                 4.2.1. Case Description
                                      Section 4.1 concludes that the table air purifier (TAP) provides an effective means to
                                 help mitigate airborne transmission of pathogens in the restaurant. TAP was further in-
                                 vestigated to evaluate its application for one larger event (i.e., ballroom). The CFD model
                                 of the ballroom (total space area 3200 m2) built in ICEMCFD is shown in Figure 10 and the
Buildings 2021, 11, x FOR PEER REVIEW                                                                                 10 of 14

                                 specifications of the ballroom are summarized in Table 6. The ballroom is full of diners
                                 (1320 total), with one of them infected (Figure 10). One TAP is placed at the center of the
                                 dining table occupied by the infected person. Purifier specifications and particle release
                                 conditions, respectively, are shown in Tables 4 and 2. Particle trajectories were investi-
                                 gated, respectively, under two ventilation conditions: (1) central air-conditioning system
                                 (CA-Ballroom) and (2) central air-conditioning system with table air purifier (CAT), to
                                 analyze the fate of the viral particles exhaled from the infected occupant in the ballroom.

      Figure 10. Computer model and components of the ballroom:(a) the placement of exhaust outlets and diffuser inlets;
                           (b) the locations of all occupants; (c) the location of the infected occupant

                                 Table 6. Ballroom specifications.

                                                 Object                 Dimensions               Boundary Conditions
                                        Inlet diffuser diameter              0.8 m                   Tin = 17.6 °C
                                            Table diameter                  1.82 m                    Adiabatic
                                            Exhaust outlet              1.58 × 1.1 m2                Tex = 20 °C
                                              Diner body              0.3 × 0.43 ×1.3 m3                 27 °C
                                                  Light                                              10.7 W/m2
                                            Air change rate                                           5 times/h
                                          Supply air velocity                                        0.4672 m/s

                                 4.2.2. Flow Field and Particle Trajectory Analysis
                                      The velocity vector of airflow at the height of the breathing zone (Z = 1.1 m) at the
                                 table with the infector is shown in Figure 11, respectively, for the cases under two venti-
                                 lation conditions (i.e., CA-Ballroom and CAT). The table air purifier changes the local flow
                                 directions, displaying explicit and favorable air inflow towards the purifier. The disper-
                                 sion processes of virus particles under the two flow fields are shown in Figure 12. The
                                 spread range of the viral particles for the CA-Ballroom system is much larger than that for
                                 the CAT system, even reaching the neighboring tables. These particles, however, are con-
                                 fined around the purifier with the CAT system due to the negative pressure effect, which
                                 avoids the viruses’ large-scale spread. Although the particles are not fully attracted by the
                                 table purifier, the dispersion of the virus at the horizontal plane has been reduced signif-
                                 icantly by using TAP.
Buildings 2021, 11, x FOR PEER REVIEW 11 of 14
Figure 11. The velocity vector of airflow at the height of the breathing zone (Z = 1.1 m) at the table
with the infector under two ventilation conditions.
Figure 12. The dispersion processes of viral particles under two ventilation conditions: (a) CA-Ball-
room; (b) CAT.
4.2.3. Fate Analysis of the Virus-Carrying Exhaled from the Infected Occupant
Figure 13 compares the percentage of the particles that are, respectively, exhausted
from the central air outlets, purified by the purifier, and deposited on different surfaces
under the two ventilation conditions. Although only 12% of particles were purified by the
TAP, which is attributed to the longer distance between the unit and the infector (the
larger diameter of the dining table) compared to the restaurant case, the TAP helps reduce
the deposition of particles on the occupants (potential cross-infection risk) from 29% to
11%. More particles were pushed up towards the ceiling (49%) due to the upward exit
flow of the TAP, rather than distributing horizontally, which is a potential cause of cross-
infection.
We obtained 60.3% of Nreduction for the CAT compared to CA-Ballroom using Equation
(8) and the data in Figure 13. While this number is lower than that in the restaurant, it is
still promising, especially considering the small size and capacity of the purifier. The ar-
rangement of a table air purifier can be as effective as more elaborate solutions installed
in the HVAC system at a lower cost. Flexible solutions, such as portable air purifiers, can
be redeployed throughout the property as needed.Buildings 2021, 11, x FOR PEER REVIEW 12 of 14
Figure 13. Particle distribution statistics for CA-Ballroom and CAT: (a) percentage of particles discharged from the exhaust
outlets and purified by the purifier; (b) percentage of particles deposited on different surfaces.
5. Field Experiment and Analysis of Large Public Spaces
CFD simulation indicates that the installation of portable air purifiers can be an ef-
fective measure to reduce the infection risks of aerosol transmission in large public spaces.
To verify the actual performance of the purifiers in the real operation conditions, this
study further conducted the field experiment in two large public spaces (restaurant and
ballroom). A commercial purifier (Blueair-411PACF105372) of 197.7 m3/h was installed
and tested in the experiment. Stage fog (water-glycerin-mixture) was used as a tracer gas
released from the mouth of the infector. The distribution of the fog was recorded as shown
in Figure 14, under the central air-conditioning system with and without a purifier. Most
of the fog exhaled from the infector was sucked into the table air purifier, and the distrib-
uted area of the fog with the table purifier is much more confined than that without the
purifier, similar to what was found in CFD simulation.
Similar performance was observed for the test in the ballroom (Figure 15). Although
most of the released fog was not directly sucked in by the table purifier, the spread of the
fog to the surrounding area was slowed down due to the table purifier. It appears that the
negative pressure area around the table purifier cannot completely cover the infected oc-
cupant when the unit is placed at the center of a large table. A more powerful table purifier
will be required to provide a better performance.
Figure 14. The dispersion processes of stage fog (a) without and (b) with purifier in a restaurant.
Figure 15. The dispersion processes of stage fog (a) without and (b) with purifier in a ballroom.Buildings 2021, 11, x FOR PEER REVIEW 13 of 14
6. Conclusions
COVID-19 is a test like no others. Never before have the lives of so many people
around the world been affected at this scale or speed. In this study, the air purifier, as a
facility recommended by organizations such as the US CDC and ASHRAE, was investi-
gated for its actual performance in reducing the infection risks of the virus. The installa-
tion of air purifiers in two typical public places (i.e., restaurant and the ballroom) was
studied, as compared to the use of the existing central air-conditioning systems. Validated
CFD models were created and applied to explore the qualitative and quantitative perfor-
mance of the portable air purifiers, which was further verified by a qualitative field ex-
periment in the actual restaurant and ballroom.
The research outcomes reveal that the central air condition system only exhausts a
small fraction of the particles released from the mouth of the infector, and most of the
particles are spread out indoors and ultimately deposited on occupants, tables, equip-
ment, ground, and walls. Both floor-standing and table air purifiers, with proper locations
and capacities, can effectively attract room air to flow towards the purifiers and, therefore,
clean the “contaminated” air. Similar behavior and performance were observed in the ac-
tual restaurant and the ballroom, while the results indicate that each space is unique in
geometry, layout, and system and, thus, needs to be addressed individually. Flexible so-
lution allows the redeployments of the cleaning devices throughout the property as
needed. Portable air purifiers with HEPA filtration provide an effective means to help
mitigate the airborne transmission of pathogens, which can be as effective as more elabo-
rate solutions installed in the HVAC systems at a lower cost.
Author Contributions: Conceptualization, Zhiqiang (John) Zhai, Robert Bahl and Keith Trace; Data
curation, He Li; Formal analysis, Zhiqiang (John) Zhai, He Li, Robert Bahl and Keith Trace; Funding
acquisition, Zhiqiang (John) Zhai, Robert Bahl and Keith Trace; Investigation, Zhiqiang (John) Zhai,
He Li, Robert Bahl and Keith Trace; Methodology, Zhiqiang (John) Zhai, He Li and Robert Bahl;
Project administration, Zhiqiang (John) Zhai, Robert Bahl and Keith Trace; Resources, Zhiqiang
(John) Zhai, Robert Bahl and Keith Trace; Software, He Li; Supervision, Zhiqiang (John) Zhai and
Robert Bahl; Validation, Zhiqiang (John) Zhai and He Li; Visualization, He Li; Writing – original
draft, Zhiqiang (John) Zhai and He Li; Writing – review & editing, Zhiqiang (John) Zhai.
Funding: This work was supported by Marriott International, Inc.
Institutional Review Board Statement: Not applicable
Informed Consent Statement: Not applicable Data Availability Statement: Not applicable
Conflicts of Interest: The authors declare no conflict of interest.
References
1. Klompas, M.; Baker, M.A.; Rhee, C. Airborne Transmission of SARS-CoV-2: Theoretical Considerations and Available Evidence.
JAMA 2020, 324, 441–442.
2. Fabisiak, B.; Jankowska, A.; Kłos, R. Attitudes of Polish seniors toward the use of public space during the first wave of the
COVID-19 pandemic. Int. J. Environ. Res. Public Health 2020, 17, 8885.
3. Honey-Rosés, J.; Anguelovski, I.; Chireh, V.K.; Daher, C.; Konijnendijk van den Bosch, C.; Litt, J.S.; Mawani, V.; McCall, M.K.;
Orellana, A.; Oscilowicz, E.; et al. The impact of COVID-19 on public space: An early review of the emerging questions—design,
perceptions and inequities. Cities Health 2020, 1–17, doi:10.1080/23748834.2020.1780074.
4. CDC. Ventilation in Buildings: https://www.cdc.gov/coronavirus/2019-ncov/community/ventilation.html (accessed on 27 July
2021).
5. ASHRAE. ASHRAE Position Document on Filtration and Air Cleaning; 2021.
6. EPA. Air Cleaners, HVAC Filters, and Coronavirus (COVID-19): https://www.epa.gov/coronavirus/air-cleaners-hvac-filters-
and-coronavirus-covid-19 (accessed on 17 March 2021).
7. Zhao, B.; An, N.; Chen, C. Using an air purifier as a supplementary protective measure in dental clinics during the coronavirus
disease 2019 (COVID-19) pandemic. Infect. Control Hosp. Epidemiol. 2020, 42, 493.
8. Domínguez-Amarillo, S.; Fernández-Agüera, J.; Cesteros-García, S.; González-Lezcano, R.A. Bad air can also kill: Residential
indoor air quality and pollutant exposure risk during the covid-19 crisis. Int. J. Environ. Res. Public Health 2020, 17, 7183.
9. Ham, S. Prevention of exposure to and spread of COVID-19 using air purifiers: Challenges and concerns. Epidemiol. Health
Korean Soc. Epidemiol. 2020, 42, e2020027.Buildings 2021, 11, x FOR PEER REVIEW 14 of 14
10. Zhang, Z.; Zhang, W.; Zhai, Z.J.; Chen, Q.Y. Evaluation of Various Turbulence Models in Predicting Airflow and Turbulence in
Enclosed Environments by CFD : Part 2—Comparison with Experimental Data from Literature. HVAC&R Res. 2007, 13, 871–
886.
11. Chen, Q.; Zhai, Z. The use of CFD tools for indoor environmental design. In Advanced Building Simulation; Spon Press: New
York, NY, USA, 2004; pp. 119–140.
12. Chen, X.; Zhong, W.; Sun, B.; Jin, B.; Zhou, X. Study on gas/solid flow in an obstructed pulmonary airway with transient flow
based on CFD-DPM approach. Powder Technol. 2012, 217, 252–260.
13. Holmberg, S. Modelling of the indoor environment—Particle dispersion and deposition. Indoor Air 1998, 8, 113–122.
14. Li, H.; Zhong, K.; Zhai, Z. Investigating the influences of ventilation on the fate of particles generated by patient and medical
staff in operating room. Build. Environ. 2020, 180, 107038.
15. Asadi, S.; Wexler, A.S.; Cappa, C.D.; Barreda, S.; Bouvier, N.M.; Ristenpart, W.D. Aerosol emission and superemission during
human speech increase with voice loudness. Sci. Rep. 2019, 9, 2348.
16. Gupta, J.K.; Lin, C.; Chen, Q. Characterizing exhaled airflow from breathing and talking. Indoor Air 2010, 20, 31–39.
17. Chao, C.Y.; Wan, M.P.; Morawska, L.; Johnson, G.R.; Ristovski, Z.D.; Hargreaves, M.; Mengersen, K.; Corbett, S.; Li, Y.; Xie, X.;
et al. Characterization of Expiration Air Jets and Droplet Size Distributions Immediately at the Mouth Opening. J. Aerosol. Sci.
2009, 40, 122–133.
18. Fang, T.; Wang, S.; Zhang, T. Modeling Particle Filtration Performance of A Breathing Wall. J. Liaoning Univ. Sci. Ed. 2013, 40,
125–131.
19. Sun, C.; Zhai, Z. The Efficacy of Social Distance and Ventilation Effectiveness in Preventing COVID-19 Transmission. Sustain.
Cities Soc. 2020, 62, 102390.
20. Li, H.; Zhong, K.; Zhai, Z. Potential risk analysis of medical staff when performing endotracheal intubation in negative pressure
isolation ward. Indoor Built Environ. 2021, doi:10.1177/1420326X20979015.
21. Honeywell True HEPA Bluetooth Smart Air Purifier With Allergen Remover, HPA8350B: https://www.honeywell-
store.com/store/products/honeywell-hepa-bluetooth-smart-air-purifier-hpa8350b.htm (accessed on 1 March 2021).
22. Blueair Blue Pure 411+ Air Purifier for Home: https://www.amazon.com/Blueair-Purifier-Washable-Pre-Filter-Aller-
gens/dp/B085B4V3DN/ref=sr_1_12?dchild=1&keywords=portable+purifier&qid=1602947139&s=home-garden&sr=1-12 (ac-
cessed on 1 March 2021).
23. Mousavi, E.S.; Pollitt, K.J.; Sherman, J.; Martinello, R.A. Performance analysis of portable HEPA filters and temporary plastic
anterooms on the spread of surrogate coronavirus. Build. Environ. 2020, 183, 107186.You can also read