ARIZONA DEPARTMENT OF WATER RESOURCES - 2021 Prescott AMA Groundwater Flow Model Update - June 2021
←
→
Page content transcription
If your browser does not render page correctly, please read the page content below

ARIZONA DEPARTMENT OF WATER RESOURCES
      2021 Prescott AMA Groundwater Flow Model Update

                         June 2021
Acknowledgments
Arizona Department of Water Resources staff contributing to this report include John Mawarura, Keith
Nelson, Olga Hart, Dianne Yunker and Jeff Inwood. For insightful discussions about the area
hydrology, the authors would like to thank Bill Remick, Don Pool, Frank Corkhill, Justin Clark, Abe
Springer and Doug McMillan.

Cover photo – View of Del Rio Springs (facing east), circa 2000. Photo courtesy of Jim Holt.

Table of Contents
Executive Summary ........................................................................................................................ 1
1. Introduction ................................................................................................................................. 3
   1.1. Objective and Scope ............................................................................................................. 3
   1.2. Background and Previous Work .......................................................................................... 4
2. 2021 Model Update..................................................................................................................... 5
   2.1. Simulated Pumping .............................................................................................................. 5
   2.2. Simulated Recharge.............................................................................................................. 6
   2.3. Northern Boundary ............................................................................................................... 6
   2.4. Southern Boundary............................................................................................................... 6
   2.5. Santa Fe Well Field .............................................................................................................. 7
   2.6. Williamson Valley................................................................................................................ 8
3. Model Calibration ....................................................................................................................... 8
4. Calibrated Model Results............................................................................................................ 9
   4.1. Summary of Simulated Heads .............................................................................................. 9
   4.2. Simulated and Observed Heads at Select Locations .......................................................... 10
      4.2.1.        Little Chino Sub-basin, North ................................................................................. 11
      4.2.2.        Little Chino Sub-basin, South ................................................................................. 13
      4.2.3.        Upper Agua Fria Sub-basin, North (Santa Fe Well Field)...................................... 14
      4.2.4.        Central UAF Sub-basin: Pumping declines and Induced Recharge ....................... 15
      4.2.5.        Williamson Valley Area (BIC / LIC Sub-basin divide).......................................... 16
   4.3. Simulated Flow .................................................................................................................. 17
   4.4. Simulated Water Budgets ................................................................................................... 21
5. Summary and Conclusions ....................................................................................................... 22
5.1. Core System Features ............................................................................................................ 22
5.2. Conclusions ............................................................................................................................ 24
References ..................................................................................................................................... 26
Appendix A: Inverse Model Statistics ........................................................................................ A-1
Appendix B: Miscellaneous Simulated Water Budget Information ........................................... B-1
Appendix C: The Northern and Southern Model Boundaries .................................................... C-1
Appendix D: Alternative Conceptual Model Testing ................................................................. D-1
Appendix E: Simulated Head Distribution for Selected Local Areas..........................................E-1
Appendix F: Distribution of Hydraulic Conductivity ....................................................................... F-1
                                                                         i               Prescott AMA Groundwater Flow Model Update
                                                                                                                              2021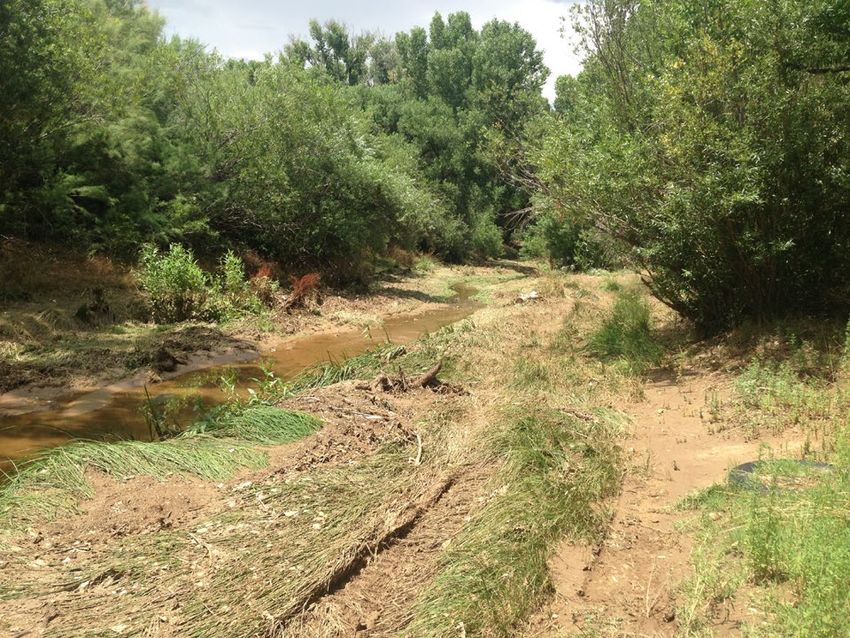
Acronyms and Abbreviations
Acronym   Description
ACM       Alternative conceptual model
ADWR      Arizona Department of Water Resources
AF        Acre-feet
AF/yr     Acre-feet per year
AMA       Active Management Area
BIC       Big Chino
cfs       Cubic feet per second
CI        Confidence interval
CSS       Composite-scaled sensitivity
CVID      Chino Valley Irrigation District
EVT       Evapotranspiration
ft        Feet
GHB       General head boundaries
GWSI      Groundwater Site Inventory
HOB       Head observation
Kx        Horizontal hydraulic conductivity
LIC       Little Chino
LVU       Lower Volcanic Unit - Layer 2
MFR       Mountain Front Recharge
NAU       Northern Arizona University
ROGR      Registry of Groundwater Rights
standev   Standard deviation
UAF       Upper Agua Fria
UAU       Upper Alluvial Unit -Layer 1
USF       Underground storage facility
USGS      United States Geological Survey

                     ii        Prescott AMA Groundwater Flow Model Update
                                                                    2021
Executive Summary

The 2021 Prescott Active Management Area (AMA) groundwater flow model was updated and
recalibrated to represent hydrologic conditions in the Little Chino (LIC) and Upper Agua Fria
(UAF) sub-basin from 1939 to 2019. The model simulates groundwater flow dynamics associated
with the Upper Alluvial Unit (UAU) and Lower Volcanic Unit (LVU) aquifers. As part of the
model update process, numerous alternative conceptual models (ACMs) were developed and
tested for plausibility. Each ACM was optimized using non-linear regression by constraining core
model parameters (hydraulic conductivities, aquifer storage terms, and recharge rates) to available
target data including observed groundwater levels and regional groundwater discharge. The
calibration was consistent with the methods and guidelines established by the USGS (Hill, 1998).
Although the 2021 updated model is generally consistent with the previous release (Nelson and
Yunker, 2014), in the 2021 update several portions of the model were refined, including the Santa
Fe Well field, the northern and southern model boundaries, the Williamson Valley area, as well as
locations near present-day underground storage facilities (USF).
Many ACMs were investigated during this model update. Each ACM was optimized using inverse
modeling techniques by constraining the acceptable solution to best fit the available 3,962 head
and 248 flow targets. Head and flow targets serve as guideposts for tracking basin behavior over
time. However, they are secondary (or indirect) measurements of groundwater flow through an
aquifer. Further, they are composite metrics which reflect the response of the basin to unknown
(or imperfectly known) stresses to a similarly imperfectly known ‘mesh’ or underlying
hydrogeologic structure. The more observations of heads and flow that are available, the more
tightly the possible combination of stress/structure pairings can be constrained. Because there
exists uncertainty both with respect to the exact spatially varying geohydrologic structure of the
basin, and with respect to the temporally varying historic stresses imposed on it, there will,
likewise, exist a range of multiple possible solutions that satisfy the observations and any other
prior conceptual knowledge of the basin. Thus, it is unreasonable to assume any one single ACM
fully and exactly captures the regional-scale groundwater flow system, its structure, or the stresses
imposed on it during the historic period.
As a result, head solutions for plausible ACMs were grouped together to form ensembles. The
ensemble results are presented for selected sites throughout the model area. The ensemble
distributions provide a more comprehensive estimate of uncertainty: areas of the model in which
results show wider head distributions reflect areas that are simulated with lesser certainty. The
converse is also true: in areas where the ensemble results are more self-consistent and the range in
simulated heads is narrower, a greater degree of certainty can be expected. Analyzing ensemble
results consisting of equally likely ACM's in combination with potential boundary conditions may
assist in developing a more complete understanding of future groundwater conditions. This is
particularly true for locations where future groundwater conditions (heads and flows) are
anticipated to extend far beyond the calibration range. The resulting head and flow solutions, thus,
form a distribution that can be used to better understand the groundwater flow system and
associated uncertainty.

                                                 1           Prescott AMA Groundwater Flow Model Update
                                                                                                  2021
One ACM (referred to as the ‘base model’) was selected for release and used for the presentation
of model-error statistics and water budgets. The base model was calibrated to produce mean and
absolute mean head errors of -1.2 ft and 12 ft, respectively, where the error is calculated as
observed minus simulated heads. The base model accurately represents regional-scale groundwater
discharge patterns in the LIC and UAF sub-basins, both in trend and magnitude. At the
groundwater-fed Del Rio Springs, long-term pumping in the LIC Sub-basin has significantly
reduced the rate of spring discharge. Pumping in the UAF sub-basin has also impacted
groundwater discharge to the stream along the Agua Fria River. Capture along the Agua Fria River
has, historically, induced additional recharge to the aquifer by facilitating greater infiltration of
streamflow during episodic flood events. Because the Agua Fria River is in direct hydraulic
connection with the stream-aquifer system of limited storage capacity, sustained stream-induced
recharge from groundwater pumping may result in the retraction of downgradient streamflow, all
else equal.
Between 1939 and 2019, the model simulated 1.4 million acre-feet (AF) of groundwater pumping,
corresponding to a long-term annualized average rate of 17,571 acre-feet per year (AF/yr). The
cumulative net change-in-storage was simulated at 583,038 AF; thus, the long-term aquifer
storage-loss rate simulated between 1939 and 2019 was 7,300 AF/yr.

                                                 2           Prescott AMA Groundwater Flow Model Update
                                                                                                  2021
1. Introduction

1.1. Objective and Scope
The objective of this report is to document the latest update and recalibration of the 2021 Prescott
Active Management Area (AMA) groundwater flow model (the model). The Prescott AMA covers
portions of the Little Chino (LIC) and Upper Agua Fria (UAF) sub-basins, and the model simulates
groundwater flow conditions associated with the Layer 1 - Upper Alluvial Unit (UAU) and Layer
2 - Lower Volcanic Unit (LVU) aquifers between 1939 and 2019. Refer to Figure 1 for the 2021
Prescott AMA model location map.

                    Figure 1. Prescott AMA groundwater model location map

                                                 3          Prescott AMA Groundwater Flow Model Update
                                                                                                 2021
In general, the 2021 model retains a similar conceptualization as the previous release, which
simulated groundwater flow conditions from 1939 to 2011 (Nelson and Yunker, 2014). However,
several areas of the model were refined in the 2021 update. These include: 1) the Santa Fe Well
Field, 2) the Williamson Valley area, 3) the southern portion of LIC Sub-basin near the City of
Prescott’s USF, 4) the area near the Town of Prescott Valley’s USF, and 5) both the northern and
southern model boundaries.
As with the previous (Nelson and Yunker, 2014) release, attention in the 2021 model update was
focused on developing and evaluating alternative conceptual models (ACMs). This consisted of
defining specific model assumptions, calibrating the model parameters to available data, and
evaluating the results. Each ACM was calibrated using non-linear regression techniques based on
minimizing the sum of weighted squared residuals. For this model, residuals represent the
difference between simulated and observed groundwater levels (heads) and regional-scale
groundwater discharge (flows) in the LIC and UAF Sub-basins, represented by Del Rio Springs
and baseflow along the Agua Fria River, respectively.
Model results are presented for groundwater flow conditions in the UAU and LVU aquifers from
1939 to 2019 in the LIC and UAF Sub-basins in the form of a comparison between simulated and
observed heads (HOB) and flows for selected, high-ranking ACMs. One ACM (referred to as the
‘base model’) was selected for release and used for the presentation of model-error statistics and
water budgets. The base model simulated water budget is presented to show the various
components of the groundwater flow system including simulated pumping, recharge, and net
change-in-storage between 1939 and 2019. Additional information regarding inferential statistics
about model parameters, including composite sensitivities and information about estimated
parameter reliability, is presented in Appendix A.

1.2. Background and Previous Work
The Prescott AMA groundwater flow model, originally developed by the Arizona Department of
Water Resources (ADWR) in 1995, was a two-layer model comprised of a heterogeneous upper
alluvial aquifer and a fractured, lower volcanic unit aquifer, exclusive to the LIC Sub-basin (Mason
and Corkhill, 1995). The 1995 model simulated groundwater flow conditions between 1940 and
1994 in parts of the UAF and LIC sub basins within the Prescott AMA.
In 2002, ADWR updated the Prescott model to simulate groundwater flow conditions between
1939 and 1999 (Nelson, 2002). The 2002 update included the addition of a lower volcanic unit
aquifer (LVU) in the northern portion of the UAF Sub-basin (the Santa Fe Well Field), an increased
underflow from the LIC to the Big Chino (BIC) Sub-basin, and an improved representation of
episodic natural recharge along Granite and Lynx Creeks. A single (deterministic) projection was
developed, covering the period between 2000 and 2025.
In 2006, Northern Arizona University (NAU) was contracted by ADWR to update the calibration
of ADWR’s 2002 Prescott model through 2006 (Timmons and Springer, 2006). The 2006 NAU
model update included the activation of model cells in the Williamson Valley area, as well as an
updated geology based on exploratory drilling (refer to ADWR, 2001 for details).

                                                 4          Prescott AMA Groundwater Flow Model Update
                                                                                                 2021
A third model update was completed in 2014 (Nelson and Yunker, 2014), extending the simulation
period from 1939 to 2011. Some of the model changes associated with the 2014 model update
include the extension of the aquitard between the UAU and LVU aquifers in the southern LIC sub-
basin and an improved spatial and temporal distribution of natural recharge.
In 2015 the USGS completed a large, regional-scale groundwater flow model (the NARGFM)
covering much of northern and central Arizona, including the Prescott AMA (Pool, 2016). With
respect to ADWR’s Prescott AMA model’s northern boundary, conjunctive use of the NARGFM
eliminates the need to simulate groundwater flow through the artificial boundary representing flow
between the LIC and BIC Sub-basins.

2. 2021 Model Update
As part of the 2021 update, model packages were modified to simulate the updated period through
2019. Consistent with ADWR’s previous Prescott AMA models, the historic model period starts
November 1, 1939 and completes 80 years later October 11, 2019, without accounting for offsets
during leap years.

2.1. Simulated Pumping
The MODFLOW well package was extended to include new pumping data reported to ADWR
and logged in ADWR’s Registry of Groundwater Rights (ROGR) database through 2019. Well
pumping data from a total of 130 wells was appended to previous model update and thus constitutes
the “base” pumping distribution. The model retains the seasonality of previous ADWR Prescott
AMA models, with a summer (April-October) and a non-summer (November-March) stress period
recurring each year. The annual lump-sum pumping reported to ROGR was split 70/30, with 70
percent of the annual pumping assumed to occur between April and October and 30 percent
between November and March. Due to incomplete records for 2019 at the time of initial model
development, it was assumed that the distribution of groundwater pumping for 2019 was consistent
with 2018.
In some model cells, model-based pumping represents “effective” (rather than “exact”) pumping,
due to: 1) the regional-scale scope of the model (model cells = 0.25 square miles); 2) potentially
having multiple wells per cell, each having distinct pumping rates and screened intervals; and 3)
model pumping being constrained to cell centers, which is generally not consistent with actual
groundwater withdrawal locations. Thus, because of inherent structural model errors associated
with simulated pumping (see above) and imperfect and/or incomplete historical pumping records,
a collection of ACMs was developed by scaling base pumping rates by factors of 0.9, 0.95, 1.05
and 1.1. This was done to better “bracket” the most likely upper and lower bounds of actual historic
pumping behaviors and to solve for, using inverse methods, correspondingly adjusted aquifer
parameters which would be required to arrive at the same head and flow observations. The
pumping-scaled ACMs were then optimized to available head and flow target data and evaluated.
Despite a twenty percent range in the net pumping imposed on the modeled basin, the final

                                                 5          Prescott AMA Groundwater Flow Model Update
                                                                                                 2021
optimized solutions of each of the ACMs provided similar head-error statistics and were deemed
plausible and thus included in the ensemble.

2.2. Simulated Recharge
The recharge package was extended through 2019, with some recharge terms ultimately estimated
by inverse regression and treated as independent model parameters. The inclusion of recharge
components in the non-linear regression process allows recharge to be optimized while providing
information about their properties and relationships to other system parameters, such as hydraulic
conductivity and storage. Due to the regional scope of the model and auto spatial correlation, there
are individual model cells that receive multiple types of recharge, and thus the rates specified in
the MODFLOW recharge package for these cells represents an “effective” or “net” recharge. For
example, there are two USF sites that are located adjacent to major ephemeral tributaries. In
additional to managed recharge, these model cells also receive periodic flood recharge (refer to
photos B1and B2 in Appendix B). In cases where multiple types of recharge overlap individual
model cells, the effective recharge rates were optimized.

2.3. Northern Boundary
During the calibration of the 2021 model, higher-ranking (more plausible) ACMs optimized to
higher underflow rates out of the Prescott AMA model domain along the northern boundary than
previously estimated in earlier model releases (Nelson and Yunker, 2014; Nelson, 2002; Mason
and Corkhill, 1995). Inspection of groundwater level data in previously inactive model cells,
including at Groundwater Site Inventory (GWSI) wells (B-17-03)29CAC and (B-17-02)29ADC,
showed water table elevations (4,280 feet (ft) above sea level) consistent with patterns observed
in the lower BIC Sub-basin, including the general Verde River headwaters area. This area is
located about one mile west of Del Rio Springs (elevation 4,465 ft above sea level), and the
resulting east-to-west hydraulic gradient of 0.035 is high enough to support significant underflow,
even with modest values of hydraulic conductivity. This underflow component is assumed to be
in addition to previously simulated underflow directed to the north and northeast. Refer to
Appendix C for additional details.

2.4. Southern Boundary
In the southern portion of the model, two additional model rows were activated in UAF Sub-basin
to increase the distance between the southern boundary and simulated model stresses (pumping
and recharge) to the north. Furthermore, to better represent potential regional influences in the
lower UAF Sub-basin, selected model cells in layer 2 (LVU) were activated. These modifications
are thought to provide more flexibility to the calibration and are expected to attenuate potential
adverse boundary condition influences when evaluating upgradient groundwater pumping. Refer
to Appendix C for additional details.

                                                 6          Prescott AMA Groundwater Flow Model Update
                                                                                                 2021
2.5. Santa Fe Well Field
The availability of new hydrogeologic information near the LIC / UAF Sub-basin divide resulted
in the reconfiguration of horizontal hydraulic conductivity zone Kx26, which is associated with the
productive LVU aquifer and includes the Santa Fe Well Field. In order to simulate the significant
declines and occasional recoveries observed in wells perforated in the LVU, the extent of Kx26
was necessarily bounded by much less transmissive material, which is represented in the model by
the horizontal hydraulic conductivity parameter, Kx4. With respect to the previous model update
(Nelson and Yunker, 2014), the reconfiguration and re-calibration resulted in a contraction in the
areal extent of Kx26 (Figure 2).
Figure 2. Simulated groundwater flow in model layer 2, 2019. Figure shows concentric ovals
representing the cone-of-depression. The composite-scaled sensitivity (CSS) of model parameters
Kx4 is very high, reflecting its importance in simulating observed declines associated with
intensive pumping. The CSS of Kx26, the primary aquifer supplying municipal demand in the area,
is much lower than the “bounding” zone, Kx4.
7 Prescott AMA Groundwater Flow Model Update
20212.6. Williamson Valley
Additional groundwater level observations throughout Williamson Valley were added to the non-
linear regression as head calibration targets. The spatial resolution of zones associated with
hydraulic conductivity, storage, and recharge in the area was refined to improve simulated head fit
to the significant declines observed in the field.
3. Model Calibration
To a large extent, the calibration of the model consisted of optimizing ACMs and evaluating the
resulting solutions for plausibility with respect to aquifer properties and flow budgets. Each ACM
was optimized using non-linear regression techniques and generally followed methods and
guidelines established by the USGS (Hill, 1998).
Testing ACMs consisted of defining specific modeling assumptions, calibrating each ACM to
available groundwater level and regional-scale flow data using non-linear regression, and
evaluating the optimized solutions. These modeling assumptions included 1) the spatial
distribution of fundamental model parameters, including hydraulic conductivity and storage; 2)
the spatial and temporal distribution of recharge, including boundary conditions; and 3) other
assumptions, including plausible ranges of assigned pumping assumptions, alternative weighting,
etc.
To minimize potential bias (such that preconceived, possibly imperfect, assumptions about the
structure of the basin or groundwater flow system would overshadow the signal embedded in the
raw observation data), no regularization or a priori constraints were used in the non-linear
regression calibration. Furthermore, use of head-dependent boundaries was largely limited to the
northern and southern model boundaries. The availability of a combination of both head and flow
targets provided excellent constraints for the non-linear regression. Refer to Appendix A for
additional information regarding the non-linear regression.
A total of 3,692 head targets were included in the updated calibration using water level elevation
data from ADWR’s Groundwater Site Inventory (GWSI) database. In addition, 248 regional-scale
flow targets of groundwater discharge rates feeding Del Rio Springs and baseflow along the Agua
Fria River were included in the non-linear regression as proxies for groundwater discharge patterns
in the LIC and UAF Sub-basins. Note that regional-scale groundwater flow remaining in the
subsurface along boundaries cannot be directly measured. As a result, underflow rates along the
northern and southern boundaries were not assigned as calibration targets, but rather as model
parameters, subject to estimation by non-linear regression and subsequent optimization.
For most ACMs, head residuals were assigned weights equal to 0.1 ft-1, representing a standard
deviation of 10 ft. Flow residuals were assigned weights of 2.3E-5 (ft3/d)-1, representing a standard
deviation of 0.5 cubic feet per second (CFS), for most ACMs including the base model. Evaluation
of the standard error of regression was also used to guide weighting to ensure that neither heads
nor flows dominate the objective function. Note that high streamflow events along Granite Creek
and the Agua Fria River were not used directly as model calibration targets because transmission
8 Prescott AMA Groundwater Flow Model Update
2021losses during large runoff events are difficult to quantify due to data gaps, uncertainty associated
with high flow measurements, unmeasured tributary contributions, and other factors. However,
stream recharge is an important model constraint, and was honored by calibrating the model to
groundwater level changes in response to positive or negative stresses such as pumping or
recharge.
4. Calibrated Model Results
This section documents model results including, comparison of simulated and observed heads and
flows, presentation of model-error statistics, simulated water budgets, major trends and associated
implications. More details about the model conceptualization are provided in Appendix D. Unless
otherwise indicated, all references to “feet” in the figures in this section refer to “feet above sea
level.”
4.1. Summary of Simulated Heads
A total of 3,692 observed groundwater levels were used as head calibration targets. For the base
model, the residual mean, absolute mean, and root mean squared were -1.2 ft, 12.1 ft, and 18 ft,
respectively. There were 1,687 head targets screened in layer 1 (UAU aquifer), and the residual
mean, absolute mean, and root mean squared were +2.2 ft, 13 ft, and 19 ft, respectively. There
were 2,005 head targets screened in layer 2 (mostly the LVU aquifer), and the residual mean,
absolute mean, and root mean squared were -4.1 ft, 11 ft, and 18 ft, respectively. All plausible
ACMs had comparable absolute residual mean ranging from 10 to 13 ft. The X-Y plot displaying
total head residual statistics is presented below (Figure 3).
9 Prescott AMA Groundwater Flow Model Update
2021Figure 3. X-Y Plot showing head residual statistics summary.
Comparing simulated and observed heads show that the model accurately represents regional-scale
groundwater level elevations over space and time in the LIC and UAF Sub-basins for both the
UAU and LVU aquifers. The absolute mean residual head error represents about 1.5% of the
system head change.
4.2. Simulated and Observed Heads at Select Locations
Information about simulated heads for different areas within the model are presented in several
different ways in this report, including: 1) direct, time-series comparisons between simulated and
observed heads (hydrographs) for five locations using the base model, and 2) simulated head
ranges, based on an ensemble of plausible ACMs. To provide a broader representation of
hydrologic conditions within local areas, simulated and observed groundwater levels are presented
for seven different areas in Appendix E. The different areas are identified in Figure 4.
10 Prescott AMA Groundwater Flow Model Update
2021Figure 4. Location of selected hydrographs.
4.2.1. Little Chino Sub-basin, North
Figures 5a and 5b below show simulated and observed heads for well (B-17-02)N34DDD1 and
the ensemble in the LIC Sub-basin, north location.
11 Prescott AMA Groundwater Flow Model Update
2021Simulated and Observed Heads
(B-17-02)N34DDD1
4580
4560
Simulated and Observed Heads (ft)
B_17_02N34DDD1/4(Observed)
4540
B_17_02N34DDD1_BK2
4520
4500
4480
4460
11/01/39 10/31/49 11/01/59 10/31/69 11/01/79 11/01/89 11/01/99 11/01/09 11/01/19
B_17_02N34DDD1_LVU_upweighted
Simulated and Observed Heads B_17_02N34DDD1/4Interpolated
B_17_02N34DDD1_ICFz
(B-17-02)N34DDD1
B_17_02N34DDD1/4Interpolated
4585 B_17_02N34DDD1_20210213PrAMAinv18F
B_17_02N34DDD1_ICFz
4580
B_17_02N34DDD1_20210213PrAMAinv18Q95
B_17_02N34DDD1_20210213PrAMAinv18QX105
Simulated and Observed Heads (ft)
B_17_02N34DDD1_20210213PrAMAinv20Snoflow
4565 B_17_02N34DDD1_20210216PrAMAK28F
4560 B_17_02N34DDD1_20210221_PrAMAF
B_17_02N34DDD1_20210222PrAMA_QX095
B_17_02N34DDD1_202102224PrAMA_RCH40_rec
B_17_02N34DDD1_20210224PrAMA_QX105F_RCH40
4545 B_17_02N34DDD1_20210226PrAMARCH40K28nf_rec
4540
B_17_02N34DDD1_20210225PrAMA_RCH40F_rec
B_17_02N34DDD1_20210224PrAMARCH40K28F_rec
B_17_02N34DDD1_20210320B170229cac_regUAF
4525 B_17_02N34DDD1_20210321N_UnderflowRCHUAF
B_17_02N34DDD1_20210320N_UNderflowRCH
B_17_02N34DDD1_20210319B170229cac
4520 B_17_02N34DDD1_20210318N_UNderflowRCH
B_17_02N34DDD1_20210318B170229cac
4505 B_17_02N34DDD1_20210319B170229cacX5
B_17_02N34DDD1_20210302PrAMA_CHB
B_17_02N34DDD1_20210302PrAMA_CHB
4500 B_17_02N34DDD1_20210302PrAMACHB
B_17_02N34DDD1_20210228DelRio_Underflow
4485 B_17_02N34DDD1_20210228Northern_BC
B_17_02N34DDD1_20210226PrAMARCH40K28nf
B_17_02N34DDD1_20210225PrAMA_RCH40F
B_17_02N34DDD1_20210224PrAMARCH40K28F
4480
4465 B_17_02N34DDD1_20210224PrAMA_RCH40
B_17_02N34DDD1/4(Observed)
B_17_02N34DDD1_RCH40F3
B_17_02N34DDD1_20210329PrAMA3COPV_RCH
B_17_02N34DDD1_20210327PrAMA3ghbCOP
4460 4445 B_17_02N34DDD1_20210406PrAMA_PVUSFF
B_17_02N34DDD1_BK2
11/1/39 10/31/49 11/1/59 10/31/69 11/1/79 11/1/89 11/1/99 11/1/09 11/1/19
Figures 5a and 5b. Simulated and observed groundwater levels at (B-17-02)N34DDD1. (a) Base
model (top), and (b) ensemble showing range of plausible ACM solutions (bottom).
12 Prescott AMA Groundwater Flow Model Update
20214.2.2. Little Chino Sub-basin, South
Figures 6a and 6b below show simulated and observed heads for well (B-15-01)19DCD1&2 and
the ensemble in the LIC Sub-basin, south location. In the figure immediately below, the simulated
head for Layer 1 is represented by the blue line and the simulated head for Layer 2 is represented
by the red line.
Simulated and Observed Heads
4750
(B-15-1) 19DCD1 & 2
4700
Simulated and Observed Heads (ft)
4650 B_15_01_19DCD1/4
9(Observed)
B_15_01_19DCD2/4
4600 8(Observed)
4550
4500
11/01/39 10/31/49 11/01/59 10/31/69 11/01/79 11/01/89 11/01/99 11/01/09 11/01/19
B_15_01_19DCD1/49(Observed)
Simulated and Observed Heads B_15_01_19DCD1_20210329PrAMA3COPV_RCH
(B-15-1) 19DCD1 & 2 B_15_01_19DCD1_20210327PrAMA3ghbCOP
B_15_01_19DCD1_RCH40F3
4750 B_15_01_19DCD1_20210213PrAMAinv18F_sim
_hed
B_15_01_19DCD1/49Interpolated
B_15_01_19DCD1_20210216PrAMA28KF
B_15_01_19DCD1_Pumping_Lowered
4700
Simulated and Observed Heads (ft)
B_15_01_19DCD1_Pumping_Increased
B_15_01_19DCD1/49Interpolated
B_15_01_19DCD1_ICFz
4650 B_15_01_19DCD1_20210221_PrAMAF1
B_15_01_19DCD1_20210321Nunderflow_RCHU
AF
B_15_01_19DCD1_20210320N_UnderflowRCH
4600 B_15_01_19DCD1_20210319B170229cacX5
B_15_01_19DCD1_20210319B170229cac
B_15_01_19DCD1_20210318B170229cac
B_15_01_19DCD1_20210317N_UnderflowRCH
4550
B_15_01_19DCD1_20210317B170229cac_
B_15_01_19DCD_20210320B170229cac_regUAF
B_15_01_19DCD1_20210406PrAMA_PVUSFF
4500 B_15_01_19DCD2/48(Observed)
11/01/39 10/31/49 11/01/59 10/31/69 11/01/79 11/01/89 11/01/99 11/01/09 11/01/19
Figures 6a and 6b. Simulated and Observed UAU and LVU Heads Southern LIC Sub-basin; (a)
Base model (top) and (b) ensemble showing range of plausible ACM solutions (bottom).
13 Prescott AMA Groundwater Flow Model Update
2021One region of the model where there was considerable spread in the ensemble was in model layer
1, near the City of Prescott USF and Granite Creek (Southern LIC/UAU aquifer). It is assumed
that the wider distribution of simulated heads are the result of: 1) having fewer head-constraining
calibration targets with respect to the LVU aquifer; 2) heterogenous distribution of both horizontal
and vertical hydraulic conductivity associated with the UAU aquifer; 3) imperfect application of
“effective” recharge from multiple sources including artificial recharge and periodic flood
recharge along Granite Creek; and 4) the attenuation of regional-scale flow “information,”
originating from Del Rio Springs and baseflow along the Agua Fria River, with distance, towards
central portions of the model.
Compared to the spread of simulated LVU aquifer heads, Figure 6b above shows a greater range
of plausible simulated water levels associated with the UAU aquifer. Hence the simulation of
groundwater flow in the UAU Aquifer near the Prescott Airport is subject to greater levels of
uncertainty than the LVU aquifer solutions.
4.2.3. Upper Agua Fria Sub-basin, North (Santa Fe Well Field)
Significant declines have been associated with the productive Santa Fe Well Field (Kx26) in the
northern UAF Sub-basin. Decline rates of this magnitude can only be simulated when the highly
transmissive aquifer, Kx26, is bounded by much less transmissive material. In other words, the
surrounding low-K zone (Kx4), limits the cone-of-depression originating from zone Kx26 from
propagating into adjacent materials; thus, high resistance to hydraulic flow outside of Kx26, results
in the concentrated removal of groundwater (and pressure head reduction) within the productive
aquifer, Kx26.
Figures 7a and 7b below show simulated and observed heads for two wells and the ensemble in
the LIC Sub-basin, south location.
4850 Simulated and Observed Groundwater Levels, North UAF Sub-basin
4800
4750
SImulated and Obseved Hydrographs (ft)
4700
4650
4600
4550
4500
B_14_01_15ABA/57(Observed)
4450
B_14_01_14ACC/58(Observed)
4400
B_14_01_15ABA_BK2
4350 B_14_01_14ACC_BK2
4300
11/01/39 10/31/49 11/01/59 11/01/69 11/01/79 11/01/89 11/02/99 11/01/09 11/02/19
14 Prescott AMA Groundwater Flow Model Update
2021Simulated and Observed Groundwater Levels, North UAF Sub-basin
B_14_01_14ACC_20210226PrAMARCH40K28nf
B_14_01_14ACC_20210302PrAMA_CHB
B_14_01_14ACC_20210225PrAMA_RCH40F
4800 B_14_01_14ACC_20210224PrAMaRCH40K28F
B_14_01_14ACC_20210228Northern_BC
B_14_01_14ACC_20210318B170229cac
B_14_01_14ACC_20210317N_Underflow
B_14_01_14ACC_20210320N_UnderflowRCH
B_14_01_14ACC_20210224PrAMA_RCH40
SImulated and Obseved Hydrographs (ft)
B_14_01_14ACC_20210222PrAMAiQ105
B_14_01_14ACC_20210317B170229cac_
4700 B_14_01_14ACC_20210129PrAMA_RCH40_sim_hed
B_14_01_14ACC_20210222_PrAMA_Qi105F_RCH40
B_14_01_14ACC_20210213PrAMAinv18QX105
B_14_01_14ACC_20210213PrAMAinv19S_Sim_hed
B_14_01_14ACC_20210319B170229cacX5
B_14_01_14ACC_20210321NunderflowRCHUAF
B_14_01_14ACC_20210319B170229cac_rec
B_14_01_14ACC_RCH40F3
B_14_01_14ACC_20210329PrAMA3COPV_RCH
4600 B_14_01_14ACC_20210327PrAMA3ghbCOP
B_14_01_15ABA_20210321N_UnderflowRCHUAF
B_14_01_15ABA_2021032N_UnderflowRCH
B_14_01_15ABA_20210319B170229cacX5
B_14_01_15ABA_20210319B170229cac
B_14_01_15ABA_20210318B17029cac
B_14_01_15ABA_20210317B170229cac_
B_14_01_15ABA_20210225PrAMA_RCH40F
4500 B_14_01_15ABA_20210302PrAMA_CHB
B_14_01_15ABA_20210228Northern_BC
B_14_01_15ABA_20210228Northern_BC
B_14_01_15ABA_20210226PrAMARCH40K28nf
B_14_01_15ABA_20210224PrAMA_RCH40
B_14_01_15ABA_20210224PrAMARCH40K28F
B_14_01_15ABA_20210222PrAMAQX105
B_14_01_15ABA_20210222PrAMAQX105
4400 B_14_01_15ABA_20210213PrAMAinv19S_sim_hed
B_14_01_15ABA_20210222_PrAMAi_QX105F_RCH40
B_14_01_15ABA_20210129PrAMA_RCH40_sim_hed
B_14_01_15ABA_20210213PrAMAinv18QX105
B_14_01_15ABA_20210222PrAMAQX105_sim_hed
B_14_01_15ABA_20210329PrAMA3COPV_RCH
B_14_01_15ABA_202127PrAMA3ghbCOP
B_14_01_15ABA_RCH40F3
B_14_01_15ABA_20210406PrAMA_PVUSFF
4300 B_14_01_15ABA/57(Observed)
B_14_01_14ACC/58(Observed)
11/01/39 10/31/49 11/01/59 11/01/69 11/01/79 11/01/89 11/02/99 11/01/09 11/02/19 B_14_01_15ABA_BK2
B_14_01_14ACC_BK2
Figure 7a and 7b. Simulated and Observed UAU and LVU Heads, northern UAF Sub-basin; (a)
Base model (top) and (b) ensemble showing range of plausible ACM solutions (bottom).
4.2.4. Central UAF Sub-basin: Pumping declines and Induced Recharge
Groundwater pumping creates aquifer storage space in unconfined aquifer systems. Data clearly
shows that in select areas, episodic streamflow induces recharge when storage space is available
in unconfined aquifers.
Figures 8a and 8b below show simulated and observed heads for well (A-14-01)28BBB and the
ensemble in the central UAF Sub-basin location.
4720 Simulated and Observered Heads
(A-14-01) 28BBB A_14_01_28BBB_Obse
rved
4700 A_14_01_28BBB_Bk2
Simulated and Observed Heads (ft)
4680
4660
4640
4620
4600
11/01/39 10/31/49 11/01/59 10/31/69 11/01/79 11/01/89 11/01/99 11/01/09 11/01/19
15 Prescott AMA Groundwater Flow Model Update
2021Simulated and Observered Heads
A_14_01_28BBB_Observed
A_14_01_28BBB_20210213PrAMAinv
(A-14-01) 28BBB 18F
A_14_01_28BBB_LVU_Upweighted
4720
A_14_01_28BBB_Pump_Lowered
A_14_01_28BBB_Pump_Higher
4700 A_14_01_28BBB_UAU_Upweight
A_14_01_28BBB_ICFz
Simulated and Observed Heads (ft)
A_14_01_28BBB_20210213PrAMAinv
4680 18F
A_14_01_28BBB_20210213PrAMAinv
18QX95
A_14_01_28BBB_20210213PrAMAinv
18Q105
A_14_01_28BBB_20210213PrAMAinv
4660 18Q1_1
A_14_01_28BBB_20210216PrAMA28
K
A_14_01_28BBB_20210221_PrAMA_F
1
4640 A_14_01_28BBB_20210222_PrAMA_
QX095
A_14_01_28BBB_20210224PrAMA_R
CH40_rec
A_14_01_28BBB_20210225PrAMA_R
CH40F_rec
4620 A_14_01_28BBB_20210222_PrAMAi_
QX105F_RCH40_rec
A_14_01_28BBB_20210222_PrAMA_
QX105_rec
A_14_01_28BBB_20210129PrAMA_R
4600 CH40
A_14_01_28BBB_20210226PrMARCH
11/01/39 10/31/49 11/01/59 10/31/69 11/01/79 11/01/89 11/01/99 11/01/09 11/01/19 40K28nf_rec
A_14_01_28BBB_2021024PrAMARCH
40k28F_rec
Figures 8a and 8b. Simulated and Observed UAU Heads, central UAF Sub-basin; (a) Base model
(top) and (b) ensemble showing range of plausible ACM solutions (bottom).
4.2.5. Williamson Valley Area (BIC / LIC Sub-basin divide)
Williamson Valley is another area where local pumping declines have been accentuated because
the extent of the aquifer is limited. Similar to the Santa Fe Well Field, relatively low-K subsurface
materials surround the local pumping center and limit the propagation of the cone-of-depression.
Consequently the “bounding” effect results in more local dewatering and significant local
drawdown. For more details, see Appendix E. Note that high sensitivity was associated with the
“bounding” parameter, Kx6, and resulted in little variation among ACMs solutions. Because there
was so little variation, an ensemble of head solutions from the various plausible ACMs is not
presented for this area. See Figure 9 below showing the simulated and observed groundwater
heads.
16 Prescott AMA Groundwater Flow Model Update
20215100
Simulated and Observed Heads
(B-15-02) 30ADC
5080
5060
5040
Simulated and Observed (ft)
5020
B150230ADC1601103_Observed
5000
4980 BK2_B150230ADC1601103
4960
4940
4920
4900
11/01/39 10/31/49 11/01/59 10/31/69 11/01/79 11/01/89 11/01/99 11/01/09 11/01/19
Figure 9. Simulated and Observed heads, Williamson Valley.
4.3. Simulated Flow
Regional-scale flow targets were used to constrain the calibration of the groundwater flow model.
Assigned flow targets at Del Rio Springs and baseflow along the Agua Fria River represent
systemic regional-scale groundwater discharge in the LIC and UAF Sub-basins, respectively.
Located at the northern and southern model boundaries, Del Rio Springs and baseflow along the
Agua Fria River represent concentrated hydrologic information associated with the upgradient
groundwater flow regime in the LIC and UAF Sub-basins, respectively. Figure 10 below shows
the locations of the regional-scale flow targets. Comparison between simulated and observed
groundwater discharge are shown in figures 11a, 11b, 11c, 12a and 12b below. The importance
of including these calibration constraints cannot be overstated. Additional information about the
importance of including flow targets in groundwater flow modeling is provided in Hill (1998).
17 Prescott AMA Groundwater Flow Model Update
2021Del Rio Springs, circa 2000
Agua Fria River baseflow, July 21, 2016
Figure 10. Locations of regional groundwater discharge
Simulated and observed groundwater discharge at Del Rio Springs for the base model is shown
in Figures 11a and 11b. To illustrate the range of simulated groundwater discharge representing
Del Rio Springs, an ensemble of selected ACM’s is presented in Figure 11c.
18 Prescott AMA Groundwater Flow Model Update
2021Simulated and observed Baseflow (cfs) 7
Simulated baseflow, Del Rio Springs (cfs)
6 ACM WithOUT flow targets common-period residual error:
Simulated mean 1.35 cfs +/- 0.46
Observed mean 1.1 cfs +/- 0.6
5
4 net cfs
observed baseflow
3
2
1
0
11/01/39 10/31/49 11/01/59 10/31/69 11/01/79 11/01/89 11/01/99 11/01/09 11/01/19
Simulated baseflow, Del Rio Springs (cfs)
3.0
Detail of period with observed flow
Simulated and observed Baseflow
2.5
net cfs
2.0 observed baseflow
1.5
1.0
0.5
0.0
11/01/95 10/31/05 11/01/15
Figure 11a and 11b. Simulated and observed flow at Del Rio Springs (top); detail showing
seasonality for period with high observation sample rate (bottom).
19 Prescott AMA Groundwater Flow Model Update
20219 observed baseflow
2021228Northern_BC_F
Ensemble of Simulated Baseflow, Del Rio Springs (cfs) 20210305DelRioUnderflowGHB
8
Simulated and observed Baseflow (cfs)
20210226PrAMAK28nf17aad
20210227PrAMARCH40K2817aadF
20210229DelRioUnderflow_wellF
7 20210226PrAMARCH40_Alltsbed
20210320b170229cac_regUAF
20210323B170229cac_altOUT
6 20210319B17u0229cac
20210320N_UnderflowRCH_Overwrote
20210318N_UnderflowRCH_forward_test
5 20210319B170229cacX5F
20210320N_UnderflowRCH_K12_100
20210321N_UnderflowRCHUAF
4 20210306DelRioUnderflowGHB_rec
20210320N_UnderflowRCH
20210511PrAMA_str_5upF1
3 20210511PrAMA_str_5up
20210511PrAMA_str_5upF2
20210511PrAMA_str_5up
2 20210512PrAMA_str_5dn
20210512PrAMA_str_5dnF2
20210512PrAMA_str_5dnF3
1 20210516_PrAMA_NW
20210514_PrAMA_NW
20210518_PrAMA_Nwhed
0 20210518_PrAMA_NWhedF
11/1/1939 10/31/1949 11/1/1959 10/31/1969 11/1/1979 11/1/1989 11/1/1999 11/1/2009 11/1/2019 Base ACM
Figure 11c. Ensemble of selected ACM’s showing the range of simulated flow representing Del
Rio Springs and observed flow targets (red triangles).
Simulated and observed baseflow along the Agua Fria River for the base model is shown in Figure
12a. To illustrate the range of simulated baseflow along the Agua Fria River, an ensemble of
selected ACM’s is presented in Figure 12b.
Figure 12a. Simulated and observed baseflow along Agua Fria River
20 Prescott AMA Groundwater Flow Model Update
2021Figure 12b. Ensemble of selected ACM’s showing the range of simulated baseflow along the
Agua Fria River and observed baseflow targets (black circles)
4.4. Simulated Water Budgets
Calculated water budgets for the steady state and transient simulations are provided in Tables 1
and 2, respectively. Additional, detailed water budget information is provided in Appendix B.
*Simulated Steady State Water Budget, circa 1939
Inflow AF/yr
Mountain Front Recharge (MFR) & Chino Valley Irrigation 5,803
District (CVID) AG recharge
Granite & Lynx Creek Natural recharge 7,702
Underflow from BIC Sub-basin into the LIC Sub-basin 2,233
15,738
Outflow AF/yr
Del Rio Springs 5,301
LIC Underflow to BIC 4,017
Agua Fria Baseflow 3,605
UAF Underflow and groundwater discharge below gage 1,873
Early-development groundwater pumping; bank releases 932
15,728
*For details see Appendix B.
Table 1. Simulated steady state water budget.
21 Prescott AMA Groundwater Flow Model Update
2021*Simulated Transient Water Budget (long-term annualized rates)
Inflow AF/yr
Storage in 18,233
Total Recharge (RCH cells) 20,607
Granite & Lynx Creek: Natural recharge (Str cells) 865
Total Inflow -> 39,705
Outflow AF/yr
Storage out 10,940
LIC Groundwater discharge (Del Rio Springs); str cells 1,997
UAF Groundwater discharge (Agua Fria River); str cells 4,046
LIC and UAF EVT 715
LIC Underflow (flux and GHB) 3,863
UAF underflow (flux) 500
Pumping 17,571
Total Outflow 39,632
Net Change-in-storage -7,293
*Rates have been annualized. Long-term mean net change-in-storage rates in the LIC and
UAF are 6,000 and about 1,300 AF/yr, respectively. For more budget details see Appendix B.
GHB = general head boundary
Table 2. Simulated transient water budget
5. Summary and Conclusions
5.1. Core System Features
By evaluating groundwater data (heads; flows; aquifer tests; well logs; pumping estimates, existing
studies etc.), an increasingly clear picture is forming about the regional-scale groundwater flow
system. With each update, regional-scale hydrologic features are being identified with greater
confidence. Important regional-scale hydrologic features represented in the model include:
1) High values of hydraulic conductivity (Kx23 and Kx25) are associated with the LVU
aquifers in the LIC Sub-basin in model layer 2. Wells screened in Kx23 and Kx25 are
generally excellent water producers. Long-term pressure head declines associated with the
LVU aquifer in the LIC Sub-basin are approximately 100 ft, and hydraulic gradients are
generally flat, due to high transmissivity. Currently, groundwater levels associated with the
LVU aquifer in the central LIC Sub-basin are at an elevation of 4,500 ft above sea level.
The distribution of hydraulic conductivity for the base model is shown in Appendix F.
2) An aquitard separates layers 1 and 2 in the LIC sub-basin. Historically, there was an
upward vertical gradient, including artesian wells, especially in the northern LIC Sub-
basin, south of Del Rio Springs. Chronic regional groundwater extraction in the LIC Sub-
basin has reduced the LVU aquifer pressure head to elevations more consistent with water
table elevations associated with the UAU aquifer. Modeling results suggest the “effective”
22 Prescott AMA Groundwater Flow Model Update
2021vertical hydraulic conductivity may have increased over time, possibly due to crossflow in
wells screened in both the UAU and LVU aquifers in the LIC Sub-basin.
3) K-zone representing groundwater conditions in the general Del Rio Springs area, Kx2,
and connection to BIC Sub-basin along the northern model boundary. A sensitive model
parameter, Kx2, has been consistently estimated using non-linear regression techniques at
about 10 ft/d; also see Nelson and Yunker, 2014. The resistance to vertical flow (aquitard)
separating the UAU and LVU aquifers in the central portion of the LIC Sub-basin is largely
absent in Kx2, thus allowing for the upwelling and emanation of groundwater discharge
that forms Del Rio Springs.
4) Long-term groundwater pumping in the LIC Sub-basin has resulted in a significant
reduction in groundwater discharge - or capture - at Del Rio Springs, due to the direct
hydraulic connection between the springs and the LIC Sub-basin aquifers (UAU and LVU).
5) High values of hydraulic conductivity (Kx26) are associated with the LVU aquifer(s) in
the northern UAF Sub-basin in model layer 2 (Santa Fe Well Field): Wells screened in
Kx26 are generally excellent water producers, however, the lateral extent of Kx26 is limited.
6) Geologic materials with lower values of hydraulic conductivity surround the LVU
aquifers, including Kx1, Kx2, Kx4, Kx9 and Kx27. Higher resistance to groundwater flow
occurs outside the primary LVU aquifer zones and, consequently, impedes the lateral
propagation of the cones of depression by accentuating drawdown within the productive
LVU aquifers, represented by Kx23, Kx25 and Kx26.
7) Wells screened in layer 2 outside the LVU zones have distinct elevations, trends, and
hydraulic gradients, with respect to the LVU zone patterns.
8) An aquitard or aquiclude (Kz4) separates layers 1 and 2 in the northern UAF sub-basin
(Santa Fe Well Field); both data and modeling indicate that there is very high resistance
to vertical flow.
9) The UAU aquifer in model layer 1 is heterogeneous, hydraulic conductivity estimates
range by orders of magnitude.
10) Relatively high values of hydraulic conductivity are associated with stream gravels in
select areas such as Agua Fria River, Lynx Creek and associated tributaries (Errol L.
Montgomery, 2008); high recharge rates are observed during significant streamflow
events.
11) There exists a significant downward vertical gradient in the southern portions of the LIC
sub-basin. Observed groundwater levels screened in the UAU can exceed LVU heads by
200 ft. In general, groundwater levels currently observed at about 4,500 ft above sea level
are mostly likely in direct hydraulic connection with the LVU aquifer in the LIC Sub-basin.
Groundwater levels differing from this value are probably not in direct hydraulic
connection with the LIC Sub-basin LVU aquifer.
12) A significant cone of depression is developing in the Williamson Valley area. Since about
2000, groundwater level declines in the most impacted areas have exceeded 100 ft.
13) Long-term groundwater pumping in the UAF Sub-basin has resulted in the capture of
groundwater discharge, including baseflow associated with the Agua Fria River.
However, due to periodic flood recharge along the Agua Fria River and the finite storage
capacity of the respective stream-aquifer system, the magnitude of baseflow continues to
23 Prescott AMA Groundwater Flow Model Update
2021reflect natural stream recharge patterns where increases and decreases in baseflow are
consistent with periods of high and low rates of natural recharge. Continued capture may
result in: 1) a reduction in baseflow, especially during dry periods; and/or 2) a reduction in
downstream flow and subsequent recharge, due to induced recharge along upgradient areas.
14) In addition to groundwater discharge as spring flow, baseflow and riparian demand (EVT),
both the northern and southern model boundaries consistently indicate underflow occurs to
the BIC Sub-basin (to the north) and Agua Fria Basins (to the south). The magnitude of
underflow simulated along these boundaries has, generally, been increasing with each
successive model update.
15) Episodic periods of natural recharge along Granite Creek, the Agua Fria River, Lynx
Creek and other major tributaries account for approximately two thirds of all natural
recharge.
5.2. Conclusions
The Prescott AMA groundwater flow model was updated and re-calibrated to simulate hydrologic
conditions in the LIC and UAF Sub-basins from 1939 to 2019. The model simulates groundwater
flow conditions associated with UAU and LVU aquifers. Numerous ACMs were developed and
tested for plausibility. Each ACM was optimized using non-linear regression by constraining
model parameters to available target data, including observed groundwater levels and regional
groundwater discharge. The calibration is consistent with the methods and guidelines established
by the USGS (Hill, 1998). Although the model is generally consistent with the previous update,
several areas were refined, including the Santa Fe Well field, the northern and southern boundaries,
the general Williamson Valley area, and locations near present-day USFs.
Each ACM was optimized using inverse modeling techniques by constraining 3,962 head
calibration targets and 248 regional-scale groundwater discharge targets. For the base model, the
residual mean and absolute residual mean head errors were -1.2 ft and 12 ft, respectively, where
the residual error is equal to observed minus simulated heads. All plausible ACMs had similar
head residual error statistics. The model accurately represents regional-scale groundwater
discharge patterns in the LIC and UAF sub-basin, both in trend and magnitude. Evaluating regional
groundwater discharge patterns provides a robust measure for discriminating among ACMs.
Significant rates of capture have occurred at both Del Rio Springs and baseflow along the Agua
Fria River, due to long-term groundwater pumping.
At Del Rio Springs, capture has resulted in a significant decrease in groundwater discharge as
spring flow. Similarly, due to the changing hydraulic gradients in the LIC Sub-basin, capture has
also occurred along the northern underflow boundary. It is important to note that capture has
resulted in a chronic reduction in groundwater outflow along the northern boundary: while the
reduced outflow lessens the degree of long-term groundwater overdraft (all else equal), it does so
at the expense of groundwater discharge.
While the capture of baseflow has also occurred along the Agua Fria River, floods periodically
recharge (and “reset”) the shallow water table aquifer. In practical terms, local groundwater
pumping provides storage space for subsequent recharge, or induced recharge. This space (or
capacity) is only replenished when large flood events occur. Given the complex nature of the
24 Prescott AMA Groundwater Flow Model Update
2021stream-aquifer system in the UAF sub-basin and continued groundwater pumping, downgradient
streamflow may be subject to retraction due to induced recharge, upgradient, all else equal.
Between 1939 and 2019, the model simulated 1.4 million AF of groundwater pumping,
corresponding to a long-term annualized average rate of 17,571 AF/yr. The cumulative net
change-in-storage loss to the aquifer was simulated at 583,038 AF, representing a long-term
annualized rate of -7,293 AF/yr.
Many ACMs were investigated during this model update and it is unreasonable to assume any one
single ACM fully represents the regional-scale groundwater flow system. As a result, head
solutions for plausible ACMs were grouped together to form ensembles for selected sites. The
ensemble head distributions, therefore, provide a measure of uncertainty, and results showing
wider or narrower head distributions can be associated with areas simulated with less or greater
certainty, respectively. Analyzing ensemble results consisting of equally likely ACM's in
combination with potential boundary conditions may assist in developing a more complete
understanding of future groundwater conditions. This is particularly true for locations where
future groundwater conditions (heads and flows) are anticipated to extend far beyond the
calibration range. The resulting head and flow solutions, thus, form a distribution that can be used
to better understand the groundwater flow system and associated uncertainty.
25 Prescott AMA Groundwater Flow Model Update
2021References
1. Arizona Water Atlas Volume 8: infoshare.azwater.gov/docushare/dsweb/Get/Document-
10433/Volume_8_final.pdf
2. Ch2M. Iron King Mine – Humboldt Smelter Superfund Site Dewey-Humboldt, Yavapai
County, Arizona. Remedial Investigation Report prepared for the US. Environmental
Protection Agency, 2016.
https://response.epa.gov/sites/11828/files/IKMHS%20Remedial%20Investigation%20Report
%20Text%20Sept%202016.pdf
3. Corkhill, E, F. & Mason, D. Hydrogeology and Simulation of Groundwater Flow, Prescott
Active management Area, Yavapai County, Arizona: Arizona Department of Water
Resources. Modeling Report No. 9 ADWR, 1995.
https://new.azwater.gov/sites/default/files/GMR%209-
Hydrogeology_and_Simulation_of_Groundwater_Flow%20-PRAMA_0.pdf
4. Hill, M. Methods and Guidelines for effective model calibration. USGS Water Resources
Investigation Report 98-4005, 1998.
https://water.usgs.gov/nrp/gwsoftware/modflow2000/WRIR98-4005.pdf
5. Nelson, K. Application of the Prescott Active Management Area Groundwater Flow Model
Planning Scenario 1999 – 2025: Arizona Department of Water Resources Model Report No.
12 ADWR, 2002. https://new.azwater.gov/sites/default/files/Modeling_Report_12_0.pdf
6. Timmons, D. & Springer, A. Prescott AMA Groundwater Flow Model Update Report.
Prepared for Arizona Department of Water Resources, contract #2005-2592, 2006
https://new.azwater.gov/sites/default/files/Prescott_Model_Update_Report_0.pdf
7. Nelson, K. and Yunker, D. Groundwater Flow Model Update Report for the Prescott Active
management Area, Yavapai County, Arizona Model Report No. 25 ADWR, 2014.
https://new.azwater.gov/sites/default/files/Prescott_AMA%20GW%20model%20report_3_3
1_2014_0.pdf
8. Iron King Mine EPA. https://response.epa.gov/site/doc_list.aspx?site_id=11828
9. Errol L. Montgomery. Evaluation of Pumping-Induced Stream Depletion in the Vicinity of
Young’s Farm and the Agua Fria River Yavapai County, Arizona, 2008. Report submitted to
ADWR with Yavapai Land Holdings, LLC application for analyses of water supply number
28-402259.0000.
10. Pool, D.R. et. al. Regional Groundwater-Flow Model of the Redwall-Muav, Coconino, and
Alluvial Basin Aquifer Systems of Northern and Central Arizona. Scientific Investigations
Report 2010-5180, v. 1.1, USGS, 2011. https://pubs.usgs.gov/sir/2010/5180/
11. Corkhill, Remick, Norton and Nelson, Prescott Active Management Area 2000-2001
Hydrologic Monitoring Report, ADWR, 2001.
https://new.azwater.gov/sites/default/files/HMR_PrescottAMA_00_01.pdf
12. Pool, D.R. Simulation of Groundwater Withdrawal Scenarios for the Redwall-Muav and
Coconino Aquifer Systems of Northern and Central Arizona, Scientific Investigations Report
2016–5115, USGS 2016 https://pubs.usgs.gov/sir/2016/5115/sir20165115.pdf.
26 Prescott AMA Groundwater Flow Model Update
2021You can also read