Assessing Environmental Criteria to Support Forest Connectivity
←
→
Page content transcription
If your browser does not render page correctly, please read the page content below

Assessing Environmental Criteria to Support Forest
Connectivity
Ivan Vanderley-Silva ( ivanvanderley@yahoo.com.br )
UFSCar: Universidade Federal de Sao Carlos https://orcid.org/0000-0002-8756-2422
Roberta Valente
UFSCar: Universidade Federal de Sao Carlos
Research Article
Keywords: Landscape ecology metrics, land-use/land-cover, and urban sprawl
Posted Date: June 18th, 2021
DOI: https://doi.org/10.21203/rs.3.rs-465496/v1
License: This work is licensed under a Creative Commons Attribution 4.0 International License.
Read Full License
Page 1/41
Abstract
Establishing forest connection in landscapes under urban sprawl is essential for maintaining the
ecological processes and ensuring biodiversity conservation. However, the major challenge is
incorporated the ecological network in the land-use/land-cover planning. This way, the main objective of
the study was the evaluation of environmental criteria for prioritizing areas to obtain forest functional
connectivity in a landscape subject to the urban sprawl. The second objective was to understand how the
criteria are associated with the structural forest attributes represented by traditional landscape ecology
metrics. The criteria were defined through the literature review, representing the landscape characteristics
as the topographic, conflicts, and biotics. The metrics used to characterize the forest structure were
perimeter, shape index, and distance to the nearest neighbor. They were generated to a selected group of
forest remnants, which represent the landscape forest structure. Sampling the criteria and forest
fragments maps (i.e., different maps representing the metrics-values) through the hexagon network, we
assessed how the criteria are associated with the structural forest attributes. The statistical analysis used
to evaluate these sampled values were The Moran Global (Moran I) and Moran Local (LISA). We obtained
that the urban expansion process is diffuse, although it does not occur randomly in our landscape. The
criteria slope, TWI, distance from drainage network, distance from highways, distance from the low-
density urban area, and distance from forest patches have characteristics that support this process.
Furthermore, our results indicated a spatial autocorrelation among metrics and after, among metrics and
these criteria. Also, we obtained that the external influences on the fragments did not occur randomly and
that the criteria act on the landscape. This way, through these criteria, we can identify regions where it is
possible to have the persistence of forest fragments, even though in places under the impact of urban
sprawl.

Highlights
    The environmental criteria analysis indicates a diffuse urban expansion process that does not occur
    randomly.
    Landscapes under urban sprawl have criteria, having value ranges related to forest fragments
    presence.
    The landscape structure can be represented by environmental criteria that reveal the forest
    fragmentation effects.
    Environmental criteria support the evaluation of function forest connectivity

Introduction
The urban sprawl has been worldwide discussed in terms of its negative consequence as the loss of
natural habitat, forest fragmentation, and increased barriers to gene flow, that has influenced the
ecological connectivity of different species (Mimet, Clauzel and Foltête, 2016; Semper-Pascual et al.,

                                                   Page 2/41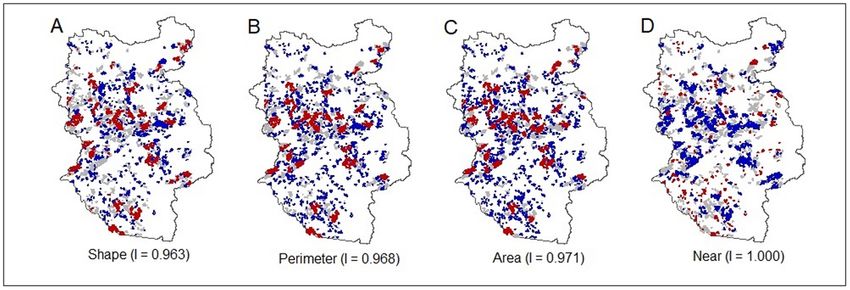
2018; Gavrilidis et al., 2019; koprowska, Laszkiewicz and Kronenberg, 2020), one of the greatest threats to
biodiversity conservation. (Scriven et al., 2019; Madadi et al. 2017).

Some studies showed that these consequences have already affected more than 50% of the worldwide
landscapes (Watson, 2016; Tucker et al., 2018; Tabor et al., 2019) and, that less than a third of the
Protected Areas are properly connected (Saura et al., 2017).

The concern is ultimately motived by uncertainties about know how human activities can affect the
ecosystem services functions (Dupras et al., 2016), as well as the maintenance of ecological processes,
species dispersion, and the specimen persistence in an altered environment (Yabsley et al., 2016).

When the dispersion is low, the damages in the ecosystem services include changes in the carbon
production and storage rates (Ziter, Bennet and Gonzalez, 2013), less resistance of communities to
environmental fluctuations (Isbell, et al., 2015), causing variation on the population and in the aggregated
biomass (Balvanera et al., 2014).

Although, an important point related to the connectivity is that the decrease in its performance is not
always linear to habitat loss and/or forest fragmentation (Thompson, Rayfield and Gonzalez, 2017;
Semper-Pascual et al., 2018). This is due to the presence of central habitats in the landscape dynamics or
the existence of new paths to the species movement (Almenar et al. 2019), that can preserve the
functioning and stability of the ecosystem (Wang and Loreau, 2016). Still, in function to the pattern and
dispersion capacity of individuals (Bergsten and Zetterberg, 2013), who interact, in environments under
urban sprawl, with the connectivity to support viable communities, which in turns can suffer from genetic
selection and changes in allele frequency (Edelsparre, Shahid and Fitzpatrick, 2018).

According to Perky et al. (2018) the urban sprawl impacts in different ways distinct species, due to their
intrinsic resilience ability. This way, the functional connectivity modeling can be skewed if it is only based
on one species (Almenar et al., 2019), as well as overestimated if we do not consider the response time to
habitat loss and deforestation (Semper-Pascual et al., 2018).

In this context, contemporary models and indices have also been developed not only based on species,
but including environmental criteria, indicators, and/or parameters. An example is models based on the
graph theory as the least-cost path analysis (Matos et al., 2019; Tarabon et al., 2019; Ribeiro et al. 2020)
and circuit theory (Pelletier et al., 2017; Merrick and Koprowski, 2017; Koen, Bowman, and Ellington,
2019), as well as hybrids between least-cost path analysis and circuit theory (Monaco et al., 2020).

Other studies have been supported their decision based mainly on environmental criteria (Valente, Petean,
and Vettorazzi, 2017; Torrella et al., 2018; Balzotti et al., 2020), considering their ability to represent the
landscape characteristics. Loro et al. (2016) mentioned that methods based on environmental criteria can
introduce substantial variability in the evaluation process.

According to Valente, Petean, and Vettorazzi (2017), the criteria represents the critical characteristics
related to the study objective. This way, the adequate criteria set selection is essential to obtain robust
                                                   Page 3/41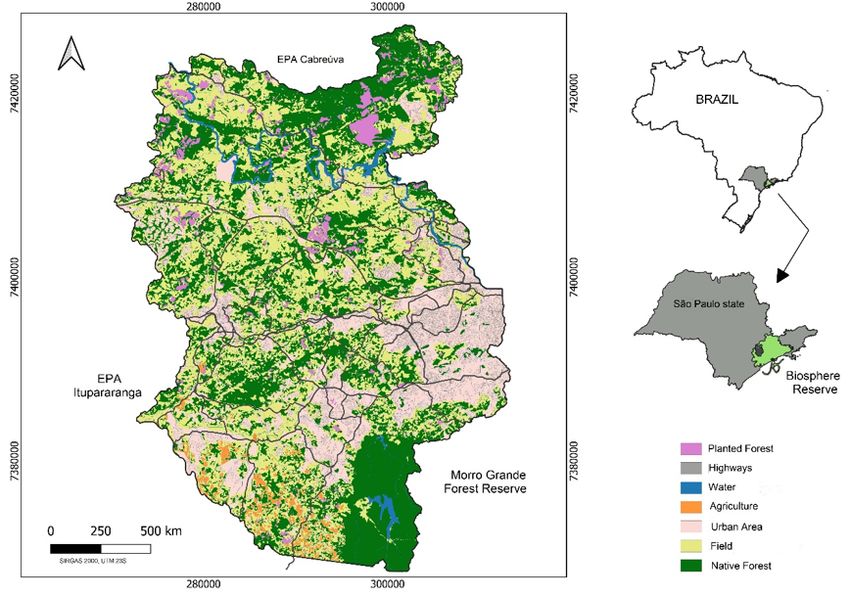
results, independently of the method that will be used in the analysis (Vettorazzi and Valente, 2016).

Zeller, McGarigal, and Whiteley (2012) pointed out that several criteria can support the connectivity
analysis as relief shape, proximity among forest native remnants, drainage network, and urban areas.

Loro et al. (2016) highlighted the proximity among remnants because is it related to the species
movement in the landscape, considering that variation in the proximities can modify the dispersion
resistance of the species. Acevedo, Real, and Gortázar (2011) suggested a criterion, that represents an
effective distance from disturbance sources, considering their impact on the functional connectivity. Pays
et al. (2012) also indicated the relief shape as an important criterion since some animals show a
preference for certain characteristics of the landscape relief.

Ibanez et al. (2014) emphasized the influence of environmental conditions for the connectivity,
considering its correlation with landscape structure.

Conversely, we have the traditional landscape metrics, which have been used to evaluated changes in the
composition and configuration (i.e. structure) of the landscape (McGarigal, 2013). For decades, the
metrics were used to study processes as habitat loss and forest fragmentation (Cheung, Brierley;
O’Sullivan, 2016) as well as to evaluated impacts on abiotic and biotic functions (Lausch and Herzog,
2002).

Basing in the landscape metrics, Uezu et al. (2005) studied the importance of fragment size and
connectivity (structural and functional) on the occurrence and abundance of bird species. The study
exemplified the potential of metrics to characterize the landscape structure, supporting analysis related to
processes as well as their ability to provide information, when they are associated with other methods.

Concerning these abilities, Schindler et al. (2013) and Senzaki and Yamaura (2016) cited the metrics as
an adequate tool for the identification of forest areas with high conservation value. In the same way, the
representativeness of the forest fragments metrics were reported to evaluate the species dispersion and
abundance pattern (Economo and Keitt, 2010), a species-area relation (Hammus and Von Nümers, 2008),
the herbivores aggregation in the herd (Borthagaray, Arim and Marquet, 2012), and the plant-pollinator
interaction (Van Geert, Van Rossum, and Triest, 2009).

The major challenge is the selection of an adequate metric set, which can be done through a literature
review (Frank et al., 2013; Lechner et al., 2013). In the case of ecological analysis prevails the metrics of
area, edge, and connectivity (Cheung, Brierley and O'Sullivan, 2016; Senzaki and Yamaura, 2016;
Schindler et al., 2015), that reflect the forest fragments characteristics in terms of biodiversity (Pereira et
al., 2013).

In this context, the main objective of the study was the evaluation of environmental criteria for prioritizing
areas to obtain forest functional connectivity, in landscape subject to the urban sprawl. The second
objective was to understand how the criteria are associated with the structural forest attributes,
represented by traditional landscape ecology metrics.
                                                    Page 4/41
Newbold et al. (2015) cited that the maintenance of forest functional connectivity is an important
component for biodiversity conservation, in landscapes under urban sprawl, especially when the
ecological network is incorporated into the land-use/land-cover planning (Huang et al., 2019; Grădinaru et
al., 2017). The importance of theme has been highlighted in the literature, basing on results that showed
the connectivity analysis can support the effectiveness of forest conservation schemes (Ayram et al.,
2016; Matos et al.2019; Almenar et al., 2019).

Material And Methods
2.1 Study Area
The landscape studied (Fig. 1) is in the Green Belt Biosphere Reserve (GBBR) of São Paulo (SP), which is
one of the largest cities in the South America (IBGE, 2021). The city has suffering with the urban sprawl,
resulting in pressure in its surrounding area, in terms of conversion to urban use and to agriculture.

The GBBR-SP region is an example of this situation, considering that its agricultural production has as
main destination São Paulo city. This way, the urban sprawl occurs in areas originally occupied by
Atlantic Forest, affecting ecosystem services (ES) (González-García et al., 2019; Yuan et al., 2019) as the
biodiversity (Newbold et al. 2015; Tabaron et al., 2020), water quality (Mello et al., 2020; Klink, Aversa, and
Empinotti, 2019) and the forest connectivity (Almenar et al., 2019). Lembi et al. (2020) pointed out also
the loss of matrix permeability as another negative effect of the urban sprawl.

Studies have been conducted to minimize these negative effects (Newbold et al. 2015; Ayram et al., 2016;
Ribeiro et al. 2020); and we focus on one SE, that is forest connectivity, thinking in the importance of the
GBBR areas. According to Unesco (2019), in these areas the human and environmental conflicts should
be solved through the efforts of the local and scientific communities, aiming at the sustainable use of
natural resources.

The study area is characterized by an urban-rural transition, however, has 34.9% of its area (165099.25
ha) covered by Atlantic Forest remnants belongs to Ombrophilous Dense Forestry (IBGE, 2012). Some
remnants belong to Protected Area as the Cabreúva Environmental Protection Area (EPA) in the North,
Morro Grande Forest Reserve (FR) in the South, and Itupararanga EPA in the Southwest (Fig. 1). In this
scenario, the studied area was considered of extreme importance for the biodiversity conservation and to
design ecological corridor (MMA, 2019).

Other remnants are scattered through the matrix composed predominantly by pastures (i.e. anthropic
fields) and urban areas, that occupy 36.3% and 22.4% of the total study, respectively. Furthermore, in the
area there is 3.4% of planted forests (Eucalliptus sp), 1.4% of farmlands, 1.0% water and 0.6% of roads
(highways and rural roads), as show Fig.1

 2.2 Conceptual Model
                                                   Page 5/41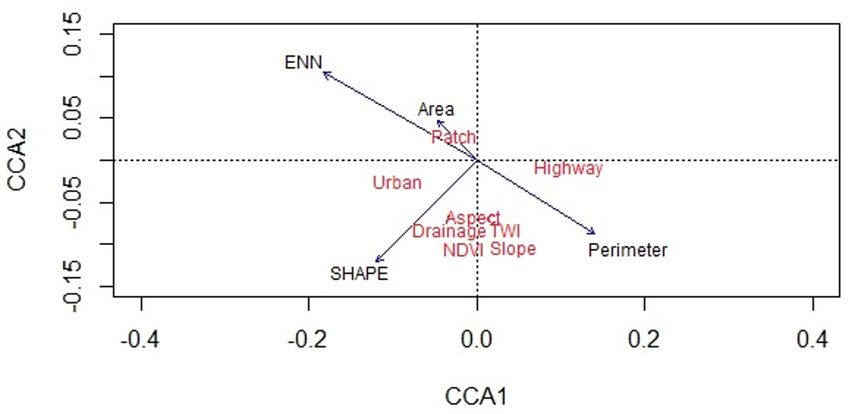
The conceptual framework model (Fig. 2), for our study area in GBBR-SP, includes the environmental
criteria and landscape ecology metrics at fragment level, that were spatialized in the Geographic
Information System (GIS).

Environmental criteria were group according the landscape characteristic as follow:

    Topographic: slope, aspect, and Topographic Wetness Index (TWI).
    Conflicts: distance from highways, distance from drainage network, and distance from low-density
    urban area; and
    Biotics: Normalized Difference of Vegetation Index (NDVI) and distance from forest patches.

The database used to produce the criteria as well as the justification of them, in the context of
connectivity analysis, will be described in the section below.

The landscape metrics used to characterize the forest structure were perimeter, shape index, and distance
to the nearest neighbor. They were generated to a selected group of forest remnants, which represent the
landscape forest structure.

Sampling the criteria and forest fragments maps, (i.e. different maps representing the metrics-values)
through the hexagon network, we assessed how the criteria are associated with the structural forest
attributes. The statistical analysis used to evaluate these sampled values were The Moran Global (Moran
I) and Moran Local (LISA) (Fig. 2).

 2.3 criteria selection
The criteria were defined through the literature review in the period from 2015 to 2019, using platforms as
Scielo, Scopus, Web of Science, and Google Scholar. We defined a combination of search terms with
sufficient comprehensiveness to maximize the finding of environmental criteria. Since they represented
the integration of forest functional connectivity and conservation principles.

The most mentioned criteria, despite differences in nomenclatures, were related to forest cover,
topography, water resources, urban area, highways, and soils (Table 1).

Table 1 – Environmental criteria for connectivity analysis, that were select from literature I the period from
2015 to 2019, for the study area in the GBBR-SP, Brazil.

                                                  Page 6/41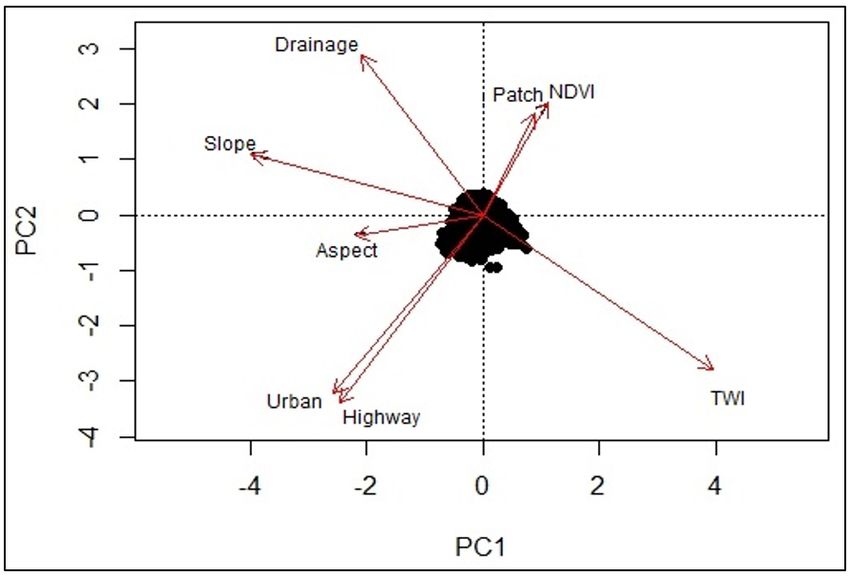
The selection of the environmental criteria, among the most cited, was based on the study area
characteristic, considering that is a landscape under urban sprawl; the main justificative of the author to
use a criterion; and the criterion representativeness in terms of environmental characteristics.

This way, the selected criteria were slope, aspect, Topographic Wetness Index (TWI), distance from
highways, drainage network, distance from low-density urban areas, Normalized Difference of Vegetation
Index (NDVI), and distance from forest fragments. As mentioned in the conceptual model section, they
were group in topographic, conflicts, and biotics.

The first three criteria and the drainage network were produced from the Digital Elevation Model (DEM) of
the study area, which was produced from the Shuttle Radar Topography Mission (SRTM) model
(https://earthexplorer.usgs.gov/). The 10-m contour lines were extracted from the SRTM model (30m-
spatial resolution) and interpolated (nearest neighbor method) with a 20m-spatial resolution, to the DEM
integrate our geographic database. In the GIS environment, watershed and slope/aspect plug-ins were
used to generate these criteria.

The other criteria were produced from features (i.e. highways, low density urban areas, and forest
patches) extracted from the land-use/land-cover map (Fig.1), which resulted from a supervised
classification (Maximum Likelihood algorithm) of CBERS-4 satellite images (20m-spatial resolution). The
map presents 90% accuracy, according to a field verification (in the 2019 year) based on 140 points
randomly stratified across the study area.

This way, we obtained the Euclidian distance from highways, low-density urban areas, and forest patches,
calculating also the NDVI from the last feature. The low-density urban areas are small urban

                                                  Page 7/41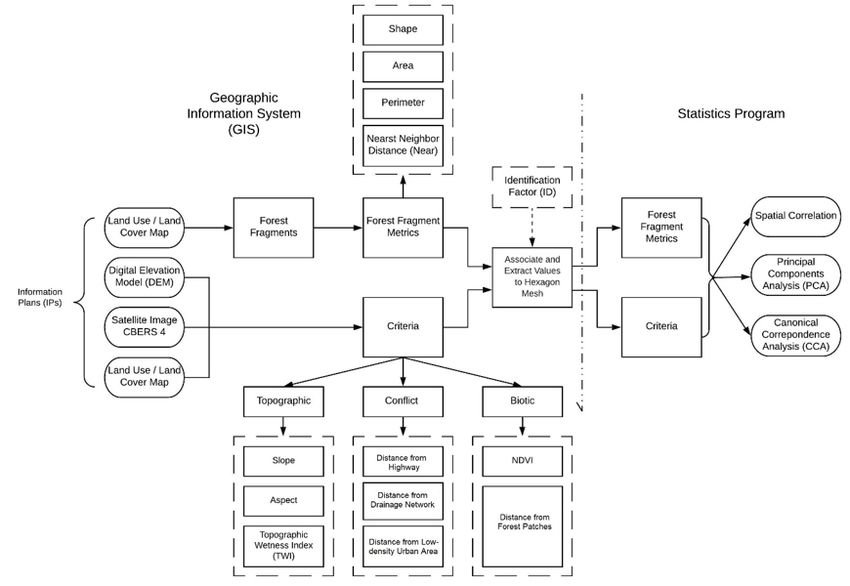
agglomerations or farms characterized by a horizontal, dispersed, and polycentric growth. Conversely, the
highly dense urban areas were classified as constraints, considering their low quality for support he
functional connectivity, have a compact, vertical and monocentric shape (Ojima, 2007).

The NDVI index considers the relation between the energy reflected in the red and near-infrared
wavelengths to represents the vegetation biomass. The index varies from -1 to +1, with the last value
indicating vegetation denser, moist, and well-developed (Melo et al., 2011). In this context, we used NDVI
to represent the forest vegetation vigor (Anatoly, Peng, and Huemmrich, 2014).

The principal component analysis (PCA) was used to explain the organization and variability of criteria in
the landscape.

PCA is a linear method for the exploratory data analysis of multidimensional statistical series, that aimed
the reduction of variables (no significant) without information loss (Borcard, Gillet, and Legendre, 2011).

2.4 Forest patches metrics
The metrics used to characterize a selected group of patches, that represented the landscape forest
structure, were area, perimeter, shape index, and distance to the nearest neighbor. According to Pereira et
al., 2013; Mello, Toppa and Cardoso-Leite, 2016; Palmero-Iniesta et al., 2020 these metrics also support
the forest patches description in terms of connectivity and conservation.

 Firstly, we divided the forest remnants into size classes, having the prerogative that the forest area
represented by these classes should be similar. The analysis guaranteed the representativeness of
patches with different sizes, excluding the specifics categories influence as those that occupied a small
area or that contained a large area concentrated on restricted patches. This way, the actual condition of
the landscape under study was represented, as illustrated in Fig. 1.

 After, the patches were identified individuality in a map, that was used to calculate the metrics through
the Vector Based Landscape Analysis Tools Extension (V-Late), in the GIS environmental.

The metrics values were associated with their respective patches to compose maps, representing their
perimeters, shapes, and distances to their nearest neighbor.

2.5 Criteria and forest structure Evaluation
We assessed how the criteria are associated with the forest patches metric (representing the structural
forest attributes) based on a hexagon network sampling (Fig. 3).

Through this network, we sampled the maps of criteria and metrics, considering hexagons that covered
more than 50% of the patch size (Fig. 3.) As the size of hexagon-unit was 2 ha, at least two sample
points by patch were obtained.
                                                  Page 8/41
These sampled values supported the statistical analyses. Using Moran Global (Moran I) (Moran, 1950)
and Moran Local (LISA) indexes (Anselin, 1995), we evaluated the spatial autocorrelation of the criteria,
metrics, and finally among the criteria and metrics.
The first index varies from 0 to +1, indicating a direct correlation, and from 0 to −1, that reflected an
inverse correlation. Otherwise, LISA asses the autocorrelation degree, weighted by geographic proximity
and it indicates regional grouping.
For the two indexes, the significance level considered was p < 0.05, that was calibrated for the Euclidean
distance from the average point of the sample space.
The canonical correspondence analysis (CCA) tested the hypothesis that the metrics can indicate the
criteria importance rank to the forest functional connectivity, revealing these criteria influence under the
forest patches.
The vegan package (R software) supported the canonical correspondence analysis, after the pre-
verification of multicollinearity for values greater than 5 (James et al., 2014) and the validation of product
with p < 0.05 through permutation and ANOVA tests.
Results
The environmental criteria, selected from the literature review (from 2015 to 2020), considering terms as
forest functional connectivity, connectivity and forest conservation, and landscape subject to urban
sprawl, among others are listed in Table 2.
Page 9/41Table 2
– Criteria importance for forest functional connectivity analysis, in the forest conservation context,
according to literature review.
Feature Criteria Importance
Topographic Aspect Aspect has an effect on the diversity, regeneration, and structure of
tropical and temperate forests worldwide (Wagner et al. 2020, Tiwari et
al. 2020, Ou et al., 2020, and Hollunder et al. 2021). In the same way, the
criterion can reveal sensitive places from a topographic perspective, that
are especially the faces with minor moisture retention ability. Faces that
should be cover by native vegetation, aiming to avoid problems as soil
erosion (among others). This way, we think in the prioritization of these
sensitivity regions to obtain forest functional connectivity, as a way to
the maintenance of landscape feature.
Slope It is the main criterion related to soil erosion, considering (Valladares et
al., 2012).
Since high slopes reduce human access, the criterion is an important
physical attribute for forest regeneration. on the other hand, sloping land
has less water and soil retention capacity, which can reduce the forest
regeneration rate. These reasons could explain why elevation has a
positive effect on the change rate of the forest cover, while the
interaction between slope and elevation can have a significant negative
effect (Li et al., 2013).
Regions associated with high levels of slope have been indicated as
susceptible to erosion processes, the criterion is highlighted in the
literature related to soil erosion (Haidaraa et al. 2019)
TWI Wetlands are important ecosystems as they provide habitat for plants
and animals and improve water quality (Guo et al., 2017). The
topographic wetness index (TWI) is used to identify the saturated areas
and to distinguish the reliefs where there are well-drained soils (O’Neil,
Goodall and Watson, 2018).
For this reason, topography shapes and restricts vegetations, causing a
number of environmental conditions that are favorable to many
communities and to the ecosystem process. This allows for the
detection of patterns of species with different resource habitat
requirements as correlated with attributes such as river valleys,
mountainous regions and other varied topographies (Czarnecka, Rysiak
and Chabudzinski, 2017).
.
Biotic NDVI NDVI is a robust metric for estimating forest cover and its development
status, as it produces a strong estimate of the chlorophyll concentration
in the leaf (Nagai et al., 2010).
The richness of species increases with the vegetation structural
heterogeneity and biomass. More complex stretches provide more
resources and opportunities for microhabitat segregation (Wood et al.,
2013).
Page 10/41Feature Criteria Importance
Distance The distribution pattern of mature forests, combined with the
from disturbance, and replacement of old forests, can influence the
Forest dispersion of species, movement and processes at the population level
Patches and define whether species adapt or perish in altered forest ecosystems
(Ruffell, Clout, and Didhan, 2017).
Habitat reduction, with subsequent increased edge effects, changes the
behavior of individuals and habitat use patterns, also reducing
movement between fragments (Ramesh, Kalle and Downs, 2015).
Proximity to nature reserve areas also affects how people perceive the
importance of forest conservation. As they move away from core areas,
the opportunities and level of anthropic disturbance increase (Deng et
al., 2015).
Conflicts Distance In the urban expansion area, there is an increase for work and housing, a
from the rapid regional economic development (Shiferaw et al., 2019), and a
low- greater pressure on habitats and systemic services provided (Yuan et al.,
density 2019).
urban
area In particular, forest fragmentation caused by waterproofing surfaces
threatens species and habitat (McDonald; Marcotulio and Guneralp,
2013). These threatens effect on the mobility of organisms, being a
central factor in the ecosystem services provision (Mitchell, Bennett, and
Gonzalez, 2013).
The reduction in connectivity affects the regulation of ecological flows,
which determines the effectiveness of preserved natural areas, observed
through changes in focal species behavior and in the habitats
preference (Ayram et al. 2019).
Distance In Brazil, environmental legislation determines a minimum reserve of
from riparian zone along perennial watercourses within private properties or
Drainage public areas (Brasil, 2012).
Network
This riparian vegetation continues offers an opportunity to establish an
integrated network of forest remnants, which can serve as habitat and
connectors at the regional or local scale, especially when reduced as
sources that cause environmental degradation (Zimbres et al., 2018).
The riverside areas are dynamic, biologically rich ecosystems, with a
high content of nutrients, humidity and the presence of unique
microclimates for species of invertebrates (Ramey and Richardson,
2017) terrestrial mammals (Zimbres et al., 2018) and birds (Mitchell et
al., 2018).
Distance Disturbances caused by highways increase the forest patches edge
from effects, decreasing the fauna species presence (Avalos and Bermúdez,
Highways 2016). In addition, highways contribute to increased landscape
fragmentation, as they cut through continuous areas with high
connectivity and create barriers to movement between habitats
(Carvalho et al., 2015).
Page 11/41The group represents landscape features relating to their topography and biotic components that can
support the prioritization of areas to obtain forest function connectivity in the forest conservation context.
They also have characteristics representing conflicts for this objective, which can threaten the process
(Fig. 4).
This way, the main reason or importance that drove the authors (from the literature review) to include the
criteria in their studies are presented in Table 2.
According to the slope criterion (Fig. 4A), approximately 91% of the study area showed declivity at most
20%. Nearly 47% of this total presented at most 8% of declivity and they are concentrated in the South
region of the study area (Fig. 4A).
This concentration was also appointed by the LISA index, that classified the region by low-low, indicating
the spatial proximity between lowest slope values (Fig. 5A).
In this context, the slope was the criterion associated with the higher value of Moran Index (I = 0.457)
among the topographic criteria (TWI = 0.190 and Aspect = 0.292), indicating that its features have a
spatial distribution significant positive (I > 0) (Fig. 5 ABC).
According to the LISA index results for the criterion, the study area was classified in 20% as high-high and
21% as low-low, having significant spatial autocorrelation.
The TWI criterion (Fig. 4B) indicated the South region also associated with the high moisture-retention
ability, having values varying from 12 to 27, that occupy 16% of the study area.
However, 62,1% of TWI values varied from 5 − 12 and they are spread across the study area, in which
values between 5–7, 7–9, and 9–12 represent 42.8%, 14.3%, and 5.1%, respectively. The TWI values
greater than 27 totaling less than 1% of the total, occurring only in the North (Fig. 4B).
Reflecting this spatial pattern of the most features distributed randomly across the landscape, the Moran
Index for TWI was 0.190, which was the lowest value obtained among the criteria (Fig. 5B).
In the same way, the LISA index did not identify a significative regional grouping (Fig. 5B), showing only a
tendency in the Central-North region of lowest TWI values, which were classified as low-low (with 15.4%
of spatial autocorrelation) (Fig. 5B). However, this tendency is not statistically significant, taking into
account the great variability of the criterion features.
The Central-North region was associated with relief Heavily-Undulating (20–45%) and Hilly (> 45%) (Fig.
4AB), having a spatial distribution significantly positive (Fig. 5C). As mentioned, the LISA index indicated
groupings in those regions, that were classified as high-high because of the high spatial correlations
between near features (Fig. 5C).
The LISA index also showed groupings for the aspect criterion in the Central-North region classified as
high-high (16.2%) and low-low (16.3%) (Fig. 5C), considering the predominance of faces oriented for east-
Page 12/41west direction (Fig. 4C).
However, Fig. 4C illustrated these faces spread across the landscape and interacting with others, resulting
in a low value of Moran Index (I = 0.292), as we observed for TWI. The east-west faces occupied 65.3% of
the landscape and north-south faces 34.7% (Fig. 4C).
Similarly, the distance from the drainage network showed its watercourses spread by the landscape (Fig.
4D), obtaining the Moran index of 0.477. The value was superior to the TWI and aspect, indicating a
positive autocorrelation in the spatial distribution of the watercourses, although with a low level, having
only 18% classified as high-high and 23% as low-low (Fig. 5D).
The maximum distance from the drainage network was 800m, although values at most 200m from
watercourses represented 56% of total area and between 200-400m approximately 36% (Fig. 5D).
Basing on the low-density urban areas and highways, the maximum distances obtained were,
respectively, 8200 m and 16482 m, mainly in the function of the values present in the extremes of North
and Southeast (Fig. 4E and Fig. 4F).
This way, those features presented more influence in the Central-to-South-west portion of the landscape,
where we can also observe the great urban areas, which were classified as a restriction to functional
connectivity because of their low quality. Due the presence of these conflicts features the region was
classified as low-low (LISA index), showing significant spatial autocorrelation of 41.5% for low-density
urban area and 41.4% for distance from highway.
Consequently, this region has significant positive spatial autocorrelation with regions classified as high-
high represented 14.0% (low-density urban area) and 16.8% (distance from highways) (Fig. 5E and Fig.
5F). However, the spatial autocorrelation of distance from highway is slightly higher than the distance
from low-density urban areas, considering their Moran index values of 0.992 and 0.976.
The urban areas and highways influenced on the forest patches spatialization through the landscape,
that presented 11268 m as the maximum distance among them (Fig. 4h).
The criterion showed Moran index value of the 0.992, that reflects the high and positive correlation
among the distances from forest patches. Thus, the LISA index showed region grouping (with high
autocorrelation degree) classified as high-high (29.2% spatial autocorrelation) (Fig. 5h) and located in the
central region of the landscape.
The high-high class indicates place associated with a high probability to occur the great distance values,
near other places in the same condition. For the study, in the same region that the LISA index indicated
the low-low (38.6% of spatial autocorrelation) groupings for the distances from low-density urban areas
and highways (i.e. concentration of places near to the conflicts features).
Page 13/41This way, the spatial autocorrelation analysis indicated that the great distance from the forest patches
occurred in places occupied by urban areas and highways.
Finally, Fig. 4g showed the NDVI index, having its highest values associated with the largest forest
patches.
Although, its Moran Index was 0.50, indicating that the criterion has a minor autocorrelation degree than
the criterion distance from the forest patch.
Figure 5g illustrated the groupings detected through the LISA analysis, that were classified as high-high
(23.7% of spatial autocorrelation) and were in similar regions of the distance from forest patches
criterion. However, the spatial autocorrelation of this criterion is smaller than the last.
Relating to the criteria variability, PCA analysis explained 42.58% of the data (Fig. 6) According to the first
axis the slope decreases as the distance from the drainage network and aspect values also decrease.
Conversely, TWI values increase (Fig. 6).
Figure 6 showed in the second axis that, as the forest patches are coming toward the low-density urban
areas and highways, there is a decrease in the distance value among forest patches and the NDVI index.
3.2. Forest structure evaluation
The study area has 57665.75 ha covered by 10428 Atlantic Forest remnants with sizes varying from 0.04
ha to 11248.31 ha.
According to Table 3, 92.5% of these remnants have less than 5 ha, however, they represented only 5.9%
of the total native forest area.
Page 14/41Table 3
Distribution of patches by size classes and the forest metrics values (mean and standard deviation)
applied to forest structure evaluation of the study area in the GBBR-SP (Brazil).
Class NP Area Forest patches metrics
(ha) (%) (%) AREA (ha) PERIM (m) NEAR (m) SHAPE
300 0.2 50.0 1436.24 (± 92797.11 (± 0.00 (± 0.00) 6.50 (±
2689.73) 107803.9) 2.23)
Where: NP = number of forest patches; AREA - habitat size; PERIM - perimeter; SHAPE - shape index;
NEAR - distance of the nearest neighbor edge; * mean value; and **SD: standard deviation value.
Otherwise, we observed that 0.2% of the total patches (i.e. 21 patches) occupying 50% of the total forest
area. Most of these restricted group belongs to three Protect Areas, located inside the study area i.e.
Cabreúva EPA and Morro Grande FR (Fig. 1).
This way, the pattern of forest patches that are distributed through the landscape studied have sizes
varying from 5 ha to 300 ha. As predefined for this study, their size classes are occupying similar
percentage of the native cover (Table 3).
The remnants belonging to the 5–30 ha class represented 5.2% of the total forest patches, while the class
with 30–75 ha represented 1.3%, the class with 75–170 ha represented 0.6%, and the patches with 170–
300 ha accounted 0.3%. Their mean patch sizes were, respectively, 12.32 (SD = ± 6.37), 47.00 (SD = ±
13.57), 105.98 (SD = ± 24.89), and 244.71 (SD = ± 28.74), with the standard deviation values together
increases the mean size (Table 3).
Similarly, the PERIM and SHAPE metric values (mean and SD) increased as the patch sizes were
increased (Table 3). The mean metrics values were, respectively, 2857.48m and 2.05 (5–30 ha),
7814.90m and 2.85 (30–75 ha), 13933.64m and 3.38 (75–170 ha), and 26434.43m and 4.40 (170–300
ha).
Page 15/41Conversely, the NEAR metrics value (mean and SD) decreased as the mean patch size increased.
According to Table 3 the distance among forest patches were 107.67m (5–30 ha), 57.57m (30–75 ha),
38.88m (75–170 ha), and 21.56m (170–300 ha).
According to the Moral Index (Fig. 7), the metrics presented significant and positive spatial
autocorrelation. Although, the spatial autocorrelation of NEAR (1.000) was slightly higher than the AREA
(0.971), PERIM (0.968), and SHAPE (0.963).
Consequently, the LISA index indicated groupings in regions with spatial proximity between similar
characteristics (Fig. 7).
In the case of the NEAR metric (Fig. 7), we can highlight groupings classified as low-low in the central
portion of the study area. They represented the concentration of areas with high distance values from
forest patches.
For the other metrics, we can highlight the small low-low groupings, representing the concentration of the
largest patches, characterized by the greatest perimeters and irregular shapes (Fig. 7b-d).
3.3. Criteria and Forest Structure Analysis
The patches, representing the forest structure of the study area, were associated with criteria
characteristics, as described in Table 4.
Relating to the slope criterion, they were predominately associated with regions varying from 6.66-17%
declivity (Slope mean = 11.83%), that compound the 91% of the study area with declivity at most 20% (Fig.
4A). However, there is forest patches associated reliefs flats (Slopemin = 0.002%) as well as Heavily-
Undulating (Slopemax = 36.36%) (Table 4).
Table 4
Variability of criteria characteristics for the forest patches of the study area in the GBBR-SP, Brazil.
Param. Slope TWI Asp Drainage Urban Area Highway Patches NDVI
(%) (m) (m) (m) (m)
Min. 0.002 3.89 4.80 9.33 39.20 30.01 59.12 0.32
Max. 36.36 24.89 344.90 734.32 5843.357 13252.03 8542.66 0.69
Mean 11.83 7.08 177.03 199.27 829.44 1680.86 2440.01 0.58
SD± 5.17 2.27 70.67 126.48 878.10 1844.85 1671.40 0.03
Where: Slope = Slope; TWI = Topographyc Wetness Index; Asp = Aspect; Drainage = Distance from
Drainage Network; Urban Area = Low-Density Urban Area; Highway = Distance from Highways;
Patches = Distance from Forest Patches; NDVI = Normalized Difference Vegetation Index. Param. =
Parameter.
Page 16/41We defined the predominant pattern for the criterion based on its low standard deviation value. Table 4
also indicated TWI and NDVI in the same situation.
This way, regions associated with the forest patches showed TWI varying from 4.81 to 9.35 (TWImean =
7.08). Values that integrated this more range frequently of moisture-retention ability were observed in the
landscape (Fig. 4B)
Relating the aspect criterion, the mean value indicates a tendency of the patches to be placed on the East-
West face (Aspectmean = 177.03). Although, the high variation value of SD (Aspectsd = 70.67) cannot
support the pattern definition for those regions. Especially, when we consider its spatial pattern of the
majority features distributed randomly across the landscape, which was indicated by the Moran Index (I =
0.292) and the LISA index (Fig. 4e 5C).
Otherwise, we can affirmative that the great part of forest remnants is at mostly 325.75 m from the
watercourses (drainagemean= 7.08) (Table 4), that in 92% of the landscape are at closest 400 m from the
rivers (Fig. 4D).
The forest patches also presented mean distance from the low-density urban area and highways of
829.44 m (SD: ± 878.10m) and 1680.86 m (SD: ± 1844.85m) (Table 4), respectively. The conflict criteria
maps (Fig. 4EF) indicated those features spread by the landscape with 71% of urban areas and 14% of
road at most 2000 m from the forest remnants.
However, these criteria maps presented the highest spatial autocorrelation (Moran Iurban:0.976 and
Moranhighway I:0.992) values among the criteria with groupings (LISA index) in the landscape Central
region, representing the concentration of this features. The LISA index also indicated groups far from the
central regions, that were associated with high distances from the features, explaining these Standard
Deviation values (Table 4).
According to Table 4, the forest patches showed mean distance among then of 2440.01m (SD: ± 1671.40
m). As the last two criteria, the mean values and standard deviation values reflects the presence of the
patches through the landscape (Fig. 4g). The same way, the criterion presented the highest spatial
autocorrelation values (Moran I: 0.992) among the criteria, supporting the concentration of remnants in
same regions of the landscape. Where the NEAR metric (Table 3) indicated values varying from 21.56 m
to 107.67 m for patches grouped in similar size classes. Still, the minimum distance indicated in Table 4
was 59.12 m.
This way, the criterion reflected the forest patches scattered across the landscape, having a mean
distance among them of 2440.01 m, but with some remnants near to each other (Dist_patchmin =
59.12m).
The mean NDVI index of these patches varies from 0.55 to 0.61 (NDVI mean=0.58), which was the minor
range of SD, among the criteria (Table 4). We obtained these values based on a hexagon network
Page 17/41sampling, obtaining the NDVI values inside of the patches.
The criterion map presented Moran index of 0.500, indicating these small groupings. However, for the
landscape prevailed its mainly characteristics, that is the low spatial autocorrelation (Fig. 4h)
Concerning the Canonical correspondence analysis (CCA), Fig. 8 illustrates that the forest patches
metrics explain in 84.10% the criteria ordering.
The data variability was explained in 66% by the axis 1 and 18.10 by the axis 2. Through the first, we
observed the greatest influence of the metrics NEAR and PERIMETER. While in the second, the main
ordering variables were SHAPE and NEAR. However, the area variability was not significant (Fig. 8).
The CCA analysis (Fig. 8) also indicated that the forest patches perimeters values increase as the
distance value from the highways increases too. Conversely, decreasing the distance from the low-density
urban areas decrease, the distance among forest patches (NEAR) also decreases. Such happens because
low-density urban areas are composed of small urban agglomerations, which are scattered among the
forest fragments.
In the same way, the aspect, TWI, NDVI, slope, and distance from the drainage network showed variation
in their values associated with the metrics SHAPE and PERIMETER. The criteria values decrease when the
first metric decrease and the second increase.
Finally, we observed a no-significant relation between the metric AREA and the criterion distance from the
forest patches.
Discussion
The environmental criteria, that were selected through the literature review (Tables 1 and 2), represent
important characteristics of landscapes under urban sprawl, in the context of the prioritizing areas to
obtain forest functional connectivity (Curiel-Esparza et al., 2015; Lakicev et. al., 2016; Vettorazzi and
Valente, 2016; Santos, et al., 2018, and Mello et al., 2018).
The topographic criteria have effects on drainage capacity (Loritz et al., 2019; Hojati and Mokarram,
2016), forest composition and structure (Jucker et al., 2018), habitat reduction and isolation (Zhang, et al,
2018) and, consequently, on species patterns and richness (Li et al., 2019, Russo et al. 2016, and Keeley,
Beier, and Gagnon, 2016), which are essential conditions for measuring forest connectivity.
The distance from drainage network criterion indirectly brings the concept and the importance that
riparian forests have in maintaining forest connectivity (La Fuente, et al., 2018). Still, the question of the
flow among forest patches, that is compromised by the expansion of urban infrastructure, which
produces barriers in the landscape (McRae et al., 2012), habitat loss (Alamgir et al., 2019), and changes
in animal movement (Dickie et al., 2019).
Page 18/41As we mention in Table 2, the criteria have different importance for the functional connectivity and forest
conservation, representing a part of the process to obtain the main objective. Importance that has been
highlighted in the literature review. (Ayram et al., 2016, Fernádez and Morales, 2016, Unda and Etter, 2019
and Rincón et la., 2019).
This way, the criteria selection based on literature review brings robustness to the study, considering that
the set was previous evaluated in other researches. Also eliminates the subjectivity that we bring to the
project when experts opinion is required, considering the restricted number of people who contributes to
the process (Silveira et al., 2014, Valente et. al., 2017 and Mello et al., 2018).
In the case of criteria selected for the study area in the GBBR-SP, Brazil, they are not spatially correlated
and no have information overlap (Figs. 4 and 5). Thus, they can be used to prioritize areas to functional
connectivity.
Relating the main characteristics bring for the criteria, we obtain through the slope that 91% of the study
area showed declivity at most 20% (mean value of 11.83%; ± 5.17) (Table 4 and Fig. 4A). This
predominance of declivity value associated with the low variation of its standard deviation supports the
definition of a spatial pattern for the criterion, which was identified by LISA index (I = 0.457) (Fig. 5A).
Kane and John (2018) cited that topographical factors determine land-use decisions by local
communities, considering if the relief allows greater accessibility, there is an increase in deforestation
(Bax, Franscesconi and Quintero, 2016) and a critical potential for natural regeneration (Molin et al.,
2018).
Authors as Adams, Barnard and Loomis (2014) complement that tree growth and forest productivity can
be affected by slope, as well as for the TWI and aspect due to influences on runoff and wind exposure.
Thus, these factors allow the elaboration of forest connectivity models based on relief, as the species
have different habitat requirements (Czarnecka, Rysiak, and Chabudzinski, 2017).
Relating to TWI criterion, we obtained approximately 62.1% of the total area varying from 5–12, including
soils classified as well-drained (TWI of 4–5), moderately drained (TWI of 5–7), and poorly drained soils
(TWI of 7–12) (Li et al., 2006). Approximately 43% of this total is associated with the moderately drained
soils, contributing to classification of this areas as low-low by LISA Index (Fig. 5B), since they are showed
a scattered distribution through the landscape.
According to our results, regions associated with the 5–12 TWI range are occupied by forest fragments,
showing an average of 7.08 and a low standard deviation (± 2.27) (Table 4).
This way, TWI was characterized as a heterogeneous criterion, having Moran Index (I) of 0.190) as also
mentioned by Da Silva, Santos and Oka-Fiori (2019).
Similarly, the aspect also was defined as heterogeneous, having an I value of 0.292, however with a
standard deviation of ± 70.67, (Table 4). This criterion behavior occurs in our study area, even it
characterized by has a topographic divider of water flow and, having 65.3% of its area associated with
Page 19/41East-West slopes facing (Fig. 4C). These facings are associated with forest patches groups (LISA index,
Fig. 5C), which are the most regular patches of the landscape placed in faces with the lowest aspect
values (CCA analysis, Fig. 8). This can be explained by the predominance of anthropic land-use on the
east landscape face (Victor et al., 2004).
Aspect reveals a tendency to coming toward the slope values because they came from DEM. However, we
cannot establish a statistical and significant pattern between them. Adding the fact, that the criterion
does not present high spatial correlation, it cannot be considered adequate for a model of prioritization
areas, aiming the functional connectivity. This justified by the uncertainties in connectivity analysis, that
the aspect can bring to the model.
According to our results, the aspect is the only environmental criterion not adequate for prioritizing areas
to obtain forest functional connectivity, in landscape subject to the urban sprawl.
In the same way that the slope and TWI, the distances from forest patches and drainage network criteria
are essential to model of the prioritization of areas subject to urban sprawl (Fig. 4D).
According to these maps the average distance of forest patches from the water courses was 199.27 m,
with 56% of them at most 200 m. Considering that 36% of the total forest patches is between 200m and
400 m from the river and ± 126.48m as maximum value of deviation standard (Table 4), we obtained that
the majority patches (including the 56%) is from 325.75 m from a watercourse.
The distances from the drainage network criterion supported these results. Firstly, because the
watercourses are adequately distributed throughout the study area (I = 0.477) (Figs. 4 and 5D), that
resulted in a high spatial autocorrelation with a value superior to the topographic criteria. Second,
because the autocorrelation supported the clusters structuration in regions, where there were the minor
distances of the patches from watercourses (LL in LISA), as well as there were the highest (HH) distances
(Fig. 5D).
Observing the criterion results, we noticed that they were predominately supported by the relation with the
proximity to watercourses, which is the most important region for the main objective. This way, the most
adequate name for the criterion is proximity to the drainage network instead of the distances from the
drainage network. The name reflects the most important region for the criterion and becomes in
accordance with the literature, wherein have been considering riparian forest corridors as the most
suitable environment for forest connectivity (La Fuente et al., 2018, Zimbres et al., 2018).
While the watercourses are scattered through the landscape, the main features of the distance from the
low-density urban area and highways criteria showed concentrated, mainly, in its Central-to-South-west
portion (Fig. 4E and Fig. 4F). Due the presence of the great urban areas and roads, the forest patches
cluster of this regions presented spatial autocorrelation classified as LL (Fig. 5E; I = 0.976 and Fig. 5F; I =
0.992). It is noted in the Fig. 4E that a restricted area was created over consolidated urban
agglomerations, to analyze only the effects of urban sprawl on forest remnants.
Page 20/41However, the features of criteria (roads and urban) and consequently theirs respectively distance maps
showed an effect in the forest fragments spatialization. Around 71% of the forest patches are 2000 m
from an urban area and 86% of them are 2000 m from a road.
Anthropogenic disturbance in the landscape favors generalist species that are able to explore
environments, such as disturbed habitats (Magioli et al., 2019). Consequently, there is an increase in
conflict factors, such running over wildlife (Abra et al., 2021), predation of farm animals (McPherson,
Brown, and Downs, 2016), and animals lethal control (Blackwell, et al., 2016), being essential to define the
most beneficial actions of conservation planning and implementation (Abra et al., 2021).
Conflict features that showed high spatial correlation (PCA analysis, Fig. 6), indicating that they can
compose a unique criterion in future studies. Criterion that brings information related with the
connectivity, since that urbans areas and road have crossed landscapes subject to urban sprawl, which
have become one of the greatest threats to biodiversity conservation (Scriven et al., 2019; Madadi et al.
2017).
Kuang et al. (2014) cited that the urban expansion process and the relationship with forest fragmentation
is an effect of worldwide verification, carried out on the scale of megacities, and due to the increase in the
population living in urban areas (Angel et al., 2016). Thus, given that land use can occur in many different
patterns, metrics that consider the spatial arrangement of urban infrastructure can better explain
landscape fragmentation (Bar-Massada, Radeloff, and Stewart, 2014; Lin and Fuller, 2013).
Relating the importance to maintain the criteria distance from forest patches, our results indicate that we
have forest patches supporting the native fauna and flora, especially the group formed by patches with
sizes greater than 300 ha (Table 4 and Fig. 4H). As we mentioned, this group is formed by 21 patches,
belong to three Protect Areas, located inside the study area, and occupy 50% of the total forest area. Even
more, these forest patches are integrated with others, considering that the minor than they are scattered
across the landscape (Table 3).
According to Magioli et al. (2019), the large and continuous habitats support populations with more
complex trophic structures, acting as a source for biodiversity maintenance in modified habitats. Gibson
et al., (2011) complemented that these habitats are essential refuges for wildlife, assuming that their
similarity to natural areas (i.e, without anthropic actions).
The Brazilian environmental legislation has been encouraged the conservation of areas as patches
greater than 300 ha, however, it is not enough to minimize the urban pressure effect (Romero et al., 2020).
In our study areas is not only this group that has potential for connectivity in the studied landscape. We
can include the group having medium size too, highlighting the importance of the criterion distances from
forest patches. Considering these proximity relations among the forest patches, we can suggest for next
studies the name proximity to forest cover as proposed by author as Mello et al., 2018.
Page 21/41Showing different behavior of other criteria, we have the NDVI. The traditional index represents the forest
patches in terms of their status and/or quality (Fig. 4H) i.e., the conditions inside the remnants.
Consequently, it is not a criterion that represents the conditions of the natural vegetation on the
landscape, as our objective requires.
However, patches-level data are important to support the decision-makers discussion, which guided us to
includes our second objective.
For the study area, the patches-level metrics showed coherent resultants, considering the classes areas,
that we proposed. The largest forest remnants showed great values of perimeter and shape than the
smallest, but minor values of distance among their components (Table 3).
Furthermore, the class areas supporting the evaluation of the spatial autocorrelation among metrics and
after, among metrics and criteria.
The results were a high Moran index value for metrics (Fig. 7), which supported in their correspondence
with the criteria since these results reflected that the external influences on the fragments did not occur
randomly and that the criteria act on the landscape (with 84.1% of explanation in CCA, Fig. 8).
Different studies have been shown the potential of the ecological metrics in the definition of areas for
conservation, on analysis of sprawl urban and evaluation of the landscape structure (Schindler et al.,
2013, De Jesus, et al., 2015, Otero et al., 2015, Romero et al., 2018, and Lelli et al., 2019), corroborating
with our results.
The CCA analysis (Fig. 8) also indicated that the reduction in the distance from low-density urban areas
was associated with a reduction in the distance among forest fragments (NEAR). While the distance from
the highways was associated with an increase in the perimeter of the forest patches, and consequently
their respective areas. According to Pirnat and Hladink (2018), new diffuse urban areas are not subject to
significant changes in terms of habitat size and this seems to happen regardless of population changes
(Organization of United Nations Habitat, 2016).
Otherwise, the drier regions of the landscape, on the flatter terrains, near to the rivers, and facing to the
east face were associated with our smallest and most irregular patches, that were isolated and presented
the lowest NDVI values. Thus, in these landscape regions, the condition related to the urban infrastructure
and topography were favorable to human occupation, as also observed by Torres, Jaeger, and Alonso,
2016.
Conclusions
This study evaluated environmental criteria for prioritizing areas to obtain forest functional connectivity
in a landscape subject to the urban sprawl.
Page 22/41Our study area, the GBBR-SP region, brings the theme importance since its urbanization occurs in areas
originally occupied by Atlantic Forest. However, that has its agricultural production destinated to São
Paulo city, one of the largest cities in the world. This way, our major challenge is to incorporate a forest
network in the land-use/land-cover planning.
Our results indicated that we obtained robust criteria through the literature review, decreasing the intrinsic
subjectivity commonly associated with their definition in the participatory technique context. Criteria set
composed by slope, TWI, distance from drainage network, distance from highways, distance from a low-
density urban area, and distance from forest patches. Also, they are not spatially correlated or have
information overlap.
In this context, these criteria support identifying regions where it is possible to have the persistence of
forest fragments, even though in places under the impact of urban sprawl. Highlighting that we obtained
a diffuse urban expansion process in the GBBR-SP region that does not occur randomly.
However, thinking that the criteria names reflect their respective features and importance to the study, the
adequate name could be proximity to drainage network and proximity to forest patches instead of
distance.
Otherwise, we concluded that aspect and NDVI (originally selected) are not adequate criteria, thinking in
prioritize forest areas to functional connectivity, considering that the first showed a heterogeneous
behavior through the landscape, revealing a tendency to coming toward the slope values because they
came from Digital Elevator Model. The second reflects the patches' quality instead of their potential for
forest connectivity.
In this context, we can affirm that the selected criteria reflect the forest structure. Furthermore, they
support identifying areas near to watercourses, associated with the deep slope, the greatest moisture
retention potential. Areas covered by the great forest patches are the most irregular and connected of the
study area.
In this sense, the most distant locations from the highways reflect areas with more preserved forest
structure characteristics. However, in areas under diffuse urban expansion, large and connected forest
fragments are close to low-density urban environments. Highlighting that these regions are also
important for functional connectivity.
This way, our findings indicated a spatial autocorrelation among metrics and after, among metrics and
criteria. Also, we obtained that the external influences on the fragments did not occur randomly and that
the criteria act on the landscape.
Finally, our results reveal value ranges more suitable for each criterion in the environment under urban
sprawl to indicate the occurrence of forest fragments, aiming for functional forest connectivity.
Page 23/41You can also read