Astrophotonics: astronomy and modern optics
←
→
Page content transcription
If your browser does not render page correctly, please read the page content below
Astrophotonics: astronomy and modern optics
arXiv:2003.12485v1 [astro-ph.IM] 27 Mar 2020

                                                                             S. Minardi
                                                    LASOS GmbH, Franz-Löwen-Strasse, 07745 Jena, Germany
                                                                     stefano@stefanominardi.eu
                                                                              R. Harris
                                                       Zentrum für Astronomie der Universität Heidelberg,
                                                   Landessternwarte Kon̈igstuhl, Kon̈igstuhl 12, 69117 Heidelberg
                                                                    rharris@lsw.uni-heidelberg.de
                                                                             L. Labadie
                                                         I. Physikalisches Institut der Universität zu Köln
                                                             Zülpicher Str. 77, 50937 Köln - Germany
                                                                      labadie@ph1.uni-koeln.de
                                                    Invited review article for The Astronomy and Astrophysics
                                                                 Review. Submitted on 9 Nov 2018

                                                                                     Abstract
                                                        Much of the progress in Astronomy has been driven by instrumental
                                                     developments, from the first telescopes to fiber fed spectrographs. In this
                                                     review we describe the field of astrophotonics, a combination of photonics
                                                     and astronomical instrumentation that has the potential to drive the next
                                                     generation of developements. We begin with the science cases that have
                                                     been identified as possibly benefiting from astrophotonic devices. We
                                                     then discuss devices, methods and developments in the field along with
                                                     the advantages they provide. We conclude by describing possible future
                                                     developments in the field and their influence on astronomy.

                                               1     Astronomical instrumentation and science
                                               Astronomy is without doubt an empirical science more than others relying on
                                               the analysis of electromagnetic radiation, and as such its progress has often
                                               been correlated to the development of optical science and technology. The most
                                               obvious example of this interaction between science branches are the discoveries
                                               Galileo made at the beginning of the 17th century by pointing its telescope,
                                               then the state of the art of optical instrumentation, to the sky. As well known
                                               this simple attempt revolutionised the understanding of the universe and astro-
                                               nomical observations were among the motivations of optical science to deliver
                                               telescopes of improved quality. Before the end of the 17th century Christiaan

                                                                                         1
Figure 1: An attempt to compare visually the progress of optics with the dis-
coveries in astronomy. State-of-the-art optical instrumentation has often been
the trigger for important discoveries.

Huyguens was able to develop an aberration corrected eyepiece allowing him to
resolve the rings of Saturn, which were previously believed to be satellites, and
detect the rotation of Mars. The invention of the reflecting telescope by New-
ton, which solved the problem of chromatic aberration, and the development of
parabolic mirrors by Gregor (∼ 1720), which solved the problem of spherical
aberration, opened the possibility to build telescopes with apertures significantly
larger than the refractive ones. Already by the end of the 18th century William
Herschel was observing the sky with reflecting telescopes exceeding half a meter
in diameter (his biggest telescope had an aperture of 122 cm), enabling him to
discover faint objects such as the satellites of Saturn and Uranus as well as to
compile an extensive catalogue of ’nebulae’. The invention of the spectroscope
by Fraunhofer (1814) and the subsequent discovery of the absorption lines in the
spectrum of the Sun is another example of how progress in optical technology
eventually changed the course of astronomy. The identification of the spectro-
scopic signature of chemical elements around 1850 gave astronomers a powerful
tool to understand the structure of stars and of the universe, whose benefits we
are still exploiting. A visual summary of the progression of optical technology
and astronomical discoveries is illustrated in Fig. 1.
    Today, the frontier in optics is represented by photonics, which can be defined
as the science dealing with the development of technologies which generate,
transform or use tailored light states to perform a task. As the word suggests,
photonics aims at using photons to accomplish tasks in a way similar to what
electronics does with electrons. Under this definition we can include devices
such as laser sources, optical filters, optical fibres, and optoelectronic switches,
which are commonly used in applications for telecommunications and digital
data storage/readout. Given the impact of optical technologies had in shaping

                                         2
the history of astronomy, it is not surprising that astronomers have already
started to borrow photonic technologies to improve their instruments.
    First examples of what is called now ’astrophotonics’ (i.e. application of
photonics to astronomical instrumentation[35]) date back to the beginning of
the 1980’s when optical fibers were used to improve the productivity of spectro-
graphs (multi-object spectrograph MEDUSA [131]) or to obtain hyperspectral
images of extended objects (integral field spectroscopy [313]). Besides repre-
senting a major part of all existing astrophotonic instrumentation, multi-object
and integral field spectrographs have become essential tools of contemporary
astronomy which enabled large scale surveys of the sky and kinematic studies of
galaxies which were inconceivable only a couple of decades ago. Photonic com-
ponents such as integrated optics circuits, phase masks, lasers and speciality op-
tical fibres are currently being employed or are proposed as keys to enhance the
performance, reduce the size of astronomical instrumentation, and/or enhance
the use of the telescope through multiplexing. Specifically, photonic technolo-
gies will be part of the instrumentation for Extremely Large Telescopes (ELTs)
already from the very beginning, as for instance laser guide stars for adaptive
optics [233] and optical fibres as key components of multi-object and/or integral
field spectrographs[91].
This review seeks to give a structured and comprehensive overview of the in-
terplay between photonics and astronomical instrumentation, highlighting in
particular the current state-of-the-art in the field as well as the perspectives
to which the community may look at. A way to visualise this approach is pre-
sented in the ring-plot of Fig. 2, where astronomical instruments (middle circle)
result from the, often contrasting, specifications dictated by the astrophysics of
the object under study (inner circle) and the constraints of optical physics and
technologies (outer circle). Instrumentation can be therefore discussed from the
perspective of the astronomer and from the one of the optical/photonic engineer.
    Differently to other overview works in the field[35, 36], this paper incorpo-
rates different branches of astrophotonics that are usually addressed separately,
as for instance spectroscopy, interferometry/high-contrast, calibration, techno-
logical platforms. Section 2 addresses, under an astrophysical perspective, spe-
cific science cases and related requirements that can directly benefit from the
photonics approach. Consistently with the ring-plot, Section 3 introduces the
optical physics perspective by summarising the formalism of optical waveguid-
ing, which is central to the understanding of photonic technologies. Section
4 presents the different families of astrophotonics devices from a performance-
driven point-of-view and facilitate the comparison with the theoretical back-
ground given in Section 3. Finally Section 5 concludes our paper and summarises
future perspectives.

2    Astronomical perspective
Imaging and spectroscopy techniques – or the combination of them – are the
two pillars supporting any advance in observational astrophysics. These two

                                        3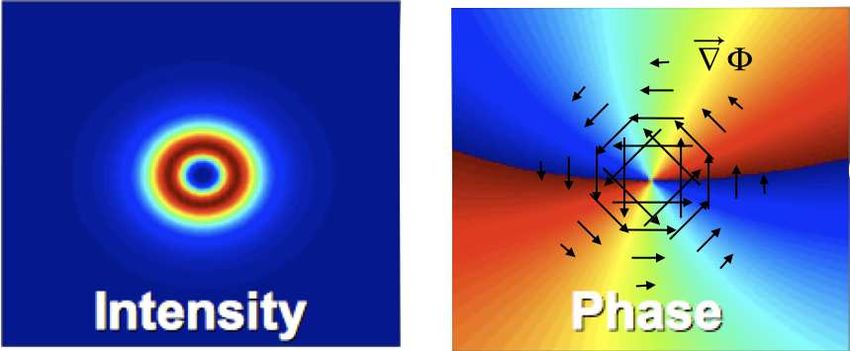
Figure 2: Astronomical instruments (middle circle) develop in between the de-
sired specifications derived from the astronomical target (inner circle) and the
constraints imposed by the available optical technologies (outer circle).

methods branch into several sub-techniques driven by specific science cases.
The potential benefit of photonics-based solutions must be appreciated under
the perspective of the scientific requirements associated to these two main tech-
niques.

2.1    Single object spectroscopy
Spectroscopy is a prime technique used in astronomy to investigate many prop-
erties of astrophysical objects, from chemical composition, to velocity structure,
to the detection of exoplanets through the Doppler technique. This requires the
splitting of the incoming light into its different colours by mean of dispersive
optical elements (e.g. prism, grating). In a simplified dispersive spectrograph
the light enters through a slit that selects a small region of the field, then a
collimator collimates the light, a prism/grating or other dispersive element dis-
perses the light, and a camera lens focuses the light onto a detection surface.
One of the most important requirements for long-slit spectroscopy is the achiev-
able spectral resolving power R=λ/∆λ, which is usually driven by a particular
science case. It determines our ability to measure flux densities at two nearby
wavelengths separated by ∆λ. For grating spectroscopy for example the spectral
resolving power is calculated by

                                        4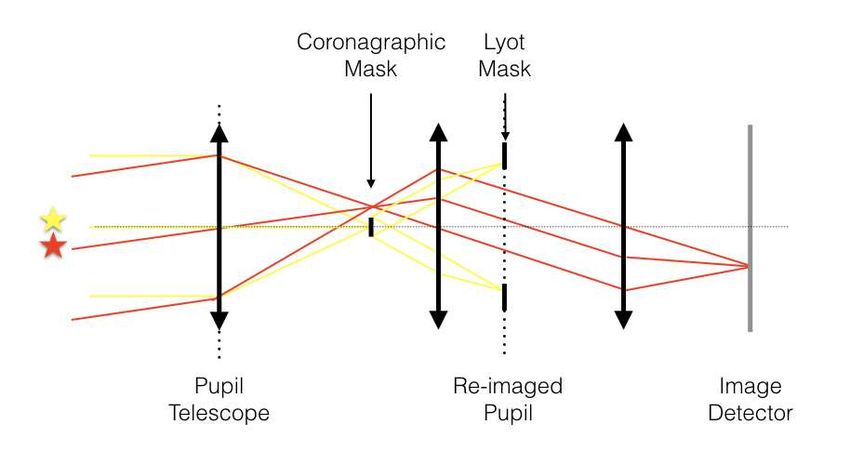
mρλW
                                      R=        .                                 (1)
                                            χDT
    where m is the diffraction grating order, ρ is the rulings on the grating, λ is
the operating wavelength, W is the number of illumined rulings, χ is the angular
seeing and DT is the telescope diameter.
    This means that in systems where diffraction is dominant ( χDT = λ) the
spectral resolving power is limited by the properties of the diffractive element.
However in non diffraction limited cases ( χDT > λ), R will be constrained
by the implemented dispersion element (grating, prism...), the diameter of the
telescope feeding it, and the slit size itself. This dependence is well established in
classical instrumentation and further information can be found in spectroscopy
textbooks (e.g. [269]). As spectroscopy is exploited in the majority of the science
cases in optical and infrared astronomy, we analyse hereafter the requirements
of a subset of them.

Measurement of chemical compositions and effective temperatures:
Low-resolution spectroscopy with R of few tens is sufficient to trace the contin-
uum emission of galactic and extragalactic objects and estimate their effective
temperature. Solid-state species and broad spectral features such as ices[249],
silicates[310] or PAHs[312, 295] can be studied at resolution of few hundreds
to few thousands. While spectroscopy can be implemented virtually at all
wavelengths, we are more particularly interested here in the optical and in-
frared regimes where numerous atomic to molecular line tracers are reported
[316, 311, 129]. Historically, optical spectroscopy of bright nearby stars has
revealed the gas composition of stellar photospheres. For spatially extended ob-
jects beyond the resolution of the telescope, long-slit spectroscopy can provide
simultaneously spectral and spatial information when the slit is properly aligned
as this has been reported for the disk of β Pictoris[228]. Currently, large projects
such as GAIA implement all-sky spectroscopic surveys to deliver colour infor-
mation of celestial objects through low-spectral resolving power (R ∼20) in the
optical regime [350 – 1000 nm] for magnitudes down to G∼201 . Whilst many
way of splitting the light exist (e.g. Fourier transform spectrograph (FTS),
Hadamard masks etc...), dispersive spectroscopy tends to dominate in modern
astronomy due to its simplicity and robustness, as well as because of the avail-
ability of high-performance infrared detectors that tend to cancel out the Felgett
advantage in acFTS spectrometers.
The main instrumental requirements for low-resolution spectroscopy science are
then: excellent throughput for observation of faint objects; flatness of the spec-
tral response ultimately constrained by the spectral response of the detector;
broadband capabilities overall several astronomical bands (e.g. V+R+I, or
J+H+K); arc minute field of view when operating in slitless mode;
  1 The   Blue and Red Photometer of GAIA operate in slitless mode.

                                            5
Measuring motion in the Universe: from stellar physics to exoplanets
and (circum)stellar physics: Beside investigating the chemical composi-
tion of astrophysical sources, spectroscopy is successfully and largely used for
studying the radial velocities of celestial objects via the Doppler shift. Since
the discovery of the first exoplanet around a Sun like star using the radial ve-
locity technique[204] the number of exoplanets discovered using this technique
has grown rapidly, peaking with the discovery of a possible temperate terrestrial
planet around the M dwarf Proxima Centauri[6]. For these science, (very) high
spectral resolution with R ∼100 000 is typically required if small line-of-sight
velocities down to a precision of a m/s to 10 cm/s [206] are sought according
to v=c∆λ/λ. Taking advantage of the periodic movement of an exoplanet in-
trinsic atmospheric line with respect to our strong telluric lines, high-resolution
spectroscopy even permits to characterise the exoplanet atmosphere itself. This
technique has been shown for τ Boötis b with the CO line using the R=100,000
CRIRES spectrograph and might be implemented with the future METIS in-
strument on the ELT[283].
At intermediate spectral resolutions of few thousands to ten of thousands, spec-
troscopy senses the gas kinematics in circumstellar environments [111, 248, 115,
215] and galaxies using the techniques of spectro-astrometry [296] and spectro-
interferometry. Motion of gas over stellar photosphere resulting from stellar
winds and mass-loss mechanisms is seen in high resolution spectra where partic-
ular shapes such as P-Cygni profiles are observed. Importantly, the magnetism
of stars can be investigated using high-resolution spectro-polarimetry that re-
veals the splitting of atomic lines due to the Zeeman effect [8].
For this type of (very) high-spectral resolution science cases, an extremely good
stability of the instrument is required from the mechanical and thermal point-of-
view as environmental disturbance may lead to drifts or jittering of the spectral
lines being measured. In many instances, the possibility to set the instrumental
payload in a vacuum vessel is highly valued but this requires a more demanding
infrastructure depending on the size of the spectrograph. When the spectro-
graph is a fibered-fed unit, the option of modal noise suppression is a major
requirement. Finally, for survey purposes accessing a large instantaneous field-
of-view is a top requirement: the Radial Velocity Spectrograph (RVS) on GAIA
accesses a field-of-view of 0.6 deg2 at a spectral resolution of R ∼11,000.
Solar system bodies There are numerous types of small bodies present in
the solar system, mostly inhabiting the asteroid belt and Kuiper belt. Studies
of these small objects within the solar system rely on detection and follow up
capabilities, which small telescopes are ideally suited for provided the objects
are bright enough. Not only can these objects tell us about the chemical make-
up of the solar system, they can also give us information as to how it formed.
There are two main competing sets of theories about evolution of objects in the
solar system. The first, older set of theories states most objects formed in place
from the remnants of the material that created the sun, with a few moving due
to planetary perturbations (The nebular hypothesis). The second set of theories
6state that the migration of Jupiter and Saturn caused massive upheavals in the
solar system moving around all the materials. Thus, understanding the location
and chemical composition of small objects within the solar system is key to
understanding its formation history. Various reports have stated that follow up
studies using low resolution spectroscopy on 4 m class telescopes at visible and
near infra-red wavelengths would allow observations at limiting magnitudes of
> 21 and would then tell us about the composition of these objects and further
test the theories on solar system formation. In addition to the small bodies in
the Kuiper belt and asteroid belt comets can be used to inform theories about
the formation of the solar system. In order to make useful discoveries high
resolution spectroscopy needs to be performed in the optical and near infrared.
Finally, the atmospheres of solar system planets present an exciting oppor-
tunity with further study allowing us to probe the composition and dynamics
of the atmospheres to greater levels than previously achieved.
Low mass brown dwarfs Brown dwarfs occupy the mass range between the
largest planets and the smallest stars. Due to their size, they are unable to
sustain nuclear fusion of hydrogen, though some are thought to fuse heavier
elements. The first Brown dwarf was discovered in 1995, though their existence
was hypothesised for many years before [252]. Since the first discovery, the
numbers and diversity in candidates has increased to hundreds, mostly due to
surveys such as the Sloan Digital Sky Survey (SDSS) [329] and Two Micron
All-Sky Survey (2MASS) [107].
To increase the number of candidates will be the job of future photometric
and spectroscopic surveys covering the optical and Near Infra-Red (NIR). In
addition, understanding the composition and processes in their atmospheres is
particularly important, and spectroscopic surveys will be required to determine
parameters such as composition, temperature and density. Due to the tem-
perature of these objects low spectral resolution NIR spectroscopy is ideal to
maximise flux contrasts of these objects.
Stellar variability There are many different reasons from stellar variability,
ranging from binary pairs, to stellar pulsations through to cataclysmic vari-
ables. Observations of these variable stars are extremely useful and they can
be used to study many properties of the star, from determining the processes
driving their variability, probing stellar evolution and properties and probing
their atmospheres. In addition specific types of variable stars (e.g. RR Lyrae,
Cephied variables) can be used to determine other parameters used to deter-
mine cosmological distances [97]. In recent years the number of candidates has
grown thanks to two major efforts. First through gravitational lensing surveys
(e.g. MACHO [2] and OGLE [306]) and also using wide field surveys, both for
variable stars but also for exoplanets (e.g. ASAS [247], ROTSE [1] and HATNet
[126]), have provided hundreds of thousands more candidates.
Whilst time resolved photometry tells us much about these candidates, there
are also advantages to performing observations with time resolved spectroscopy.
7Figure 3: Methods of Integral Field Spectroscopy. Taken from [3]
. The top image shows a lenslet array feeding the spectrograph, this is sim-
ple and allows for a large field of view, but requires the spectrograph to be
close to the telescope. The second option, fibres, allows the spectrograph to be
placed further from the telescope, usually at the cost of throughput. At the
bottom, image slicers and microslicers generally allow high throughput, though
also require the spectrograph to be close to the telescope.
Firstly to provide confirmation or clarification in the classification [80] and sec-
ondly to further probe the star. Most recently understanding variations in stars
has been helping astronomers disentangle planetary radial velocity signals from
those of effects such as sun-spots on the surface of stars (e.g. [230]).
2.2 Integral field Spectroscopy and Multi object spectroscopy
- Hyperspectral imaging
Whilst spectrographs observing single objects are extremely powerful, they are
limited in their capabilities to observe large numbers of objects. In an era
where many science cases require large statistical samples and with telescopes
becoming fewer in number (due to their larger designs costing more), more
pressures are put on multiplex, or the amount of objects an instrument can
observe at once. To solve this the alternative is to observe many objects at once.
Spatial elements (spaxels) are observed in the focal plane and then fed into the
spectrograph to produce a 3D data cube (see Fig. 3). There are two types of
these instrument, which can be loosely classed into Multi Object Spectrograph
(MOS) and Integral Field Spectroscopy (IFS). MOS allows observations of
multiple objects in the field of view [84] whist IFS allows small patches of sky
to be spatially resolved by an Integral Field Unit (IFU) (e.g. for observation of
extended or spatially adjacent objects) [3]. To further increase the number and
type of object that can be observed there is a combination of the two (using
multiple IFUs) which is called Diverse Field Spectroscopy (DFS) [225]. There
are many science cases for all of the above and some are briefly outlined below.
Galactic science To understand how individual galaxies form, what drives
their evolution and what states they tend to requires large data sets of spatially
resolved galaxies. Due to this large IFSs surveys are an extremely powerful tool.
There are currently lots of larger scale surveys such as MASSIVE (Mitchell Spec-
trograph), AMAZE (SINFONI) and KROSS (KMOS) are currently providing
data on hundreds of galaxies. These are being supplemented by even bigger
ones (thousands of galaxies observed) such as MaNGA, SAMI, and Califa, plus
soon the Local Volume Mapper (LVM). These surveys tend to provide direct
information on two components, stars and gas.
As the most obvious components of a galaxy, stars are easily identifiable. In
certain areas of nearby galaxies individual brighter stars can be resolved (e.g.
8M31), whilst at larger distances only the overall population can be estimated.
From studies of these populations we can gain an insight into the age composi-
tion and metallicity, showing which types of stars make up the galaxy and how
these have evolved in time. Combining this with knowledge of the evolution of
stars then gives information about the star formation rate within the galaxy.
When all this information is processed the information on the stars can give the
star formation rate surface density and the kinematics of the stars in the galaxy.
Studies of the gas in galaxies are equally important. They can be used to
trace the metalicity and abundance ratio of the gas, telling us the processes
forming stars and in the future the types of stars that will form and at what
rate. In addition gas can also trace the kinematics of the galaxy.
Combining information on both of these components in large data sets allows
astronomers to answer the largest questions in galaxy formation and evolution
today. These include including how physical processes evolve with time, what
regulates star formation, how metals build up, what drives gas inflows and
outflows, the role of the local environment and what drives strong morphological
transformation.
Cosmology Understanding the universe on the largest scales is one of the
grandest aims of astronomy. How the universe expands, the composition of the
universe and the physics governing everything are both very large questions.
To solve these large sets of data are required. Obtaining these with single slits
or fibres is difficult and time consuming. As such the trend is towards MOS
instruments. For these surveys the object is not typically spatially resolved and
the science cases are mostly dominated by the desire to understand how galaxies
and the corresponding luminosity functions evolve with time.
For this to be known, both the composition and the redshift of the galaxy
must be understood. This requires moderate spectral resolving power instru-
ments such as VIMOS (R of 200 to 2500), AAOmega (R 1000 to 8000). These
instruments are used to perform survey such as zCOSMOS, VVDS, VIPERS
and GAMA. These instruments and surveys have led to many interesting dis-
coveries, such as the combined discovery of periodic variations in the density of
visible matter, Baryon accoustic oscillation, by the 2DF instrument [236].
Exoplanets Another promising method for detecting exoplanets is to use IFS.
A combination of an extreme Adaptive Optics (AO) system and a chronograph
to spatially resolve the star and planet whilst also removing the light from the
star. Imaging systems can then be used, or long slit, or IFSs such as the IFU
for SPHERE [55], GPI IFU [54] and CHARIS (SCExAO) [244]. This allows
us to distinguish between the speckles from the telescope and any potential
exoplanets using spectro-differential imaging [251]. This technique makes use of
the wavelength dependency of the position of the speckles, which the planet’s
signature doesn’t have, Meaning the position of the speckle will change on the
IFU with wavelength, whereas the planet will not. In addition IFUs can be used
for the characterisation of the planet’s atmosphere (REF/Nature of a few years
9ago with spectrum of HR8799b with NACO VLT).
2.3 High-angular resolution
The imaging technique is the second main pillar of modern observational astro-
physics, hence the accessible level of accessible angular (or spatial) resolution is
a requirement shared by a large number of science cases.
Back to Messier’s time, the identification and classification of his so-called ”neb-
ulosities” was established on the basis of the objects morphology and brightness
distribution resolved by primitive telescopes or even naked-eye. This led re-
ferring to M31 as the beautiful nebula of the belt of Andromeda, shaped like a
spindle [212], which M. Messier has investigated with different instruments, and
he didn’t recognise a star 2 . Since then, the constant increasing resolving power
of modern telescopes has greatly benefited to galactic and extragalactic astro-
physics.
Following the works of Duquennoy & Mayor [83], stellar multiplicity has been
identified as a frequent property of solar-type stars with a binary rate larger
than ∼50%. Star formation theories based on single star scenarios have been
challenged by such observational evidence and extended studies of young T
Tauri stars emerging from their protostellar cloud have permitted a better un-
derstanding of the early phases of star formation. Early works from different
groups [106, 180, 207, 59] have made use of infrared high-resolution observations
based, for instance, on new adaptive optics and speckle imaging techniques to
explore the statistics of close binaries population in young star forming regions,
hence complementing radial velocities surveys sensitive to periods of few days
[197]. The expansion of such studies to higher stellar masses has taken advan-
tage of milliarsecond resolution scales delivered by long-baseline interferometry
observations to conclude that binarity was the norm rather than the exception
[266].
The observational investigation of circumstellar disks in nearby star forming re-
gions as well as in the solar neighbourhood has resulted in a significant progress
of our understanding of the physics of disks and their possible connection to
planet formation and evolution throughout the pre-main-sequence and main-
sequence stage: the angular resolution delivered by the Hubble Space Tele-
scope (HST) [231, 12, 151, 149], by AO-assisted ground-based instruments at
Keck and VLT [242, 82, 102] or by long-baseline interferometers such IOTA,
VLTI [222, 309, 253, 175] has been decisive in that sense.
As the limits in the delivered angular resolution were regularly pushed back,
breakthrough results were obtained in numerous fields: in stellar physics un-
precedented images of stellar surfaces have been reconstructed that highlighted
processes of convection and spotty patterns [232, 258, 227]; long baseline in-
terferometry at Keck and VLT-I has made possible to understand the spatial
properties of the circum-nuclear dust and the K-band nuclear emission in AGNs
2 in its original version La belle nébuleuse de la ceinture d’Andromède, en forme de fuseau.
M. Messier l’a examinée avec différents instruments, et il n’y a reconnue aucune étoile.
10[292, 49], while is the combination of milliarcsecond angular resolution and re-
verberation mapping may result in a new approach to cosmic distances estimate
[132]; last but not least, some of the major results in the Galactic Center sci-
ence have been uniquely obtained thanks to the sharpest images of the nuclear
star cluster around Sagittarius A∗ [268], whereas the 10-µas campaign with the
GRAVITY interferometer [112] may further change our understanding of strong
gravity physics.
The interplay between angular resolution and astrometry has been also very
central for science cases based on astrometric measurements. For instance, in
the ideal case of a photon-noise dominated point spread function (PSF), the po-
sition of p
the centroid can be measured with a differential astrometric precision of
(λ/2D)/ Nph .Nref , where Nph is the number of collected photons, and Nref the
number of background reference star [191]. For this reason, the implementation
of long-baseline interferometric techniques with baselines of few hundred meters
has been a long sought goal to achieve microarcsecond – or better – astrometric
precision for the indirect detection of planets and/or dark matter. Existing or
past projects such as Gravity/VLTI [112], THEIA [301], PRIMA [75] or SIM
[308] have in the high angular resolution a key requirement.
The prime instrumentation requirement for employing high angular resolution
techniques is the ability to precisely control the variations of the phase across
the incoming wavefront, since the phase information plays a fundamental role
in imaging theory. The phase of the signal can either be affected by the fast
varying atmospheric turbulence, in case of ground based observations, or by
long-term opto-mechanical drifts and static aberrations that degrade the optical
quality. Functionalities such as adaptive optics, interferometric fringe-tracking,
wavefront filtering, active phase control, and vibration damping will be central
sub-units in the next decades. A large field-of-view (>30′′ ) is usually not fore-
seen as limitations linked to iso-planatic and iso-pistonic angles as well as field
aberrations arise, together with cost issues related to the size of the detector
needed to ensure simultaneously a wide field-of-view and a Nyquist sampled
PSF.
2.4 High-contrast techniques
High-contrast science may refer in the first place to the dynamic range of an
image, or the amplitude between the readout noise and the saturation limit of
the detector. This is particularly an important requirement for the study of
stellar clusters, where a compromise between sensitivity and dynamical range
needs to be found by playing on the detector (low/high) gain mode. However,
with the rapid expansion in the last decades of the field of exoplanets and planet
formation, high-contrast science has developed strong ties to the detection and
imaging of faint targets and structures in the immediate vicinity of a bright
central source.
Spectacular results in the field of exoplanets and disks direct imaging have been
obtained with the use of coronographic instruments capable of significantly re-
duce the glow of the central star [229]. Giant planets have been imaged within
110.5′′ to few arcseconds from the their parent A-type stars [150, 193, 171] and offer
hence excellent prospects for the future spectroscopic characterization of their
atmosphere [140, 41]. Spatially-resolved sub-structures such as warps and spiral
arms have been observed around AU Mic [39] and Herbig stars [17] using high-
contrast techniques. Very high-precision V2 interferometry in the near-infrared
has been successfully employed to characterise the population of debris disks in
the Solar neighbourhood [90]. Beside the existing experience, nulling interfer-
ometry may experience a new revival, following the DARWIN/TPF experience
[98], for the spectroscopic evidencing of biological biomarkers in the atmosphere
of Earth-like planets [152]. The recent discovery of a terrestrial, non-transiting,
planet orbiting our closest neighbour Proxima Centauri [6] will certainly further
motivate rapid advances in the field of high-contrast techniques.
Concerning the instrumental requirements applying to high-contrast techniques,
the wavefront phase needs to be controlled as – or even more – stringently than
for imaging or classical long-baseline interferometry. Since contrasts from 10−3
to 10−9 need to be achieved, effects related to high (>90%) Strehl ratios, control
of pupil rotation, PSF centering, surface scattering, local intensity mismatches,
differential polarization and long-term stability need to be addressed in order
to expect small inner-working angles (IWA) [200] or deep and stable nulls [210].
For science cases relevant to exoplanets and planet formation, the requirement
of observing in the thermal infrared (L to N , Q astronomical bands) is of high
relevance since the flux contrast between the central star and the planet/disk is
more favourable than in the near-infrared or in the optical regimes. Considera-
tions on the spectral richness of infrared spectra in terms of dust & gas tracers
and bio-signatures is a further motivation to operate at longer wavelengths as
well. While a high total throughput is desirable to pick-up the faintest objects,
the possibility to observe in broadband conditions is of high importance as well.
2.5 Metrology and calibration techniques
While not strictly related to one specific science case in astrophysics, the tech-
niques employed for calibration and metrology in support to ground- or space-
based observations are inescapable for an optimal interpretation of the science
data.
One approach, possibly definable as a passive calibration and likely the most
used, consists in observing an astrophysical standard with exactly the same in-
strumental setup as the one adopted for the science target in order to identify
features extrinsic to the object of interest and calibrate them out. The correc-
tion of strong telluric features in spectroscopy, the measurement of photometric
standard stars for photometry and the acquisition of so-called PSF reference
stars for spatially resolved imaging are the most common examples of passive
calibration.
Beside this, it is also frequent to use active calibration systems when a precise
knowledge of the time-dependent long-term drifts and stability/uniformity is
required, which may be difficult to monitor with on-sky calibration. A good
example is seen in high-resolution spectroscopy with a typical resolving power
12of R=100,000 when precise radial velocity measurements are sought for the
detection of planets. Since the relative spectral shift of the stellar lines must
be determined with a precision of ∼1/1000 resolution element, high-stability
calibration sources such as Thorium-Argon lamps or iodine cells have been em-
ployed to track instrumental drifts down to m/s. While spectral lamps have
been central for the operation of the HAPRS optical spectrograph, the upcom-
ing ESPRESSO spectrograph at the VLT will make use of spectral templates
of superior stability and accuracy delivered by a laser frequency-comb [239].
Artificial sources are also employed to assess the spatial flatness of a detector
response, or the quality of the sky thermal background suppression at infrared
wavelengths. In wide-field imaging applications, the monitoring of static and
dynamic field distortion effects need to be traced, which is typically achieved by
using an artificial scene of widely and uniformly distributed point sources. Fi-
nally, the effective suppression of unwanted sky lines at optical and near-infrared
wavelengths by mean of carefully tailored narrow-line filters is also highly de-
sirable.
Metrology becomes critical when unavoidable drifts and flexures of a large facil-
ity or instrument hamper the ultimate expected accuracy. A laser metrology is
usually implemented to achieve (sub-)wavelength position accuracy at 632 nm.
Some noticeable cases can be mentioned: the laser metrology system of the
high-precision astrometry instrument Gravity/VLTI launches its beam from the
interferometric lab up to the telescope pupil to trace back the path of the astro-
physical beam [186]. Considering that the astrometric angle ∆α=∆OPD/Bp ,
the uncertainty on the length of the projected baseline needs to be sufficiently
small not to dominate the overall error budget. With a laser metrology, the
precision on the length of the interferometric (projected) baseline Bp greatly
surpasses what is typically delivered by pointing models; another example of
critical metrology need is found with the NEAT (now THEIA) project of space-
based high-precision astrometric mission [191, 301]. The small differential dis-
placement of an Earth-hosting star with respect to the background reference
stars due to the orbiting planet can only be measured if the uncertainties on
the geometry of the focal plane array (FPA) are calibrated down to one part in
105 . The interferometric laser metrology system illuminating the FPA can help
to retrieve the ultimate position of the star PSF centroid [66].
The instrumental requirements inherent to active calibration and metrology ac-
tivities are clearly driven by an excellent knowledge and understanding of the
implemented hardware: this means that particular care needs to be taken to
study the spectral content, stability and repeatability of a calibration lamp.
Modern laser sources have made enormous progress in that sense. The charac-
terisation of the transparency range, optical quality and modal content of any
passive component involved in the calibration chain (e.g. filters, optical fibers,
phase modulators) must result from dedicated lab testing and, ideally, rely on
high-TRL devices. Finally, the possibility to simplify the optical design of any
calibration or metrology system for stability purposed should be considered as
an important requirement: in this sense, optical fibers that can efficiently trans-
port, filter or mix light from different physical locations will play an increasingly
13important role in astronomical instrumentation.
3 A very short introduction to Photonics
As briefly mentioned in the Introduction, photonic astronomical instrumenta-
tion has three main advantages over conventional instrumentation, namely (i)
the potential reduction of size and mass of the instrument, (ii) the possibility
to build highly multiplexed instruments, and (iii) the delivery of enhanced in-
strumental performance. The first advantage is clear considering the case for
integrated optics, i.e. a technology enabling optical devices manipulating light
at spatial scales of the order of the wavelength. Complex free-space optics set-
ups based on beam-splitters, folding mirrors, gratings and filters may be easily
integrated on an optical fibre or a glass substrate of a few square centimetre area
and few 100 µm thickness. This makes the functional part of an instrument
extremely compact and lightweight, a clear advantage especially for infrared
instrumentation (the cryogenic enclosure is smaller and thus less demanding)
and space missions. The miniaturisation and the possibility to fabricate easily
many identical copies of the integrated device makes astrophotonic instrumenta-
tion appealing for highly multiplexed instruments which allow a broader access
to unique telescope facilities and is a requirement for large scale astronomical
surveys. The classical example of this feature is provided by the introduction
of optical fibres which made multi-object spectroscopy possible (see Sec. 2.2).
Integrated optics could in the future allow for an even more aggressive multi-
plexing strategy levering on the inherently small size of the functional units of
the instrument. Finally, astrophotonic devices could deliver instruments with
unique performance, which could not be accomplished by other means. This is
for instance the case of integrated optics beam combiners for stellar interferom-
etry (Sec. 4.3) which deliver a highly precise visibility measurement through
the use of single mode optics, or the phase mask coronagraphy, which can sup-
press efficiently light at the diffraction limit by means of micro/nano-structured
optical plates (Sec. 4.4).
In this review, we propose to present astrophotonic instrumentation not
only according to their astronomical use but also from the perspective of the
employed photonic technologies. To this end, we introduce here basic photonic
concepts such as the waveguide and the optical modes which will be used in
Section 4 to classify astrophotonic instruments.
Photonic components can be broadly divided into passive and active devices.
Passive devices are optical elements introducing a static modification of the
properties of light. In these devices the power of light is preserved or, more
often, is reduced by losses. On the contrary, active devices can dynamically
modify the state of light by means of an interaction with an external agent.
The output light power in active devices can be greater than its input, the
gain being supplied by an external power source (e.g. electricity). In this
review we will discuss photonic applications to astronomy based on components
modifying the properties of light on spatial scales of the order of the wavelength
14of light. Under this classification we can include phase masks such as gratings
(see Section 4.1) or vortex phase masks (see Section 4.4) but not conventional
lenses, as the former requires the structuring of an optical surface at the micro-
nano-scale.
A fundamental component falling in our classification of passive photonic
devices is the optical waveguide. This is an heterogeneous optical medium
consisting of a region of space with high aspect ratio (the core) characterised
by a refractive index higher than its surroundings (the cladding) and transverse
dimensions comparable to the wavelength of light. In such a medium, light
can be confined in the core and propagate along the long axis (or longitudinal
axis, conventionally oriented to coincide with the z-coordinate axis) thanks to
the phenomenon of total internal reflection. Simple considerations in the frame
of the geometrical optics approximation show that light can propagate in the
core of the waveguide if the external divergence angle of light (respect to the
longitudinal axis) is smaller than the numerical aperture of the waveguide:
q
N A = n2co − n2cl (2)
nco and ncl being the refractive indices of the core and the cladding, respectively.
Optical waveguides can come in the form of a glass fibre or as an element of an
integrated optical circuit, i.e. waveguides manufactured on a glass substrate.
The state of light in waveguides can be manipulated by means of more complex
passive components analogous to macroscopic devices, such as beam splitters
(optical couplers), mirrors (Bragg gratings and micro-resonators) or phase plates
(birefringent waveguides).
As active devices of interest for astrophotonics we will consider mainly lasers
and phase modulators. Lasers are optical media in which the population of
electrons in a radiative electronic transition is inverted respect to thermal equi-
librium. The population inversion is typically obtained injecting in the medium
power in the form of optical radiation or electrical current. Light resonant to a
radiative transition in an inverted medium is amplified coherently because of the
occurrence of stimulated light emission. Lasing media are typically inserted in
an optical resonator, where light can be amplified by many orders of magnitude
by passing it repeatedly in the amplifier by means of two mirrors. Currently the
laser resonator can be fabricated within a single optical fibre or waveguide using
fibre Bragg gratings as mirrors, or manufactured in semiconductor waveguides
within a laser diode. Photonic phase modulators are devices using an electrical
signal to induce a local variation of the refractive index of a waveguide, which
can advance or retard the phase of a guided optical field. They are typically
based on the electro-optical effect, by which a constant electrical field can alter
the birefringence properties of the medium where the waveguide is manufac-
tured. By integrating a phase modulators within an integrated Mach-Zehnder
interferometer amplitude modulators can be realised as well.
An important concept in photonics is the optical mode, which is a stationary
state (or eigenstate) of light eventually originating from the wave nature of
light and the boundary conditions at the interfaces of the optical system. Our
15everyday experience of wave phenomena can provide us a clear visualisation of
the abstract concept of mode. The waves generated by tipping regularly on
the rim of a glass filled with water or the movement of an elastic string tended
between two points are all phenomena that give rise to mechanical standing
waves, which can be represented mathematically as modes. In these cases the
temporal oscillation of the water or the string is modulated spatially by a sinus-
like profile consisting of an integer number of half wavelengths, the periodicity
of temporal and the spatial oscillations being related to each other through the
speed of sound in the medium.
Mathematically, modes are solutions of differential equations which describe
the physical system under study. Optical modes are solutions of the electro-
magnetic wave propagation equation:
~
n2 (~x) ∂ 2 E
~−
∇×∇×E = 0, (3)
c 2 ∂t 2
which is straightforwardly derived from the Maxwell equations. Here n(~x) is
the spatially varying refractive index and c is the speed of light. This equation
is usually cast into an eigenvalue problem assuming an harmonic dependence in
one or more coordinates. As an example, let’s consider the case of the weakly
guiding optical waveguide, i.e. a waveguide satisfying the relationship ∆n =
nco − ncl ≪ ncl . In this case, we can safely assume that the electromagnetic
field is transverse respect to the axis of the waveguide and vectorial components
of the electric field are decoupled. This allows writing the wave equation in a
scalar form for the amplitude of one of the polarisation directions of the field:
n2 (~x) ∂ 2 Ex,y
∇2 Ex,y − =0 (4)
c2 ∂t2
If the refractive index profile of the core is invariant along z, the z-(longitudinal)
component of the electric field has an harmonic dependence in time and z:
Ex,y (x, y, z, t) = ψ(x, y) · exp[i(βz − ωt)] + c.c.. (5)
As a consequence, the transverse profile of the field ψ(x, y) obeys the following
eigenvalue equation, derived by substituting Eq. (5) in the scalar wave equation
Eq.(4): 2
∂2 ω2
∂
+ 2 + n(x, y) 2 ψ = β 2 ψ, (6)
∂x2 ∂y c
where n(x, y) is now the refractive index distribution in the transverse (x, y)
plane, which achieves its maximum in the region of the core. If the refractive
index distribution has a peak, the eigenvalue equation has a discrete set of solu-
tions which represent the transverse modes of a waveguide. The eigenvalues are
found by imposing that the field ψ(x, y) is continuous in value and derivative
everywhere, which is a consequence of n(x, y) possessing at most a finite discon-
tinuity in value ([284], chapter 33). Step index waveguides with circular cross
section, i.e. waveguides with a cylindrical core of constant refractive index and
16abrupt transition to the cladding, are a particular subgroup of waveguides which
possess mode profiles in analytical form. They represent a good approximation
of real optical fibres which can support a one or more discrete modes, the modal
behaviour being parametrised by the normalised frequency V :
2π
V = a · N A, (7)
λ
where a is the core radius and λ the free space wavelength of the light. For
V smaller than 2.405, waveguides can support a single mode. Asymptotically
the number of modes supported by a step index waveguide with circular cross
section can be obtained from:
V2
N= . (8)
4
Modes can also have a longitudinal attribute, as is the case of optical res-
onators, regions of space where light is trapped e.g. in the volume between
two parallel plane mirrors. The mirrors introduce a boundary condition for
the electromagnetic field similar to that of a vibrating string (the optical field
vanishes at the mirror surface) so that only a discrete set of longitudinal waves
characterised by an integer number of half wavelengths are supported by the
resonator.
Modes can be excited by matching an external optical field to the modal
field distribution at the boundaries of the photonic device. Examples are the
excitation of modes in a fibre by illuminating its tip with a beam having the
same spatial distribution of the mode or illuminating the semi-reflecting mirror
of an optical resonator with light tuned at the frequency of its stationary waves.
Modes form a complete orthonormal base for stationary fields sustained by the
photonic component and thus their complex amplitude aj can be obtained by
projecting the exciting field distribution Eext (x, y) onto the mode profile ψj (x, y)
at the interface:
r 1/4 R ∗
nco ǫ0 S ψj (x, y)Eext dA
aj = i1/2 , (9)
2 µ0 h R 2
S
|ψ j (x, y)| dA
where S represents the external surface of the modal volume. Normalisation in
this case is chosen so that the power carried by the j-th mode is given simply
by the square modulus of aj .
Highly multi-mode fibres can be described safely in the frame of the geomet-
rical optical approximation. This gives us the possibility to use the brightness
theorem [42], to describe seeing limited PSF of a telescope in terms of modes.
Moreover, as the brightness theorem is basically a formulation of the second
principle of thermodynamics[209], we derive a useful lesson regarding mode
transformation devices. The brightness theorem states that the power per unit
area and solid angle (the brightness) of the image of a source of light formed
by a passive optical system cannot exceed the brightness of the source itself.
Since the brightness is related to the temperature of the source, it is clear that
17a violation of the brightness theorem could allow a perpetual motion machine
to work. In a lossless passive optical system the collected power is preserved
thus the brightness theorem is equivalent to state that the etendue of the source
and the image are the same, the etendue E being defined as the product of the
source area A by its solid angle divergence Ω:
E = A · Ω. (10)
We consider now an optical system consisting of a seeing limited telescope fo-
cusing light on a multi-mode optical fibre placed in the focal plane. For the
image of starlight in the focal plane of a telescope of diameter D and focal ratio
F♯ the etendue can be estimated as:
2
π2
2 1
Etel = π(θDF♯ ) π = (θD)2 . (11)
2F♯ 4
Here the angle θ represents the seeing. On the other side, the etendue of light
propagating in a step-index optical fibre can be estimated as the area of the
core of radius a by the square of the numerical aperture:
V2 2
Efib = πa2 πN A2 = λ , (12)
4
where we have used the definition of the normalised frequency V of the waveg-
uide Eq.(8). In this case, λ2 can be interpreted as the etendue of a single
optical mode. Because in lossless systems the etendue of light is a constant, we
can write:
V2 2 π2
λ = (θD)2 (13)
4 4
Recalling that the seeing angle can be roughly defined as λ/r0 , r0 being the
Fried parameter we obtain:
2
V2 π2
D
= (14)
4 4 r0
2
2
in which the expression π4 rD0 can be interpreted as the ’modal content’ of
the point spread function of the telescope.
The conservation of brightness has further implications which are useful
for astronomical instrumentation. In particular it shows the impossibility to
have a passive, lossless device converting multimode light into a single mode
[322]. If such a device were possible, the brightness of light confined in the
single mode output should necessarily increase because of the reduction of the
etendue, thus violating the second principle of thermodynamics. This is the
reason why multimode devices with single mode behaviour such as the photonic
lantern [184, 27] distribute multi-mode light to an equivalent number of single
mode waveguides.
18In active devices brightness is not preserved, but the corresponding reduction
of entropy is compensated by the necessity to extract information from the
system. This is for instance the case of an adaptive optics system coupled to a
single mode fibre, which uses the information of the wavefront sensor to correct
the wavefront and concentrates the power in a single mode of the fibre. The
reduction in entropy associated to the correction of the aberrations is largely
compensated by the entropy increase of the wavefront measurement operation,
which requires the absorption of light on a detector.
4 Astrophotonics
In this Section we review photonic devices developed so far for astronomical in-
strumentation and classify them by astronomical technique and photonic func-
tion. As indicated in Table 1, we distinguish 5 main astronomical techniques
namely spectroscopy, high angular resolution, hyperspectral imaging, high con-
trast imaging and metrology/calibration. The photonic functionality distin-
guishes 3 categories depending modal content of the key photonic component of
the instrument, i.e. single mode, multi-mode and mode transformation devices.
Under single-mode devices we include continuous wave lasers operating at a
single longitudinal mode, and devices based on single-mode optical waveguides.
Devices like laser guide stars and integrated optics beam combiners for interfer-
ometry are therefore found in this category. Multimode devices are pulsed laser
sources which emit on a multitude of longitudinal modes or multi-mode optical
fibers. Laser frequency combs or 3D spectroscopy instruments (MOS or IFS)
are typical representative of this category. In between the single mode and the
multimode categories we can find mode transformation devices, which operate
a modification of the modal distribution between input and output. These are
for instance passive devices like the photonic lantern and diffraction gratings
(MM to MM), phase masks (SM to SM) or active devices like the deformable
mirrors in an adaptive optical system (MM to SM). The table in Figure 4 gives
an overview of the astrophotonic instruments according to the dual classification
described above.
In the following pages the sub-sections are devoted to the afore mentioned as-
tronomical techniques, while paragraphs distinguish the various photonic func-
tionalities underlying the instruments.
4.1 Spectroscopy
Single Mode Spectrographs As shown in Eq. 1 the mismatch between the
diffraction-limited resolution of the telescope λ/DT and the seeing χ reduces
the spectral resolving power of the spectrograph, which can be restored only by
making the grating (and hence instrument) larger or reducing the size of the slit
(which can cause a loss in light unless techniques such as image slicing is used).
The smallest spectrograph is then in general the one for which λ/DT = χ, the so-
called diffraction-limited spectrograph. From the point-of-view of astronomical
19Figure 4: Astrophotonic instruments can be classified according to the scien-
tific purpose (rows) and the modal behaviour (columns) of their key photonic
component.
20instrumentation, a truly diffraction-limited spectrograph could offer, besides size
reduction, two further main advantages. Firstly, improved stability through
the elimination of modal noise in fibres (which is the error in spectral line
position caused by the fluctuation of the barycentre of the input light beam
scrambled by atmospheric aberrations), and secondly a further reduction of
cost, thanks to either mass produced components for the photonic market or
smaller conventional components. Truly diffraction limited spectrographs could
be obtained by feeding the spectrograph with one or multiple single mode fibres
(SMFs) acting as spatial filters (a single mode spectrograph).
Whilst the idea of using spectrographs fed by SMFs is not new to astronomy,
though, due to atmospheric turbulence [277] coupling starlight to them is no-
toriously inefficient. A sophisticated AO system is therefore still mandatory to
reduce coupling losses. Before truly single mode (SM) coupling was considered
there were attempts using few mode fibers (FMFs) in 1998 [143], though with a
light loss still unacceptable for astronomical spectroscopy. This restriction led
to most spectrographs being fed using Multi-mode (MM) fibres. In recent years
developments in extreme adaptive optics (XAO) systems now routinely allow
high Strehl ratios and hence reasonably efficient coupling into SMFs. This is
leading to the first generation of SMF fed instrumentation, with examples of
coupling tests on SCExAO [147] and full instruments in Minerva-red [29] and
Ilocater [65].
Single mode reformatters and spectrographs To overcome the require-
ment of using XAO while preserving a high throughput, single mode spectro-
graphs fed by a Photonic Lantern (PL) [184, 27] have been proposed (Photonic
Integrated Multi-Mode Spectrograph (PIMMS) [37]). PLs are tapered optical fi-
bres which adiabatically transform a MM optical fibre into a collection of SMFs.
Light injected at the MM end of the device is distributed without losses in the
output SMFs provided their number is at least equal to the number of modes
supported in the MM end. A lossless transition to fewer fibres is in fact pro-
hibited by the brightness theorem (see Sec. 3). PLs come in the form of fibers
[184] or integrated 3D waveguides [302, 287] and can provide single mode func-
tionality to Multi-mode fibres (MMFs). This quality, originally exploited for
the development of astronomical notch filters (see Sec. 4.1), allows in principle
efficient coupling from seeing-limited telescopes, while allowing light dispersion
with a compact single mode spectrograph. The PIMMS concept has two pos-
sible implementations, either the SMF ends are rearranged into a linear array
acting as the pseudoslit of a spectrograph (also known as reformatting of light),
or they are fed to integrated spectrographs (see next paragraph). Further elab-
orations of the PIMMS concept have been conceived or developed. The simplest
is the photonic Tiger concept (named for the fibre fed Tiger IFU [182] where no
reformatting is used and a Multi Core Fiber (MCF) feeds the entrance slit to the
spectrograph. This means the spectra need to be dispersed such that none of
the inputs overlap. Alternatives have been put forward, to use Ultrafast Laser
Inscription (ULI) to write a 3D integrated optical component reformatting the
21You can also read