Biodegradable Polyurethanes Based on Castor Oil and Poly (3-hydroxybutyrate)

Page created by Dave Gilbert
 
CONTINUE READING
Biodegradable Polyurethanes Based on Castor Oil and Poly (3-hydroxybutyrate)
polymers
Article
Biodegradable Polyurethanes Based on Castor Oil and
Poly (3-hydroxybutyrate)
Pathikrit Saha, Chanin Khomlaem                    , Hajer Aloui      and Beom Soo Kim *

                                          Department of Chemical Engineering, Chungbuk National University, Cheongju, Chungbuk 28644, Korea;
                                          pathikritsaha89@gmail.com (P.S.); nament99@gmail.com (C.K.); hajer.aloui@ymail.com (H.A.)
                                          * Correspondence: bskim@chungbuk.ac.kr; Tel.: +82-43-261-2372

                                          Abstract: Biodegradable polyurethanes (PUs) were produced from castor oil (CO) and poly
                                          (3-hydroxybutyrate) diol (PHBD) using hexamethylene diisocyanate as a crosslinking agent. PHBDs
                                          of different molecular weights were synthesized through transesterification of bacterial PHB and
                                          ethylene glycol by changing the reaction time. The synthesized PHBDs were characterized in terms
                                          of Fourier transform infrared and proton nuclear magnetic resonance spectroscopy. A series of PUs at
                                          different NCO/OH and CO/PHBD ratios were prepared. The resulting CO/PHBD-based PUs were
                                          then characterized in terms of mechanical and thermal properties. Increasing PHBD content signifi-
                                          cantly increased the tensile strength of CO/PHBD-based PUs by 300% compared to neat CO-based
                                          PU. CO/PHBD-based PUs synthetized from short chain PHBD exhibited higher tensile strength
                                          compared to those produced from long chain PHBD. As revealed by scanning electron microscopy
                                          analysis, such improvement in stiffness of the resulting PUs is due to the good compatibility between
                                          CO and PHBD. Increasing PHBD content also increased the crystallinity of the resulting PUs. In
                                addition, higher degradation rates were obtained for CO/PHBD-based PUs synthetized from long
         
                                          chain PHBD compared to neat CO PU and PUs produced from short chain PHBD.
Citation: Saha, P.; Khomlaem, C.;
Aloui, H.; Kim, B.S. Biodegradable
                                          Keywords: poly (3-hydroxybutyrate); castor oil; polyurethane; biodegradation
Polyurethanes Based on Castor Oil
and Poly (3-hydroxybutyrate).
Polymers 2021, 13, 1387. https://
doi.org/10.3390/polym13091387
                                          1. Introduction
Academic Editor: Arantxa                        Polyurethanes (PUs) formed by the exothermic reaction between petroleum-based
Eceiza Mendiguren                         polyols containing two or more hydroxyl groups and isocyanates containing two or more
                                          isocyanate groups are the leading polymer families with an overall production ranked
Received: 31 March 2021                   sixth around the world [1–4]. However, the extensive use of such petroleum-based polyols
Accepted: 21 April 2021                   may lead to environmental pollution, and petroleum reserves depletion with a substan-
Published: 24 April 2021                  tial increase in oil prices [5,6]. Therefore, scientists have been interested in the use of
                                          biobased resources for PU formulation. Recently, vegetable oils have been investigated as
Publisher’s Note: MDPI stays neutral      inexpensive alternatives to petroleum-based polyols [7,8].
with regard to jurisdictional claims in         Vegetable oils are mainly composed of triglyceride chains with a fatty acid triester of
published maps and institutional affil-   glycerol containing 12–22 carbon atoms and 0–3 carbon-carbon double bonds [5]. Among a
iations.                                  variety of vegetable oils, castor oil (CO) has shown great potential in the green synthesis
                                          of PUs due to the presence of hydroxyl groups in its triglyceride chain [9,10]. Despite
                                          their good thermal stability, CO-based PUs exhibit poor mechanical properties and low
                                          biodegradation rate which may limit their application in many fields [10,11].
Copyright: © 2021 by the authors.               Poly(3-hydroxybutyrate) (PHB), an aliphatic polyester produced via bacterial fermen-
Licensee MDPI, Basel, Switzerland.        tation, has drawn a considerable attention due to its biocompatibility and biodegradabil-
This article is an open access article    ity [9]. However, due to its inherent brittleness, the use of PHB may be restricted in wide
distributed under the terms and           applications. To overcome this limitation, different soft segments including polyethylene
conditions of the Creative Commons        glycol (PEG), polycaprolactone (PCL), polybutylene adipate and polyglycerol sebacate,
Attribution (CC BY) license (https://
                                          were incorporated into PHB-based PUs [12–16]. Several additives such as PCL, soy filler,
creativecommons.org/licenses/by/
                                          isosorbide, glycerol, cellulose, PEG, and molasses have been used with the aim to improve
4.0/).

Polymers 2021, 13, 1387. https://doi.org/10.3390/polym13091387                                         https://www.mdpi.com/journal/polymers
Biodegradable Polyurethanes Based on Castor Oil and Poly (3-hydroxybutyrate)
Polymers 2021, 13, 1387                                                                                            2 of 22

                          the mechanical properties of CO-based PUs along with increasing their biodegradation
                          rate [11,16–18]. Chen et al. [19] prepared a CO-based polyurethane urea from CO and
                          4-aminophenyl disulfide and reported an increase in the mechanical properties and repro-
                          cessibility of the resulting films. A short chain fluorine containing chain extender 2,2,3,3-
                          tetrafluoro-1,4-butanediol was used for the preparation of CO-based PU and a decrease
                          in the tensile properties of the resulting films was observed as a result of increasing chain
                          extender content [20]. In another work, cellulose acetate modified with methylene diphenyl
                          diisocyanate (MDI) was used as a hard segment for the improvement of mechanical and
                          thermal properties of CO-based PU [21]. Overall, the incorporation of such bio-additives
                          may increase the hydroxyl numbers which may enhance the crosslinking of the polymers
                          and thereby increase urethane groups. Urethane, amides, and esters are reported to be
                          vulnerable to microbial attack and can be hydrolyzed to smaller molecules [11,18].
                               In this study, various end-capped PHB diols (PHBDs) of different molecular weights
                          were synthesized through transesterification of bacterial PHB and ethylene glycol by chang-
                          ing the reaction time. Using PHBDs with CO as a polyol, new types of biodegradable
                          biobased PUs were prepared using hexamethylene diisocyanate (HMDI) as a crosslink-
                          ing agent. A series of CO/PHBD-based PUs were produced at different NCO/OH and
                          CO/PHBD ratios. The resulting CO/PHBD-based PUs were then characterized in terms of
                          mechanical and thermal properties. The effect of the molecular weight of the synthesized
                          PHBDs on the properties of PU was also assessed. In addition, a soil burial biodegradation
                          assay was carried out to evaluate the biodegradation rate of the prepared PUs.

                          2. Materials and Methods
                          2.1. Materials
                               Castor oil, chloroform, p-toluenesulfonic acid (p-TSA), sodium hydrogen phosphate
                          (Na2 HPO4 × 12H2 O), ammonium sulfate ((NH4 )2 SO4 ), magnesium sulfate (MgSO4 ),
                          dipotassium phosphate (KH2 PO4 ), calcium chloride (CaCl2 ), sodium chloride (NaCl),
                          glucose, and ethylene glycol (99%) were purchased from Samchun Chemicals (Korea). 1,6-
                          hexamethylene diisocyanate and dibutyltin dilaurate were supplied from Sigma-Aldrich.
                          All reagents used in this study were of analytical grade.

                          2.2. PHB Production and Extraction
                                The PHB polymer used for the synthesis of end-capped PHB diols in this study
                          was produced by Cupriavidus necator KCTC 2649 as previously described by Khomlaem
                          et al. [22]. Briefly, a minimal medium containing 1 g/L of (NH4)2 SO4 , 9 g/L of Na2 HPO4 ×
                          12H2 O, 1 g/L of MgSO4 × 7H2 O, 0.5 g/L of KH2 PO4 , 20 mg/L of CaCl2 × 2H2 O, 10 g/L
                          of NaCl, and 2 mL/L of trace element solution supplemented with 20 g/L of glucose was
                          used for C. necator KCTC 2649 cultivation in shake flasks. The produced PHB polymer was
                          extracted from lyophilized cells using hot chloroform as a solvent according to the method
                          described by Fiorese et al. [23] with some modifications. Briefly, 1 g of freeze-dried bacterial
                          cells was suspended in 100 mL of hot chloroform (60 ◦ C) for 2 h under continuous stirring.
                          The resulting suspension was filtered through Whatman No.1 filter paper. The filtrate
                          was then poured into glass Petri plates and kept for 24 h under a chemical laminar flow
                          hood for complete solvent evaporation. The recovered polymer was characterized in terms
                          of Fourier transform infrared (FTIR) and proton nuclear magnetic resonance (1H-NMR)
                          analysis.

                          2.3. Preparation of PHB Diol
                               PHBDs of different molecular weights were synthesized by transesterification of the
                          purified bacterial PHB and ethylene glycol using p-TSA as a catalyst [13]. Briefly, 1 g of the
                          purified PHB was dissolved in chloroform and refluxed under nitrogen atmosphere. After
                          complete dissolution, 2 g of ethylene glycol and 0.48 g of p-TSA were added in the solution
                          and the reaction temperature was set at 60 ◦ C. The transesterification reaction was carried
                          out at 2 h intervals for 8 h. After the reaction, the resulting solutions were rinsed 4 times
Polymers 2021, 13, 1387                                                                                         3 of 22

                          with deionized water and the organic phase was separated and dried at room temperature
                          to obtain PHBDs of different molecular weights. The resulting PHBDs were designated as
                          PHBD 2h, PHBD 4h, PHBD 6h, and PHBD 8h.

                          2.4. Preparation of CO/PHBD-Based Polyurethane (CO/PHBD PU)
                               CO was mixed with the synthesized PHBD 8h in chloroform at different CO/PHBD
                          weight ratios of 9/1, 8/2, 7/3, and 6/4, respectively. After thorough mixing, HMDI and
                          dibutyltin dilaurate (0.1% v/w) used as crosslinking agent and catalyst, respectively, were
                          added to the mixture. Afterwards, the mixture was continuously stirred for 1 h at room
                          temperature. An excess of chloroform was added to dilute the obtained viscous reaction
                          mixture. The resulting solution was poured in polytetrafluoroethylene plate and degassed
                          under vacuum for 5–10 min at 50–60 ◦ C before being cured at 80 ◦ C for 24 h. Different
                          NCO/OH molar ratios from 1.0 to 4.0 were used throughout the reaction. The effects
                          of both NCO/OH and CO/PHBD ratios on the functional properties of the resulting
                          CO/PHBD PU were studied. Based on these results, NCO/OH and CO/PHBD ratios of
                          4.0 (mol/mol) and 6/4 (g/g), respectively, were selected for the synthesis of CO/PHBD
                          PUs using different molecular weight PHBDs. The effect of PHBD molecular weight on
                          the resulting PUs was investigated in terms of mechanical and thermal properties. A neat
                          CO/PU was also synthesized using the same process with an NCO/OH ratio of 4.0.

                          2.5. Analytical Procedures
                          2.5.1. Fourier Transform Infrared
                              FTIR analysis was conducted using a Nicolet model Magna-IR 200 FTIR spectrometer
                          (Thermo Fisher Scientific, Waltham, MA, USA). Dried PHBD and CO/PHBD PU samples
                          were mixed with KBr at 1:100 ratio to make pellets. The spectra were collected in a range of
                          4000–400 cm−1 with a spectral resolution of 32 cm−1 and 32 scans.

                          2.5.2. Nuclear Magnetic Resonance
                               1 H-NMR    measurements were recorded on a Brucker AVANCE 500 MHz spectropho-
                          tometer with deuterated chloroform as a solvent. All chemical shifts were reported in ppm
                          relative to trimethylsilane as an internal standard.

                          2.5.3. Molecular Weight Analysis
                               The number average molecular weights of the synthesized PHBDs were calculated as
                          the ratio of 1 H-NMR peak intensity at 4.2 ppm and 2.5 ppm as previously reported [12].

                          2.5.4. Hydroxyl Content Determination
                               The hydroxyl content of the synthesized PHBD was determined by the reflux phthala-
                          tion method. Briefly, 112 g phthalic anhydride was thoroughly mixed with pyridine. Then,
                          PHBD was added to the mixture and kept at 120 ◦ C under reflux. After the reaction, the
                          mixture was titrated against NaOH solution using phenolphthalein as an indicator.

                          2.5.5. Mechanical Analysis
                                CO/PHBD PU film samples were cut into 50 mm × 10 mm specimens and tested for
                          their mechanical properties in terms of tensile strength and elongation at break using a
                          universal testing machine (UTM, LR-30K, Lloyd Instruments, Hampshire, UK) with a load
                          cell of 5 kN and a crosshead speed of 5 mm/min. Seven replicates of each film type were
                          tested.

                          2.5.6. Thermal Analysis
                                Calorimetric measurements were carried out using a Q2000 differential scanning
                          calorimeter (DSC, TA Instruments, New Castle, DE, USA). Thermal analysis was carried
                          out at a scanning rate of 20 ◦ C/min. Samples (~3 mg) were heated to 200 ◦ C and maintained
                          for 5 min to erase previous thermal history before being cooled to −40 ◦ C at a cooling rate
Polymers 2021, 13, 1387                                                                                        4 of 22

                          of 20 ◦ C/min. Samples were then reheated to 200 ◦ C at a scanning rate of 20 ◦ C/min (2nd
                          heating) under nitrogen atmosphere using a nitrogen flow rate of 40 mL/min. Percentage
                          crystallinity (Xc ) of the synthesized polymer samples was determined using the following
                          Equation (1):
                                                                         ∆Hm
                                                                   Xc =                                           (1)
                                                                        w∆H0m
                          where ∆Hm is the melting enthalpy (J/g) of sample, w is the weight fraction of PHB in PU,
                          and ∆H0m is the melting enthalpy of 100% crystalline PHB (146 J/g) [13].
                              Thermal degradation studies were carried out using TA Instruments D-TGA, SDT
                          2960 thermal analyzer. Experiments were conducted in air atmosphere at heating scans
                          from 30 to 600 ◦ C under dynamic heating rate of 10 ◦ C/min (sample amount: 3–5 mg).

                          2.5.7. Scanning Electron Microscope
                               The surface morphology of the synthesized PUs was analyzed using a scanning
                          electron microscope (SEM, LEO-1530, Carl Zeiss, Zurich, Switzerland) at an accelerating
                          voltage of 20 kV. Before analysis, film samples were placed on a SEM template, air dried,
                          and carbon coated.

                          2.5.8. Solubility Test
                               The solubility of CO/PHBD PU was measured in both chloroform and water. Films
                          (~20 mg) were cut and placed inside vials containing 1 mL of chloroform and water. Then,
                          the vials were continuously stirred in a shaking incubator for 24 h at room temperature.
                          Films were then taken out of the vials and dried. Solubility was determined by the film
                          mass loss using the following Equation (2):

                                                                          W1 − W2
                                                       Solubility (%) =           × 100                           (2)
                                                                            W1

                          where W1 is the initial mass of the films and W2 is the dried mass after the test.

                          2.5.9. Soil Biodegradation Test
                               Soil biodegradation test was carried out under aerobic condition. PU films cut into
                          15 mm × 10 mm rectangular strips were weighed (W1 ) and buried in 50 mL capacity
                          tube containing 50 g of moist soil (pH 6.8) collected from Chungbuk National University
                          campus. The soil height inside the tube was 100 mm and the test film samples were placed
                          at 50 mm depth. To maintain soil humidity, 1 mL water was sprayed over the open surface
                          of soil after 2 days. Weights of the PU films (Wd ) were measured every 7 days over a
                          period of 35 days. After each sampling time, samples were taken out from soil, rinsed with
                          water to remove adhered soil, and dried at room temperature for 24 h. The degree of film
                          biodegradation was determined as the weight loss using Equation (3).

                                                                              W − Wd
                                                                                      
                                                Residual weight (%) = 1 − 1              × 100                   (3)
                                                                                  W1

                          3. Results and Discussion
                          3.1. PHB and PHBD Characterization
                                The reaction scheme related to the synthesis of PHBDs from bacterial PHB preparation
                          is given in Scheme 1. The synthesized PHBDs were characterized in terms of FTIR, NMR,
                          and DSC.
3. Results and Discussion
                          3.1. PHB and PHBD Characterization
Polymers 2021, 13, 1387        The reaction scheme related to the synthesis of PHBDs from bacterial PHB prepara- 5 of 22
                          tion is given in Scheme 1. The synthesized PHBDs were characterized in terms of FTIR,
                          NMR, and DSC.

                               Scheme
                          Scheme       1. Transesterification
                                 1. Transesterification       reaction
                                                        reaction of PHBofinto
                                                                          PHBPHB
                                                                              intodiol
                                                                                  PHB diol.

                                 3.1.1. FTIR Analysis
                          3.1.1. FTIR Analysis
                                       FTIR spectra of PHB and PHBDs are shown in Figure 1. Peaks at−1 2930 cm−1 and
                               FTIR spectra of−PHB       and PHBDs are shown in Figure 1. Peaks at 2930 cm and 1455–
                                 1455–1460 cm 1 correspond to the –CH stretching vibrations [13]. The strong and sharp
                          1460 cm−1 correspond to the –CH stretching vibrations             [13]. The strong and sharp absorb-
                                 absorbance bands observed at 1710–1727 cm−1 are assigned to carbonyl C=O stretching
                          ance bands
                                 modesobserved
                                          of PHB at   1710–1727
                                                    and   PHBDs cm [13]. are
                                                                      −1
                                                                          Theassigned    to carbonyl
                                                                                peak observed       in C=O   stretching
                                                                                                        the range         modes ofcm−1
                                                                                                                     of 1180–1193
                          PHB and     PHBDs     [13]. The   peak  observed    in the  range    of 1180–1193    cm  −1 indicates the
                                 indicates the stretching vibration of C–O–C, while the peaks at 1250 cm 1 suggest the    −
                          stretching   vibration
                                 presence   of theofC–O
                                                      C–O–C,    while
                                                           stretch modetheofpeaks
                                                                              PHBat    1250 cm−1The
                                                                                     structure.     suggest
                                                                                                         broadthe  presence
                                                                                                                peak         of the
                                                                                                                       observed   in PHB
                          C–O stretch    mode    of PHB    structure.
                                                           − 1        The   broad   peak   observed    in
                                 spectrum at 3430 cm corresponds to hydrogen bonded –OH group with alkoxy  PHB  spectrum    at 3430 [15].
                          cm−1 corresponds     to hydrogen
                                 As it can be inferred    frombonded     –OH group
                                                                FTIR spectra    of the with   alkoxy [15].
                                                                                        synthesized    PHBDs,As itpeak
                                                                                                                   can be  inferred
                                                                                                                        intensity  related
                          from FTIR    spectra   of the synthesized    PHBDs,    peak   intensity  related  to hydrogen
                                 to hydrogen bonded –OH group increased compared to the neat PHB, suggesting the            bonded
                          –OH group      increased
                                 formation           compared
                                             of hydroxyl          to the neat
                                                             end groups   after PHB,   suggesting the formation
                                                                                PHB transesterification                of hydroxyl
                                                                                                             with ethylene    glycol.
                          end groups after PHB transesterification with ethylene glycol.
Polymers 2021, 13, 1387                                                                                                             6 of 22
 Polymers 2021, 13, x FOR PEER REVIEW                                                                                               6 of 24

                             Figure 1. FTIR spectra of PHB and PHBDs obtained from different reaction time.

                             3.1.2. 1H NMR Spectra
                                  1 H NMR spectra of PHB and PHBD 8h in Figure 2 display three characteristic peaks
                             corresponding to CH3 group at 1.29 ppm (peak a), CH2 at 2.5 ppm (peak b), and CH group
                             at 5.27 ppm (peak c), which was in accordance with the 1H NMR pattern reported previ-
                             ously  [23]1.for
                                  Figure
                                 Figure        PHB
                                          1.FTIR
                                             FTIR    produced
                                                   spectra
                                                  spectra   ofPHB
                                                           of  PHBbyand
                                                                      C. PHBDs
                                                                     and necator KCTC
                                                                          PHBDsobtained
                                                                                 obtained 2649.
                                                                                            fromdifferent
                                                                                           from   differentreaction
                                                                                                             reactiontime.
                                                                                                                      time.
                                   Two sets of new complex peak signals at 3.8 ppm (peak d) and 4.2 ppm (peak e) were
                                 3.1.2.  1 NMR Spectra
                                  3.1.2. 1H
                             observed,    H NMR
                                          which   areSpectra
                                                       consistent with the formation of ester linkages between PHB terminal
                                       1 H NMR spectra of PHB and PHBD 8h in Figure 2 display three characteristic peaks
                             carboxyl 1group
                                         H NMRand       ethylene
                                                    spectra        glycol
                                                              of PHB   and[24,25].
                                                                             PHBD 8h Furthermore,
                                                                                         in Figure 2 the   peakthree
                                                                                                       display     areacharacteristic
                                                                                                                         at 4.2 ppm in-peaks
                                 corresponding
                             creased   with          to
                                              increasing CH    group
                                                           reaction     at
                                                                      time 1.29 ppm
                                                                             denoting  (peak
                                                                                        the    a), CH
                                                                                            successive    at  2.5 ppm
                                                                                                          degradation
                                  corresponding to CH3 group at 1.29 ppm (peak a), CH2 at 2.5 ppm (peak b), and CH group
                                                             3                                          2               (peak
                                                                                                                          of    b),
                                                                                                                             PHB.   and
                                                                                                                                    NMR CH
                                 group    at 5.27  ppm   (peak   c), which   was  in accordance    with   the  1 H NMR pattern reported
                             spectra  of  PHBD     2h to  PHBD    6h  are  provided   in Supplementary       Materials
                                  at 5.27 ppm (peak c), which was in accordance with the H NMR pattern reported previ-
                                                                                                        1                (Figure S1a–c).
                                 previously
                                  ously [23] for[23]PHB
                                                     for PHB    produced
                                                          produced     by C.by  C. necator
                                                                              necator  KCTC KCTC
                                                                                               2649.2649.
                                        Two sets of new complex peak signals at 3.8 ppm (peak d) and 4.2 ppm (peak e) were
                                  observed, which are consistent with the formation of ester linkages between PHB terminal
                                  carboxyl group and ethylene glycol [24,25]. Furthermore, the peak area at 4.2 ppm in-
                                  creased with increasing reaction time denoting the successive degradation of PHB. NMR
                                  spectra of PHBD 2h to PHBD 6h are provided in Supplementary Materials (Figure S1a–c).

                                 Figure 2. Cont.
Polymers 2021, 13, x FOR PEER REVIEW                                                                                                   7 of 24
  Polymers 2021, 13, 1387                                                                                                                 7 of 22

                                   Figure 2. NMR spectra of (a) PHB and (b) PHBD 8h.
                                 Figure 2. NMR spectra of (a) PHB and (b) PHBD 8h.
                                         Two sets of new complex peak signals at 3.8 ppm (peak d) and 4.2 ppm (peak e)
                                 3.1.3.
                                   were Molecular
                                          observed,Weight
                                                      whichAnalysis    of Synthesized
                                                             are consistent   with the PHBD
                                                                                         formation of ester linkages between PHB
                                   terminal  carboxyl
                                       As shown         group and
                                                   in Scheme  1, inethylene   glycolof[24,25].
                                                                    the presence       p-TSA Furthermore,
                                                                                               as a catalyst, the peak area
                                                                                                              ethylene      at 4.2
                                                                                                                        glycol     ppm
                                                                                                                               broke
                                 theincreased  with
                                      ester bond  andincreasing
                                                        producedreaction
                                                                  a doubletimehydroxyl
                                                                                denotingterminated
                                                                                           the successive degradation
                                                                                                      product   [26]. Theofmolecular
                                                                                                                           PHB. NMR
                                   spectraofofthe
                                 weights       PHBD    2h to PHBD
                                                  synthesized   PHBDs6h are
                                                                         areprovided
                                                                             shown ininTable
                                                                                           Supplementary     Materials
                                                                                                1. The molecular        (Figure
                                                                                                                   weight       S1a–c).
                                                                                                                            of PHBD
                                 drastically decreased after 2 h of alcoholysis reaction from 19233 to 7675 (g/mol) due to
                                   3.1.3. Molecular Weight Analysis of Synthesized PHBD
                                 the random cleavage mechanism [27]. However, this decrease in molecular weight was
                                         As shown with
                                 less pronounced    in Scheme    1, in the
                                                           increasing  the reaction
                                                                            presencetime
                                                                                      of p-TSA   as addition,
                                                                                           [28]. In  a catalyst,the
                                                                                                                 ethylene
                                                                                                                     hydroxylglycol  broke
                                                                                                                                 content
                                   the ester
                                 analysis    bondthat
                                          shows     andallproduced   a double~2hydroxyl
                                                            PHBDs contain         hydroxylterminated
                                                                                             groups in product      [26]. The
                                                                                                         each structure,        molecular
                                                                                                                             suggesting
                                   weights of the synthesized PHBDs are shown in Table 1. The molecular weight of PHBD
                                 that the hydroxyl end-capped PHBDs were successfully synthesized.
                                   drastically decreased after 2 h of alcoholysis reaction from 19233 to 7675 (g/mol) due to
                                   the random cleavage mechanism [27]. However, this decrease in molecular weight was
                                 Table 1. Molecular weight of PHBDs at different reaction time.
                                   less pronounced with increasing the reaction time [28]. In addition, the hydroxyl content
                                   analysis shows that all PHBDs contain ~2 hydroxyl groups in each structure,             Hydroxyl
                                                                                                                               suggesting
                                   that the hydroxyl
                                     Reaction Time (h) end-capped     PHBDs     were
                                                                Mn of PHBD (g/mol)   successfully   synthesized.
                                                                                                    ∆Hm (J/g)                Content
                                                                                                                              (mol)
                                   Table 1. Molecular weight of PHBDs at different reaction time.
                                               0                            -                           63.1                      -
                                       Reaction2 Time (h)             19233(g/mol)
                                                               Mn of PHBD      ± 20         ∆Hm (J/g) 55.7 Hydroxyl Content     1.99(mol)
                                               40                      7675
                                                                         -
                                                                              ± 16             63.1
                                                                                                        54.8                -
                                                                                                                                1.98
                                               62                      4817
                                                                    19233     ± 18
                                                                           ± 20                55.7     53.9              1.99 1.96
                                               84                      1890
                                                                    7675  ± 16± 16             54.8     53.2              1.98 1.92
                                                6                      4817 ± 18                    53.9                       1.96
                                 3.1.4. Thermal                1890 ± 16 PHB and PHBD
                                             8 Properties of Synthesized           53.2                                        1.92

                                       DSC curves for the neat PHB and the synthesized PHBDs are displayed in Figure
                                    3.1.4. Thermal Properties of Synthesized PHB and PHBD
                                 3a,b. Thermal properties of the neat PHB and the synthesized PHBDs in terms of glass
                                 transitionDSC(Tcurves   for the neat PHB and the synthesized PHBDs are displayed in Figure 3a,b.
                                                  g), crystallization (cold crystallization (Tcc), melt crystallization (Tmc)), and
                                   Thermal     properties
                                 melting temperature (T      of mthe neat
                                                                  ) are    PHB andinthe
                                                                        presented        synthesized
                                                                                       Figure            PHBDs
                                                                                                3. As shown     in in terms3a,
                                                                                                                   Figure     of the
                                                                                                                                 glass  transition
                                                                                                                                      neat PHB
                                   (T g
                                 polymer),  crystallization   (cold    crystallization  (T
                                              exhibited an exothermic melt crystallizationcc ), melt   crystallization
                                                                                                     peak (Tmc) at 77.5 °C.(T   )),  and
                                                                                                                              mc However, melting
                                                                                                                                             no
                                    temperature
                                 peak   related to(T   m ) are presented
                                                      exothermic     melting incrystallization
                                                                                Figure 3. As shown      in Figure
                                                                                                 (Tmc) was          3a, the
                                                                                                             recorded     forneat
                                                                                                                              the   PHB polymer
                                                                                                                                   synthesized
                                    exhibited    an exothermic                                                         ◦ C. However, no peak
                                 PHBD      samples.    As it can bemelt     crystallization
                                                                      inferred   from Figurepeak     (TPHBD
                                                                                                3b, all mc ) at 77.5
                                                                                                                 showed     a cold crystalliza-
                                    related
                                 tion  peakto(Texothermic       melting crystallization (Tmc ) was recorded for the synthesized PHBD
                                                 cc) except neat PHB. Overall, a decrease in the glass transition values of the
                                    samples. AsPHBDs
                                 synthesized        it can be
                                                            wasinferred   fromas
                                                                    observed     Figure 3b, all
                                                                                   a result  of PHBD     showed
                                                                                                 increasing         a cold crystallization
                                                                                                               transesterification           peak
                                                                                                                                       reaction
                                   (Tcc ) except neat PHB. Overall, a decrease in the glass transition values of the synthesized
                                 time. In this context, increasing the transesterification reaction time from 2 to 8 h led to a
                                    PHBDs was observed as a result of increasing transesterification reaction time. In this
Polymers 2021, 13, x FOR PEER REVIEW                                                                                         8 of 24

Polymers 2021, 13, 1387            decrease in the Tg value of the corresponding PHBD from 3.5 to 1.6 °C. Similar thermal 8 of 22
                                   outcomes were previously observed for polypropylene glycol (PPG)-PEG-PPG and PHB
                                   diol-based PUs [29]. PHB degradation by ethylene glycol increases the mobility of PHB
                                   chains, which may decrease the glass transition of the resulting PHBDs. In addition, these
                                   context, increasing
                                   synthesized   polymerthe   transesterification
                                                           chains                   reaction
                                                                  have enough mobility      to time   from 2during
                                                                                                crystallize    to 8 hreheating
                                                                                                                       led to a decrease
                                                                                                                                   scan,    in
                                   the T   value  of the  corresponding     PHBD     from   3.5  to  1.6 ◦ C. Similar thermal outcomes
                                         g
                                   resulting in an enhancement of Tcc from 48.7 to 58.9 °C [28,29].
                                   wereAspreviously
                                           shown in observed     for polypropylene
                                                      Figure 3b and   Table 1, a slight glycol  (PPG)-PEG-PPG
                                                                                         decrease   in both Tm and ∆H andm of
                                                                                                                            PHBthediol-based
                                                                                                                                    syn-
                                   PUs
                                   thetized PHBDs was noticed compared to the neat PHB. Likewise, the crystallinity of thewhich
                                        [29]. PHB   degradation   by  ethylene   glycol  increases   the  mobility  of  PHB    chains,
                                   may   decrease
                                   synthetized     the glass
                                                PHBDs         transition
                                                        decreased   in theof the resulting
                                                                           range  from 43.2 PHBDs.       In addition,
                                                                                              to 36.4% compared          these
                                                                                                                     to the  neatsynthesized
                                                                                                                                   PHB
                                   polymer
                                   polymer. chains   have enough
                                              This reduction         mobilityistomost
                                                              in crystallinity     crystallize  during
                                                                                        likely due        reheating
                                                                                                     to the decreasescan,
                                                                                                                        in theresulting
                                                                                                                                rigidity in an
                                   enhancement     of T
                                   and length of the   cc from 48.7
                                                      polymeric          [29].◦ C [28,29].
                                                                     to 58.9
                                                                 chains

  Polymers 2021, 13, x FOR PEER REVIEW                                                                                         9 of 24

                                              (a)Cooling
                                   Figure3.3.(a)
                                   Figure         Cooling  curves
                                                         curves   and
                                                                and (b)(b)
                                                                        2nd 2nd heating
                                                                            heating      curves
                                                                                    curves      of PHBDs.
                                                                                           of PHBDs.

                                         As shown
                                   3.2. Structural andin Figure 3b and
                                                       Morphological     Table 1, a ofslight
                                                                     Characterization             PU in both Tm and ∆Hm of the
                                                                                             decrease
                                                                                        CO/PHBD
                                   synthetized
                                        As shown  PHBDs
                                                   in Tablewas  noticed
                                                            1, the lowestcompared
                                                                          molecular to the neat
                                                                                    weight      PHB.was
                                                                                            of PHBD    Likewise,  the
                                                                                                           obtained   crystallinity
                                                                                                                    after 8 h of    of
                                   the synthetized
                                   reaction           PHBDs
                                            with ethylene       decreased
                                                             glycol.       in the range
                                                                     This PHBD    (PHBDfrom    43.2 then
                                                                                          8h) was   to 36.4%
                                                                                                          usedcompared     to of
                                                                                                                for a series  the neat
                                   CO/PHBD PU formulations to investigate the effects of NCO/OH and CO/PHBD ratios.
                                   The formulations for CO/PHBD PU 8h with different CO/PHBD ratios are given in Table
                                   S1. The schematic reaction pathway of CO/PHBD PU synthesis is shown in Scheme 2. The
                                   structure of the resulting PUs was characterized in terms of FTIR and SEM.
Polymers 2021, 13, 1387                                                                                                             9 of 22

                                PHB polymer. This reduction in crystallinity is most likely due to the decrease in the
                                rigidity and length of the polymeric chains [29].

                                3.2. Structural and Morphological Characterization of CO/PHBD PU
                                              As shown in Table 1, the lowest molecular weight of PHBD was obtained after 8 h
                                        of reaction with ethylene glycol. This PHBD (PHBD 8h) was then used for a series of
                                        CO/PHBD PU formulations to investigate the effects of NCO/OH and CO/PHBD ratios.
                                        The formulations for CO/PHBD PU 8h with different CO/PHBD ratios are given in Table S1.
                                        The
            Polymers 2021, 13, x FOR PEER    schematic reaction pathway of CO/PHBD PU synthesis is shown in 10
                                          REVIEW                                                                 Scheme
                                                                                                                   of 24 2. The
                                        structure of the resulting PUs was characterized in terms of FTIR and SEM.

                                             Scheme
                                         Scheme      2. Synthetic
                                                 2. Synthetic     pathway of
                                                                pathway   of CO/PHBD
                                                                             CO/PHBD PU PU.

                                      3.2.1. FTIR Spectra
                                3.2.1. FTIR Spectra
                                          FTIR spectra of the synthesized PUs at different CO/PHBDs and NCO/OH ratios are
                                    FTIR
                                    shownspectra
                                            in Figureof4.the
                                                          Thesynthesized     PUs at
                                                               peaks at 3341–3416 cmdifferent
                                                                                     −1 indicate CO/PHBDs       and
                                                                                                 the formation of N–HNCO/OH
                                                                                                                       stretchingratios are
                                    in the PU  structure   [30]. Peaks at 1457 cm−1 and−  1
                                                                                         1090 cm  –1 confirm the presence of sym-
                                shown in Figure 4. The peaks at 3341–3416 cm indicate the formation of N–H stretching
                                      metric C–H and C–O bending vibration, respectively [29]. In addition, bands assigned to
                                      the free urethane bands (C=O) are centered around 1724–1730 cm−1 (amide I), while the
                                      band attributed to the formation of amide II stretching vibration (C–N and N–H) is ob-
Polymers 2021, 13, 1387                                                                                                                       10 of 22

                                       in the PU structure [30]. Peaks at 1457 cm−1 and 1090 cm–1 confirm the presence of
                                       symmetric C–H and C–O bending vibration, respectively [29]. In addition, bands assigned
                                       to the free urethane bands (C=O) are centered around 1724–1730 cm−1 (amide
      Polymers 2021, 13, x FOR PEER REVIEW                                                                                          11 of 24 I), while
                                       the band attributed to the formation of amide II stretching vibration (C–N and N–H) is
                                       observed in the range of 1560–1567 cm−1 [30]. The peaks at 1627–1632 cm−1 represent the
                                       double   bonds
                                        served in          (C=C)
                                                   the range       of the castor
                                                               of 1560–1567         oil triglyceride
                                                                              cm−1 [30].               chain and
                                                                                         The peaks at 1627–1632  cmthe    formation
                                                                                                                     −1 represent      of symmetric
                                                                                                                                  the dou-
                                       biuret (C=O)
                                        ble bonds       stretching
                                                    (C=C)             in the
                                                            of the castor      PU structure
                                                                          oil triglyceride     [31,32].
                                                                                           chain and theThe   absence
                                                                                                          formation       of the typical
                                                                                                                      of symmetric   biuretisocyanate
                                        (C=O)
                                       peak     2270 cm−in1 the
                                             atstretching          PU structure
                                                                suggested    that[31,32].
                                                                                   excessThe   absence of
                                                                                           isocyanate      the typical
                                                                                                        groups          isocyanate
                                                                                                                  reacted          peak at to form
                                                                                                                             with urethane
                                        2270 cm
                                       biuret branching      [32]. Moreover, the intensity of the peak at 1627–1630 cm−1 biuret
                                                 −1 suggested that excess isocyanate groups reacted with urethane to form
                                                                                                                                      increased with
                                       increasing the NCO/OHthe
                                        branching    [32]. Moreover,       intensity
                                                                        ratio         of the to
                                                                                compared     peak
                                                                                                theatfree
                                                                                                      1627–1630  cm−1group
                                                                                                          urethane      increased  with
                                                                                                                               (1730   cmin-
                                                                                                                                           −1 ), which
                                        creasing the NCO/OH ratio compared to the free urethane group (1730 cm−1), which may
                                       may suggest the establishment of interactions between urethane and NCO groups.
                                      suggest the establishment of interactions between urethane and NCO groups.

                                     Figure 4. Cont.
Polymers 2021, 13, 1387                                                                                                                   11 of 22
      Polymers 2021, 13, x FOR PEER REVIEW                                                                                     12 of 24

                                       (c)

                                       Figure 4. FTIR spectra of CO/PHBD PU 8h at (a) different CO/PHBD ratios and (b) different
                                     Figure 4. FTIR spectra of CO/PHBD PU 8h at (a) different CO/PHBD ratios and (b) different
                                      NCO/OH ratios; (c) image of CO/PHBD PU 8h.
                                     NCO/OH ratios; (c) image of CO/PHBD PU 8h.
                                       3.2.2. Morphological Analysis
                                     3.2.2. Morphological Analysis
                                           SEM images of neat CO PU and CO/PHBD PU 8h showed smooth and cohesive sur-
                                      face SEM   images(Figure
                                           morphology      of neat
                                                                 S2),CO   PU andtheCO/PHBD
                                                                      suggesting                     PUchain
                                                                                       ability of short   8h showed     smooth
                                                                                                              length PHBD         anda cohesive
                                                                                                                             to form
                                     surface morphology
                                      compatible             (Figure S2),
                                                  and homogenous            suggesting
                                                                       network    with CO  theinability of shortofchain
                                                                                                 the presence      HMDI. length  PHBD to form
                                                                                                                           Increasing
                                     aNCO/OH
                                       compatible
                                                ratioand
                                                      fromhomogenous         network
                                                            2.0 to 4.0 enhanced          with CO inofthe
                                                                                   the cohesiveness      the presence
                                                                                                             synthesizedofPUs
                                                                                                                            HMDI.    Increasing
                                                                                                                               as con-
                                     NCO/OH       ratio
                                      firmed by the      fromof2.0
                                                     absence         to and
                                                                 holes   4.0 irregularities
                                                                              enhanced the       cohesiveness
                                                                                             on the surface of PUsof synthetized
                                                                                                                      the synthesized
                                                                                                                                  from PUs as
                                      the highestby
                                     confirmed    NCO/OH     ratio of
                                                     the absence   of4holes
                                                                        (Figure
                                                                              andS2c) [13,33].
                                                                                    irregularities  on the surface of PUs synthetized from
                                     the highest NCO/OH ratio of 4 (Figure S2c) [13,33].
                                       3.3. Mechanical Analysis of CO/PHBD PU
                                      3.3.1.
                                     3.3.    Effect of NCO/OH
                                          Mechanical    AnalysisRatio
                                                                 of CO/PHBD PU
                                     3.3.1. The
                                             Effect of NCO/OH
                                                 effect of NCO/OHRatio
                                                                     ratio on the mechanical properties of CO/PHBD PU 8h is
                                      shown in Figure 5a. It was observed that the CO/PHBD PU at an NCO/OH ratio of 1.0 was
                                           The effect of NCO/OH ratio on the mechanical properties of CO/PHBD PU 8h is
                                      too weak to be mechanically tested. Increasing NCO/OH ratio from 2.0 to 4.0 significantly
                                     shown in Figure 5a. It was observed that the CO/PHBD PU at an NCO/OH ratio of 1.0 was
                                      increased the tensile strength and elongation at break of the resulting CO/PHBD PU from
                                     too
                                      7.16weak  toMPa
                                           to 14.8 be mechanically
                                                        and from 7.70 tested.
                                                                        to 27.4%,Increasing    NCO/OH
                                                                                    respectively.           ratio
                                                                                                   This trend wasfrom    2.0 to 4.0with
                                                                                                                   in agreement      significantly
                                     increased   the tensile
                                      previous studies        strength
                                                        [33,34].        and elongation
                                                                 Such improvement      in theatmechanical
                                                                                                break of the  resulting
                                                                                                           properties      CO/PHBD
                                                                                                                       of the resulting PU from
                                     7.16 to 14.8PU
                                      CO/PHBD      MPa
                                                     can and   from 7.70
                                                          be attributed     to 27.4%,
                                                                        to the  ability ofrespectively.  Thisthe
                                                                                            HMDI to enhance    trend  was inadhesion
                                                                                                                  interfacial   agreement with
                                     previous
                                      between COstudies  [33,34].leading
                                                    and PHBD,       Such improvement
                                                                          to the formationinofthe   mechanical
                                                                                                 a compatible  andproperties
                                                                                                                    homogenous   of net-
                                                                                                                                    the resulting
                                      work as revealed
                                     CO/PHBD       PU canby be
                                                            SEM   analysis [34–36].
                                                                attributed   to the ability of HMDI to enhance the interfacial adhesion
                                     between CO and PHBD, leading to the formation of a compatible and homogenous network
                                     as revealed by SEM analysis [34–36].

                                     3.3.2. Effect of CO/PHBD Ratio
                                           The stress-strain curves of the synthesized PUs at different CO/PHBD ratios using a
                                     constant NCO/OH ratio of 4.0 is shown in Figure 5b. Overall, increasing PHBD content
                                     significantly increased the tensile strength of the resulting CO/PHBD PU. This increase
                                     was estimated by 300% for CO/PHBD PU incorporating the highest PHBD content (6/4
                                     CO/PHBD PU) compared with the neat CO PU. However, a significant decrease in the
                                     elongation at break of the resulting CO/PHBD PU was recorded as a result of increasing
                                     PHBD content. This behaviour can be ascribed to the formation of biurets inside the PU
                                     matrix [37] along with the high crystallinity of the incorporated PHB. Nonetheless, the
                                     resulting CO/PHBD PU becomes brittle with further increase in PHBD content. As shown
                                     in DSC analysis (discussed later), the CO PU did not reveal any crystalline peak which
                                     confirms the amorphous structure of the resulting film [37]. Upon the addition of PHBD,
                                     crystalline peaks were observed denoting the semicrystalline structure of the synthesized
                                     PHBD, which may explain the high stiffness of the resulting CO/PHBD PU. Such increase
                                     in tensile strength may restrict the molecular chain movement in polymers and ultimately
                                     decreased their elongation at break. Further, with increasing PHBD content, the portion
                                     of castor oil as soft segment decreased, which may explain in part the decrease in the
                                     flexibility of the resulting CO/PHBD PU. Overall, CO/PHBD PU 8h produced in this study
Polymers 2021, 13, 1387                                                                                                           12 of 22

                                    exhibited higher tensile strength compared to CO/cellulose-based PU [38], CO-derived
                                    poly(urethane urea) [19], and CO/MDI-modified cellulose acetate-based PU [21]. However,
                                    the elongation at break of the synthesized CO/PHBD PU 8h was lower than that
   Polymers 2021, 13, x FOR PEER REVIEW                                                                           13 of of
                                                                                                                        24 the
                                    CO-based PUs reported in the studies mentioned above.

                                Figure 5.
                               Figure    5. (a)
                                            (a) Effect
                                                Effect of
                                                       ofNCO/OH
                                                          NCO/OH   ratio (CO/PHBD
                                                                     ratio  (CO/PHBD  ratio: 6/4) and
                                                                                          ratio:  6/4)(b)
                                                                                                       andCO/PHBD  ratio (NCO/OH
                                                                                                            (b) CO/PHBD            ra-
                                                                                                                           ratio (NCO/OH
                                tio: 4.0) on  mechanical  properties of the  resulting PU.
                               ratio: 4.0) on mechanical properties of the resulting PU.

                                3.3.2.
                               3.4.    Effect of
                                    Thermal       CO/PHBD
                                              Analysis         Ratio
                                                         of CO/PHBD       PU
                               3.4.1. The
                                       Differential  Scanning     Calorimetry    of CO/PHBD
                                           stress-strain curves of the synthesized                PU
                                                                                        PUs at different CO/PHBD ratios using a
                                constant   NCO/OH
                                     The second        ratio of
                                                    heating      4.0 is of
                                                               curves   shown   in Figure 5b.CO/PHBD
                                                                           the synthesized     Overall, increasing
                                                                                                           PU 8h atPHBD      content
                                                                                                                      different   PHBD
                                significantly
                               contents         increased
                                           are shown     in the  tensile
                                                             Figure   6a.strength  of theofresulting
                                                                           Regardless                CO/PHBD
                                                                                            the CO/PHBD          PU.only
                                                                                                              ratio,  This one
                                                                                                                            increase
                                                                                                                                Tg was
                                was estimated
                               detected           by 300%
                                          at the range       for
                                                          of − 5.1CO/PHBD     PU incorporating
                                                                   to 2.7 ◦ C [9,12]. Overall, Tg the  highestupon
                                                                                                   increased    PHBD thecontent  (6/4
                                                                                                                         incorporation
                                CO/PHBD      PU)   compared     with   the neat CO   PU.  However,   a significant
                               of PHB which may suggest a partial mixing between hard and soft segment phase        decrease  in  the[15].
                                elongation   at  break of  the  resulting  CO/PHBD     PU   was recorded  as a result of
                               Neither crystallization nor melting peaks were detected for the pure CO PU confirming the  increasing
                                PHBD content.
                               amorphous           This behaviour
                                              structure               can be ascribed
                                                           of the polymer.    As shown  to in
                                                                                           theFigure
                                                                                               formation  of biurets inside
                                                                                                     6a, crystallization     themelting
                                                                                                                           and    PU
                                matrix [37] along with the high crystallinity of the incorporated PHB. Nonetheless, the
                               peaks appeared in the thermograms of the synthesized PUs upon the incorporation of
                                resulting CO/PHBD PU becomes brittle with further increase in PHBD content. As shown
                               PHBD. A slight shift in cold crystallization temperature (Tcc ) to lower values was recorded
                                in DSC analysis (discussed later), the CO PU did not reveal any crystalline peak which
                                confirms the amorphous structure of the resulting film [37]. Upon the addition of PHBD,
                                crystalline peaks were observed denoting the semicrystalline structure of the synthesized
Polymers 2021, 13, 1387                                                                                                       13 of 22

                                         as a result of increasing PHBD content, indicating an increase in the crystallization rate of
                                         PHBD component from the glassy state in the synthesized PUs [9]. This behavior can be
                                         attributed to the decrease in CO content which may decrease the chemical crosslinking
                                         degree in the PU matrix. Melting enthalpies of CO/PHBD PU 8h significantly increased
                                         from 1.00 to 8.13 J/g with increasing PHBD content. No evident shifts occurred in the
                                         melting peak of the synthesized PUs as a result of increasing PHBD content. Overall, the
                                         melting enthalpies of the synthesized PUs were lower than the pure PHBD (∆Hm 63.1 J/g),
                                         which might be resulted from the disruption in PHB chain by soft CO dangling structure
                                         and phase mixing between CO and PHBD segments [9,36]. In fact, this phase mixing is
                                         expected to reduce the homogeneity of PHB chains. As shown in Table 2, increasing PHBD
                                         content significantly increased the percentage crystallinity of the synthesized
        Polymers 2021, 13, x FOR PEER REVIEW                                                                   15 of 24   CO/PHBD
                                         PU from 6.87 to 14.0%.

                                  Figure 6. Cont.
Polymers 2021, 13, 1387                                                                                                                          14 of 22
       Polymers 2021, 13, x FOR PEER REVIEW                                                                                    16 of 24

                                        Figure 6.6.(a)
                                       Figure          DSC,
                                                     (a)    (b) (b)
                                                         DSC,   TGA, and (c)
                                                                    TGA,  andderivative TGA curves
                                                                                (c) derivative TGA of CO/PHBD
                                                                                                      curves ofPU 8h.
                                                                                                                CO/PHBD PU 8h.
                                        3.4.2. Thermogravimetric Analysis of CO/PHBD PU
                                       Table 2. Crystallinity, melting enthalpy, and TGA data of CO/PHBD PU 8h.
                                              TGA and derivative TGA (DTGA) curves of the synthesized PUs are shown in Figure
                                        6b,c. As it can be inferred from the figures, both neat CO PU and CO/PHBD        PU 8h showed
                                            CO/PHBD              ∆H (J/g)            Xc (%)            T10% (◦ C)         T50% (◦ C)       T90% (◦ C)
                                        a similar pattern of thermalm behavior with three     thermal degradation    steps. For neat CO
                                        PU, the1/0
                                                first degradation step - at 278–302 °C corresponds
                                                                                         -            to thermally
                                                                                                           301     labile urethane
                                                                                                                              379 link-       534
                                        ages, whereas
                                                9/1 the second 1.00  and third steps are
                                                                                       6.87due to the degradation
                                                                                                           305       of CO triglyceride
                                                                                                                              377             475
                                        structure
                                                8/2 [9,37]. As shown2.89
                                                                       in Figure 6c, new
                                                                                       9.91evident peaks295 at 270–300 °C appeared
                                                                                                                              371     in      474
                                        DTGA 7/3curves of CO/PHBD       PU 8h, which 10.6
                                                                     4.65               are associated with285 the degradation361of PHB       468
                                        segment   as a consequence8.13
                                                6/4                   of its low thermal
                                                                                       14.0stability, while272
                                                                                                            the second and third
                                                                                                                              344 steps       481
                                        correspond to CO decomposition [9]. Urethane dissociation produces isocyanate, alcohol,
                                        primary amines, and olefins through the formation of secondary amines and CO2 [39].
                                       3.4.2.TGA
                                               Thermogravimetric
                                                     data showed that T10%Analysis    of CO/PHBD
                                                                              (temperature  at 10% loss)PU and T50% decreased with in-
                                        creasing PHBD content (Table 2), indicating a decrease in the thermal stability of the re-
                                              TGA and derivative TGA (DTGA) curves of the synthesized PUs                                  are shown in
                                        sulting CO/PHBD PU 8h most likely due to the reduction in stable triglyceride molecule.
                                       Figure 6b,c. As it can be inferred from the figures, both neat CO PU and CO/PHBD
                                       PU
                                        3.5. 8h  showed
                                             Solubility      a similar
                                                         of CO/PHBD   PUpattern of thermal behavior with three thermal degradation steps.
                                       For neat     CO     PU,  the first  degradation      step                 ◦ C corresponds to thermally labile
                                              The solubility of the synthesized     CO/PHBD     PUatwas
                                                                                                      278–302
                                                                                                          determined   in water and chlo-
                                       urethane
                                        roform. As linkages,       whereas
                                                       shown in Figure         the
                                                                         S3, the    second
                                                                                 film         and
                                                                                      solubility    third steps
                                                                                                 in chloroform     are due
                                                                                                                (~15%)       to the degradation of CO
                                                                                                                         was significantly
                                       triglyceride structure [9,37]. As shown in Figure 6c, new evidentincreas-
                                        higher   than   in water (~2%). In addition,  the solubility of the films increased with   peaks at 270–300 ◦ C
                                        ing PHBD content due to the high solubility of PHBD in chloroform (42 g/L). However,
                                       appeared in DTGA curves of CO/PHBD PU 8h, which are associated with the degradation
                                        the synthesized films are moderately resistant to organic solvent as the loss in the weight
                                       of  PHB segment as a consequence of its low thermal stability, while the second and third
                                        of the films was relatively low (
Polymers 2021, 13, 1387                                                                                                             15 of 22

                                3.6. Effect of Different Molecular Weight PHBD
                                         The different molecular weight PHBDs obtained after 2 to 8 h were used for the
                                    synthesis of their corresponding PUs. These different PUs were formulated at a constant
    Polymers 2021, 13, x FOR PEER REVIEW
                                    NCO/OH ratio of 4.0 and a CO/PHBD ratio of 6/4, respectively. The effect of17the  of 24
                                                                                                                         differ-
                                    ent molecular weight PHBDs on the structural and physical properties of the resulting
                                    CO/PHBD PU was evaluated. Likewise, the biodegradability of the different CO/PHBD
                                    PUCO/PHBD   PU was evaluated. Likewise, the biodegradability of the different CO/PHBD
                                        was evaluated.
                                 PU was evaluated.
                                3.6.1. Structural Analysis
                                 3.6.1. Structural Analysis
                                     The FTIR spectra of the PUs resulting from the different timed reaction PHBDs did not
                               revealThe
                                       anyFTIR    spectra between
                                             differences   of the PUsthe resulting   from
                                                                             different     the different
                                                                                        synthesized      timed
                                                                                                       PUs      reaction
                                                                                                            (Figure  S4). PHBDs
                                                                                                                           All PU did
                                                                                                                                    spectra
                                 not reveal  any  differences   between    the different  synthesized  PUs
                               displayed N–H stretching, free urethane, amide, and C–O–C groups at 3405–3410(Figure S4). All PU spec- cm−1 ,
                                 tra displayed  N–H
                                                − 1    stretching,  free
                                                                       − urethane,
                                                                         1            amide,  and  C–O–C
                                                                                                   − 1     groups
                               1731–1733 cm , 1623–1627 cm , and 1052–1096 cm , respectively. The NCO peak at     at 3405–3410    cm −1,

                                 1731–1733
                               2270          cm−1, 1623–1627
                                     cm−1 completely             cm−1, and for
                                                           disappeared       1052–1096    cm−1, respectively.
                                                                                 all the synthesized    PUs, The  NCO peak
                                                                                                              suggesting    theatformation
                                                                                                                                   2270
                                 cm−1 completely disappeared for all the synthesized PUs, suggesting the formation of bi-
                               of biuret linkage.
                                 uret linkage.
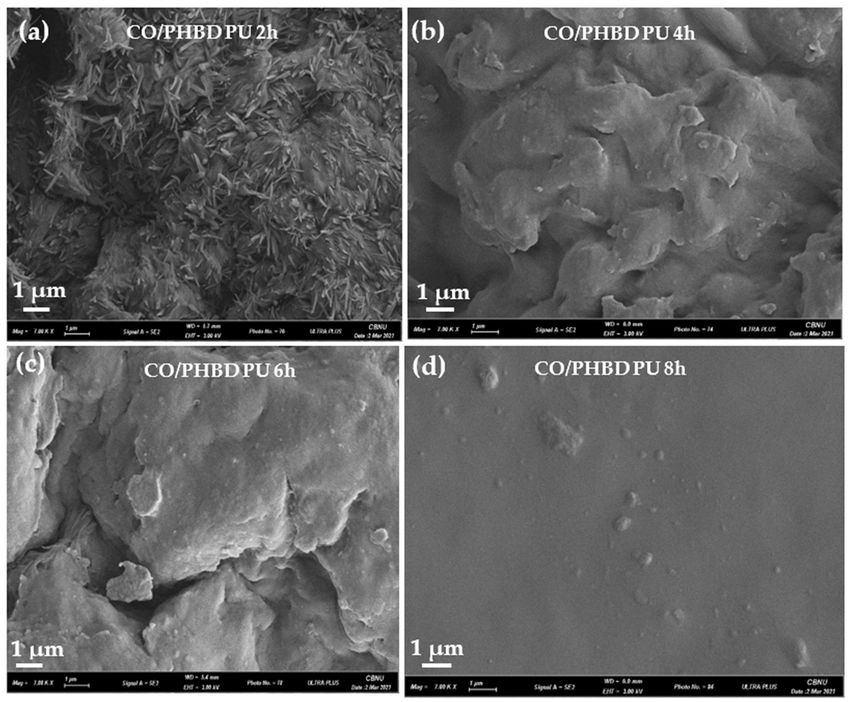
                                     The SEM images of the synthesized PUs are shown in Figure 7. Overall, PUs produced
                                      The SEM images of the synthesized PUs are shown in Figure 7. Overall, PUs pro-
                               from higher molecular weight PHBDs showed rough and heterogeneous surfaces, most
                                 duced from higher molecular weight PHBDs showed rough and heterogeneous surfaces,
                               likely  due to the low compatibility between CO and the incorporated higher molecular
                                 most likely due to the low compatibility between CO and the incorporated higher molec-
                               weight   PHBDs
                                 ular weight      [39]. In
                                               PHBDs        fact,
                                                         [39]. In longer    molecular
                                                                  fact, longer           chains
                                                                                 molecular       of PHBD
                                                                                             chains  of PHBDmay  cause
                                                                                                               may  causesteric hindrance,
                                                                                                                            steric hin-
                               leading   to the  poor  miscibility    between     CO   and  PHBD.
                                 drance, leading to the poor miscibility between CO and PHBD.

         Figure
      Figure    7. Morphological
             7. Morphological    imagesofof(a)
                              images        (a)CO-PHBD
                                               CO-PHBD PU
                                                       PU2h,
                                                          2h,(b)
                                                              (b)CO/PHBD
                                                                  CO/PHBDPUPU
                                                                           4h, 4h,
                                                                               (c) CO/PHBD PU 6h,PU
                                                                                   (c) CO/PHBD    and (d)and
                                                                                                    6h,   CO/PHBD  PU
                                                                                                             (d) CO/PHBD
         8h.
      PU 8h.
                                 3.6.2. Mechanical and Thermal Analysis
Polymers 2021, 13, 1387                                                                                                                             16 of 22

                                        3.6.2. Mechanical and Thermal Analysis
        Polymers 2021, 13, x FOR PEER REVIEW  The stress–strain curves of different CO/PHBD PUs are shown                          18 ofin
                                                                                                                                         24 Figure 8. Tensile
                                       properties and thermogravimetric data of CO/PHBD PUs are summarized in Table 3.
                                       Both tensile strength and elongation at break increased with decreasing the molecular
                                       weightThe ofstress–strain  curves of different
                                                       the synthesized       PHBDs.   CO/PHBD
                                                                                          Overall,PUstensile
                                                                                                        are shown    in Figureincreased
                                                                                                                 strength       8. Tensile from 10.8 MPa
                                        properties
                                       for  CO/PHBD  and thermogravimetric
                                                              PU 2h to 15.3data MPaof CO/PHBD
                                                                                       for CO/PHBDPUs are summarized      in Table 3. Both
                                                                                                             PU 8h. Simultaneously,            elongation at
                                        tensile strength and elongation at break increased with decreasing the molecular weight
                                       break     increased     from   17.2%   to  28.8%.    As  revealed     by  SEM     analysis,
                                        of the synthesized PHBDs. Overall, tensile strength increased from 10.8 MPa for CO/PHBD
                                                                                                                                      such    decrease in the
                                       mechanical
                                        PU 2h to 15.3 MPaproperties
                                                             for CO/PHBDwithPUincreasing     molecular
                                                                               8h. Simultaneously,           weight
                                                                                                     elongation         ofincreased
                                                                                                                 at break   PHBD from can be attributed to
                                       the  increase
                                        17.2%   to 28.8%.inAsthe  surface
                                                               revealed     heterogeneity
                                                                        by SEM   analysis, suchand   roughness
                                                                                                 decrease            of the corresponding
                                                                                                           in the mechanical    properties       CO/PHBD
                                        with (Figure
                                       PUs    increasing7a–c),
                                                           molecular
                                                                  mostweight of PHBD
                                                                         likely  due tocanthe
                                                                                            be attributed  to the increase
                                                                                               low reactivity       between in theCO
                                                                                                                                   surface
                                                                                                                                       and high molecular
                                        heterogeneity and roughness of the corresponding CO/PHBD PUs (Figure 7a–c), most likely
                                       weight     PHBDs. Longer molecular chains of PHBD might cause steric hindrance in the PU
                                        due to the low reactivity between CO and high molecular weight PHBDs. Longer molecular
                                       matrix [39].
                                         chains of PHBD might cause steric hindrance in the PU matrix [39].

                                        Figure       Stress
                                         Figure 8.8.Stress vs. vs. strain
                                                               strain curvescurves   of the different
                                                                             of the different CO/PHBD CO/PHBD
                                                                                                      PUs.    PUs.

                                         Table 3. Mechanical and thermal data for CO/PHBD PUs.
                                       Table 3. Mechanical and thermal data for CO/PHBD PUs.
                                                               Tensile Strength Elongation at Break T10%
                                               Sample                                                         T50% (°C)   T90% (°C)
                                                                    (MPa)
                                                                       Tensile          Elongation(°at
                                                                                       (%E)           C)
                                                                                                                      ◦
                                               Sample
                                           CO/PHBD PU 2h          10.8 ± 0.9 (MPa) 17.2Break
                                                                                          ± 0.8 (%E) 288      T10%
                                                                                                                 353 ( C)    T50% (◦ C)
                                                                                                                             446               T90% (◦ C)
                                                                 Strength
                                           CO/PHBD PU 4h          11.3 ± 1.2         18.1 ± 1.5      280         351         450
                                          CO/PHBD
                                           CO/PHBD PUPU
                                                      6h 2h       12.1 ± 1.0± 0.9
                                                                     10.8                   1.8 ± 0.8275
                                                                                     27.2 ±17.2                   288
                                                                                                                 348         468 353              446
                                          CO/PHBD
                                           CO/PHBD PUPU
                                                      8h 4h       15.3 ± 1.0± 1.2
                                                                     11.3                   2.4 ± 1.5272
                                                                                     28.8 ±18.1                   280
                                                                                                                 344         481 351              450
                                          CO/PHBD PU 6h        12.1 ± 1.0          27.2 ± 1.8          275               348                      468
                                            TGA andPU
                                          CO/PHBD  DTGA
                                                      8h curves15.3
                                                                of the
                                                                     ±synthesized
                                                                       1.0        PUs
                                                                                   28.8are±shown
                                                                                            2.4 in Figure
                                                                                                       2729. All of the syn-
                                                                                                                         344                      481
                                        thesized PUs exhibit three thermal degradation steps. As it can be inferred from Table 3,
                                        PUs resulting from high molecular weight PHBDs showed higher T10% and T50% values
                                        compared
                                             TGAtoand
                                                    thoseDTGA
                                                          synthesized  from short
                                                                    curves  of thechain PHBDs [40,41].
                                                                                     synthesized     PUsIt is are
                                                                                                              assumed that increas-
                                                                                                                  shown    in Figure 9. All of the
                                       synthesized PUs exhibit three thermal degradation steps. As urethane
                                        ing PHBD  molecular  weight  decreased the concentration of the thermally  labile it can be inferred from
                                        concentration which may explain the observed increase in the thermal stability of the cor-
                                       Table  3, PUs resulting from high molecular weight PHBDs showed higher T10% and T50%
                                        responding PUs.
                                       values compared to those synthesized from short chain PHBDs [40,41]. It is assumed that
                                       increasing PHBD molecular weight decreased the concentration of the thermally labile
                                       urethane concentration which may explain the observed increase in the thermal stability of
                                       the corresponding PUs.
Polymers 2021, 13, 1387                                                                                               17 of 22
 Polymers 2021, 13, x FOR PEER REVIEW                                                                                 19 of 24

                                  Figure9.9.(a)
                                 Figure      (a)TGA
                                                 TGAand
                                                     and(b)
                                                         (b)derivative
                                                             derivativeTGA
                                                                        TGAcurves
                                                                            curvesofofCO/PHBD
                                                                                       CO/PHBD PUs.
                                                                                               PUs.

                                 3.6.3.
                                  3.6.3.Soil
                                         SoilBiodegradation
                                             BiodegradationStudies
                                                              Studies
                                       The
                                        The residual weightsofofCO/PHBD
                                            residual  weights      CO/PHBD PUs PUs synthesized
                                                                                    synthesized from
                                                                                                 from the
                                                                                                       thedifferent
                                                                                                           differentmolecular
                                                                                                                     molecular
                                 weight
                                  weight PHBDs are presented in Figure 10a. Overall, both neat CO PU andCO/PHBD
                                          PHBDs   are presented in Figure 10a. Overall, both neat CO  PU  and   CO/PHBDPUsPUs
                                 exhibited low biodegradation rate in soil after 35 days. This low biodegradation ability can
                                  exhibited low biodegradation rate in soil after 35 days. This low biodegradation ability
                                 be attributed to the high hydrophobicity of CO chains along with the high crystallinity of
                                  can be attributed to the high hydrophobicity of CO chains along with the high crystallinity
                                 the incorporated PHBDs [11,13]. As it can be inferred from Figure 10a, the biodegradation
                                  of the incorporated PHBDs [11,13]. As it can be inferred from Figure 10a, the biodegrada-
                                 rate of CO/PHBD PU 2h was slightly higher (residual weight ~ 93.0%) compared to
                                  tion rate of CO/PHBD PU 2h was slightly higher (residual weight ~ 93.0%) compared to
                                 CO/PHBD PU 8h (residual weight ~ 95.5%) and the neat CO PU (residual weight ~ 96.1%).
                                  CO/PHBD PU 8h (residual weight ~ 95.5%) and the neat CO PU (residual weight ~ 96.1%).
Polymers 2021, 13, x FOR PEER REVIEW                                                                                                          20 of 24
Polymers 2021, 13, 1387                                                                                                                        18 of 22

                                CO/PHBD PU 8h (residual weight ~ 95.5%) and the neat CO PU (residual weight ~ 96.1%).
                                Our findings
                                Our  findings werewereconsistent
                                                           consistentwithwith previous
                                                                                previous  reports
                                                                                             reports concerning
                                                                                                         concerning  the the
                                                                                                                          biodegradation
                                                                                                                               biodegradation  of CO-of
                                based   PUs   [13,42].    The   relatively   higher   biodegradation         rate  recorded
                                CO-based PUs [13,42]. The relatively higher biodegradation rate recorded for CO/PHBD            for  CO/PHBD        PU
                                2h can
                                PU       be ascribed
                                    2h can    be ascribed to thetopresence
                                                                   the presenceof higher    number
                                                                                     of higher          of repetitive
                                                                                                   number                units units
                                                                                                               of repetitive     in thein PHB
                                                                                                                                            themole-
                                                                                                                                                 PHB
                                cule. Regardless
                                molecule.             of the of
                                              Regardless       different   molecular
                                                                  the different          weight weight
                                                                                   molecular       PHBDs,PHBDs,the weight the loss  of the
                                                                                                                               weight        different
                                                                                                                                          loss  of the
                                CO/PHBD
                                different     PU increased
                                           CO/PHBD               rapidly during
                                                            PU increased      rapidlytheduring
                                                                                          first 7 days    and7then
                                                                                                   the first     daysslowed
                                                                                                                        and then  down.
                                                                                                                                     slowedThisdown.
                                                                                                                                                 rapid
                                degradation      step   can   be  attributed    to the   hydrolysis       of the  PHB
                                This rapid degradation step can be attributed to the hydrolysis of the PHB ester bonds,   ester   bonds,    while   the
                                slow  degrading      step   can  be  ascribed   to the  hydrolysis      of  urethane   group
                                while the slow degrading step can be ascribed to the hydrolysis of urethane group [13]. On       [13].  On  the  other
                                hand,
                                the    structural
                                    other             changes caused
                                            hand, structural        changes by caused
                                                                                soil biodegradation         during the during
                                                                                          by soil biodegradation           burial test
                                                                                                                                     the was
                                                                                                                                          burialevalu-
                                                                                                                                                   test
                                ated evaluated
                                was   by FTIR (Figure
                                                   by FTIR    10b).  The 10b).
                                                                (Figure    FTIR The
                                                                                  spectrum      of CO/PHBD
                                                                                       FTIR spectrum               PU 2h showed
                                                                                                              of CO/PHBD          PU 2ha showed
                                                                                                                                           slight de- a
                                creasedecrease
                                slight  in the intensity       of peaksofatpeaks
                                                   in the intensity           1730atcm1730    cm−1 increase
                                                                                        −1 and an                 in the intensity
                                                                                                      and an increase                   of the of
                                                                                                                            in the intensity    peaks
                                                                                                                                                    the
                                at 1080–1090
                                peaks  at 1080–1090        cm−soil
                                                  cm−1 after     1 after
                                                                      biodegradation,       denoting
                                                                          soil biodegradation,             the hydrolysis
                                                                                                      denoting                 of urethane
                                                                                                                   the hydrolysis               group
                                                                                                                                        of urethane
                                and theand
                                group     formation      of alcohol
                                              the formation            C–O group
                                                                   of alcohol   C–O[12].
                                                                                       groupIn addition,     the absorption
                                                                                                 [12]. In addition,               peak at 1260
                                                                                                                         the absorption       peakcmat−1
                                          −
                                disappeared 1    after   35  days    of soil  burial  which     is related    to the
                                1260 cm disappeared after 35 days of soil burial which is related to the degradation ofdegradation       of carbonyl
                                oxygen linkage
                                carbonyl   oxygenof       the ester
                                                      linkage         groups
                                                                 of the  ester located    on the PU
                                                                                groups located            surface
                                                                                                     on the         [11,43].[11,43].
                                                                                                              PU surface       Moreover,      a slight
                                                                                                                                        Moreover,     a
                                increase
                                slight     in thein
                                       increase     intensity     of theofpeak
                                                       the intensity              corresponding
                                                                            the peak    corresponding  to N–H     stretching
                                                                                                             to N–H     stretchingat 1567   cm−1cm
                                                                                                                                       at 1567    was−1

                                was  noticed
                                noticed         denoting
                                          denoting            the deformation
                                                        the deformation            of urethane
                                                                              of urethane      bondsbonds[44].[44].  A possible
                                                                                                               A possible           mechanism
                                                                                                                               mechanism       for for
                                                                                                                                                    the
                                the biodegradation
                                biodegradation            process
                                                     process     of of  CO/PHBD
                                                                     CO/PHBD       PUPU is is presentedininFigure
                                                                                            presented           Figure10c 10c[13].
                                                                                                                               [13]. Further,
                                                                                                                                      Further, small
                                                                                                                                                 small
                                pores, cracks, and grooves appeared on the            the PUPU surface
                                                                                                  surface after
                                                                                                             after 35
                                                                                                                    35 days
                                                                                                                        days of of biodegradation
                                                                                                                                    biodegradation
                                which may suggest the ability of water       water   and   microorganism
                                                                                            microorganism        present     in the
                                                                                                                                 the soil
                                                                                                                                      soil to
                                                                                                                                           to diffuse
                                                                                                                                               diffuse
                                inside the
                                        the PUPU matrix
                                                   matrix(Figure
                                                               (FigureS5).
                                                                         S5).Such
                                                                                Suchincrease in erosion of the PU surface maymay
                                                                                       increase     in  erosion     of the   PU    surface    be con-be
                                considered
                                sidered as aasgooda good     indicator
                                                         indicator        of the
                                                                      of the     biodegradation
                                                                              biodegradation           process
                                                                                                   process        of CO/PHBD
                                                                                                               of CO/PHBD         PUsPUs    [45].
                                                                                                                                        [45]. TheThe re-
                                resulting   CO/PHBD
                                sulting CO/PHBD          PUs PUsmaymayhavehave   potential
                                                                            potential        in biomedical,
                                                                                         in biomedical,           pharmaceutical,
                                                                                                             pharmaceutical,             packaging,
                                                                                                                                    packaging,     and
                                and  agriculture
                                agriculture    fieldsfields
                                                       due to due   to their
                                                                 their        biodegradability
                                                                        biodegradability             and improved
                                                                                               and improved               mechanical
                                                                                                                   mechanical             properties
                                                                                                                                    properties    over
                                over  pure   CO-PU      or  PHB
                                pure CO-PU or PHB [16,44–47].      [16,44–47].

                                Figure 10. Cont.
Polymers 2021, 13, 1387                                                                                                           19 of 22
   Polymers 2021, 13, x FOR PEER REVIEW                                                                                            21 of 24

                                  (c)

                                 Figure
                                    Figure10.10.  Residual
                                              (a)(a)        weight
                                                     Residual      with
                                                               weight   time,
                                                                       with   (b) (b)
                                                                            time, FTIR  analysis
                                                                                      FTIR       of CO/PHBD
                                                                                           analysis           PU after
                                                                                                     of CO/PHBD        soil biodegradation
                                                                                                                 PU after   soil biodegrada-
                                 (after 35 days),   and (c) a possible mechanism   for the biodegradation  process of CO/PHBD
                                    tion (after 35 days), and (c) a possible mechanism for the biodegradation process of CO/PHBD   PU. PU.

                                 4. Conclusions
                                   4. Conclusions
                                      In this study, biodegradable biobased PUs were successfully produced from CO
                                         In this study, biodegradable biobased PUs were successfully produced from CO and
                                 and PHBD using HMDI as a crosslinking agent. First, a series of PHBDs with different
                                   PHBD using HMDI as a crosslinking agent. First, a series of PHBDs with different molec-
                                 molecular weights were synthesized through transesterification of bacterial PHB and
                                   ular weights were synthesized through transesterification of bacterial PHB and ethylene
                                 ethylene glycol by changing the reaction time. The synthesized PHBDs were characterized
                                   glycol by changing the reaction time. The synthesized PHBDs were characterized by FTIR,
                                 by FTIR, NMR, and DSC. The structural, mechanical, and thermal properties of CO/PHBD
                                   NMR, and DSC. The structural, mechanical, and thermal properties of CO/PHBD PUs
                                 PUs were measured by varying the NCO/OH molar ratio and CO/PHBD content. Our
                                   were measured by varying the NCO/OH molar ratio and CO/PHBD content. Our results
                                 results revealed an increase by approximately 300% in the tensile strength of CO/PHBD PU
                                   revealed an increase by approximately 300% in the tensile strength of CO/PHBD PU pro-
                                 produced at a CO/PHBD weight ratio of 6/4 and an NCO/OH molar ratio of 4.0 compared
                                 toduced
                                    neat CO at aPU.
                                                CO/PHBD     weight
                                                     The glass      ratio oftemperature
                                                                transition   6/4 and an NCO/OH         molar ratio
                                                                                            and crystallinity       of 4.0
                                                                                                                of PU      compared to
                                                                                                                         significantly
                                 increased with increasing the PHBD content. In addition, CO/PHBD PUs synthetized fromin-
                                   neat   CO   PU.  The glass  transition temperature      and  crystallinity  of PU   significantly
                                   creased
                                 short chainwith
                                               PHBDincreasing the
                                                      exhibited    PHBD
                                                                 higher   content.
                                                                        tensile      In addition,
                                                                                strength   compared CO/PHBD
                                                                                                       to those PUs  synthetized
                                                                                                                produced           from
                                                                                                                            from long
                                   short   chain  PHBD   exhibited  higher   tensile  strength   compared    to those
                                 chain PHBD, due to the good compatibility between CO and the corresponding PHBD.       produced   from
                                   long   chain  PHBD,   due  to  the  good   compatibility   between     CO  and
                                 Likewise, the highest biodegradation rate was recorded for CO/PHBD PU synthetized the   corresponding
                                   PHBD.
                                 from  shortLikewise,  the highest
                                              chain PHBD   probably biodegradation     rate was
                                                                      due to the presence    of a recorded  for CO/PHBD
                                                                                                  high number   of repetitivePUgroups
                                                                                                                                 synthe-
                                   tized  from  short
                                 in the PHB molecule. chain PHBD    probably    due to  the presence   of a high  number    of repetitive
                                   groups in the PHB molecule.
Polymers 2021, 13, 1387                                                                                                           20 of 22

                                  Supplementary Materials: The following are available online at https://www.mdpi.com/article/
                                  10.3390/polym13091387/s1. Table S1: CO/PHBD PU 8h formulations at different CO/PHBD ratio;
                                  Figure S1: 1 HNMR spectra of PHB diols obtained from different timed reactions; Figure S2: SEM
                                  images of CO PU (a) and CO/PHBD PU 8h with NCO/OH 2.0 (b) and 4.0 (c); Figure S3: Solubility
                                  test of CO/PHBD PUs in water and chloroform; Figure S4: FTIR spectra of different CO/PHBD PUs;
                                  Figure S5: SEM analysis of CO/PHBD PUs after 35 days soil burial test.
                                  Author Contributions: Data curation, Investigation, Methodology, Writing—Original Draft, P.S.;
                                  Resources, Methodology, C.K.; Writing—Review & Editing, Data Analysis, H.A.; Conceptualization,
                                  Supervision, Writing—Review & Editing, B.S.K. All authors have read and agreed to the published
                                  version of the manuscript.
                                  Funding: This research was funded by the National Research Foundation of Korea (NRF-2019R1I1A3
                                  A02058523).
                                  Institutional Review Board Statement: Not applicable.
                                  Informed Consent Statement: Not applicable.
                                  Data Availability Statement: Data available on request.
                                  Acknowledgments: The authors acknowledge the financial support of the National Research Foun-
                                  dation of Korea (NRF-2019R1I1A3A02058523).
                                  Conflicts of Interest: The authors declare no conflict of interest.

References
1.    Tremblay-Parrado, K.K.; Bordin, C.; Nicholls, S.; Heinrich, B.; Donnio, B.; Averous, L. Renewable and responsive cross-linked
      systems based on polyurethane backbones from clickable biobased bismaleimide architecture. Macromolecules 2020, 53, 5869–5880.
      [CrossRef]
2.    Petrović, Z.S.; Yang, L.; Zlatanic, A.; Zhang, W.; Javni, I. Network structure and properties of polyurethanes from soybean oil. J.
      Appl. Polym. Sci. 2007, 105, 2717–2727. [CrossRef]
3.    Pfister, D.P.; Xia, Y.; Larock, R.C. Recent advances in vegetable oil-based polyurethanes. ChemSusChem 2011, 4, 703–717. [CrossRef]
4.    Pechar, T.W.; Sohn, S.; Wilkes, G.L.; Ghosh, S.; Frazier, C.E.; Fornof, A.; Long, T.E. Characterization and comparison of
      polyurethane networks prepared using soybean-based polyols with varying hydroxyl content and their blends with petroleum-
      based polyols. J. Appl. Polym. Sci. 2006, 101, 1432–1443. [CrossRef]
5.    Zhang, C.; Li, Y.; Chen, R.; Kessler, M.R. Polyurethanes from solvent-free vegetable oil-based polyols. ACS Sustain. Chem. Eng.
      2014, 2, 2465–2476. [CrossRef]
6.    Pantone, V.; Laurenza, A.G.; Annese, C.; Comparelli, R.; Fracassi, F.; Fini, P.; Nacci, A.; Russo, A.; Fusco, C.; D’Accolti, L.
      Preparation and characterization of soybean oil-based polyurethanes for digital doming applications. Materials 2017, 10, 848.
      [CrossRef] [PubMed]
7.    Feng, Y.; Liang, H.; Ziming, Y.; Teng, Y.; Ying, L.; Puwang, L.; Yang, Z.; Zhang, C. A solvent-free and scalable method to prepare
      soybean-oil-based polyols by thiol–ene photo-click reaction and biobased polyurethanes therefrom. ACS Sustain. Chem. Eng.
      2017, 5, 7365–7373. [CrossRef]
8.    Tu, Y.-C.; Kiatsimkul, P.; Suppes, G.; Hsieh, F.H. Physical properties of water-blown rigid polyurethane foams from vegetable
      oil-based polyols. J. Appl. Polym. Sci. 2007, 105, 453–459. [CrossRef]
9.    Abdel Aziz, M.S.; Elsoholy, M.G.; Saad, G.R. Preparation and characterization of bio-based polyurethanes obtained from castor
      oil and poly (3-hydroxybutyrate) and their nanocomposites. Polym. Compos. 2018, 39, E489–E499. [CrossRef]
10.   Gurunathan, T.; Mohanty, S.; Nayak, S.K. Isocyanate terminated castor oil-based polyurethane prepolymer: Synthesis and
      characterization. Prog. Org. Coat. 2015, 80, 39–48. [CrossRef]
11.   Oprea, S.; Potolinca, V.O.; Gradinariu, P.; Joga, A.; Oprea, V. Synthesis, properties, and fungal degradation of castor-oil based
      polyurethane composites with different cellulose contents. Cellulose 2016, 23, 2515–2526. [CrossRef]
12.   Tang, B.-C.; Yao, C.-L.; Xieh, K.-Y.; Hong, S.-G. Improvement of physical properties of poly(glycerol sebacate) by copolymerization
      with polyhydroxybutyrate-diols. J. Polym. Res. 2017, 24, 215. [CrossRef]
13.   Wang, C.; Zheng, Y.; Sun, Y.; Fan, J.; Qin, Q.; Zhao, Z. A novel biodegradable polyurethane based on poly(3-hydroxybutyrate-co-
      3-hydroxyvalerate) and poly(ethylene glycol) as promising biomaterials with the improvement of mechanical properties and
      hemocompatibility. Polym. Chem. 2016, 7, 6120. [CrossRef]
14.   Xue, D.; Fan, X.; Zhang, Z.; Lv, W. The synthesis of hydroxybutyrate-based block polyurethane from telechelic diols with robust
      thermal and mechanical properties. J. Chem. 2016, 2016, 9635165. [CrossRef]
15.   Naguib, H.F.; Abdel Aziz, M.S.; Sherif, S.M.; Saad, G.R. Synthesis and thermal characterization of poly(ester-ether urethane)s
      based on PHB and PCL-PEG-PCL blocks. J. Polym. Res. 2011, 18, 1217–1227. [CrossRef]
You can also read