SFCDecomp: Multicriteria Optimized Tool Path Planning in 3D Printing using Space-Filling Curve Based Domain Decomposition
←
→
Page content transcription
If your browser does not render page correctly, please read the page content below
SFCDecomp: Multicriteria Optimized Tool Path
                                             Planning in 3D Printing using Space-Filling Curve
                                                       Based Domain Decomposition
                                              Prashant Gupta, Yiran Guo, Narasimha Boddeti, Bala Krishnamoorthy
arXiv:2109.01769v1 [cs.GR] 4 Sep 2021

                                                                  Washington State Unviersity

                                                                                         Abstract
                                                  We explore efficient optimization of toolpaths based on multiple criteria for large instances
                                              of 3d printing problems. We first show that the minimum turn cost 3d printing problem is NP-
                                              hard, even when the region is a simple polygon. We develop SFCDecomp, a space filling curve
                                              based decomposition framework to solve large instances of 3d printing problems efficiently by
                                              solving these optimization subproblems independently. For the Buddha, our framework builds
                                              toolpaths over a total of 799,716 nodes across 169 layers, and for the Bunny it builds toolpaths
                                              over 812,733 nodes across 360 layers. Building on SFCDecomp, we develop a multicriteria
                                              optimization approach for toolpath planning. We demonstrate the utility of our framework
                                              by maximizing or minimizing tool path edge overlap between adjacent layers, while jointly
                                              minimizing turn costs. Strength testing of a tensile test specimen printed with tool paths that
                                              maximize or minimize adjacent layer edge overlaps reveal significant differences in tensile
                                              strength between the two classes of prints.
                                              Keywords: Space-filling curve, domain decomposition, continuous tool path, 3d printing.

                                        1    Introduction
                                        We study dense infill 3d printing problems, where a given region is completely covered by deposit-
                                        ing material with an extruder. Design of the tool path, i.e., the sequence in which the extruder
                                        moves while depositing material, has crucial implications on print quality as well as mechanical
                                        properties of the printed object. The extruder can go over non-print or previously printed regions
                                        with idle movements. Two problems closely related to 3d printing are milling and lawn mowing.
                                        But in the milling problem, the cutter cannot exit the region (pocket) that it has to cover. The lawn
                                        mowing problem is similar to 3d printing problem since the cutter can mow over non grass as well
                                        as already mowed regions. But one wants to minimize non-print movement in 3d printing in order
                                        to improve efficiency.
                                            Various geometric tool path patterns are used such as zigzag, spiral, and contour parallel, but
                                        most of them suffer from directional bias. For instance, spiral and contour parallel tool paths do not
                                        allow cross weaving between adjacent layers. More generally, aspects of tool path design across
                                        multiple layers and their effects on mechanical properties of the printed objects have not been
                                        studied in detail. This motivated the development of our framework for optimization based tool

                                                                                             1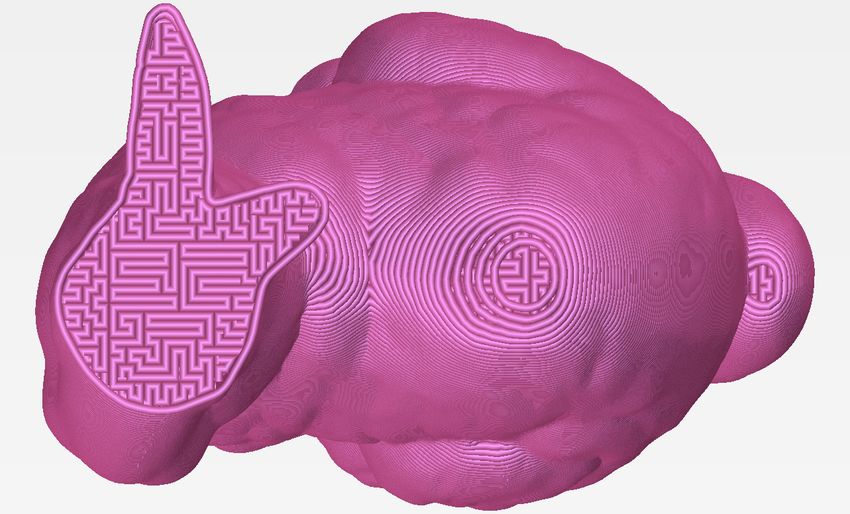
path planning, where we can optimize the tool path based on multiple criteria. At the same time,
we show that the 3d printing tool path optimization problem is NP-hard, and hence large instances
become much harder to solve. One approach to handle large instances involves decomposition into
subdomains, where the subproblems can be solved in parallel and the overall tool path designed by
combining solutions for the subdomains.
1.1 Our Contributions
We focus on the minimum turn, minimum edge cost, as well as combinations of these two 3d
printing problems.
• We show that minimum turn cost 3d printing problem is NP-hard, even when the region is a
simple polygon.
• We develop SFCDecomp, a space filling curve based decomposition framework to solve
large instances of 3d printing problems efficiently by solving subproblems from the decom-
position independently. Our framework builds toolpaths over a total of 799,716 nodes across
169 layers for the Buddha, and over 812,733 nodes across 360 layers for the Bunny. See
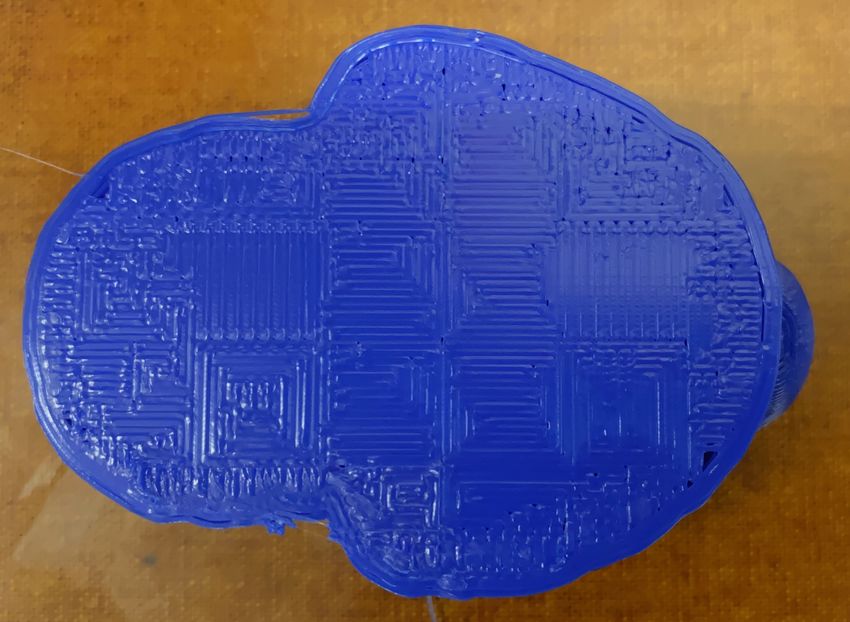
Figures 1 and 17 for sample layers and a print.
• Building on SFCDecomp, we develop a multicriteria optimization approach for toolpath
planning. We demonstrate the utility of this approach by maximizing or minimizing tool
path edge overlap between adjacent layers, while jointly minimizing turn costs.
• We measure the mechanical strength of prints with varying tool path edge overlaps across
adjacent layers. Strength testing of tensile test specimens printed with tool paths that respec-
tively maximize and minimize adjacent layer edge overlaps reveal significant differences in
tensile strength between the two classes of prints.
Figure 1: Top and side views of a print of the Bunny at Layer 124.
1.2 Related Work
The lawn mowing, milling, and 3d printing problems are closely related to the more general geo-
metric traveling salesman problem (TSP).
2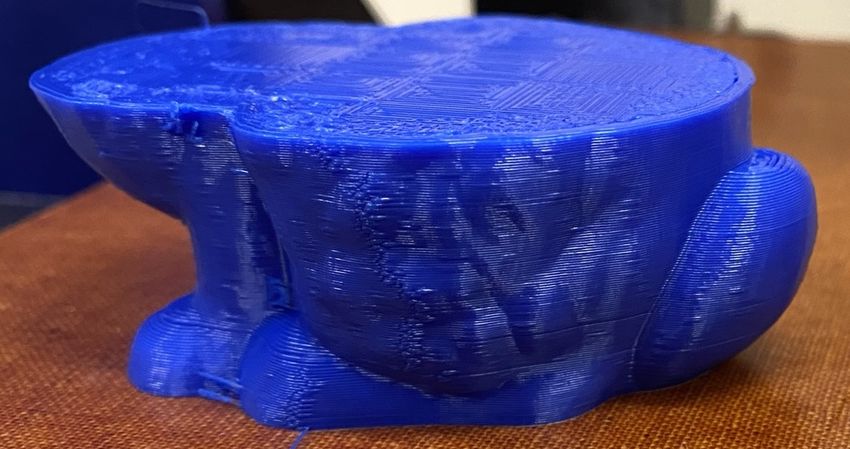
Geometric TSP In the geometric traveling salesman problem (GTSP) with mobile clients, the
objective is to find an optimal tour of the salesman to visit a given set of clients, each of whom
can travel up to a distance r to meet the salesman. Variants of the GTSP include the milling and
lawn mowing problems. Arkin et al. [5] showed that the minimum length lawn mowing problem
for polygonal regions with or without holes is NP-hard, and the minimum length milling problem
for polygon regions with holes is also NP-hard. Arkin et al. [4] also showed that the minimum turn
milling problem is NP-hard.
    The TSP with turn costs is known as the angular metric TSP. Aggarwal et al. [1] proved it is
NP-hard. Integer programming formulations of this problem are hard to solve to optimality [2].
Finding a tour connecting a given set of points such that angles between two adjacent edges of
the tour is constrained was studied by Fekete and Woeginger [15]. Reif and Wang [29] showed
that the angle restricted shortest path problem with obstacles is NP-hard. In 3d printing, apart
from computational challenges (NP-hardness), the optimal print direction can change based on
mechanical factors such as temperature gradient to minimize thermal residual stress and strain.
This aspect is a direct motivation for developing our framework.

Tool Path Geometry A popular tool path generation method uses zigzag patterns. Space filling
curves (SFCs) are also used in generating infill. An SFC in 2D is a continuous curve with positive
Jordan content (i.e., area > 0). In 3d printing, the extruded bead has finite thickness and hence
length of the SFC is finite. Zhao et al. [37] developed a Fermat Spiral infill (SFC) based smooth
tool path optimized for continuity. Contour parallel tool paths follow the boundary of the polygon
[35]. Although both these methods give curved tool paths, the Fermat Spiral infill [37] is smoother.
Curved tool paths in FDM are usually approximated by piecewise linear line segments. Hence
highly curved tool paths require increasingly short line segments in the linear approximation. Zhao
et al. [37] discussed this limitation of their method for lower end 3d printers. They also pointed
out that both spiral and contour parallel infills suffer from directional bias due to which adjacent
layers cannot cross-weave at an angle. This gives zigzag tool paths some advantages over spirals
and contour parallel tool paths since zigzag consists of linear segments and allows cross weaving
between adjacent layers.
    Kuipers et al. [21] developed CrossFill, an approach based on SFCs to generate continuous
paths for sparse infill 3d printing. Wasser et al. [34] suggested fractal-like SFC for infill based on
a TSP heuristic, but their method cannot handle turn costs and have ambiguity on the input graph
for general polygons. Bertoldi et al. [6] proposed a method that uses domain decomposition with
a classical SFC (Hilbert curve) to find the tool path. But the Hilbert curve imposes restrictions on
print directions. In our framework, we use a quadtree for domain decomposition and classical SFC
(Hilbert curve) to create sequences of these domains. We then employ optimization that could be
based on multiple criteria to find the tool path in each decomposed subdomain.

Tool Path Optimization The tool path in each layer can go straight or take turns (within the
plane) to fill the layer, and its overall shape affects various quality factors. One often tries to
optimize the tool path in each layer for its continuity, smoothness, or both. But optimizing for
multiple quality factors at one time could be highly inefficient. For instance, spiral and contour
parallel infills try to optimize smoothness and continuity of the tool path, but cannot consider cross
weaving between layers due to directional bias [16].

                                                  3
In the setting of graphs for metric TSP, we can find the initial tour using, e.g., the Christofides–
Serdyukov algorithm [10, 30, 32] and use a k-OPT heuristic [3] to further improve the solution.
The k-OPT heuristic solves a decision problem where we ask if a given tour can be improved
by replacing k edges in the tour with k new edges. But the Christofides–Serdyukov algorithm
might not give us accurate results since the problem is non-metric. With the simplest choice of
k = 2, the 2-OPT has O(n2 ) computational complexity to find a local optimal solution compared to
initial solution [19]. To the best of our knowledge, most heuristic algorithms for TSP have O(n2 )
complexity. We could partition the domain into multiple subgraphs and apply some heuristics
on each subgraph [33]. At the same time, we seek exact solutions for each subgraph since the
problem is non-metric, so that the overall quality of the tool path is maximized. Lensgraf, Mettu,
and coauthors [22, 23, 24, 36] have used graph frameworks based on search algorithms, but do not
include costs for change in direction. In contrast, our graph and cost-based optimization framework
for complete infill problems can model new quality factors by varying the edge costs, and also
models turn costs. In fact, our graph optimization framework can employ user-defined costs that
capture various quality factors.

Domain Decomposition The geometric TSP is NP-hard [28]. An alternative approach is to
use domain decomposition, solve a TSP for the infill in each subdomain, and then connect the
individual subdomain paths. Chazelle and Palios [9] presented a review of some decomposition
strategies. Convex decomposition of polygons is a well studied problem, e.g., see the book by Keil
[20]. Exact convex decomposition for simple polygons without holes can be computed efficiently
[7, 8], but is NP-hard for polygonal regions with holes [26]. An alternative can be approximate
convex decomposition [25].
    Domain decomposition has been used in 3d printing applications [11, 13, 18] to subdivide the
polygon into sub-polygonal regions and find a cycle for each sub-polygon using closed zigzag
curves to cover most of the vertices in them, and then join these cycles to find a complete tour. But
their geometric decomposition does not guarantee existence of feasible dual graph of each sub-
polygon, whereas our decomposition approach guarantees existence of dual pixel graph of each
sub-polygon. We will primarily focus on finding paths and connecting them to get a complete
path, but our work can be extended to finding complete tour by joining cycles. In computation,
we guarantee the existence of an optimal connected path in each sub-polygon. We can vary the
decomposition between alternate layers. The complete path generated by our method can have
discontinuities only at the boundaries of the polygon.
    To summarize, in the paragraph on Tool Path Geometry we motivated the use of rectilinear tool
paths, and that on Tool Path Optimization we motivated the use of optimization tools. But TSP and
variants are NP-hard in general, and that motivated our use of Domain Decomposition.

2    Preliminaries
Let the extruder ξ be the axis aligned unit square. ξ(p) denotes the placement of ξ at point p ∈ R2
as its center. The Geometric 3d printing problem (3dPP) on a polygon R is to find a path/tour π
such that every point in R is covered by the placement of ξ on π, i.e., R ⊆ ∪p∈π ξ(p), subject to total
idle movement less than or equal to a positive constant . Note that ξ(p) can hit outside the region
R for some p ∈ π. We consider minimizing total length (sum of edge weights, more generally) or

                                                   4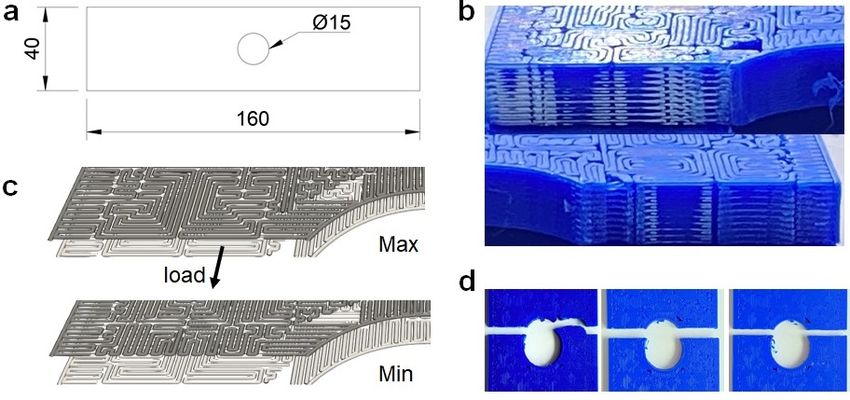
total turn cost, or a combination of both. We restrict our attention to integral orthogonal polygonal
regions with or without holes, and the extruder is taken as a unit square restricted to axis parallel
motion. All boundary turns are 90◦ in an integral orthogonal region, and boundary vertices have
integer coordinates. It can be considered a union of pixels, i.e., unit squares with axis-parallel
edges and integer vertices (see Figure 2). Hence we name it the integral orthogonal 3d-printing
problem (IO3dPP), and will also refer to it in short as 3dPP. We prove that 3dPP is NP-hard.

       Figure 2: An integral orthogonal region with a hole (left) and its dual graph (right).

    We consider a connected, undirected, planar graph G = (V, E) with V = {v1 , . . . , vn } and
E = {(vi , vj ) : vi , vj ∈ V and i 6= j}. For each edge (vi , vj ) ∈ E there is a cost (or weight) cij
that depends on the Euclidean distance between vertices (if (vi , vj ) 6∈ E then cij = M , some large
positive value). We take the turn cost at vertex vi as ci = 0 if the toolpath goes straight through vi ,
and ci = 1 if the path makes a turn at the vertex (90◦ ). For the default Euclidean minimum length
problem, cij ’s form a metric. But ci ’s for the minimum turn problem do not form a metric [4].

3     NP-hardness proofs
We show that NP-hardness of minimum length 3dPP follows directly from the known result on NP-
hardness of the lawn mowing problem. For the minimum turn cost 3dPP, we employ a two-step
reduction from the problem of Hamiltonicity of square grid graphs to prove NP-hardness.

3.1    Minimum Length 3dPP
Arkin et al. [5] showed that minimum length lawn moving problem for simple polygon or polygon
with holes is NP-hard based on reduction from Hamiltonian circuit in planar bipartite graph with
maximum degree 3 to Hamiltonian circuit in grid graphs.
Lemma 3.1. Minimum length 3dPP is NP-hard for any connected polygon R (with or without
holes) and axis-aligned unit square extruder.
Proof. Proof of Arkin et al. for lawn moving problem [5, Theorem 1] can be directly adapted to
that for 3dPP where there is no idle movement for connected polygon R with or without holes. We
note that no point in R is mowed more than once in their proof, and the total idle movement bound
can be set as  = 1.

                                                   5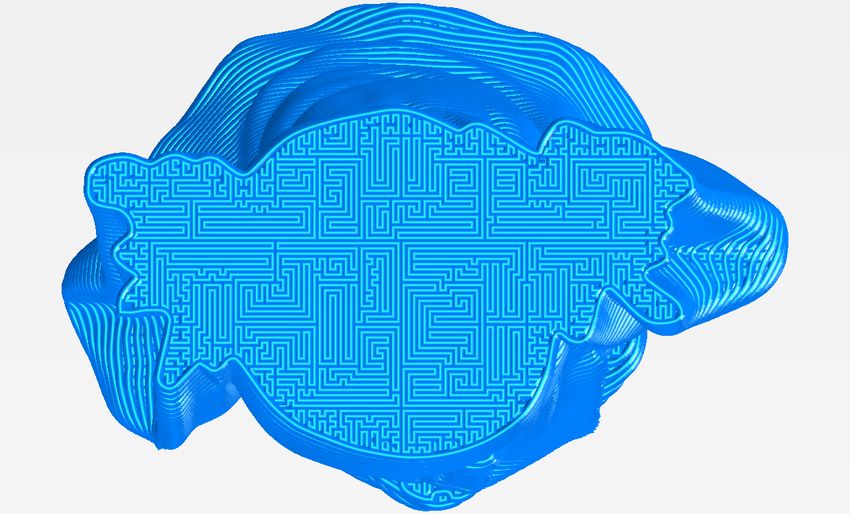
3.2    Minimum Turn Cost 3dPP
We use a reduction similar to one introduced by Arkin et al. [4]. Previously, Itai et al. [17] showed
that the Hamiltonian circuit problem in grid graphs is NP-complete. We first show that Hamil-
tonicity of square grid graph is reducible to that of Hamiltonicity of unit segment perpendicular
end point intersection graph (HUSPEPIG) of axis aligned unit segments. Unit segment perpendic-
ular end point intersection graphs consist of unit horizontal or vertical segments that intersect only
at end points (see Figure 3).

           (a)                          (b)                      (c)                      (d)

Figure 3: l1 , l2 , l3 , l4 (black) are unit line segments. Figures (a), (b), (c), (d) show all possible
intersections at the end points. Intersection graph (dotted blue lines) of corresponding intersection
of line segments are shown in Figures (a), (b), and (c). In Figure (d), unit segments intersect at an
end point but are not perpendicular, so no edge is shown in the intersection graph.

Lemma 3.2. Hamiltonicity of square grid graph is reducible to HUSPEPIG.

Proof. Consider a bipartite grid graph G with vertices having integer coordinates.√ Then G can be
represented as 2-color graph. Rotate G by 45◦ and scale down edges in G by 2. The length of
each edge in this arrangement is 1/2, the coordinates of each vertex are integer multiples of 1/2,
and the smallest distance between vertices of same color is 1. Assign each white vertex a horizontal
unit line segment and each black vertex a vertical unit line segment centered at the vertex to obtain
the instance of HUSPEPIG (see Figure 4).
    We now show that HUSPEPIG can be reduced to minimum turn cost 3dPP. Let each unit line
segment be represented by a square block (Figure 5a), which is the union of 9 unit squares each
representing the extruder. Let the 9-cluster C be the dual graph of such a square block, consisting
of 9 vertices. With unit line segments represented by square blocks, there are 3 types of intersection
(Figures 5b, 5c, and 5d). Each C has four corner vertices. We can clearly find a Hamiltonian path
that starts and ends at distinct corner vertices in C (Figure 6). If the start and end vertices are on
the same side of C, then the turn cost is 5, else it is 4. We refer to these two traversals of C as
type-1 and type-2, and incur additional turn costs of 1 and 0 for entering and exiting C.
    Figure 8 shows the outline of the argument. We start with the set of axis parallel unit seg-
ments (Figure 8a), and its corresponding perpendicular intersection graph G (Figure 8b) with its
Hamiltonian cycle (in bold). Assume without loss of generality that G is connected and has n > 1

                                                   6
Figure 4: Square grid graph G (left). Dotted black graph (right) is the intersection graph of axis
aligned unit line segments (black) intersecting at end points.

vertices. We replace unit line segments with square blocks (Figure 8c), which provides the con-
nected polygonal region R. Figure 8d shows square blocks replaced by corresponding clusters,
and Figure 8e shows the 3d printing tour to cover R.

      (a)                    (b)                               (c)                       (d)

Figure 5: (a): Each unit line segment is represented by a Square Block (solid black) and dual of the
Square Block, i.e., its 9-cluster (dotted black). (b), (c), (d): Connectivity based on corresponding
unit line segment intersection shown in Figure 3a, 3b, and 3c.

Lemma 3.3. Any Hamiltonian tour of R covers every 9-cluster C by a single path within C.

Proof. A Hamiltonian tour H of R enters and exits any 9-cluster C through corner vertices. We
have two distinct pairs of entry–exit vertices in C for H (as we have four corner vertices). Hence
we can have at most two paths p, p0 within C that are part of H. Further, since H is a Hamiltonian
tour, p ∩ p0 = ∅.
    We consider two possible ways in which p enters and exits C. First, let p enter and exit at
diagonal corner vertices of C, e.g., at a, d partially covering C (Figure 7). Since p does not contain
b and c, and since p ∩ p0 = ∅, p0 cannot cover all remaining vertices of C without intersecting p.
One such case is shown in Figure 7a. This contradicts the Hamiltonicity of H. A similar argument
holds when p used b and c as end points.

                                                  7
Figure 6: Left and Middle: Hamiltonian path (solid black) with start and end vertices on same
side of C9 with turns cost 5. Total entry and exit (red) turn cost for C9 is 1. Right: Hamiltonian
path (solid black) with start and end vertices at diagonally opposite corners of C9 , with turn cost 4.
Total entry and exit (red) turn cost for C9 is 0.

   Second, let p enter and exit along the same side of C, e.g., using a and b (Figure 7b). Then
 0
p with end points c, d cannot cover rest of the vertices of C without intersecting p, raising a
contradiction.

                              (a)                                     (b)

                                    Figure 7: Proof of Lemma 3.3.

Theorem 3.4. Minimum Turn 3dPP is NP-hard for any connected polygon R with holes for axis-
aligned unit square extruder.
Proof. Assume there exists a Hamiltonian tour H in G. Any move in H from vertex vi to vj is
equivalent to moving from 9-cluster Ci to Cj in R by construction. By Lemma 3.3, H covers each
9-cluster Ci by a single path within Ci . Further, H uniquely determines the type of traversal (type
1 or 2) for each 9-cluster Ci , and hence the numbers t1 , t2 of these clusters such that t1 + t2 = n.
This gives a 3dPP tour of R with total turn cost 6t1 + 4t2 (Figure 6).
    Conversely, assume there is a 3dPP tour T with turn cost 6t1 + 4t2 for t1 , t2 being the numbers
of type-1 and type-2 traversals, and t1 + t2 = n. Since T enters and exits each 9-cluster exactly
once (Lemma 3.3), we are guaranteed a tour of length n in G where each node is traversed exactly
once. Thus G has a Hamiltonian tour.

                                                  8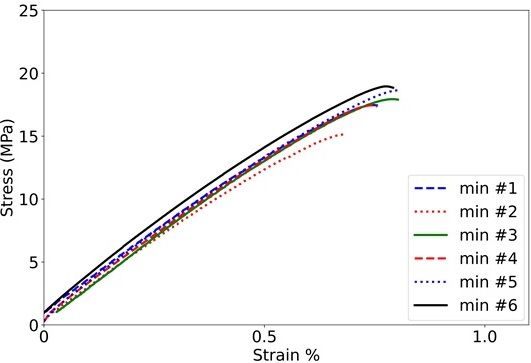
(a)                                            (b)

                      (c)                                            (d)

                      (e)                                            (f)

Figure 8: See text above Lemma 3.3 for details on Figures (8a)–(8e). Proof of Corollary 3.5 is
illustrated in Figure (8f).

                                              9
Corollary 3.5. Minimum Turn 3dPP is NP-hard for any simple polygon R0 when using an axis-
aligned unit square extruder.
Proof. R in Theorem 3.4 can be modified to a simple polygonal region R0 by adding narrow slits
to connect holes in R (Figure 8f). Let the width of each slit be w/n0 for n0 ≥ n and w ≤ 1.
Addition of slits does not add any turn cost, since it is the same 3dPP with total idle movement
n(w/n0 ) = ≤ 1. By Theorem 3.4, a Hamiltonian tour of length n on G gives a 3dPP tour with
turn cost 6t1 + 4t2 for R. This implies there is a 3dPP tour with turn cost 6t1 + 4t2 on R0 , since total
idle movement is less than 1. Conversely, let R0 have a tour with turn cost 6t1 + 4t2 . Then total
turn cost of a tour in R is also 6t1 + 4t2 , since idle movement in R0 is < 1. Hence it corresponds
to a Hamiltonian tour of length n = t1 + t2 in G as implied by the arguments in Theorem 3.4.
4 SFCDecomp:Domain Decomposition and Space Filling Curves
We develop SFCDecomp as a framework that could handle large instances of 3dPP. This framework
uses a quadtree structure to decompose the integral orthogonal polygon (IOP) P into square cells.
Some of the square cells can be joined to create bigger cells. We then identify the traversal order of
these cells using a Hilbert space filling curve. The framework will work also with other rectilinear
space filling curves such as Peano or Moore curves.
4.1 Quadtree Decomposition and its Properties
We create the quadtree decomposition of IOP P as follows. First, we find the smallest initial cell
[0, 2q ] × [0, 2q ] that contains P where q > 0 is an integer. Second, we apply adaptive subdivision
of the initial cell until all cells are completely inside or outside of P . We then remove cells that are
completely outside of P from the quadtree. Third, we further subdivide cells if the area of the cell
is more than δ > 0, an integer. An example of the quadtree is shown in Figure 9.
We want to ensure that each leaf cell in the quadtree is traversed at least once by the toolpath
algorithm. One option is to do depth first traversal, where we recursively follow the left most
unvisited branch until we reach a leaf cell. Once done with the leaf cell, we backtrack until the
first cell that has a left most unvisited child cell, and so on. This gives us a sequential ordering of
cells (see Example in Figure 9c). But jumps could be pretty large between neighboring cells in this
sequence. Instead, we create a sequence based on a Hilbert ordering such that neighboring cells
are also adjacent (see Figure 9d).
For illustration, consider an 8 × 8 square domain and its 2 × 2 cells generated from subdivision
using quadtree with δ = 4, and Hilbert ordering of its cells as shown in Figure 10. To generate a
Hilbert curve we need to identify entry and exit corners for each cell. Suppose the Hilbert curve
enters at (0, 0) and exits at (8, 0). Due to its properties, the Hilbert curve will enter and exit the cell
at points that are along an edge of the cell (and not diagonally opposite), as shown in Figure 10a.
Each cell C (from now on, we refer to these cells as C or Ci ) in Figure 10a is a union of pixels,
as they are square with integer length. Let G be the dual graph of the pixel graph of cell C, and
let entry (s) and exit (t) vertices in G be the vertices closest to the Hilbert curve in C. We ensure
all the vertices in the dual graph of the pixel graph of cell C are covered in the following way.
First, we find the path for each G using the MIP model in Section 5 for a given choice of entry (s)
10(a) (b)
(c) (d)
Figure 9: In Figure 9a, red cells will be further subdivided since they are not completely inside the
polygon. Figure (9b) shows the quadtree where red nodes represents red cells in Figure (9a) further
subdivided, shaded square nodes represent cells completely inside polygon, and empty square
nodes represent cells completely outside polygon and will be removed from the tree. Figures (9c)
and (9d) show sequential ordering of leaf node cells using depth first traversal and Hilbert ordering.
and exit (t) vertices (Figure 10b). Second, we join these paths by a connecting path between exit
and entry vertices of neighboring graphs in corresponding cells’ Hilbert ordering (Figure 10c). If
length of the connecting path is more than one unit, then it is set as idle movement of the extruder.
Note that the traversal of IOP can be a walk due to idle movements of the extruder. We call a
finite sequence of vertices and edges where both vertices and edges can be repeated a walk, and a
path when vertices and edges are not repeated.
11(a) (b) (c)
Figure 10: Black dots in Figure 10a represent entry and exit vertices for each cell from 0 to 15, and
Hilbert ordering of the cells is in pink. Figure 10b shows entry vertex (green dot) and exit vertex
(blue dot) for the dual graph (red) of the pixel graph of each cell. Paths shown in pink covers all
vertices of dual graphs. Figure 10c shows connecting paths in pink which connect paths on dual
graphs based on Hilbert ordering of corresponding cells.
Entry and exit vertices of any G identified by this approach are corner vertices in G that can
be joined by a straight path. Let (G, s, t) be a Hamiltonian s-t path problem for distinct vertices
s and t. We show that (G, s, t) always has a solution. First we review certain properties of grid
graphs. A grid graph is a finite graph whose vertices are points with integer coordinates, and two
vertices are connected if they are unit distance apart. Let (vx , vy ) be the coordinates of vertex v.
Then v is even if vx + vy = 0 mod 2, else v is odd. This implies that grid graphs are bipartite,
with edges connecting even and odd vertices. Let R(m, n) be the grid graph whose vertex set is
{v : 1 ≤ vx ≤ m, 1 ≤ vy ≤ n}. A rectangular graph is a grid graph isomorphic to R(m, n).
For the sake of completeness of presentation, we review the necessary conditions for existence of
a Hamiltonian path in rectangular graphs presented by Itai et al. [17]. We also denote R(m, n) by
B = (V 0 ∪ V 1 , E), the bipartite graph. Since B is two colorable, let all vertices in V 0 be of one
color and all vertices in V 1 be of a second color.
4.1.1 The Hamiltonian path problem (B, s, t)
A solution to (B, s, t) exists if at least one of the following conditions is not satisfied.
1. B is even (|V 0 | = |V 1 |) and s and t are of the same color, or B is odd, say, with |V 0 | =
|V 1 | + 1, and s, t ∈ V 1 .
2. n = 1 and either s or t is not a corner vertex (Figure 11a).
3. n = 2 and edge st is not a boundary edge (Figure 11b).
4. n = 3 and it satisfies following conditions (Figures 11c, 11d):
(a) s is different color from t, and t is different color from the top corner vertices; and
(b) sx ≤ tx − 1 or (sy = 2 and sx ≤ tx ).
12(a) (b)
(c) (d)
Figure 11: Cases that prevent Hamiltonian path problem (B, s, t) from having a solution. This
figure is similar, but not identical, to Figure 3.1 in the work of Itai et al. [17].
Lemma 4.1. Let (G, s, t) be a Hamiltonian path problem on G, the dual graph of pixel graph of
a cell C, and s and t be the entry and exit vertices of the Hamiltonian path. Then (G, s, t) has a
solution.
Proof. If area of C is one unit then it is a trivial case, since G has one vertex. More generally,
the entry and exit vertices s and t are corner vertices in G, and are joined by a straight path. This
straight path has even number of vertices. Hence s and t have different colors. Further, we have
equal number of even and odd vertices in any G. Hence a Hamiltonian path always exists, as none
of the conditions listed in Section 4.1.1 is satisfied.
4.1.2 Joining square cells
We now try to join certain square cells into bigger cells so that we can solve larger instances of
the subproblems to reduce turn costs. Let Gi be the dual graph corresponding to square cell Ci .
Let S = {C1 , . . . , Ch } be the sequence of square cells based on Hilbert ordering for an IOP P ,
and G(S) = {G1 , . . . , Gh } is the corresponding sequence of dual graphs. Let (Gk , sk , tk ) be the
Hamiltonian path problems for k ∈ [h] := {1, . . . , h} and sk , tk are chosen as in Section 4.1.
Rectilinear distance between any two ordered neighbors Gi , Gi+1 in sequence G(S) is defined as
d(Gi , Gi+1 ) = |txi − sxi+1 | + |tyi − syi+1 |.
We join square cells as follows. First, let G(Si ) = {Gl , . . . , Gl+k } where d(Gl−1 , Gl ) > 1 or
l = 1, and d(Gl+k , Gl+k+1 ) > 1 or l + k = h and d(Gi , Gi+1 ) = 1 ∀i ∈ {l, . . . , l + k − 1}. Find
subsequence set {G(Si )} from G(S). Second, let C̃j be union of all the cells in subsequence S̃j of
Si . Consider C̃j as an IOP. Partition Si into a set of subsequences {S̃j } such that total area of C̃j is
≤ ∆, where ∆ is maximum area allowed in any S̃j (see Figures 12a, 12b).
Lemma 4.2. Let {G1 , . . . , Gh } be a sequence of dual graphs corresponding to sequence {C1 , . . . ,
Ch } whose union is C̃j , (Gk , sk , tk ), (G̃i , s, t) be Hamiltonian path problems where k ∈ [h] and
sk , tk ∀k is chosen as described in Section 4.1, and G̃i is the dual graph of the pixel graph of C̃i .
If s = s1 , t = th then (G̃i , s, t) has a solution.
13Proof. By Lemma 4.1, a Hamiltonian path exists for all (Gi , si , ti ). The Hamiltonian path from
Gi is joined with the one from Gi+1 by an edge {ti , si+1 } in G̃i . The result follows once we set
s = s1 , t = tm .
(a) (b) (c)
Figure 12: Path (pink) in Figure 12a covers the IOP. Idle movement of path is shown in pink
dots. Further, Hilbert ordering of the cells is [0, 1, 2, 3, 4, 5, 6, 7, 12, 13, 14, 15]. Figure 12b shows 3
joined square cells based on Hilbert ordering into [0, 1, 2, 3], [4, 5, 6, 7], [12, 13, 14, 15] with ∆ = 16
(Section 4.1.2). Figure 12c shows updated entry vertex of the last joined square cell to reduce idle
movement in the path (Section 4.1.3).
4.1.3 Update entry and exit vertices
If vertices v and v 0 have both even or both odd coordinates, then we say that v, v 0 have the same
parity.
Lemma 4.3. Consider the same set up as in Lemma 4.2. If s, t have same parity as s1 , tm , respec-
tively, and s ∈ G1 , t ∈ Gm , then (G̃i , s, t) has a solution.
Proof. By Lemma 4.2, (G̃i , s1 , tm ) has a solution. We know the pairs {s, t1 } and {sm , t} have
different parities. Then (G1 , s, t1 ) and (Gm , sm , t) have solutions since no condition in Section
4.1.1 is satisfied. Hence (G̃i , s, t) has a solution.
Let G̃(S) = {G̃1 , . . . , G̃h } be a sequence of dual graphs after joining square cells and let
(G̃i , si , ti ) be the Hamiltonian path problems for each C̃i . Let subsequence S̃i have cells whose
union is C̃j and G(S̃i ) = {G1 , . . . , Gk }. We can reduce idle movement of the extruder by defining
new Hamiltonian path problems (G̃i , s0i , t0i ) for each C̃i such that d(G̃i , G̃i+1 ) is smallest compared
to all possible choices of entry and exit vertices, where pairs {si , s0i } and {ti , t0i } have same parity
∀i. Further, we can have a case where (G̃i , s0i , t0i ) has no solution if any condition in Section 4.1.1
is satisfied. But based on Lemma 4.3, we can further add the restriction such that s0i ∈ G1 and
t0i ∈ Gk to guarantee existence of a Hamiltonian path. Note that the total idle movement in Figure
12b is reduced in Figure 12c.
Correctness: Based on our approach, Lemmas 4.1, 4.2, and 4.3 guarantee existence of a Hamil-
tonian path in the dual graph of any cell even after implementing steps in Sections 4.1.2 and 4.1.3.
14Complexity: Let T be the maximum time to solve any problem (G̃i , s0 , t0 ) and N the total
number of vertices in the dual graph of pixel graph of IOP. Then time complexity is O(N T ) =
O(N ) when T is small and fixed. In practice, we observed T in tens of seconds.
5 Mixed Integer Programming Model and Relaxation
Let G̃ be the dual graph for a cell in the decomposition of the region (similar to the illustration in
Figure 2). For a given pair of nodes s, t, we want to find a Hamiltonian s-t path that minimizes
a combination of total edge weights and turn costs. Based on the Miller-Tucker-Zemlin (MTZ)
formulation for TSP [27], we present a mixed integer program (MIP) that also models turn costs.
With xij ∈ {0, 1}, i, j ∈ [n] := {1, . . . , n}, i 6= j, we let xij = 1 if edge (i, j) is included in
the Hamiltonian path. To avoid subtours, we let ui be the index of node i ∈ [n] in the path (e.g.,
ui = 4 ⇒ node i is the 4th node), and add the subtour elimination constraints in Equation (4). We
let cij ≥ 0 be the weight of edge (i, j) that is part of the data, and use ci ≥ 0 to model the turn cost
at node i. To capture ci , we set the binary parameter Aijk = 0 if edges (i, j) and (j, k) form 180◦
angle at j, and Aijk = 1 when this angle is 90◦ . We then add the constraints in Equation (2). The
relative importance of edge and turn costs is captured by the scaling parameter α ∈ [0, 1], such that
α = 1 gives the minimum edge cost problem and α = 0 gives the minimum turn cost problem.
X X
min α cij xij + (1 − α) ci (1)
xij (i,j)∈G̃ i∈[n]
s.t. cj ≥ Aijk (xij + xjk − 1) ∀(i, j), (j, k) ∈ G̃;
(2)
cj ≥ 0 ∀j ∈ [n]; cs = ct = 0;
X X
xij = xji ≥ 1, i ∈ [n], i 6= s, t;
j j
X X X X (3)
xsj = 1, xjs = 0; xtj = 0, xjt = 1;
j j j j
ui − uj + 1 ≤ n(1 − xij ) ∀(i, j) ∈ G̃, i ∈
/ s, t; us = 1; (4)
xij ∈ {0, 1} ∀(i, j) ∈ G̃.
To solve relatively large instances of this IP efficiently, we remove the subtour constraints in
Equation (4) and develop the following heuristic.
1. Join Cycles:
(a) Solve the relaxed MIP without constraints (4)) for (G̃i , s, t). Generally, We obtain a set
of cycles and an s-t path covering all the vertices in G̃i .
(b) Create a new undirected graph Gci where each vertex represents a cycle obtained in Step
(1a) above, and there is an edge between vertices if the corresponding cycles can be
joined into a bigger cycle by performing a 2-opt exchange [3] at a unit square between
them. If there are multiple such unit squares, we pick one that adds the minimum
weight to the joined cycle. Solve a minimum spanning forest (MSF) problem on Gci ,
and join cycles based on the edges in each tree in the MSF. Repeat this step until the
solution does not change.
152. Join Cycles and s-t Path: Examine the cycles created by Step (1) in the increasing order of
numbers of squares available for 2-opt exchange with the s-t path. Update the s-t path by
merging cycles in this order, choosing the minimum cost square for 2-opt exchanges in each
step.
Note that this heuristic is not guaranteed to identify a Hamiltonian s-t path for every (G̃i , s, t).
But in over 10,000 such instances over all layers of the Buddha and the Bunny in our computations,
it failed to identify a Hamiltonian path in only one instance.
Complexity: The heuristic runs in O((nci )2 TIP ) = O(n2 TIP ) time, where nci = O(n) is the
number of nodes in Gci and TIP is the time for solving the relaxed IP instance. But in practice, TIP
was usually in tens of seconds and the MSF computation ran in O(nci log nci ) time for nci
n.
5.1 General Geometry
We describe how to extend the SFCDecomp framework to handle general geometries that are not
integral orthogonal polygons. Let V be the set of vertices of print edges in the tool path (Section
4) closest to the boundary of general polygon P containing the IOP P (i.e., P ⊂ P in the nontrivial
case). Then we can project vertices in V to the boundary of P. We project each vertex in V at most
once (see Figure 13).
Figure 13: We project edge e with vertices in V orthogonal to e onto the boundary of P. Project
all such edges. Some vertices in V may not get projected. Suppose v ∈ V in print edge e0 is
not projected (middle). Then convert e0 to idle movement in the tool path, and project v to the
boundary of P orthogonal to e0 (right). Here, edge e0 could be idle to start with.
Results from an implementation of the complete pipeline with the MIP model (Section 5) for
a single layer is shown in Figure 14. We can handle disconnected polygons, or ones with holes.
Figure 1 (in Page 2) and Figure 17 show sample layers from implementations on the Buddha and
the Bunny.
6 Maximizing or Minimizing Edge Overlaps
As a direct application of the SFCDecomp framework, we consider maximizing or minimizing
print edge overlaps across adjacent layers. The premise we want to investigate is that the extent of
edge overlap across adjacent layers affects the mechanical strength of the printed object.
16110 110 110
100 100 100
90 90 90 21
36
80 80 80
70 70 70
70 80 90 100 110 120 130 70 80 90 100 110 120 130 70 80 90 100 110 120 130
(a) (b) (c)
110 110 110
13
100 100 100
90 90 90
19
80 80 80
70 70 70
70 80 90 100 110 120 130 70 80 90 100 110 120 130 70 80 90 100 110 120 130
(d) (e) (f)
Figure 14: Figure 14a shows polygon P and its largest IOP P in blue. Figure 14b shows decompo-
sition of P with δ = 64. Figures 14c and 14d show dual graphs (red) after implementing Sections
4.1.2, 4.1.3 with ∆ = 120, 256 (resp.). Enter and exit vertices are shown in green and blue dots
(also isolated vertices). Print paths (red) with uniform and random edge weights are in Figures 14e
and 14f (both combined with turn costs).
To maximize (resp. minimize) overlap, the weight of all edges in the dual graph G̃i of Layer i
is set to 0.5 (resp. 1.5) instead of 1 (default) if they overlap with edges in the print path in Layer
(i − 1). Figure 15 shows variations of edge overlap ratios across the initial 148 layers of the
Stanford Bunny. We make the following observations.
1. Figure 15a: Original (uniform edge weights) and maximum overlap problems have similar
overlap costs. For same (G̃i , s, t) between adjacent layers, both maximum overlap and orig-
inal problems should return same solution. We can observe large changes in edge overlap
at a few places in the original problem. It is due to significant variation in decompositions
between adjacent layers. For instance, layers 33, 34, 35 have significant differences in de-
composition as shown in Figures 16a, 16b, 16c. Further, the desired general trend of increase
in overlap for maximum overlap and original problems, as well as decrease in overlap for
minimum overlap, are observed due to increase in cross section area of the layers as we move
up in z-axis.
2. Figure 15b: In general there are sharp changes in number of turns across any 3 adjacent
layers in the minimum overlap problem since it forces adjacent layers to have different tours.
It further forces Layer i + 2 to have a similar toolpath as Layer i. This is illustrated for the
same Block 5 in layers 117, 118, 119 in Figures 16e, 16f, 16g.
170.9 Maximum
Minimum
Original
0.55
Ratio = Total 90 degree Turns / Total 90 and 180 degrees Turns
Ratio = Total Overlapped printed edges / Total printed edges
0.8 33
0.50
0.7
35
34
Maximum 0.45
Minimum
0.6 Original
0.40
0.5
0.35
0.4
0.30
0 20 40 60 80 100 120 140 0 20 40 60 80 100 120 140
Layer Layer
(a) (b)
Figure 15: Figure 15a shows the Ratio (Total Overlapped printed edges / Total printed edges) for
each Layer and Figure 15b shows the Ratio (Total 90 degree Turns / Total 90 and 180 degrees
Turns) for each Layer for maximization, minimization, and using uniform edge weights (original)
problems on the initial 148 layers of the Bunny.
110 110 110
100 100 100
90 90 90
80 80 80
70
80 90 100 110 120 130 14080 90 100 110 120 130 14080 90 100 110 120 130 140
(a) (b) (c)
120
110
100
90
5
80
70
60 70 80 90 100 110 120 130
(d) (e) (f) (g)
Figure 16: Figures 16a, 16b, 16c show decompositions for layers 33, 34, and 35 of the Bunny, re-
spectively. Figure 16d shows dual graph of layer 117 with Block 5 (present in layers 117, 118, 119).
Figures 16e, 16f, 16g show tool path in those layers with minimum overlap on Block 5.
18Figure 17: Layers 125 and 312 of Bunny (top) and layers 90 and 138 of Buddha (bottom).
7 Mechanical Testing
We experimentally investigated the effects of space filling curve design and edge overlaps across
adjacent layers on mechanical properties of the print. We found that specimens with minimum and
maximum edge overlaps have significantly different tensile behavior.
7.1 Experimental Design and Fabrication
We created tensile specimens shaped as a rectangular cuboid with a hole in the center (Figure 18a).
For uniform placement on the print platform, the first layer for all samples was printed using the
same zigzag design at 0.2 mm height. The specimens had 19 layers at 0.2 mm height on the base
layer. We used a polylactic acid (PLA) filament with 1.75 mm diameter in a desktop fused filament
fabrication (FFF) device with a nozzle of 0.4 mm in diameter (from MatterHackers Inc., USA).
We measured tensile mechanical properties using a universal tensile testing machine (INSTRON
600DX) along with an extensometer (Epsilon 3542-0200-50-ST) of 2” gauge length and a load cell
rated for 1000 lbs. We performed the tests with a constant strain rate of 0.8 mm/minute.
Printing many orthogonal line segments with 90◦ turns (with extrusion width of 0.4 mm) caused
several holes to appear at intersections of multiple extrusion corners. Hence we extruded 10%
more material near a 90◦ turn so as to reduce the size and number of these holes. We fabricated the
specimens at a hot-end temperature of 200◦ C, print-bed temperature of 45◦ C, and extrusion speed
of 30 mm/s and acceleration limit of 500 m/s2 . We tested six samples each with maximum (Max)
and minimum (Min) edge overlaps across adjacent layers. We repeated two distinct pairs of print
patterns for adjacent layers that satisfied the criteria for maximum and minimum edge overlaps.
19Figure 18: Mechanical testing. a) Dimensions of specimen (in mm) with a hole in the middle. b)
Cross sections of failure. c) Sample adjacent layers for maximum (“Max” at top) and minimum
(“Min” at bottom) edge overlap designs. d) Failure lines were similar across most specimens.
7.2 Results and Discussion
Results from the tensile tests are shown in Table 1 and the stress–strain curves shown in Figure
19. The fracture surfaces suggested the specimens failed primarily due to localized delamination
[12] between the extrusion filaments. These failures are along sections where a large number of
extrusions were printed in the direction perpendicular to the load direction (Figure 18b) and often
coincide with cell boundaries. Within each set of the Max and Min samples, the fractures occurred
mostly at the same site (Figure 18d).
Table 1: Test results of specimens with maximum edge overlap (Table 1a, left) and with minimum
edge overlap (Table 1b, right). Mdls gives the tensile modulus in GPa, Strength gives the tensile
strength in MPa, and Elngtn gives the elongation at break (as %). The last two rows in each table
list the averages (Max/Min Mean) and standard deviations (Max/Min Stdev) of the measurements.
(a) Maximum overlap samples. (b) Minimum overlap samples.
Sample Mdls Strength Elngtn Sample Mdls Strength Elngtn
Max 1 2.67 21.67 1.03 Min 1 2.53 17.46 0.76
Max 2 2.48 13.43 0.70 Min 2 2.42 15.14 0.69
Max 3 2.63 12.22 0.57 Min 3 2.60 17.94 0.80
Max 4 3.16 17.39 0.74 Min 4 2.54 17.45 0.76
Max 5 2.56 13.24 0.70 Min 5 2.63 18.63 0.81
Max 6 2.55 12.93 0.79 Min 6 2.73 18.95 0.79
Max Mean 2.68 15.15 0.76 Min Mean 2.57 17.60 0.77
Max Stdev 0.25 3.68 0.15 Min Stdev 0.10 1.35 0.04
20The first Max sample (Max 1) exhibited significantly higher tensile strength and elongation
at break compared to other Max specimens (Table 1a and left plot in Figure 19). This outlier
may be due to manufacturing variation that resulted in overall lower porosity in this sample, thus
improving the tensile properties. Removing this outlier decreases further the tensile strength of the
Max samples (mean: 13.84, standard deviation: 2.04). All Min samples exhibited similar tensile
behavior and properties (Table 1b and right plot in Figure 19). Overall, the minimum edge overlap
samples exhibited better tensile strength (mean: 17.60, standard deviation: 1.35) and modulus than
the maximum edge overlap ones while the elongation at break is similar for both sets.
The stress-strain curves (Figure 19) reveal similarity in tensile moduli of the maximum and
minimum overlap patterns. All specimens experienced elongation at break and tensile strength
less than the material specification. The reduced elasticity could be due to the combined effect
of intralayer adhesion arising from extrusion segment orientation [31], and the type of dominant
defects [14] present as the result of different interlayer pattern generation strategy.
Figure 19: Stress-Strain curves for maximum edge overlap specimens (left) and minimum edge
overlap specimens (right).
8 Discussion
We have developed a decomposition approach to solve large instances of optimized path planning
problem in 3d printing where each sub-polygon is guaranteed to have a dual graph with a feasible
tool path. Our framework guarantees that discontinuities in the tool path, if any, are located only
at the boundary of the original (input) polygon. Further, we can change the Hilbert ordering of the
cells by changing the enter and exit corner vertices of the initial cell in the quadtree. We can also
create various decompositions for the same IOP by changing the values of parameters δ and ∆.
The edge weights in our graph framework could model multiple quality factors including turn
costs, edge overlap across adjacent layers, tool path length, and others. Our mechanical testing has
shown that changing the extent of overlap across layers could impact the mechanical strength of
the printed object. Another potential application of our framework is the optimization of internal
microstructure and thermal management by choosing appropriately defined edge weights derived
from physical models and/or experiments, which in turn could result in increased strength of the
printed objects.
21For the Buddha and Bunny together, our framework solved more than 10,000 MIP subproblems
across more than 500 layers. These MIP instances could be solved independently, and hence in
an embarrassingly parallel fashion. Alternatively, our framework allows the use of approximation
algorithms or heuristics to solve the subproblems instead of solving the MIP model to optimality
[3]. We could also reuse optimal solutions for cells that reoccur across multiple layers. Using
uniform edge weights, and varying the relative importance parameter α (Equation 1), we could
obtain fractal-like patterns for the toolpath.
If we solve the full MIP model including subtour constraints (4), any discontinuities in the tool
path will be located at the boundary of the original polygon. This setting could be of concern
when the polygon is relatively thin as compared to size of extruder. We could consider reducing
the extruder size to handle such situations, or consider alternative methods (e.g., spiral or zigzag
patterns). In extreme cases where the polygon in a given layer has many sharp curvature regions,
we could have many small sized sub-polygons near the boundary. This setting could create several
discontinuities in the tool path at the boundary. We will explore methods to handle such extreme
cases in our future work.
Our mechanical testing experiments (Section 7), while preliminary, already demonstrate that
the amount of edge overlap across adjacent layers could significantly affect the strength of the
print. We plan to employ the SFCDecomp framework to study in detail the effects of tool path
design as well as edge overlap across layers on various mechanical properties.
References
[1] Alok Aggarwal, Don Coppersmith, Sanjeev Khanna, Rajeev Motwani, and Baruch Schieber.
The angular-metric traveling salesman problem. SIAM Journal on Computing, 29(3):697–
711, 2000.
[2] Oswin Aichholzer, Anja Fischer, Frank Fischer, J. Fabian Meier, Ulrich Pferschy, Alexan-
der Pilz, and Rostislav Staněk. Minimization and maximization versions of the quadratic
travelling salesman problem. Optimization, 66(4):521–546, 2017.
[3] David L. Applegate, Robert E. Bixby, Vašek Chvátal, and William J. Cook. The Traveling
Salesman Problem: A Computational Study. Princeton University Press, 2007.
[4] Esther M. Arkin, Michael A. Bender, Erik D. Demaine, Sándor P. Fekete, Joseph S. B.
Mitchell, and Saurabh Sethia. Optimal covering tours with turn costs. SIAM Journal on
Computing, 35(3):531–566, 2005.
[5] Esther M. Arkin, Sándor P. Fekete, and Joseph S. B. Mitchell. Approximation algorithms for
lawn mowing and milling. Computational Geometry, 17(1-2):25–50, 2000.
[6] M Bertoldi, M Yardimci, C M Pistor, and S I Guceri. Domain decomposition and space filling
curves in toolpath planning and generation. In Proceedings of the Annual International Solid
Freeform Fabrication Symposium (SFF ’98), pages 267–276, 1998.
[7] Bernard Chazelle and David Dobkin. Decomposing a polygon into its convex parts. In
Proceedings of the Eleventh Annual ACM Symposium on Theory of Computing, STOC ’79,
pages 38–48, New York, NY, USA, 1979. Association for Computing Machinery.
22[8] Bernard Chazelle and David P. Dobkin. Optimal convex decompositions. In Godfried T.
Toussaint, editor, Computational Geometry, volume 2 of Machine Intelligence and Pattern
Recognition, pages 63–133. North-Holland, 1985.
[9] Bernard Chazelle and Leonidas Palios. Decomposition Algorithms in Geometry, pages 419–
447. Springer New York, New York, NY, 1994.
[10] Nicos Christofides. Worst-case analysis of a new heuristic for the travelling salesman prob-
lem. Technical report, Carnegie-Mellon University, Pittsburgh PA, Management Sciences
Research Group, 1976.
[11] Donghong Ding, Zengxi Stephen Pan, Dominic Cuiuri, and Huijun Li. A tool-path generation
strategy for wire and arc additive manufacturing. The International Journal of Advanced
Manufacturing Technology, 73(1-4):173–183, 2014.
[12] Grzegorz Dolzyk and Sungmoon Jung. Tensile and fatigue analysis of 3d-printed polyethy-
lene terephthalate glycol. Journal of Failure Analysis and Prevention, 19:511–518, 03 2019.
[13] Rajeev Dwivedi and Radovan Kovacevic. Automated torch path planning using polygon sub-
division for solid freeform fabrication based on welding. Journal of Manufacturing Systems,
23(4):278–291, 2004.
[14] Kazem Fayazbakhsh, Mobina Movahedi, and Jordan Kalman. The impact of defects on
tensile properties of 3D printed parts manufactured by fused filament fabrication. Materials
Today Communications, 18:140–148, 2019.
[15] Sándor P. Fekete and Gerhard J. Woeginger. Angle-restricted tours in the plane. Computa-
tional Geometry, 8(4):195–218, 1997.
[16] Ian Gibson, David Rosen, and Brent Stucker. Additive Manufacturing Technologies.
Springer-Verlag, 2015.
[17] Alon Itai, Christos H. Papadimitriou, and Jayme Luiz Szwarcfiter. Hamilton paths in grid
graphs. SIAM Journal on Computing, 11(4):676–686, 1982.
[18] Yuan Jin, Yong He, Guoqiang Fu, Aibing Zhang, and Jianke Du. A non-retraction path
planning approach for extrusion-based additive manufacturing. Robotics and Computer-
Integrated Manufacturing, 48:132–144, 2017.
[19] David S. Johnson and Lyle A. McGeoch. The Traveling Salesman Problem: A Case Study
in Local Optimization. In Emile H. L. Aarts and Jan K. Lenstra, editors, Local Search in
Combinatorial Optimization, pages 215–310. John Wiley and Sons, 1997.
[20] Mark Keil. Polygon decomposition. Handbook of Computational Geometry, 01 2000.
[21] Tim Kuipers, Jun Wu, and Charlie C.L. Wang. CrossFill: Foam structures with graded
density for continuous material extrusion. Computer-Aided Design, 114:37–50, 2019.
arXiv:1906.03027.
23[22] S. Lensgraf and R. R. Mettu. Beyond layers: A 3D-aware toolpath algorithm for fused
filament fabrication. In 2016 IEEE International Conference on Robotics and Automation
(ICRA), pages 3625–3631, 2016.
[23] S. Lensgraf and R. R. Mettu. An improved toolpath generation algorithm for fused filament
fabrication. In 2017 IEEE International Conference on Robotics and Automation (ICRA),
pages 1181–1187, 2017.
[24] S. Lensgraf and R. R. Mettu. Incorporating kinematic properties into fused deposition tool-
path optimization. In 2018 IEEE/RSJ International Conference on Intelligent Robots and
Systems (IROS), pages 8622–8627, 2018.
[25] Jyh-Ming Lien and Nancy M. Amato. Approximate convex decomposition of polygons.
Computational Geometry, 35(1):100–123, 2006. Special Issue on the 20th ACM Symposium
on Computational Geometry.
[26] Andrzej Lingas. The power of non-rectilinear holes. In Mogens Nielsen and Erik Meineche
Schmidt, editors, Automata, Languages and Programming, pages 369–383. Springer Berlin
Heidelberg, 1982.
[27] C. E. Miller, A. W. Tucker, and R. A. Zemlin. Integer programming formulation of traveling
salesman problems. Journal of the Association for Computing Machinery, 7(4):326–329,
1960.
[28] Christos H. Papadimitriou. The Euclidean travelling salesman problem is NP-complete. The-
oretical Computer Science, 4(3):237–244, 1977.
[29] John Reif and Hongyan Wang. The complexity of the two dimensional curvature-constrained
shortest-path problem. In Proceedings of the Third Workshop on the Algorithmic Foundations
of Robotics on Robotics : The Algorithmic Perspective: The Algorithmic Perspective, WAFR
’98, pages 49–57, Natick, MA, USA, 1998. A. K. Peters, Ltd.
[30] Anatoliy I Serdyukov. O nekotorykh ekstremal’nykh obkhodakh v grafakh. Upravlyayemyye
sistemy, 17:76–79, 1978.
[31] Angel Torrado and David Roberson. Failure analysis and anisotropy evaluation of 3d-printed
tensile test specimens of different geometries and print raster patterns. Journal of Failure
Analysis and Prevention, 16:154–164, 01 2016.
[32] René van Bevern and Viktoriia A. Slugina. A historical note on the 3/2-approximation algo-
rithm for the metric traveling salesman problem. Historia Mathematica, 53:118–127, 2020.
[33] Chris Walshaw. A Multilevel Approach to the Travelling Salesman Problem. Operations
Research, 50(5):862–877, 2004.
[34] Tobias Wasser, Anshu Dhar Jayal, and Christoph Pistor. Implementation and evaluation of
novel buildstyles in fused deposition modeling (FDM). In Proceedings of the Annual Inter-
national Solid Freeform Fabrication (SFF ’99), pages 95–102. The University of Texas at
Austin, 1999.
24[35] Y. Yang, H.T. Loh, J.Y.H. Fuh, and Y.G. Wang. Equidistant path generation for improving
scanning efficiency in layered manufacturing. Rapid Prototyping Journal, 8(1):30–37, 2002.
[36] C. Yoo, S. Lensgraf, R. Fitch, L. M. Clemon, and R. R. Mettu. Toward optimal fdm toolpath
planning with monte carlo tree search. In 2020 IEEE International Conference on Robotics
and Automation (ICRA), pages 4037–4043, 2020.
[37] Haisen Zhao, Fanglin Gu, Qi-Xing Huang, Jorge Garcia, Yong Chen, Changhe Tu, Bedrich
Benes, Hao Zhang, Daniel Cohen-Or, and Baoquan Chen. Connected Fermat spirals for
layered fabrication. ACM Transactions on Graphics, 35(4):100:1–100:10, July 2016.
25You can also read