Building the Himalaya from tectonic to earthquake scales
←
→
Page content transcription
If your browser does not render page correctly, please read the page content below
REvIEWS
Building the Himalaya from tectonic
to earthquake scales
Luca Dal Zilio 1 ✉, György Hetényi 2
, Judith Hubbard3 and Laurent Bollinger4
Abstract | Convergence of the Indian Plate towards Eurasia has led to the building of the
Himalaya, the highest mountain range on Earth. Active mountain building involves a complex
interplay between permanent tectonic processes and transient seismic events, which remain
poorly understood. In this Review, we examine the feedbacks between long-term tectonic
deformation (over millions of years) and the seismic cycle (years to centuries) in the Himalaya.
We discuss how surface morphology of the Himalaya indicates that the convergence is largely
accommodated by slip on the Main Himalayan Thrust plate boundary fault, which developed in
the roots of the mountain range over millions of years. At shorter (decadal) timescales, tectonic
geodesy reveals that elastic strain is periodically released via earthquakes. We use examples from
earthquake cycle models to suggest that partial ruptures could primarily occur in the downdip
region of the Main Himalayan Thrust. Great (Mw 8+) Himalayan earthquakes are more commonly
associated with complete megathrust ruptures, which release accumulated residual strain.
By synthesizing numerous observations that co-vary along strike, we highlight that tectonic
structures that developed over millions of years can influence stress accumulation, structural
segmentation, earthquake rupture extent and location, and, consequently, the growth of the
mountain range.
Orogen
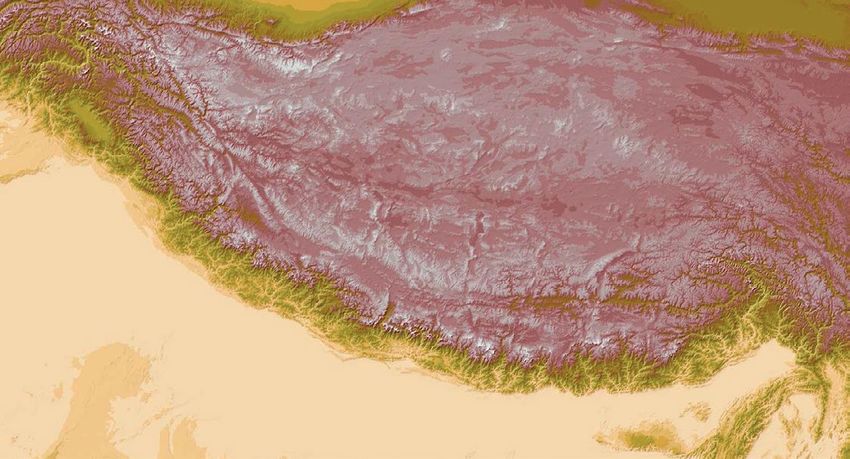
The Himalayan orogen, standing at 7,000–8,000 m, rep- landscape modification and fluid migration). These
A belt of the Earth’s crust resents a striking topographic boundary between the transient processes are impacted by structural geome-
involved in the formation of near-sea-level Ganges and Brahmaputra plains to tries, lithologies, stress states and the presence of fluids,
mountains, owing to tectonic the south and the 4,500–5,000-m-high Tibetan Plateau which often evolve over long timescales.
plate convergence.
to the north. The Himalaya are underlain by one of the Long-term deformation processes, therefore, influ-
largest continental megathrusts on Earth, and, conse- ence all parts of the seismic cycle, including interseismic
quently, the region experiences large earthquakes1 that stress-strain accumulation, seismic slip events (earth-
cause extensive damage and death tolls in both the quakes), post-seismic deformation and non-linear
Himalaya and the densely populated foreland plains (for viscous deformation at depth5. In turn, deformation
example, 2015 Mw 7.8 Gorkha, 2005 Mw 7.6 Kashmir, across multiple earthquake cycles integrates to pro-
1
Seismological Laboratory, 1950 Mw 8.5–8.7 Assam, 1934 Mw 8.4 Bihar–Nepal, duce long-term deformation and shapes tectonic struc-
California Institute of 1905 Mw 7.8 Kangra, 1897 Mw 8.2–8.3 Assam–Shillong tures, from the topography to the roots of the orogen.
Technology, Pasadena,
California, CA, USA.
Plateau). However, large Himalayan earthquakes have Furthermore, crustal deformation and topography are
long recurrence intervals2 (hundreds of years), and the influenced by climate and surface denudation6–10, and, in
2
Institute of Earth Sciences,
University of Lausanne,
limited instrumental record leaves large gaps in our sci- turn, topography and weathering can alter monsoonal
Lausanne, Switzerland. entific understanding of how the long-term deformation patterns and long-term climate11,12. These multiple feed-
3
Earth Observatory of links to and informs earthquake hazard. back cycles result in a non-linear, dynamically evolving
Singapore, Nanyang Over geological timescales (104–107 years), crustal system that is coupled across a large number of spatial
Technological University, deformation is usually described as a continuous, quasi- and temporal scales.
Singapore, Singapore.
steady process accommodated by a combination of In this Review, we discuss the interplay between the
4
Commissariat à l‘Energie viscous deformation at depth and brittle deformation long-term tectonics and short-term seismicity across
Atomique et aux Energies
Alternatives (CEA), Arpajon,
in the upper crust3. However, the occurrence of strong the Himalayan range, and we describe how such interplay
France. (6 < Mw < 7), major (7 < Mw < 8) and great (Mw 8+) affects the seismic behaviour and topography. As they are
✉e-mail: dalzilio@caltech.edu earthquakes attests to the episodic nature of upper crus- subaerial, the Himalaya are one of the best places on Earth
https://doi.org/10.1038/ tal shortening and associated transient processes4 (such to observe and analyze the geologic evolution and natural
s43017-021-00143-1 as dynamic weakening, viscous flow, post-seismic creep, hazards of a mountain belt. We discuss how large-scale
Nature Reviews | Earth & Environment
0123456789();: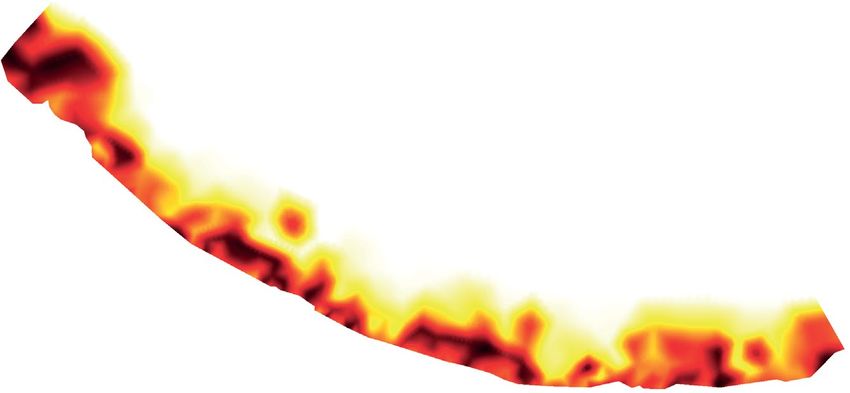
Reviews
Key points called the South Tibetan Detachment29. Rocks north
of the South Tibetan Detachment are known as the
• The Himalayan mountain belt is a unique subaerial orogenic wedge characterized Tethyan Himalaya, and consist of late Precambrian to
by tectonically rapid, ongoing crustal shortening and thickening, intense surface early Palaeozoic sedimentary and metasedimentary
denudation and recurrent great (Mw 8+) earthquakes. rocks29,30 and thick Permian to Cretaceous continental
• The history of the orogen has been investigated from long (million-year) to short margin sequences16,31. The southern boundary of the
(seconds to days) timescales using a variety of geological and geophysical techniques. High Himalaya is defined as a transition from steeper,
• The magnitude 7.8 Gorkha earthquake and aftershocks were monitored by extensive higher topography in the north to a lower topography
local geophysical networks, providing a unique set of observations of a major in the Lesser Himalaya to the south. The High Himalaya
Himalayan earthquake and the Himalayan seismic cycle.
exposes the Greater Himalayan crystalline sequence and,
• Observations across the Himalaya reveal along-strike segmentation patterns at in some regions, parts of the largely Proterozoic meta
various temporal scales, controlled by inherited tectonic complexities developed
sedimentary Lesser Himalayan sequence, which crops out
over millions of years.
from the Main Boundary Thrust (MBT) in the south to
• Developing a complete understanding of deformation across timescales from
the Main Central Thrust (MCT) in the north16,32 (Fig. 2a).
seconds to millions of years requires an integrated, interdisciplinary effort.
Geographically, the Lesser Himalaya domain is
bounded by the MBT in the south to the MCT in the
and long-term tectonic deformations contribute to struc- north and exposes Lesser Himalayan sequence rocks31.
tural segmentation and earthquake generation, and how We note that Lesser Himalayan sequence rocks can be
the Himalayan topography responds to stress pertur- found in both the Lesser and the High Himalaya, which
bations across different stages of the seismic cycle. We are defined based on structure and topography, rather
identify current knowledge gaps and future opportu- than lithology. To the south, the Sub-Himalaya is the
nities towards better understanding how the Himalaya youngest part of the system, spanning from the frontal
deform in space and time, which has implications for fault (the Main Frontal Thrust, or MFT) to the MBT; in
seismic hazard. Although the features described in this this case, the stratigraphic and geographic definitions
Review are based on observations from the Himalaya, the coincide. The Sub-Himalaya is built out of Siwaliks sed-
interaction of multiscale processes is applicable to that in imentary foreland basin sediments and records the last
other continent–continent collision zones. couple of million years of shortening history33.
Himalayan shortening has been largely accommo-
Long-term tectonic deformation dated along three main fault systems: the MFT, the MBT
The Himalaya are a natural laboratory that provide a and the MCT (Fig. 2b). The most recently active faults are
unique opportunity for studying mountain-building those in the Sub-Himalaya, which contains between 1
processes, earthquakes and deep dynamics related to and ~5 subparallel fault strands34. Together, these faults
continent–continent collision. Understanding these are sometimes called the MFT system, with the MFT
processes requires reconstruction of both crustal short- being the southernmost and youngest fault in the set.
ening patterns (developed over millions of years) and The MFT is also the most active surface-breaching fault
present-day crustal structures. In this section, we dis- associated with the Himalaya35. The MBT is roughly
cuss the geological architecture of the Himalayan range parallel to the range front, began to slip at ~11 Ma and
and review how geophysical explorations are used to was active during the Pleistocene36. The MCT is older:
investigate the structure and tectonic processes at work. it formed at ~22–18 Ma and might have remained epi-
sodically active37 since. As the MCT is refolded, its pri-
Geological background. Over the last 70 to 50 million mary trace lies within the High Himalaya, but it is also
years, northward drift of India and its collision with exposed around klippen within the Lesser Himalaya.
Seismic cycle Eurasia has led to the construction of the Himalayan arc The MCT records the bulk of geological shortening
Repeating process during and Tibetan Plateau13–18 (Fig. 1). The Tibetan Plateau, as in the Himalaya, accommodating from 140 km to
which mechanical stress slowly a whole, has accommodated most of the north–south >500 km of displacement38–40.
builds up on a fault over a long
shortening (estimated at more than 1,400 km) since the The MFT, the MBT and the primary exposure of the
period (interseismic period,
years to centuries), is rapidly onset of India–Eurasia collision, and the Himalayan arc MCT are interpreted to merge at depth with the Main
released in an earthquake represents the main collisional front of this orogen16 Himalayan Thrust (MHT), the north dipping basal
(coseismic period, seconds (Fig. 1a). Before collision with Eurasia at ~50 million years décollement that separates the Indian and Eurasian
to tens of seconds) and ago (Ma)19–22, the Indian Plate converged rapidly at rates plates and accommodates most of the plate convergence
experiences a period of stress
adjustment following coseismic
of ≥14 cm per year for a period of 20 million years20,23,24 (Fig. 2b). The MHT is the largest (~2,400 km long) and
slip (post-seismic relaxation, (Fig. 1a). Shortly after collision, buoyancy of the Indian one of the fastest slipping (~17–21 mm per year) conti-
weeks to months). continental margin slowed convergence to ~4–5 cm per nental megathrusts on Earth41, and, thus, represents the
year, a rate that has persisted since that time19,23–27 (Fig. 1b). primary seismic hazard in the Himalaya.
Surface denudation
The India–Eurasia collision has resulted in a com-
Loss of landscape mass leading
to a reduction in elevation and plex wedge, with the accretion from north to south of Deep geophysical signatures. Although much of the tec-
relief of a landscape, driven three tectonic domains defined by a combination tonic history in an orogen is either eroded or buried to
by erosion and chemical of stratigraphy, faults and topography16 — the High substantial depth, subsurface tectonic information can
weathering. Himalaya, the Lesser Himalaya and the Sub-Himalaya be discovered through geophysical imaging techniques.
(Fig. 2). The High Himalaya represents the high, rug- Imaging the subsurface geometry of a fault is easier if
Footwall
The body of rock below ged part of the range. Its northern boundary is roughly there is either an extensive damage zone or a marked
a non-vertical fault. marked by the North Himalayan Normal Fault28, also contrast in physical properties between the footwall and
www.nature.com/natrevearthenviron
0123456789();: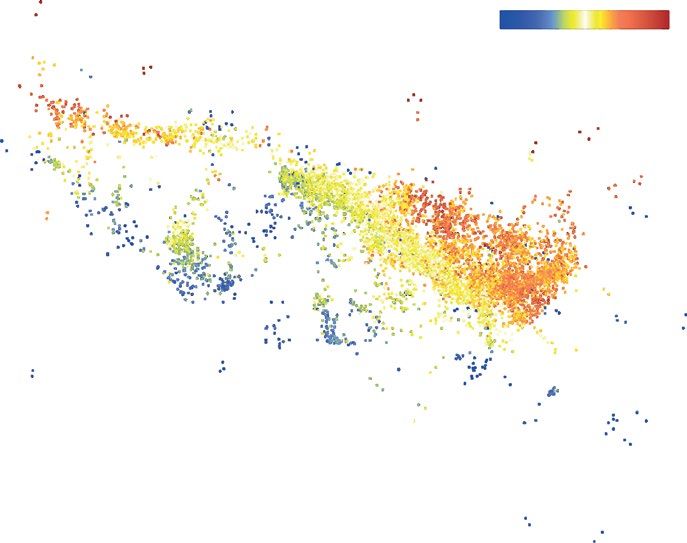
Reviews
a b
0 1,000 2,000
km
. New Delhi
. T
.
Kabul
T
. Kathmandu
Islamabad
. Dhaka
~4–5 cm per year
0 Ma
T
. Thimphu
. Lhasa
~14–16 cm per year ~ 70–50 Ma
Main Frontal Thrust (MFT) Indus–Yarlung suture zone (IYSZ) T Marked increase in surface topography
Fig. 1 | Long-term convergence and collision of india with Eurasia and geometry of the subducting plate.
a | The northward drift of India and its collision with Eurasia over the last ~70 million years. b | Present-day geometry of the
subducting Indian Plate that differs beneath the Himalayan arc (underthrusting) and the surrounding orogens (subduction),
as inferred from geophysical explorations. Red lines indicate the frontal thrust faults (the Main Frontal Thrust is shown by
the thicker line) and ‘T’ symbols locate the marked increase in surface topography (>1 km). Panel a adapted with permission
from ref.17, Elsevier.
the hanging wall. In ocean–continent subduction zones, by about 3% aqueous fluid porosity48. Fluids likely orig-
for example, the large contrasts between the wedge sedi- inate, in part, from metamorphic dehydration reactions
ments, the downgoing oceanic crust and the forearc man- of underthrust Indian sediments and basement, and
tle facilitate geophysical imaging. This imaging is further then percolate upward through the deformed brit-
aided by the heterogeneous effects of fluids42. However, tle media, accumulating within or below the possibly
in the Himalayan continent–continent setting, the mega impermeable MHT shear zone at ~20 km depth, near the
thrust (the MHT) is located within recently underthrust ramp–flat transition48. Notably, the presence of fluids at
sediments, making imaging more difficult. Furthermore, the MHT has been documented by broadband seismol-
the temporal and spatial migration of the MHT within ogy exploiting converted waves, an approach sensitive
this sedimentary stack has built a complex orogenic to sharp velocity variations across sub-horizontal inter-
wedge through duplexing and material transfer across the faces. Fluids at the MHT reduce shear-wave velocities, so
fault zone43,44. Therefore, neither a primary nor an omni- that the megathrust appears as a low-velocity zone49–55,
present contrast of physical properties is expected across with variable depth (ca. 10–18 km)52. Converted seis-
the MHT, which can, thus, be imaged only indirectly or mic waves also allow the interpretation of locally ani-
by high-resolution active seismic methods. sotropic rock structure, which is coherent with the
Multichannel seismic reflection acquired as part of top-to-the-south thrusting of the MHT56.
the Sino-American INDEPTH survey in the Yadong- The depth range of the MHT also hosts microseismic
Gulu rift successfully imaged the MHT45,46 (Fig. 2). The activity in both the interseismic and post-seismic peri-
INDEPTH survey results showed a band of reflections, ods, likely related to fluids and stress accumulation57,58.
aligned linearly with a northward dip of ~12°, corre- The interseismic period includes microseismic swarms59.
sponding to the MHT mid-crustal ramp beneath and These transient events can be observed to migrate
north of the High Himalaya45,46. Owing to difficulties at 35–50 m per day and could be related to either
in obtaining permits and access to carry out extensive fluid migration or geodetically unresolved slow slip
surveys, this survey remains the best high-resolution, events60. Structurally, some active clusters in both the
active-source geophysical data illuminating the deep interseismic60 and post-seismic61–63 periods can be inter-
crustal structure. Further mapping can be done by indi- preted as individual splays or ramp faults at mid-crustal
rect geophysical methods, such as various seismological depths. Dense monitoring over large regions could help
and electromagnetic experiments, which are feasible, as track and understand fluid migration patterns, with
the MHT hosts microseismic activity and fluids that can possible implications for how strain accumulates and is
be observed with passive geophysical surveys. released through different parts of the seismic cycle.
Fluids in particular provide a mechanism for observ-
ing and interpreting the structure and state of rocks at Shallow morphotectonic signatures. The geomor-
depth, and evidence for the presence of fluids in the phology and drainage patterns above active faults and
Himalaya has been locally documented at the surface by related growing folds provide insight into the ongoing
Hanging wall
fluid inclusions in minerals47. Magnetotelluric sounding tectonics. River incision, waterfalls, flights of abandoned
The body of rock above in Nepal has revealed an electrically highly conductive fluvial terraces, palaeo-lake formation and/or abandon-
a non-vertical fault. zone south of the High Himalaya that can be explained ment, and angular unconformities are all indicative of
Nature Reviews | Earth & Environment
0123456789();: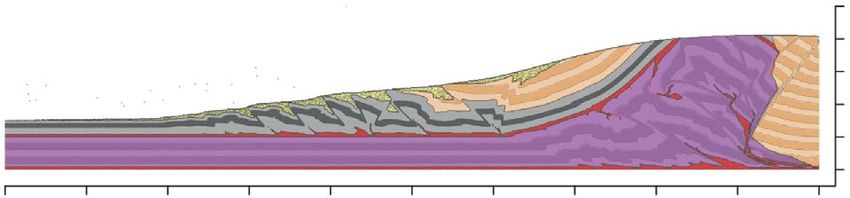
Reviews

          tectonic deformation64–70. These geomorphic markers                      and post-seismic phases) (Fig. 3). Combining these
          can be used to determine tectonic uplift and shortening                  techniques with seismological and geological methods
          in the Sub-Himalaya and the evolution of the landscape                   can illuminate where faults accumulate elastic strain,
          over timescales of thousands of years64,65,69.                           and the partitioning between seismic and aseismic
              Abandoned terraces that sit above the rivers drain-                  slip in time and space. In this section, we discuss how
          ing the Sub-Himalaya record uplift along the MFT64.                      these tools have provided new insights into monitoring
          Although this fault is discontinuous along the length of                 crustal deformation and earthquake-related processes
          the Himalaya, profiles typically reveal a frontal anticline              in the Himalaya, including advantages and limitations.
          that has risen steadily during the Holocene. For example,                We then discuss historical major (Mw ~7–8) and great
          in central Nepal, the uplift rate has been measured at                   (Mw 8+) Himalayan earthquakes, with a special focus
          a maximum of ~11 mm per year64. By interpreting the                      on the 2015 Mw 7.8 Gorkha earthquake, which is the
          geometry of the subsurface fault and basal décollement,                  most recent and best instrumented major seismic event
          terrace-based uplift profiles can be used to infer short-                in the region.
          ening rates. This approach yields a long-term slip rate on
          the MFT of ~21 ± 1.5 mm per year at the Bagmati River                    Interseismic shortening. Interseismic deformation across
          in central Nepal64.                                                      the Himalaya has been documented by the Global
                                                                                   Navigation Satellite System (GNSS), enabling the com-
          Short-term deformation                                                   munity to assess surface motion and extrapolate secu-
          Over the past three decades, satellite geodesy has rev-                  lar velocities71–75. Early studies based on limited Global
          olutionized our view of crustal deformation between,                     Positioning System (GPS) data defined a clockwise rota-
          during and after earthquakes (interseismic, coseismic                    tion of the Indian Plate relative to Asia, with ~44 mm

          a                                                      Longitude
               75° E                    80° E                           85° E                         90° E

                                                        Sub-Himalaya and Lesser Himalaya sequence
                                                                                  Tethys sediments
                                                                      Greater Himalayan sequence
                                     Ka

                                                                                        Ophiolites
                                       rak
                                           o
                                          ram
                                               fau

                                                                                                                                          32° N
                                                lt

                                                                       Tibetan Plateau

                                                                                                                                                  Latitude
                                                                                                                                          30° N
                                                                                                INDEPTH            Lhasa
                          Delhi
                                                                             A’
                 Main Frontal Thrust                          Kathmandu                                                                   28° N
                                                                                    Everest
                     Main Central Thrust
                   South Tibetan Detachment                           A
                                                                  India
                                                                                                               0           200    400
                                                                                                                           km
          b     Main Boundary Thrust                 Gorkha-Pokhara             Main Central Thrust
              Main Frontal Thrust                      Anticlinorium

                                                                                                                     Siwaliks (Sub-Himalaya),
                                                                                                                     Middle Miocene–Pleistocene
                                                                                                                     Lesser Himalaya,
                                                                                                                     Mesoproterozoic and
          A                                                                                                          Permian–Cretaceous
                                                                                                  A’                 Greater Himalaya and Tethys
                                                                                                                     sediments, Proterozoic–Eocene

          0       20        40
                  km

          Fig. 2 | Geological map and 3D cross section of the himalaya. a | Simplified geological map of the Himalayan arc showing
          the major structural units and major faults. Black dashed lines indicate the location of the cross section (panel b; labelled
          A–A’) and the INDEPTH seismic reflection line. b | Simplified 3D cross section of the Himalaya showing the surface geology,
          the geometry of the Main Himalayan Thrust and the tectonic units at depth. Panel a adapted with permission from ref.207,
          Geological Society of America. Panel b adapted from ref.118, CC BY 4.0 (https://creativecommons.org/licenses/by/4.0/).

                                                                                                              www.nature.com/natrevearthenviron

                                                0123456789();: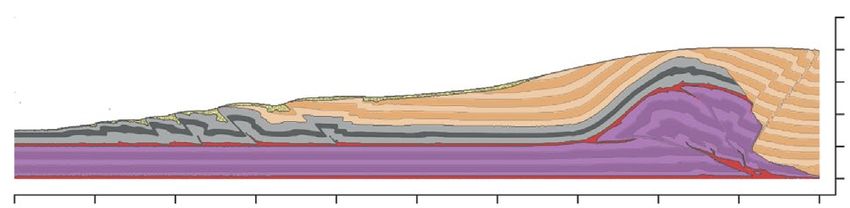
Reviews
a Fig. 3 | Plate convergence velocity field and
8,000
Elevation (m)
36° N characteristics of the 2015 mw 7.8 Gorkha earthquake.
6,000
a | Global Positioning System (GPS) velocities showing
4,000
20
Tibetan Plateau Himalayan convergence. Black vectors indicate GPS
05
2,000
velocities spanning the 1990s to 2015 in an India-fixed
15
33° N 0
1 reference frame208,209. White transparent patches show the
55
19
2 05 approximate location and size of major and great historical
3 earthquakes on the Main Himalayan Thrus1,210. White circles
4 18
30° N 5 03 with light blue outline locate palaeoseismological sites
6 Lhasa along the Himalayan front2,70 (1, Muzaffarabad; 2, Hajipur;
7 8 150
910 5 1833 0
2015 195
3, Bhatpur; 4, Chandigarh; 5, Kala Amb; 6, Rampur Ganda; 7,
11 12 Dehra Dun; 8, Lal Dhang; 9, Ramnagar; 10, Chor Ghalia; 11,
Delhi India 13 1934
27° N 14 1714 Mohan River; 12, Botechaur; 13, Suketal; 14, Koilabas; 15,
20 mm per year 1516 b
17 26 28 2930 Bandel Pokhari; 16, Tribeni; 17, Bagmati; 18, Mahra Khola;
18 21
0 200 400 km 1920 22232425 1897 27 19, Bardibas; 20, Charnath; 21, Damak; 22, Hokse; 23,
75° E 80° E 85° E 90° E 95° E Tokla; 24, Singimuni; 25, Chalsa; 26, Sarpang; 27, Nameri;
b 28, Harmutti; 29, Marang; 30, Pasighat). b | White-to-blue
29° N colour map indicates the coseismic slip distribution188 on
the Main Himalayan Thrust from the 2015 Mw 7.8 Gorkha
Tibetan Plateau earthquake. Stars denote epicentres of the main shock
(Mw 7.8) and the largest (Mw 7.3) aftershock, and the
corresponding purple and light blue focal mechanisms
25 April Mw 7.8
are the centroid moment tensor solutions, respectively211.
12 May Mw 7.3 Circles indicate aftershock locations, magnitude and
depth111. Black contour lines indicate the coseismic
–0.6 displacement field ALOS-2 satellite (positive towards
satellite)113. Blue-to-red coloured circles indicate measured
–0.2 –0.4 –0.2
28° N vertical GPS coseismic displacements and black arrows
–0.4 Everest
indicate horizontal displacements115. Small black
circles indicate the location of the pre-Gorkha background
0.8 1.0
Kathmandu 0.6 seismicity71.
0.2 0.4
Main
Fron
ta and anelastic deformation is central to seismotecton-
l Thr
ust ics, as it ultimately determines the seismic potential of
Aftershock depth (km)
GPS vertical disp. (m)
22 0.8 6 the MHT and is critical for interpreting the larger-scale
Coseismic slip (m)
20 0.6 5
0.4 evolution81,82. Typically, interseismic deformation is
27° N 18 0.2 4
1m
16 0.0 3 interpreted through the lens of interseismic coupling,
14 −0.2 2 which is defined as the ratio of the slip rate deficit in
M 4+ M 5+ M 6+ −0.4
12 −0.6 1 the interseismic period to the far-field tectonic shorten-
0 km 100 10 −0.8 0 ing rate83. The interseismic coupling ratio varies from 0
(for a basal fault that slips aseismically at a rate equal
84° E 85° E 86° E 87° E
to the plate convergence rate) to 1 (for a fully locked
fault). Faults with high coupling values have a high slip
per year of convergence at the longitude of Pakistan rate deficit and will eventually slip to release accumu-
and 65 mm per year of convergence at the longitude lated strain81. As such, interseismic coupling maps can
of Bangladesh73. More recently, with longer time series provide information about both fault segmentation and
and a broader network, the convergence rate between earthquake potential.
India and Asia has been refined to ~38 mm per year Interseismic coupling maps of the Himalaya
(refs76,77). As half of the convergence is distributed across show that the MHT is largely coupled along its com-
Tibet, the convergence across the Himalaya is reduced plete length, over a width that varies between 80 and
to about ~14–19 mm per year78. During the interseis- 120 km perpendicular to the arc71,79,84–88. The width of
mic period, this shortening is accommodated as elastic the locked-to-creeping transition depends partly on
strain around the base of the MHT, with GPS velocities temperature, which affects the fault rheology81. As the
relative to northern India rising from ~0 mm per year primary control on temperature is depth, the width of
at sites along the MFT, to ~3 mm per year around the the locked-to-creeping transition, therefore, provides
Himalayan piedmont, to ~13–17 mm per year north of insights into the local dip of the MHT89. The line sepa-
the High Himalaya71,79. rating the deep creeping part of the fault from the updip
Extending the (relatively accessible) observations of coupled region coincides roughly with both the northern
interseismic deformation to other parts of the seismic edge of microseismicity and the 3,500-m topographic
cycle is a challenge. Traditional elastic models assume elevation contour84,90. However, some recent studies
that interseismic shortening is the mirror image of have suggested that the coupling is heterogeneous. For
coseismic deformation80, but this method does not example, a probabilistic estimate derived from a fully
allow for any net (anelastic) deformation over multiple Bayesian approach identified four large coupled patches
earthquake cycles80. The partitioning between elastic separated by three regions of low coupling84. In addition,
Nature Reviews | Earth & Environment
0123456789();: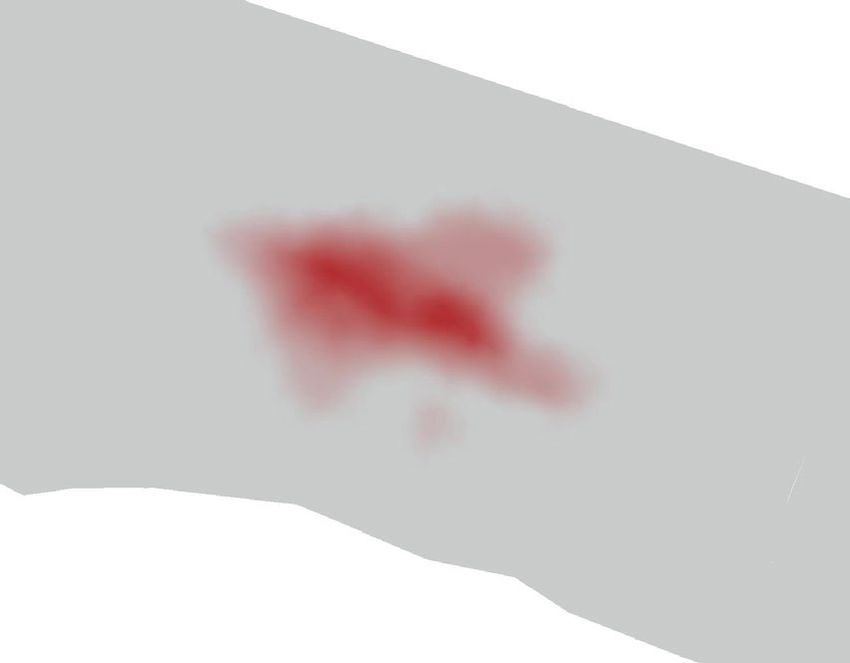
Reviews

          a detailed GPS velocity solution over Bhutan highlighted       1255 AD Kathmandu earthquake, which killed ~30%
          local variations in coupling, with a narrower coupled          of the population of Kathmandu Valley, including King
          segment in eastern Bhutan and a partially unlocked             Abhaya Malla, and was, therefore, recorded in historical
          deeper crustal ramp88. Although coupling in some parts         chronicles99,100. Another violent earthquake in 1344 AD
          of the Himalaya remains poorly constrained because of          in Nepal was associated with a rupture further west
          gaps in GPS observations, local levelling surveys from         between the longitudes of Kathmandu and Pokhara101.
          the Dehra Dun segment91 (~78° E) suggest that there is             In western Nepal, the last known great earthquake
          no aseismic creep close to the MFT89. This indicates that      was the devastating event in 1505 AD (Fig. 3a), sometimes
          slip on the MFT must occur during another part of the          inferred to be as large as Mw 8.7–8.9 (ref.1). A palaeoseis-
          seismic cycle, possibly as a combination of coseismic and      mic trench in westernmost Nepal suggests that the 1505
          post-seismic slip, and earthquakes on the MFT likely           earthquake produced ~7.5 m of vertical offset101,102. The
          reach close to or breach the surface.                          intervening 500 years have resulted in the accumulation
                                                                         of >10 m of slip deficit along this segment of the MHT,
          Major and great Himalayan earthquakes. There is only           making this one of the most likely sites for the next great
          a limited number of past great earthquakes, and their          earthquake103. However, a study of earthquake-triggered
          along-strike extent has uncertainties. Therefore, and          turbidites from Rara Lake (western Nepal) reported eight
          inherently, indicators of seismotectonic segmentation          major-to-great earthquakes during the last 800 years,
          could be alterable in the wake of potential future great       three of which seem to overlap in age with previously
          earthquakes, whose along-strike extent is not known.           reported Mw > 7 events in the region104.
          Longer ruptures are possible, and scenarios with a                 Since the late nineteenth century, three Mw 8+ instru-
          larger number of casualties, given enough time, are            mental earthquakes have occurred in the Himalayan
          likely, though undesirable. Therefore, it is important to      region: the 1897 Mw 8.2–8.3 Assam–Shillong Plateau
          continue to build our understanding of the distribution        earthquake105,106, the 1934 Mw 8.4 Bihar–Nepal earth-
          and characteristics of past major earthquakes to help          quake and the 1950 Mw ~8.5–8.7 Assam earthquake103,107
          inform us of the stress distribution in the crust and,         (Fig. 3a) . In addition to the 2005 Mw 7.6 Kashmir
          consequently, future seismic hazard assessments.               earthquake93, a number of recent earthquakes have also
              The MFT and other faults within the Siwaliks have a        been quite destructive, including the 1905 Mw ~7.8
          clear surface expression. Nevertheless, for many years,        Kangra earthquake108 and the most recent 2015 Mw 7.8
          a lack of observed earthquake-related surface ruptures         Gorkha earthquake109,110.
          led to the hypothesis that major Himalayan earthquakes
          are blind92. The 2005 Mw 7.6 Kashmir earthquake, which         The 2015 Mw 7.8 Gorkha earthquake. The most recent
          killed more than 70,000 people, demonstrated that this         major earthquake in the Himalaya occurred on April
          was not always the case (Fig. 3a). The surface rupture         25, 2015, when a Mw 7.8 earthquake struck central
          in this event extended over more than ~75 km, with a           Nepal109,110. This event was followed by a series of Mw > 6
          mean coseismic slip of 4 m (ref.93). However, this earth-      aftershocks61,111,112 and triggered a Mw 7.3 event to
          quake cannot be viewed as typical for the Himalaya,            the east 17 days later113,114 (Fig. 3b). The Gorkha event
          as it occurred in the core of the tectonically complex         is the most recent major earthquake in the Himalaya
          north-western corner of the arc (Fig. 3a).                     and the best instrumented in the region. The earthquake
              Since the Kashmir earthquake and the discovery             caused devastation in the Gorkha region; however, the
          that Himalayan great earthquakes can rupture surface           data from this event offer a unique opportunity to inves-
          faults94, the MFT has been the locus of numerous pal-          tigate how coseismic and post-seismic deformation
          aeoseismic studies (Fig. 3a). These studies provide con-       relate to tectonic structures in the Himalaya, and can
          straints on timing (typically based on radiocarbon dates       help inform future earthquake hazard assessment.
          of detrital charcoals, usually correlated to historically          The datasets provided by the 2015 Mw 7.8 Gorkha
          documented ground shaking), as well as measurements            earthquake offer a window into seismic rupture pro-
          of local scarps, offset layers and uplifted river terraces.    cesses and large-scale crustal deformation at unprec-
          However, palaeoseismic observations might overesti-            edented spatial and temporal resolution. Notably, the
          mate coseismic slip, as they cannot distinguish between        Gorkha earthquake is the first example of a large con-
          coseismic and post-seismic slip accumulations, or, alter-      tinental megathrust rupture beneath a high-rate (5-Hz)
          natively, could underestimate coseismic slip, if the slip is   GPS network110 (Fig. 3b). Through the combined use
          distributed across multiple faults. Correlations between       of GPS and satellite (Interferometric Synthetic Aperture
          multiple palaeoseismic trench data can help assess the         Radar, InSAR) data, it is possible to characterize the
          lateral extent of ruptures1,2, but for older events where      rupture process as a ~20-km-wide slip pulse lasting
          dating uncertainties are large, miscorrelations could          ~6 s, with peak sliding velocity of 1.1 m s−1. The records
          wrongly interpret multiple smaller events as a great           indicate an eastward propagation at ~3.3 km s−1 over
          earthquake or vice versa95.                                    a ~140-km distance110. The smooth onset of the slip
              Palaeoseismic data from east central Nepal suggest         pulse excited a resonance of the Kathmandu basin with
          that a historically undocumented Mw 8+ earthquake              a period of 4–5 s, causing collapse of some tall struc-
          in ~1100 AD produced surface slip of 17+5/−3 m and             tures, including cultural artefacts, but leaving smaller
          ~8 m of vertical throw, with slip extending for more           buildings generally intact110. Geodetic measurements
          than 240 km laterally96–98. However, other studies have        and satellite data constrain surface motions during the
          associated the surface ruptures in the area with the           earthquake109,113,115–117, revealing uplift of about 1.5 m in

                                                                                               www.nature.com/natrevearthenviron

                                            0123456789();: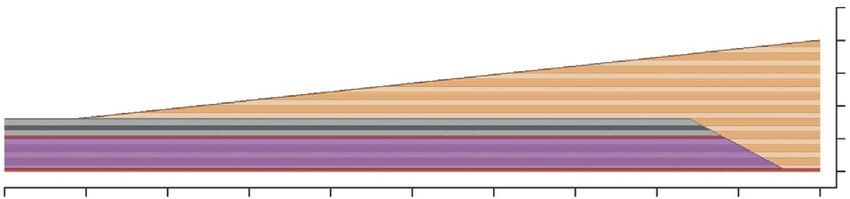
Reviews

                                 the Kathmandu basin113, with subsidence of the High             This ramp is one of most prominent structural features
                                 Himalaya further north by about 0.6 m (ref.117) (Fig. 3b).      linked to both long-term tectonic and short-term seis-
                                     The main shock and the first months of aftershock           mic processes, although its position has stepped for-
                                 activity provided an outstanding opportunity to docu-           ward (southward) several times over the last 15 Ma, in a
                                 ment the relations between the MHT, regional tectonic           process described variously as duplexing, accretion and
                                 structures and seismicity54,61,117–119. Furthermore, six        tectonic underplating (Fig. 4). This, together with frontal
                                 weeks after the earthquake, a dense seismic network             accretion through break forward of the MFT (and, prior
                                 (called NAMASTE, standing for Nepal Array Measuring             to that, of the MBT and MCT), has been the dominant
                                 Aftershock Seismicity Trailing Earthquake 120) was              process contributing to volume growth of the Himalayan
                                 deployed in central Nepal. In approximately 11 months,          wedge since the Middle Miocene43,127. Furthermore,
                                 this seismic network identified >8,000 earthquakes,             physics-based numerical models128, analogue models129
                                 helping to further decipher the relationship between the        and geologically informed structural cross sections118
                                 aftershocks and tectonic structures at depth 63, and            indicate that the flat–ramp–flat geometry of the MHT
                                 the lateral variations in both62,112. Overall, these data are   causes long-term topographic growth localized above
                                 best explained by a gently dipping fault at depths between      the ramp43,122,130 (Fig. 4a,b).
                                 10 and 15 km and continuing downdip on the steeper                  At shorter timescales, major and great earthquakes
                                 mid-crustal ramp54,117,118. The presence of this ramp has       rupture part or all of the megathrust and incrementally
                                 important implications for both the Himalayan seismic           contribute to the evolution of the topography117. These
                                 cycle121 and long-term construction of the Himalaya117,122.     episodic ruptures, which last a few tens to hundreds
                                     GPS records of surface motions in the months imme-          of seconds, are followed by a post-seismic adjustment
                                 diately following the earthquake showed that >70 mm             period (for example, afterslip and viscoelastic relaxa-
                                 of afterslip occurred locally, north of the rupture123,124.     tion)81 with accelerated creep rates and increased seismic
                                 However, the MHT south of the rupture patch has                 hazard. This creep decays over the course of weeks to
                                 remained coupled123,124, indicating that substantial elas-      months to years back to interseismic conditions, during
                                 tic strain must be present at the updip limit of the 2015       which stress builds up at the border between the locked
                                 rupture. Given that the Gorkha earthquake occurred              and stably creeping (aseismic) parts of the MHT (Fig. 4c).
                                 in the same location as a similar-magnitude earth-              During these interseismic periods, micro to moderate
                                 quake in 1833, these observations suggest that major            earthquakes (Mw < 6) record the accumulation of stress
                                 blind earthquakes can re-rupture fault patches, whereas         around the transition zone126. Seismological networks
                                 great earthquakes might propagate to the surface, driven        record thousands of these events every year along the
                                 by residual strain accumulated over centuries89,121,125.        Himalayan range (Fig. 4d), occurring mostly in a broad
                                 Further advances in understanding the seismic behav-            cloud at mid-crustal depths below the front of the high
                                 iour of the MHT will come from combining the exist-             topography126, with some events extending into the deep
                                 ing and rapidly increasing streams of seismic, geodetic         crustal root and the upper mantle131,132. In some regions,
                                 and geologic data with new constraints from inevitable          this seismicity can be resolved as clusters localized along
                                 future earthquakes.                                             and above the MHT décollement, along the mid-crustal
                                                                                                 ramp or at contacts between Lesser Himalayan duplexed
                                 Transient versus permanent deformation                          rocks60, demonstrating that seismicity is at least partially
                                 The rise of Himalayan topography involves long-term             controlled by structural heterogeneities (Fig. 4d). An
                                 crustal shortening and uplift. In addition, earthquake-         increase in event frequency during the winter months
                                 related processes, which are generally transient                demonstrates that broad stress changes associated with
                                 phenomena, can also contribute to the building of               the Indian monsoon are able to modify the stress state
                                 topography via inelastic strain accumulation. However,          below the Himalaya133. Temporal patterns like this
                                 the spatiotemporal relationship between permanent and           can provide an opportunity to constrain the absolute
                                 transient deformation is still poorly constrained. In this      stress state.
                                 section, we reconcile observations from both long-term              The interseismic microseismicity is a response to the
                                 and short-term deformation processes to synthesize              strain accumulating in the crust, as ~14–19 mm per year
                                 the current understanding of how the MHT operates               of viscous creep on the deepest part of the fault decreases
                                 in space and time, and discuss the processes by which           to zero slip on the coupled part of the fault across a
                                 mountains grow.                                                 20–25-km large transition zone71,78,84,88,134 (Fig. 4c). During
Blind earthquakes
                                                                                                 the interseismic period, this process is accommodated
Earthquakes where fault slip     Role of the mid-crustal ramp. The presence of a                 by elastic shortening of the crust and results in peak
does not reach the Earth’s       mid-crustal ramp connecting the flat décollement                uplift of 7–8 mm per year (refs71,122,130,134). The downdip
surface and, hence, do not       under the Lesser Himalaya with the deeper décolle-              limit of the locked fault falls in the vicinity of the 350 °C
produce a fault scarp.
                                 ment under the High Himalaya has been supported by              isotherm71,127, a temperature that controls the transition
Accretion                        results from structural geology118, microseismicity126,         to stable sliding in quartzo-feldspathic rocks135,136, and is
Process by which material from   seismic reflection46, magnetotelluric sounding48, geo-          also spatially correlated with the base of the mid-crustal
the lower (subducting) plate     detic data 73,122 and uplift rates 65. Slip on this ramp        ramp134, suggesting that the ramp development is likely
is removed and added to          (and previous manifestations of the ramp) has led to            partly thermally controlled.
the upper plate by tectonic
processes, such as imbricate
                                 the development a large anticlinorium that forms the                The mid-crustal ramp affects not just the interseis-
thrusting and/or folding         backbone of the Himalaya (in Nepal, this is called              mic period but also coseismic rupture segmentation and
and thrusting.                   the Gorkha-Pokhara Anticlinorium, or GPA; Fig. 2).              rupture characteristics. Several observations suggest that

Nature Reviews | Earth & Environment

                                                                 0123456789();:
Reviews
the width of the locked–creeping transition could be an fault138, suggesting that the fault geometry affected the
important determinant for the nucleation of major and rupture propagation and energy frequencies116,118, pos-
great Himalayan earthquakes89. Where the downdip sibly associated with a damage zone produced by the
width of the transition is narrow (~20–25 km), major fault bend117,122.
earthquakes are observed to occur at intervals of a few Line-of-sight displacement of the Mw 7.3 Gorkha
hundred years. Conversely, where the transition zone aftershock indicates a similar but more compact pattern
is wider, great earthquakes occur at long time inter- compared with the displacement from the main shock113.
vals (millennia)89. Also, seismic analyses following the The displacement occurred near the eastern edge of the
Gorkha main shock reveal that several patches slipped main rupture, suggesting that it might have been trig-
sequentially109,116,137, with the downdip slip region charac- gered by a Coulomb stress concentration from the main
terized by a larger ratio of high-frequency (0.03–0.2-Hz) shock110. Thousands of aftershocks were generated at the
to low-frequency energy compared with shallower periphery of these two ruptures, mainly in the hanging
areas138. This high-frequency energy radiation might be wall of the MHT61,111,112,120, with seismic clusters and
associated with heterogeneous prestress139 or might be associated focal mechanisms revealing the steeper ramps
related to the transition from the more steeply dipping bordering the main shock slip patch140. It appears that
mid-crustal ramp onto a more gently dipping, smoother, seismic and geodetic activity across the earthquake cycle
stratigraphically bounded décollement118 (Fig. 4b). The is affected by the long-term geological structure. This
updip slip patch exhibited relatively continuous rup- could be useful for hazard assessment, as geological map-
ture, whereas the downdip rupture cascaded along the ping and observations during the interseismic period can
a Air (Meta-)sediments Décollement(s) c
Cover Basement rocks Coupling Vertical uplift (mm per year) Denudation rate (mm per year)
Intermediate décollement 0
Denudation rate (mm per year)
Vertical uplift (mm per year)
Basal décollement 10
Depth (km)
1 10
Δs = 0.0 km 20
30 0.8 8
Coupling
40 0.6 6
50 0.4 4
0 25 50 75 100 125 150 175 200 225 250 0.2 2
Duplex 0
0 0
Depth (km)
10
0 20 40 60 80 100 120 140 160
Δs = 79 km 20
Distance from the Main Frontal Thrust (km)
30
40
50 d
Seismicity
0 25 50 75 100 125 150 175 200 225 250 height above fault (km)
0 –20 0 20
Mid-crustal ramp(s)
Depth (km)
10
Δs = 159 km 20
30 30 km
40 28° N
50
0 25 50 75 100 125 150 175 200 225 250
Distance (km)
b MCT Kathmandu
MFT MBT 20 km
0
Depth (km)
Main Himalayan Thrust 10 10 km
MFT
20 Gorkha slip (m)
0 20 40 0 6 5 km 27° N
km 50 km
30
Siwaliks (Sub-Himalaya) (5 km) Lesser Himalaya (12 km) 85° E 86° E
Middle Miocene–Pleistocene Palaeo-Mesoproterozoic
Greater Himalaya (8 km) and Permian–Cretaceous
Neoproterozoic–Ordovician
Fig. 4 | Crustal-scale duplexing and seismic behaviour of the mid-crustal levelling measurements130 (orange circles) and synthetic data121 (solid
ramp. a | Three temporal snapshots from a sandbox-like physics-based orange line), and long-term denudation rate65 (solid blue line). d | Map
numerical model, showing how the presence of two décollement levels and view of the Main Himalayan Thrust in central and eastern Nepal118, and
the coupling between deformation and erosion determine the occurrence aftershocks (between latest June 2015 and mid-May 2016) following the
of underplating, crustal-scale duplexing and antiformal stacking 128. 2015 Mw 7.8 Gorkha earthquake63. Contours show depth to thrust surface.
b | A new balanced cross section of the present-day central Nepal Himalaya Red area shows slip amounts during the Gorkha earthquake. Coloured dots
based on constraints from surface geology and the 2015 Gorkha indicate the location of aftershocks relative to the depth of the Main
earthquake118, showing the duplex structure and the geometry of main Himalayan Thrust. Panel a adapted with permission from ref.128, Wiley
faults at depth. MBT, Main Boundary Thrust; MCT, Main Central Thrust; MFT, ©2020. American Geophysical Union. All Rights Reserved. Panel b adapted
Main Frontal Thrust. c | Comparison between interseismic coupling84 with permission from ref.118, CC BY 4.0 (https://creativecommons.org/
(solid red line with uncertainties in grey), interseismic uplift rate from licenses/by/4.0/).
www.nature.com/natrevearthenviron
0123456789();:Reviews
be tested against each other, and, together, they can pro- Nepal Fault System, the Dhubri–Chungthang fault zone
vide a basis for forecasts of future earthquake locations, and the Kopili fault zone (Fig. 5a). The Western Nepal
limits and rupture characteristics60–63,118 (Fig. 4d). Fault System cuts across the Himalaya at 82–83.5° E
and is proposed to accommodate strain partitioning149,
Along-strike and downdip segmentation. Based on the but shows no particular instrumental seismicity. The
along-strike continuity of the main geological units, Dhubri–Chungthang fault zone has been identified by
the Himalaya are often considered cylindrical32,141 and an alignment of mid-crustal to lower-crustal earth-
tectonic models for orogenic growth have largely focused quakes; this is likely a primary basement structure that
on cross-orogen sections. Nevertheless, notable along- allows dextral motion between the north-west cor-
strike variations in both the downgoing Indian Plate and ner of the Shillong Plateau and north-west Sikkim150.
the respective upper plate have been reliably documented West of the Dhubri–Chungthang fault zone, seismicity
(Fig. 1b). Furthermore, lateral variations in the subduct- in the Himalaya is dominantly thrust sense, whereas the
ing slab must affect the flexural geometry and tectonic foreland is largely aseismic. However, to the east, there
stresses across the lithosphere, and should be taken into is marked strike-slip activity with clear seismicity in the
account in tectonic models of orogenic growth. foreland (Fig. 5b). The Kopili fault zone, on the eastern
The topography is one of the clearest indicators edge of the Shillong Plateau and extending beneath the
of along-strike variation, pointing to a prominent eastern Bhutan Himalaya, exhibits a broadly linear dis-
boundary at about 90° E; this location coincides with a tribution of earthquakes151. Ongoing dextral deforma-
change in the curvature of the arc142. This boundary is tion within both the Dhubri–Chungthang fault zone and
also the confluence of the deeper and thicker Ganges the Kopili fault zone is compatible with surface defor-
foreland basin and the very shallow Brahmaputra fore- mation observed by GPS152,153. The Dhubri–Chungthang
land basin143 (Fig. 5). East of this boundary, the Shillong fault zone and the Kopili fault zone are thought to rep-
Plateau and Assam Valley, pinched between the eastern resent block boundaries, and the two resulting terrains
Himalaya and the Indo-Burma ranges, likely play a key rotate clockwise with respect to India152.
role in shaping the seismotectonics of the area144 (Fig. 1b), The deep structure of the incoming India Plate likely
as expressed by the active seismicity in the Brahmaputra also influences Himalayan segmentation, through
foreland (Fig. 5b). Cross-orogen topographic profiles inherited subsurface ridges. The Delhi–Haridwar,
further highlight the difference between the relatively Faizabad and Munger–Saharsa ridges (Fig. 5a) are broad
lower-lying foothills in Nepal (where the MFT lies basement highs that can be identified in the depth of
~10–30 km south of the MBT, so the frontal range is the sedimentary basin142,143 (Fig. 5a). These ridges have
made up of relatively young Siwalik sediments) and the been proposed to act as barriers to rupture propaga-
steeper front in Bhutan (where the MFT and the MBT tion during major Himalayan earthquakes154, as they
are tightly spaced, and the range is composed of the could alter the geometry and strength of the MHT as
much older and stronger Lesser Himalayan sequence)145. they subduct. The Faizabad ridge is not documented to
In addition, prominent >8,000-m peaks are located extend to the Himalayan front, but the two other ridges
mostly in the central Himalaya (Fig. 5a), as well as in the do seem to reach the front in the form of subsurface
western syntaxis, and are absent in both the eastern and faults155 (Fig. 5a). The Delhi–Haridwar ridge is localized
the western Himalaya. and aligns with the Mahendragarh–Dehradun fault,
Further evidence of potential segmentation can be which shows some seismicity (Fig. 5b). The Munger–
seen to the north, in southern Tibet, where a series of Saharsa ridge is bounded by a system of tear faults at
rifts accommodate east–west extension146. These rifts a high angle to the orogen155, the easternmost of which
span from a few to several hundred kilometres from (the Malda–Kishanganj fault) terminates the deeper part
north to south, and some reach the High Himalaya and of the Ganges foreland basin143,154 (Fig. 5a).
connect to prominent, deeply incised valleys dissecting Flexure of the entire Indian lithosphere exerts a
the orogen (Fig. 5a), such as the Kali Gandaki and the deeper control on Himalayan segmentation. As the plate
Sikkim half window. These valleys are apparent mark- bends beneath the orogen, its flexural geometry can be
ers of Himalayan segmentation at the surface, though it mapped by gravimetry156,157 and verified by numerical
remains unclear whether these are caused by downgoing modelling158 and structural seismology159. Gravity data,
Indian basement highs, by duplex formation or by the mostly along 2D orogen-perpendicular profiles160–163,
southward propagation of South Tibetan extensional filled in by targeted surveying of data gaps164,165, has
grabens (Fig. 5a). allowed the community to infer that plate rigidity is
A number of tectonic features inferred from sur- fairly homogeneous along the Nepal Himalaya164, but
face observations have been previously proposed to flexure occurs on a shorter wavelength in the Bhutan
cut across the orogen, referred to as “lineaments”147,148. Himalaya165. Gravity anomaly residuals with respect to
Many of these lineaments could not be identified or con- the average cross-orogen flexural profile (arc-parallel
firmed by later studies, and some even cross each other gravity anomalies, or APaGAs) reveal four main seg-
in a dynamically unsustainable way148. Nevertheless, ments along the Himalaya, with alternating signatures142
there are three north–south trending crustal fault sys- (Fig. 5a), the boundaries of which correlate with shal-
tems within the Himalaya that divide the orogen into lower structural features: the Mahendragarh–Dehradun
different tectonic segments from east to west. These fault fault, the Malda–Kishanganj fault and the Kopili fault
zones span considerable length and could play a role zone (Fig. 5a). Moreover, these three segment bounda-
in segmenting seismotectonic behaviour: the Western ries coincide with the lateral rupture extents of major
Nature Reviews | Earth & Environment
0123456789();:Reviews
a Long term
>8,000-m peaks
South Tibetan rift bounding faults
Tectonic faults (surface, subsurface)
4 km Gravity anomaly segment limit
32° 2 km Historical earthquake rupture limit
(clear, unclear; approx. relative widths)
Latitude MFT West Nepal fault system
0 km Tibetan Plateau
28° 8 km
Nepal Bhutan
Delhi–Haridwar 5 km
ridge
Faizabad ridge Kopili
Foreland basin depth (km) fault
Munger–Saharsa ridge Dhubri–Chungthang 200 km
0 2 4 6 8 fault zone
24°
72° 76° 80° 84° 88° 92° 96°
b Short term
Cumulative moment Coupling Mag.*
Contribution 1.0
M ≤ 7.0 MW 7 8
10 26 0.8 7
M ≤ 6.5
M ≤ 6.0 0.6 6
MW 6 1025 0.4 5
32°
0.2 4
10 24
3
MW 5 dyne cm 0.0
Latitude
28°
Kopili
Dhubri–Chungthang fault
fault zone
200 km
72° 76° 80° 84° 88° 92° 96°
Longitude
Fig. 5 | Segmentation indicators of the himalaya. a | Long-term indicators include tectonic faults, basement structures,
gravity anomaly segments and historical earthquake ruptures. Deforming orogenic area is shaded in pale yellow. Foreland
basin depth contours, inferred ridges and inferred faults from ref.143. Active surface and subsurface faults are shown in
light and dark blue, respectively. South Tibetan rift zones are shown as light red lines146. Large-scale structural segments
delineated by arc-parallel gravity anomaly residuals are in pink142. Rupture area limits of all Mw ≥ 7.5 earthquakes since
1500 AD are in orange142. Nepal and Bhutan’s borders are shown in black for reference. b | Short-term indicators include
seismicity and interseismic coupling. Cumulative seismic moment (NEIC catalogue from 1905 to May 2020) of selected
earthquakes, expressed as equivalent energy and earthquake magnitude, with bars shown at 100-km segments along
the Main Frontal Thrust (MFT). Magnitude selections (≤6.0, ≤6.5, ≤7.0) reflect realistic levels of catalogue completeness142.
Posterior mean coupling model obtained from Bayesian inversion of geodetic data84, accounting for data uncertainties
and 10% of prediction uncertainties. Earthquakes in the foreland (from the NEIC, as well as accessible temporary network
catalogues150,212) are shown as orange dots. The active frontal thrusts are shown in darker red, with the MFT shown as the
thicker red line.
and great Himalayan earthquakes142 (Fig. 5a), suggesting a possible additional segment boundary at the Faizabad
that these long-lived features could influence transient ridge84. A similar pattern emerges from the distribu-
seismic behaviour. tion of cumulative seismic moment of instrumental
These segment boundaries might also alter interseis- earthquakes in the Himalaya, with relative lows at these
mic behaviour. Bayesian modelling of interseismic cou- locations, including the Faizabad ridge142 (Fig. 5b). The
pling on the MHT points to similar segment boundary Faizabad ridge might, therefore, affect the segmenta-
locations as those identified from APaGAs (Fig. 5b), with tion of the MHT, but is apparently not related to plate
www.nature.com/natrevearthenviron
0123456789();:Reviews
flexure164 or APaGAs142. Other segment boundaries methods (mostly from 39Ar/40Ar ages of muscovite), com-
have likely developed during orogeny, such as ramps bined with structural geology, indicate that the Lesser
and related pinch points and tear faults, which might Himalaya has been exhumed at an average rate of 5 mm
arrest or affect rupture propagation, owing to variations per year182. These results suggest that, since the mid-
in fault stress, friction and fluids, like in the Gorkha Miocene, the Himalayan wedge has mainly grown by
earthquake61,118. These observations together suggest that overthrusting and tectonic underplating, rather than
it might be possible to better constrain future seismic by frontal accretion182.
hazard through the identification of long-lived tectonic Furthermore, cosmogenic 10Be concentrations in river
features, supported by interseismic observations. sediments were used to quantify catchment-scale den-
udation at the 100–1,000-year timescale179. Rock-uplift
Long-term topographic growth. The Himalaya are par- values derived from river-profile analysis65 are notably
ticularly striking because of the characteristic high and higher than the 10Be-based denudation rates179; however,
rugged topography, which includes ten of the world’s their spatial patterns are similar. These results indicate
14 highest peaks. This topography has evolved over the that the apparent correlation between denudation
~50-Myr collisional history of the range, with exten- and uplift rate is primarily controlled by tectonic pro-
sive tectonic shortening both within and across the cesses, whereas precipitation yields only a second-order
margins of the Tibetan Plateau166–169 (Fig. 1). Across the contribution179. Mapping fault geometries can provide
Himalaya, this shortening history can be reconstructed predictions for net topographic growth. Uplifted river
using geological cross sections, but, owing to erosion and terraces suggest that, over thousands of years, most or
an inability to quantify penetrative strain, the resulting all geodetically observed shortening reaches the sur-
estimates are minima, and have a wide range from 70 face on the MFT, with minor slip on out-of-sequence
to over 900 km (refs118,170–174). These variations are often thrusts64,68. As the same net slip is accommodated over
related to the study location, but are likely influenced by the full MHT, we expect higher long-term uplift rates
assumptions about the style of deformation. For exam- where the slope MHT dips more steeply118,182 (Fig. 6).
ple, some research groups tend to focus field efforts However, the downdip geometry of the basal MHT
within national borders, owing to permit requirements remains contested. Although based primarily on geologi-
and collaborative networks, and, therefore, structural cal reconstructions, most researchers agree that the orien-
style assumptions by different groups could be wrongly tation of the MHT varies downdip33,118,126,183–185. The base
interpreted as structural changes along strike. Plate cir- of the MHT mid-crustal ramp lies at ~15–30 km below
cuit reconstructions that incorporate palaeomagnetic sea level, flattens onto a shallowly dipping bed-parallel
constraints provide more complete estimates, and indi- décollement at ~10–15 km below sea level for ~100 km
cate between 900 and 1,500 km of shortening across the and rises to the surface on the more steeply dipping
Himalaya167,171. MFT, with additional, internal ramps linking different
Geochemical and fossil plant proxies suggest that the stratigraphic levels33,69,118. Variations in fault dip are likely
Himalaya reached ~2,300 m elevation by the beginning important for seismic processes, and, although some can
of the Miocene and at least ~5,500 m by ~15 Ma (ref.175). be constrained with imaging45,46,54,69,117,140,186, others are
Stable isotope palaeoaltimetry estimates based on oxy- likely below the resolution of imaging techniques.
gen in carbonate precipitated from surface water suggest Between the MFT and the High Himalaya, the
that the Himalaya were at elevations close to the present topography is likely more heavily dominated by inher-
day by the early Miocene176. Hydrogen isotope ratios ited topographic growth from past shortening (moder-
of hydrous minerals in the South Tibetan Detachment ated by erosional processes and lithology), rather than
shear zone record the meteoric water composition and modern fault slip. For instance, rocks in the hanging
indicate that the central Himalaya reached an elevation wall of the MBT (which is considered, at most, mini-
around ~4,500–6,000 m by the late Early Miocene177. mally active) form the low Mahabharat mountain range,
These proxies generally show that the collision began most likely owing to their stronger lithology compared
at ~50 Ma, whereas substantial topographic growth did with the much younger and softer Siwaliks sediments
not begin until ~20 million years later175–177. The more to the south65. Within the Siwaliks themselves, the more
intensive metamorphic and magmatic activity in the rugged topography is associated with exposures of the
Himalaya since 23 Ma corroborates this timing178. Lower Siwaliks, which have been more deeply buried
Neither the current topography nor the geodetically and consolidated, despite the fact that these often sit
inferred uplift rate is a record of the modern net uplift above older, less active thrusts to the north34.
rate. One reason for this discrepancy is attributed to Our synthesis indicates that observations of erosion,
erosion, a fundamental mechanism influencing mass or other records of tectonic growth over thousands of
redistribution at the surface7,8,179–181. The pattern of years, are likely a good source for constraints on the loca-
fluvial incision in central Nepal indicates values up to tions and orientations of active faults, as they integrate
10–15 mm per year in the Sub-Himalaya, dropping the cumulative contribution over multiple earthquake
to 0.5–1.5 mm per year across the Lesser Himalaya, then cycles, but are less affected by inherited topography.
rising again to 4–8 mm per year across the High Him
alaya65. The thermal and tectonic evolution of the crust Topography and the seismic cycle. Unlike erosion rates,
beneath the Himalayan range also influences the net which average across the seismic cycle, direct observa-
uplift rate, which evolves through time as faults break tions of uplift primarily capture specific windows dur-
forward17,127,182. Thermometric and thermochronological ing the interseismic, coseismic and post-seismic periods.
Nature Reviews | Earth & Environment
0123456789();:You can also read