Ecological and behavioral mechanisms of density-dependent habitat expansion in a recovering African ungulate population
←
→
Page content transcription
If your browser does not render page correctly, please read the page content below
Ecological Monographs, 0(0), 2021, e01476
© 2021 by the Ecological Society of America

 Ecological and behavioral mechanisms of density-dependent habitat
       expansion in a recovering African ungulate population
        JUSTINE A. BECKER   ,1,2,13 MATTHEW C. HUTCHINSON   ,1 ARJUN B. POTTER   ,1 SHINKYU PARK,3
JENNIFER A. GUYTON, KYLER ABERNATHY, VICTOR F. AMERICO, ANAGLEDIS DA CONCEICß AO,5 TYLER R. KARTZINEL,6,7
                    1                  4                  5

 LUCA KUZIEL,1 NAOMI E. LEONARD,3 ELI LORENZI,8 NUNO C. MARTINS,8 JOHAN PANSU    ,1,9,10 WILLIAM L. SCOTT,11
    MARIA K. STAHL,1 KAI R. TORRENS,1 MARC E. STALMANS,5 RYAN A. LONG,12 AND ROBERT M. PRINGLE       1,13

              1
                Department of Ecology and Evolutionary Biology, Princeton University, Princeton, New Jersey 08544 USA
                      2
                        Department of Zoology and Physiology, University of Wyoming, Laramie, Wyoming, 82072, USA
            3
              Department of Mechanical and Aerospace Engineering, Princeton University, Princeton, New Jersey 08544 USA
                          4
                           Exploration Technology Lab, National Geographic Society, Washington, D.C. 20036 USA
                            5
                              Department of Scientific Services, Parque Nacional da Gorongosa, Sofala, Mozambique
               6
                Department of Ecology and Evolutionary Biology, Brown University, Providence, Rhode Island 02912 USA
                 7
                   Institute at Brown for Environment and Society, Brown University, Providence, Rhode Island 02912 USA
          8
            Department of Electrical and Computer Engineering, University of Maryland, College Park, Maryland 20742 USA
                           9
                             Station Biologique de Roscoff, UMR 7144, CNRS-Sorbonne Universite, Roscoff, France
                                   10
                                     CSIRO Ocean & Atmosphere, Lucas Heights, New South Wales Australia
                     11
                        Department of Mechanical Engineering, Bucknell University, Lewisburg, Pennsylvania 17837 USA
                         12
                            Department of Fish and Wildlife Sciences, University of Idaho, Moscow, Idaho 83844 USA

             Citation: Becker, J. A., M. C. Hutchinson, A. B. Potter, S. Park, J. A. Guyton, K. Abernathy,
             V. F. Americo, A. G. da Conceicßao, T. R. Kartzinel, L. Kuziel, N. E. Leonard, E. Lorenzi, N. C. Martins, J.
             Pansu, W. L. Scott, M. K. Stahl, K. R. Torrens, M. E. Stalmans, R. A. Long, and R. M. Pringle.
             2021. Ecological and behavioral mechanisms of density-dependent habitat expansion in a
             recovering African ungulate population. Ecological Monographs 00(00):e01476. 10.1002/ecm.1476

                 Abstract. Major disturbances can temporarily remove factors that otherwise constrain
             population abundance and distribution. During such windows of relaxed top-down and/or
             bottom-up control, ungulate populations can grow rapidly, eventually leading to resource
             depletion and density-dependent expansion into less-preferred habitats. Although many stud-
             ies have explored the demographic outcomes and ecological impacts of these processes, fewer
             have examined the individual-level mechanisms by which they occur. We investigated these
             mechanisms in Gorongosa National Park, where the Mozambican Civil War devastated large-
             mammal populations between 1977 and 1992. Gorongosa’s recovery has been marked by pro-
             liferation of waterbuck (Kobus ellipsiprymnus), an historically marginal 200-kg antelope spe-
             cies, which is now roughly 20-fold more abundant than before the war. We show that after
             years of unrestricted population growth, waterbuck have depleted food availability in their his-
             torically preferred floodplain habitat and have increasingly expanded into historically avoided
             savanna habitat. This expansion was demographically skewed: mixed-sex groups of prime-age
             individuals remained more common in the floodplain, while bachelors, loners, and subadults
             populated the savanna. By coupling DNA metabarcoding and forage analysis, we show that
             waterbuck in these two habitats ate radically different diets, which were more digestible and
             protein-rich in the floodplain than in savanna; thus, although individuals in both habitats
             achieved positive net energy balance, energetic performance was higher in the floodplain.
             Analysis of daily activity patterns from high-resolution GPS-telemetry, accelerometry, and
             animal-borne video revealed that savanna waterbuck spent less time eating, perhaps to accom-
             modate their tougher, lower-quality diets. Waterbuck in savanna also had more ectoparasites
             than those in the floodplain. Thus, plasticity in foraging behavior and diet selection enabled
             savanna waterbuck to tolerate the costs of density-dependent spillover, at least in the short
             term; however, the already poorer energetic performance of these individuals implies that
             savanna occupancy may become prohibitively costly as heterospecific competitors and preda-
             tors continue to recover in Gorongosa. Our results suggest that behavior can provide a leading
             indicator of the onset of density-dependent limitation and the likelihood of subsequent popula-
             tion decline, but that reliable inference hinges on understanding the mechanistic basis of
             observed behavioral shifts.

  Manuscript received 23 September 2020; revised 30 March 2021; accepted 21 April 2021. Corresponding Editor: Justine A.
Becker and Robert M. Pringle.
  J. A. Becker and M. C. Hutchinson are joint first authors on this work.
  13
     E-mail: justineabecker@gmail.com and rpringle@princeton.edu

                                                        Article e01476; page 1
Article e01476; page 2                          JUSTINE A. BECKER ET AL.                                  Ecological Monographs
                                                                                                                     Vol. 0, No. 0
               Key words: African savannas; animal movement behavior; density-dependent habitat selection; DNA
            metabarcoding; ecological niche shift; GPS telemetry; ideal free distribution; niche variation hypothesis;
            source–sink dynamics; trophic rewilding.

                                                                  belowground ecosystem functions (Ricca et al. 2016).
                         INTRODUCTION
                                                                  Yet we have limited understanding of the proximate
   How do individuals and populations respond when                individual-level mechanisms that produce such effects.
they are abruptly released from limiting factors such as             Rewilding efforts, in which remnant or translocated
competition, predation, or human exploitation? This               populations are allowed to grow in places where they
question is salient for basic and applied ecology, espe-          (and often their competitors and natural predators) have
cially in the rapidly changing environments of the                long been absent or heavily suppressed (Bakker and
Anthropocene. The decline of apex carnivores has                  Svenning 2018, Perino et al. 2019), present an opportu-
relaxed top-down pressure in many ecosystems (Estes               nity to study these issues. In Mozambique’s Gorongosa
et al. 2011). Biological invasions have resulted in the           National Park, ungulate populations were nearly extir-
establishment of new populations in habitats that lack            pated during the Mozambican Civil War (1977–1992)
the natural enemies present in native ranges (Keane and           and are now recovering (Pringle 2017, Stalmans et al.
Crawley 2002, Mitchell and Power 2003). Translocations            2019). The population of waterbuck (Kobus ellipsiprym-
of animals to facilitate species persistence or to reestab-       nus), a territorial antelope that is geographically wide-
lish extirpated populations are increasingly common-              spread but highly water-dependent and rarely locally
place (Seddon et al. 2014). And in some parts of the              dominant (Spinage 1982), has grown particularly rapidly
world, conservation measures are enabling populations             and now exceeds historical levels by more than an order
that have long been heavily suppressed to expand into             of magnitude (Stalmans et al. 2019). Pre-war aerial sur-
areas where, at least initially, competitive interactions         veys in Gorongosa counted an average of ~2,500 water-
are weak and predation risk is low (Chapron et al. 2014,          buck, almost all of them in the productive Urema
Perino et al. 2019). Understanding how animals respond            floodplain at the core of the park (Tinley 1977); this
to such windows of ecological opportunity—not just                number was reduced to a few hundred individuals by the
demographically but also behaviorally—is important for            mid-1990s, but by 2018, the population had grown to
forecasting and managing population dynamics, species’            >57,000 (Stalmans et al. 2019). A simple stage-
distributions, and associated ecological impacts (Morris          structured logistic-growth model indicated that in 2018,
et al. 2009).                                                     this population was rapidly approaching or perhaps
   Simple models make diverse predictions about how               already exceeding plausible estimates of carrying capac-
populations can grow in the absence of strongly limiting          ity (see Methods: Study species), with peak population
interactions with other species (May 1976), and empiri-           size predicted to occur in 2022 (Stalmans et al. 2019).
cal studies show that diverse scenarios play out in nature        Although data from the three most recent aerial surveys
(Duncan et al. 2020). Ungulate populations, for exam-             might reflect a subtle decline in the growth rate of the
ple, may grow until they reach a relatively stable carrying       population, which increased by 30% from 2014 to 2016
capacity where density-dependent mortality offsets                and by 23% from 2016 to 2018 (Stalmans et al. 2019),
births (Woodgerd 1964, Sinclair et al. 1985, Coulson              there was not yet any clear numerical signal of popula-
et al. 2004), or they may exhibit irruptive or cyclical           tion regulation as of 2018.
boom-bust dynamics in which populations overshoot                    Classical theories of habitat selection provide useful
carrying capacity and then crash (Caughley 1970, Coul-            reference points for evaluating the behavioral responses
son et al. 2001, Forsyth and Caley 2006, White et al.             of rapidly growing populations such as Gorongosa’s
2007). Whereas many studies have explored the determi-            waterbuck. According to the ideal free distribution
nants of population dynamics in large mammals (Sin-               (Fretwell and Lucas 1969; see also Rosenzweig 1992,
clair 1977, McCullough 1979, Berger 1986, Fowler 1987,            Morris 2003), populations should exhibit density-
Gaillard et al. 2000, Owen-Smith 2002, Boyce 2009),               dependent habitat selection whereby individuals move
fewer have detailed the behavioral processes by which             freely among habitats of varying quality and conspecific
rapidly growing populations cope with intensifying                crowdedness, such that per capita resource acquisition
resource limitation. It is clear that these responses can         and ultimately fitness is similar across habitats. In terri-
be strong and have significant effects on ecosystems              torial species, however, individuals may not be entirely
(Jewell and Holt 1981, Garrott et al. 1993). For example,         free to select habitat, and resource-rich areas may be
as snowshoe hares approach peak abundance in the                  controlled by competitively dominant individuals such
Yukon, they browse tree species that they ordinarily              that fitness is unequal across habitats (the ideal despotic
avoid, resulting in a periodic pattern of tree growth that        distribution; Fretwell and Lucas 1969, Morris 1989). In
corresponds to the decadal cycle of the hare population           the extreme, resource-poor areas may be sinks where
(Sinclair et al. 1993). On subarctic islands, irruptions of       death rates exceed birth rates (Pulliam 1988); in this
caribou have transformed vegetation structure and                 case, individual energetic performance should differ
Xxxxx 2021 DRIVERS OF DENSITY-DEPENDENT HABITAT USE Article e01476; page 3
markedly across habitats, and abundance in sink habitat We tested the following specific predictions stemming
should be maintained only by spillover from compara- from these hypotheses, using aerial survey records, GPS
tively resource-rich source habitat. Although the theoret- telemetry, accelerometry, analyses of diet composition
ical assumptions of any “ideal” distribution are often and quality, behavioral assays from camera-trap videos,
violated in nature, ungulates frequently exhibit strong ecto- and endoparasite counts, body-condition measure-
intraspecific competition and density-dependent habitat ments, and a multi-year herbivore-exclusion experiment.
selection (Pettorelli et al. 2003, McLoughlin et al. 2006, (1) As waterbuck density has increased, competition for
Ricca et al. 2014, van Beest et al. 2014), and the frame- food in the Urema floodplain has depleted plant bio-
works outlined above suggest testable predictions about mass in general and preferred food plants in particular.
the individual-level properties and processes that might (2) As food availability has decreased, individuals have
accompany density-dependent habitat expansion. expanded out of the floodplain and into adjoining
We studied Gorongosa’s waterbuck to evaluate the savanna habitat where waterbuck historically did not
proximate behavioral-ecological mechanisms of occur (Tinley 1977). (3) Expansion into savanna is
density-dependent habitat selection. Our study is skewed toward pre- or post-reproductive individuals,
guided by the following series of hypotheses. Prior to whereas prime-age individuals are more likely to remain
any marked decline in population growth rate, intensi- and breed in the floodplain. (4) Waterbuck diets in
fying intraspecific competition and associated worsen- floodplain and savanna are compositionally distinct and
ing of individual condition should prompt expansion more diverse in savanna, reflecting the different plant
out of historically occupied (and presumably preferred) communities in the two habitats. (5) Savanna is a lower-
habitat to mitigate the fitness costs of poor body con- quality habitat for waterbuck than floodplain, as indi-
dition (Morris 2003). This expansion should be non- cated by diet quality (e.g., lower digestible energy, pro-
random across individuals with respect to sex, age, tein, etc.), more spatiotemporally variable access to
and/or breeding status owing to territorial dynamics drinking water, and elevated parasite loads. (6) Individu-
(Beckmann and Berger 2003); prime-age breeding indi- als in savanna compensate for lower resource quality by
viduals should remain in the historically selected habi- altering their foraging behavior (e.g., time spent eating,
tat (as their fitness cost of leaving, in terms of lost bite size/rate) such that waterbuck in the two habitats
mating opportunities, is higher), whereas pre- and maintain similar net energy balance. (7) Owing to such
post-reproductive individuals should be more likely to behavioral plasticity and weaker intraspecific competi-
expand into historically avoided habitat (as they sacri- tion in the less crowded savanna habitat, waterbuck
fice fewer short-term mating opportunities). Habitat maintain similar body condition in floodplain and
expansion should be accompanied by broadening of savanna. In this framework, predictions 2 (habitat
the population-level dietary niche, arising either from expansion) and 7 (body-condition equivalence) are
differentiation of individual diets between habitat types expected manifestations of density-dependent habitat
(niche variation hypothesis; Van Valen 1965, Bolnick expansion and are products of predictions 1 (resource
et al. 2007) or from increased individual generalization depletion), 5 (unequal habitat quality), and 6 (behavioral
throughout the population (parallel release; Sj€ odin compensation); prediction 3 (demographically skewed
et al. 2018). Individual movement, resource acquisi- expansion) represents the expected fitness inequality
tion, and exposure to natural enemies should all reflect between habitats and is a product of predictions 4 (niche
differences in habitat quality (Morris 2003); thus, for expansion and its attendant costs; Sj€odin et al. 2018), 5,
example, individuals expanding into novel, lower- and 6.
quality habitat might have to travel farther to obtain
resources, eat less nutritious diets, and/or have higher
METHODS
parasite loads. Any net difference in energetic perfor-
mance across habitats should then depend on the rela- Below, we describe the study system and summarize
tive effects of competition and habitat quality, and on the methods used to test our predictions; full method-
the extent to which individuals in the novel habitat can ological details are in Appendix S1.
adjust behaviorally (Svanb€ack and Bolnick 2007,
Kobler et al. 2009, Courbin et al. 2017). If behavioral
Study system
plasticity in movement and diet is sufficient to com-
pensate for a reduction in habitat quality, then individ- Gorongosa National Park is a floodplain–savanna
uals expanding into a lower-quality habitat with few ecosystem in central Mozambique, occupying roughly
conspecifics may perform equally well as those in the 4,000 km2 at the southern end of the Great Rift Valley
preferred habitat owing to reduced intraspecific com- (18.96° S, 34.36° E). Mean annual rainfall is approxi-
petition (Stewart et al. 2005, McLoughlin et al. 2006, mately 850 mm (interquartile range 644–1,079 mm
Fortin et al. 2008). Alternatively, if compensatory between 1957 and 2018), most of which falls between
mechanisms are unavailable or insufficient, then indi- November and March (Tinley 1977). During a typical
vidual energetic performance may decline sharply, and rainy season, Lake Urema expands to cover most of the
the lower-quality habitat may even act as a sink. ˜780-km2 floodplain and then contracts throughout theArticle e01476; page 4 JUSTINE A. BECKER ET AL. Ecological Monographs
Vol. 0, No. 0
dry season. Beyond the floodplain, the habitat transi- 23, 41, and 81 individuals/km2; see Stalmans et al.
tions into intermittently flooded savanna dominated by 2019).
fever trees (Acacia syn. Vachellia xanthophloea) and lala
palms (Hyphaene coriacea), and then into savanna
Quantifying density-dependent habitat shifts
woodland (mixed acacia–Combretum, sand forest, termi-
taria thicket). During the Mozambican Civil War, To test the prediction that waterbuck have reduced
Gorongosa’s ungulate populations declined by >90%, food availability in the floodplain, we used six 260-m2
and several large-carnivore species were extirpated (Stal- herbivore exclosures and paired unmanipulated control
mans et al. 2019). In the last decade, ungulate popula- plots established in 2015. We recorded aboveground bio-
tions have steadily recovered (Stalmans et al. 2019) mass and percent cover of each plant species 12 times
under conditions of high food availability (Daskin et al. between August 2015 (before exclosure construction)
2016, Guyton et al. 2020), low carnivore densities (Bou- and February 2018. We assumed that effects of herbivore
ley et al. 2018, Atkins et al. 2019, Gaynor et al. 2021), exclusion would be driven primarily by waterbuck, given
and effective anti-poaching measures implemented by their disproportionate abundance in the floodplain. We
the Gorongosa Project (Pringle 2017). used a linear mixed-effects model to test for differences
in plant biomass between treatments. To test whether
food plants favored by waterbuck have been especially
Study species
depleted, we regressed a standardized measure of experi-
Waterbuck are medium-sized (150–300 kg) antelopes mental effect size (ln(exclosure/control)) against previ-
that occur widely throughout Africa, but only “at or ously published data on the selectivity (Jacobs’ D index)
near water” owing to their high susceptibility to dehy- of Gorongosa waterbuck for/against 10 common flood-
dration and overheating relative to other African bovids plain plant taxa (Pansu et al. 2019). For these taxa, we
(Taylor et al. 1969:630; see also Spinage 1982, Kihwele also used Wilcoxon tests to determine whether percent
et al. 2020). Typical habitats include lakeshores, riverine cover differed between treatments.
woodlands, and open grasslands (Wirtz and Kaiser To assess shifts in waterbuck distribution and popula-
1988). Historically, waterbuck in Gorongosa had “the tion structure, we combined aerial wildlife counts (1994–
most restricted dispersion of all the ungulates in the sys- 2018) with ground-based surveys of waterbuck age and
tem” and were largely “confined to the green zone pas- sex composition (Stalmans et al. 2019). For aerial count
tures [floodplains] which expand and contract with data, we used observation locations to quantify the den-
flood and ebb of the Urema Lake” (Tinley 1977:140). In sities of waterbuck in floodplain and savanna. Ground
the peak dry season, “almost the entire waterbuck popu- surveys were conducted monthly along road transects
lation” occurred in this area (Tinley 1977:147). Water- from May–September 2019. At each sighting, we
buck exhibit strong territorial behavior. Prime-age males recorded the number of individuals, sex and age compo-
defend year-round territories in areas of abundant, high- sition, group structure, GPS location, and habitat
quality forage, often in close proximity to water (Spinage (floodplain or savanna). To evaluate our predictions that
1982); females form fluid groups that share common habitat expansion is biased by reproductive stage and
home ranges overlapping male territories (Spinage that the floodplain is the prime breeding ground, we
1982). Juvenile and older males are effectively excluded tested whether the adult female : male and female adult :
from the most resource-rich areas and breeding opportu- subadult ratios were greater in the floodplain (using
nities by the roughly 10% of adult males that hold terri- ANOVA), and whether mixed male–female (i.e., breed-
tories at a given time (Tomlinson 1981, Wirtz 1981, ing) groups were more common in the floodplain (using
1982). The typical diet is dominated by graminoids permutational multivariate ANOVA, henceforth per-
(Tomlinson 1980, Cerling et al. 2003, Codron et al. MANOVA).
2007), but waterbuck also browse under some conditions
(e.g., the dry season; Kassa et al. 2008, Pansu et al.
Movements and activity patterns
2019), possibly owing to their high protein requirements
(Taylor et al. 1969). In 2015 and 2016, we chemically immobilized a total
Pre-war aerial surveys estimated Gorongosa’s water- of 30 female waterbuck from savanna (n = 15) and
buck density at 1.7 individuals/km2, representing 4% floodplain (n = 15) and fit them with custom-built col-
of biomass among the nine largest-bodied herbivore lars (Park et al. 2019) that included GPS units, video
species; in 2018, park-wide waterbuck density was recorders (National Geographic Crittercam), and triax-
32 individuals/km2, representing 74% of the biomass ial accelerometers. All procedures were approved by the
of those nine species, 75% of all large-herbivore bio- Institutional Animal Care and Use Committee of
mass in the floodplain, and 64% of large-herbivore Princeton University. We obtained usable data from 22
biomass park-wide (Stalmans et al. 2019, Guyton et al. individuals (n = 10 captured in the floodplain and 12
2020). As such, by 2018, waterbuck were approaching captured in savanna). We used GPS data to assess move-
or perhaps already exceeding plausible estimates of ment patterns (rarefied to an average fix-rate between 5
carrying capacity (low, medium, and high estimates of and 10 minutes), accelerometry data to assess activityXxxxx 2021 DRIVERS OF DENSITY-DEPENDENT HABITAT USE Article e01476; page 5 patterns, and video data to validate energetic parameters We combined dietary data with measurements of eight (see Measuring waterbuck performance and Video S1). functional traits for 204 plant species to estimate diet Further details on animal handling, collar specifications, quality in each habitat. We measured physical traits etc., are in Appendix S1. (plant height, leaf water content, leaf tensile strength) Because individual waterbuck could move between for approximately three (range of one to six) individuals floodplain and savanna, we classified habitat affilia- per plant species (Appendix S1). We measured chemical tion using a continuous metric, namely the proportion traits (crude protein, total ash, acid detergent lignin, of time spent in the treeless grassland around Lake neutral detergent fiber, percent sodium) using >5 g of Urema (the interior floodplain, henceforth “grass- the youngest leaves collected from three or more individ- land”; see Appendix S1: Fig. S3). We quantified indi- uals per species. We excluded two fecal samples for vidual movement patterns (95% home-range isopleths which
Article e01476; page 6 JUSTINE A. BECKER ET AL. Ecological Monographs
Vol. 0, No. 0
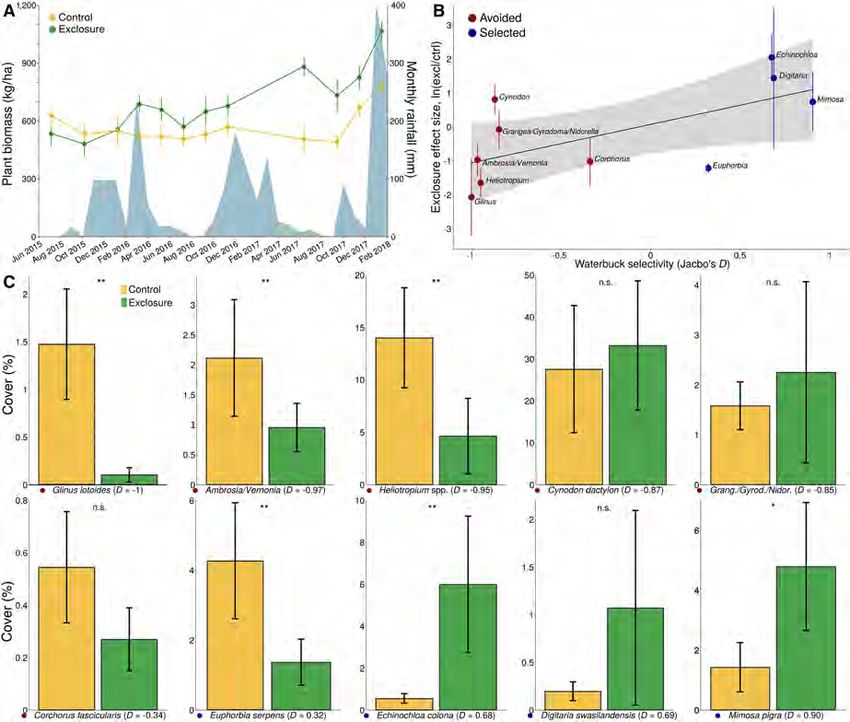
FIG. 1. Ungulates suppressed food availability in the floodplain. (A) Plant biomass (mean SE; left y-axis) in exclosure and
control plots from 2015–2018, with monthly rainfall (right y-axis) in blue. Dashed vertical line denotes exclosure establishment in
September 2015. Ungulate exclusion increased plant biomass, with the treatment effect emerging within a year of exclosure estab-
lishment (mixed-effects model: treatment F1,129 = 1.19, P = 0.28; time F1,129 = 41.06, P < 0.0001; treatment 9 time F1,129 = 25.94,
P < 0.0001). Rainfall had a significant main effect on biomass (F1,129 = 23.65, P < 0.0001) but did not modulate the effect of her-
bivory (treatment 9 rainfall F1,129 = 0.12, P = 0.74). (B) The effect size (mean SE) of ungulate exclusion on the percent cover of
10 common plant taxa (where negative values indicate greater abundance in controls and positive values indicate greater abundance
in exclosures) was an increasing function of waterbuck selectivity (D, where negative values indicate avoidance relative to availability
and positive values indicate selection relative to availability; r = 0.65, F1,8 = 5.73, P = 0.04). (C) Percent cover (mean SE) of the
same 10 plant taxa in exclosure and control plots (left–right and top–bottom in order of increasing waterbuck selectivity, with col-
ors next to plant names denoting avoidance/selection as in panel B. Asterisks denote significant differences between treatments
(*P < 0.05, **P < 0.01) in Wilcoxon tests with n = 12 plots.
greater in February 2018 (a wet period; Fig. 1A). By mid-
RESULTS
dry season, the depletion of biomass outside of exclosures
was often visually dramatic (Appendix S2: Fig. S1).
Floodplain forage availability
Moreover, food plants selected (D > 0) by waterbuck
In accordance with our prediction, ungulates substan- tended to be more abundant in exclosures than controls,
tially depleted forage availability in the floodplain, and whereas the reverse was true for plants avoided (D < 0) by
this effect was most pronounced among food plants waterbuck (Fig. 1B, C). The most conspicuous outlier in
selected by waterbuck (Fig. 1). Mean aboveground plant Fig. 1B is an exception that reinforces the general rule.
biomass was roughly equivalent across plots at the start of The forb Euphorbia serpens was (weakly) selected by
the experiment in 2015 but was 75% greater in exclosures waterbuck in 2016, yet was significantly more abundant in
than in controls in July 2017 (a dry period) and 36% control plots than in exclosures (Fig. 1C). The selectionXxxxx 2021 DRIVERS OF DENSITY-DEPENDENT HABITAT USE Article e01476; page 7
1969 1972
1.93 individuals/km2 1.87 individuals/km2
Grassland
Woodland
80
Density (individuals/km2)
60
40
20
0
1994 1998 2002 2006 2010 2014 2018
Year
2014 2016 2018
20.1 individuals/km2 26.2 individuals/km2 32.2 individuals/km2
50 150 250
100 200 300
FIG. 2. Distribution and density of waterbuck in Gorongosa through time. Maps show pre-war (1969, 1972) and post-war
(2014, 2016, 2018) distributions of waterbuck (yellow circles, scaled by the group size counted at each location) from aerial surveys
during the late dry season (October) when visibility is highest. Overall waterbuck density throughout the surveyed area is shown
beneath each year. Solid black outline delineates the aerial-survey block. Savanna habitat is shown in gray, Lake Urema in blue, and
floodplain in green (dashed black line denotes the transition between the interior treeless grassland and the sparsely wooded flood-
plain margin). Graph (top right) shows post-war waterbuck densities in floodplain and savanna habitats.
for Euphorbia was surprising because members of this
Waterbuck density and distribution
genus are typically rich in toxic secondary compounds
(Seigler 1994). However, 2016 was the only year that we Gorongosa’s waterbuck were found exclusively on the
detected this species in waterbuck diets; in any other floodplain before and immediately after the civil war;
year, it would have been assigned a selectivity index of since 2012, however, the population has expanded into
D = 1 and clustered with the strongly avoided plant the adjoining savanna, even as proportional use of the
taxa in the lower-left of Fig. 1B. Altogether, these floodplain continued to increase (Fig. 2). Waterbuck
results accord both with our assumption that the net density in savanna dipped somewhat in 2018 (a >90th
effects of herbivore exclusion would be driven by water- percentile rainfall year, 1,389 mm) after peaking at 12
buck and with our hypothesis that intraspecific compe- individuals/km2 in 2016 (a below-average rainfall year,
tition among waterbuck has contributed to food 755 mm). In 2018, waterbuck density in the flood-
limitations in the floodplain. plain was 80.9 individuals/km2 (˜16,000 kg/km2), whichArticle e01476; page 8 JUSTINE A. BECKER ET AL. Ecological Monographs
Vol. 0, No. 0
A B C
0.8
Adult females per adult male
Floodplain
Proportion of observations
2.0 Savanna
1.5
Adult females per
sub−adult female
0.6
1.5
1.0
0.4
1.0
0.5 0.2
0.5
0.0 0.0 0.0
Floodplain Savanna Floodplain Savanna Bachelor Female Lone Lone Mixed
group group female male group
FIG. 3. Prime-age breeding waterbuck were concentrated in the floodplain. (A, B) Mean (SE) across surveys of waterbuck sex
and age ratios in 2019, with dashed horizontal lines at unity (i.e., equivalent numbers of each category). (A) In the floodplain, there
were more adult females than adult males, whereas this pattern was reversed in savanna (ANOVA: F1,7 = 24.96, P = 0.002). (B)
Female waterbuck in the floodplain were predominantly adults, whereas subadult females were relatively more common in savanna,
although there was not strong statistical support for this difference with the small sample size available (ANOVA: F1,7 = 2.09,
P = 0.19). (C) Mean proportional representation (1 SE) of social-group types in each habitat suggests that breeding individuals
were disproportionately common in the floodplain, where mixed groups accounted for 75% of observations (compared with just
19% in savanna); in contrast, lone individuals and bachelor groups were more frequent in savanna (perMANOVA of habitat effect
on social-group structure: pseudo-F1,7 = 14.15, P = 0.02, R2 = 0.67).
almost precisely matches the “high” estimate of park- compositionally distinct and consistently formed mini-
wide carrying capacity (81 individuals/km2) postulated mally overlapping clusters in NMDS ordinations
by Stalmans et al. (2019). This number is extraordinary: (Fig. 4). This dietary dissimilarity was reflected in the
a density of 30 individuals/km2 in Kenya’s Lake Nakuru proportional representation of the six predominant
National Park (Kutilek 1974) was previously described food-plant families in each year. In savanna, waterbuck
as “by far the highest density recorded for waterbuck” diets were dominated by Poaceae (grasses, 10–17
(Wirtz and Kaiser 1988:162). mOTUs accounting for 56–81% of mean RRA per year,
The average number of females per male in 2019 was vs. 5–12 mOTUs and 17–60% of RRA in the floodplain)
roughly threefold higher in the floodplain (˜1.5) than in and tended to contain higher proportions of Arecaceae
savanna (˜0.5; Fig. 3A). The average number of females (lala palm, Hyphaene coriacea) and Sapindaceae (river-
per male observed in seven other waterbuck populations litchi, Lecaniodiscus fraxinifolius). Floodplain waterbuck
across eastern and southern Africa was ˜1.78 (range ate more Fabaceae (legumes, 2–7 mOTUs accounting for
1.00–3.45; Spinage 1970), which is similar to what we 22–49% of mean RRA per year, vs. 7–10 mOTUs and 8–
observed in the floodplain and much higher than what 21% of RRA in savanna) and higher (albeit annually
we observed in savanna. The number of adult females variable) proportions of Elatinaceae (waterwort, Bergia
per subadult female trended roughly 80% higher on aver- mossambicensis), Euphorbiaceae (matted sandmat,
age in the floodplain than in savanna (where the ratio Euphorbia serpens), and Pontederiaceae (water hyacinth,
was close to 1:1), although this difference was not statis- Eichhornia crassipes; Fig. 4).
tically significant (Fig. 3B). Among social-group types, Waterbuck diet quality was higher in the floodplain,
bachelors and lone individuals occurred more frequently especially in 2016–2017; however, most indicators of diet
in savanna, whereas mixed groups predominated in the quality deteriorated through time in the floodplain while
floodplain (Fig. 3C). Collectively, these patterns are staying relatively consistent in savanna. Digestibility and
consistent with our prediction that the floodplain is dis- digestible-protein content, two key components of diet
proportionately occupied by the individuals most likely quality, were greater in the floodplain than in savanna in
to breed. every year, although the difference in digestibility shrank
with time (Fig. 5A,B). Initially, floodplain diets were also
higher in water content, lower in toughness (tensile
Waterbuck diet composition and quality
strength), and composed of shorter (more accessible)
In the 111 fecal samples analyzed, we detected 83 plants, but each of these metrics converged across habitats
mOTUs representing 28 plant families. Each year from over time owing to monotonic changes in the floodplain:
2016 to 2019, dietary richness and diversity were higher from 2016 to 2019, the average floodplain diet decreased
in savanna than in the floodplain, with savanna water- in percent water content by 18%, roughly doubled in leaf
buck eating ˜50% more plant mOTUs on average toughness, and increased roughly 11-fold in plant height
(Appendix S2: Fig. S2). In line with our prediction, (Fig. 5C-E). Dietary sodium, often a limiting nutrient for
floodplain and savanna waterbuck diets were herbivores (Kaspari 2020), was the only measured qualityXxxxx 2021 DRIVERS OF DENSITY-DEPENDENT HABITAT USE Article e01476; page 9
metric that was higher in savanna (Fig. 5F). The gener- support our prediction that savanna is a lower-quality
ally higher quality of floodplain diets (especially in terms resource environment for waterbuck.
of digestibility and protein) aligns with our prediction
that the historically avoided savanna is a lower-quality
Waterbuck energetics
habitat for waterbuck. Moreover, the monotonic declines
of several diet-quality indicators in the floodplain Mean bite rate was significantly higher in the flood-
through time, coupled with the depletion of preferred plain (Fig. 8A; t = 3.92, df = 34.22, P < 0.001), whereas
food plants in the floodplain (Fig. 1, Appendix S2: estimated bite size and intake rate were higher in savanna
Figs. S1, S2), are consistent with our prediction that the (Fig. 8B). Estimated energetic costs were similar across
floodplain became increasingly resource-limited as water- habitats; however, the lower digestibility of savanna water-
buck density monotonically increased (Fig. 2). Although buck diets and the lesser time they spent eating per day
these temporal trends are to some degree confounded by resulted in ˜30% higher daily net energy balance for flood-
interannual variation in rainfall, the rainfall pattern was plain waterbuck (Fig. 8B). Daily energy balance was lar-
not monotonic (driest in 2017, wettest in 2019) and is gely insensitive to variation in estimates of body mass and
therefore unlikely to explain the trends in diet-quality bite rate (i.e., small effect sizes) but was strongly corre-
indicators in the floodplain. lated with handling time and bite size (negatively and pos-
itively, respectively) (Appendix S2: Fig. S4). The
qualitative result that floodplain waterbuck had higher
Waterbuck parasite burdens
daily net energy balance than savanna waterbuck was
Savanna waterbuck had more ticks and lice on their robust to sensitivity analyses on our bite-size estimates
faces, necks, and ears; these ectoparasites were com- (Appendix S2: Fig. S4). However, when we assumed
pletely absent from the floodplain waterbuck that we higher handling times in both habitats (>1.2 s/bite), our
evaluated (Fig. 6A). Strongyle nematode egg counts sensitivity analyses showed that savanna waterbuck could
increased from 2017–2019 in both habitats, but did not achieve similar or even greater net energy balance
differ significantly between habitats (Fig. 6B). (Appendix S2: Fig. S4). Our calculations suggest that
waterbuck ate between 3.2% (savanna) and 3.4% (flood-
plain) of their body mass daily, which aligns with esti-
Waterbuck movement and space use
mates from both captive and field-based feeding trials of
The mean utilization distribution (UD) areas and female North American cervids (Berry et al. 2019,
movement rates of waterbuck did not differ significantly Ulappa et al. 2020). Waterbuck in the floodplain also
as a function of proportional grassland use (where high consumed more protein per day than those in savanna
values correspond to floodplain individuals and low val- (Fig. 8B). Waterbuck in both habitats appear able to meet
ues correspond to savanna individuals), suggesting that daily energy requirements for basal metabolic mainte-
these fundamental movement characteristics were simi- nance and movement, although our analyses did not
lar regardless of habitat affiliation (Fig. 7A,B). Water- include the costs of thermoregulation or other activities
buck in both habitats spent most of their time either beyond locomotion.
eating or resting (mean SE: 93% 0.01%). However,
waterbuck in the floodplain spent more time eating than
Waterbuck body condition
those in savanna (Fig. 7C, Appendix S1: Fig. S4). There
was no significant correlation between floodplain occu- Despite the differences between habitats in diet compo-
pancy and any of the other behavioral states (resting, sition and quality, ectoparasite loads, movement behavior,
walking, running), thus increased time spent eating and energetics, we found no clear differences in body con-
resulted in similar reductions in time spent in each of the dition between floodplain and savanna waterbuck
three alternative states. Use of surface-water sources also (Fig. 8C, D). Individual scores for principal components
differed as a function of habitat affiliation: waterbuck in 1 (most highly associated and positively correlated with
the floodplain made more frequent visits to Lake Urema measurements of fat deposition) and 2 (most highly asso-
(which is perennial), whereas waterbuck in savanna pri- ciated and negatively correlated with size-related measure-
marily utilized pans (most of which are small and sea- ments such as body and hind foot length) were slightly
sonal) (Appendix S2: Fig. S3A, B). Both the mean and (nonsignificantly) higher among waterbuck in savanna,
maximum number of revisitations to any one water suggesting that these individuals tended to be smaller but
source were highest for pans (Appendix S2: Fig. S3C, to have more body fat than individuals in the floodplain
D), suggesting that savanna waterbuck may have had (perhaps reflecting the skewed distribution of age classes
access to fewer water sources and/or obtained less water between the two habitats; Fig. 2B).
per drinking bout. The floodplain also contains many
drainage channels that may provide supplementary sur-
DISCUSSION
face water sources for waterbuck and result in fewer vis-
its to Lake Urema. These results, together with the lower The release of a population from ecological limiting
dietary water content of savanna waterbuck, further factors can precipitate both rapid population growthArticle e01476; page 10 JUSTINE A. BECKER ET AL. Ecological Monographs
Vol. 0, No. 0
2016 2016
Proportion of diet (RRA)
1
Floodplain
0.75
NMDS axis 2
Savanna
0 0.50
−1 0.25
0.00
−2 −1 0 1 Poaceae Fabaceae Onagraceae Euphorbiaceae Pontederiaceae Arecaceae
NMDS axis 1
2017 Proportion of diet (RRA) 2017
1
0.75
NMDS axis 2
0 0.50
0.25
−1
0.00
−2 −1 0 1 Poaceae Fabaceae Onagraceae Arecaceae Elatinaceae Sapindaceae
NMDS axis 1
2018 2018
Proportion of diet (RRA)
1 0.75
NMDS axis 2
0.50
0
0.25
−1
0.00
−1 0 1 Poaceae Fabaceae Onagraceae Elatinaceae Malvaceae Arecaceae
NMDS axis 1
2019 2019
Proportion of diet (RRA)
1 0.75
NMDS axis 2
0 0.50
0.25
−1
0.00
−1 0 1 2 Poaceae Fabaceae Onagraceae Sapindaceae Pontederiaceae Arecaceae
NMDS axis 1
FIG. 4. Waterbuck diets differed in floodplain and savanna habitats. At left, nonmetric multidmensional scaling (NMDS) ordi-
nations illustrate the dietary dissimilarity (at the level of plant molecular operational taxonomic units [mOTUs]) among waterbuck
fecal samples collected in floodplain and savanna in each year from 2016 to 2019 (stress = 0.10, 0.16, 0.14, 0.12, respectively). Points
in each plot represent individual fecal samples, with points farther apart being more dissimilar; 90% confidence ellipses are shown
for each habitat (perMANOVA testing the effect of habitat type, 9999 permutations: 2016 pseudo-F1,22 = 8.29, P < 0.001,Xxxxx 2021 DRIVERS OF DENSITY-DEPENDENT HABITAT USE Article e01476; page 11
(FIG. 4. Continued)
R2 = 0.27; 2017 pseudo-F1,30 = 7.64, P < 0.001, R2 = 0.20; 2018 pseudo-F1,28 = 8.22, P < 0.001, R2 = 0.23; 2019 pseudo-
F1,23 = 10.95, P < 0.001, R2 = 0.32). At right, the proportional representation (RRA; SE) of the six plant families that con-
tributed most to waterbuck diets in each year (which always included all families that accounted for ≥1% of RRA on average across
all samples). Composition of these plant families likewise differed significantly between habitats in each year (perMANOVA of
habitat effect, 9,999 permutations: 2016 pseudo-F1,22 = 6.31, P = 0.001, R2 = 0.22; 2017 pseudo-F1,30 = 9.31, P < 0.001,
R2 = 0.24; 2018 pseudo-F1,28 = 3.64, P = 0.02, R2 = 0.12; 2019 pseudo-F1,23 = 12.83, P < 0.001, R2 = 0.36). Floodplain waterbuck
ate more legumes (mean 35% RRA, mostly the shrub Mimosa pigra) than savanna waterbuck (mean 13% RRA, mostly Acacia syn.
Vachellia spp.), whereas savanna waterbuck ate substantially more grass (mean 69% RRA, mostly Urochloa mosambicensis and Pan-
icum spp.) than floodplain waterbuck (mean 38% RRA, predominantly Digitaria swazilandensis and Cynodon dactylon).
and niche expansion. We tested the hypothesis that results suggest that waterbuck are able to compensate for
unchecked population growth in a territorial ungulate the costs of density-dependent spillover, at least in the
(and consequent depletion of resources in the preferred short term, and that the difference in diet quality between
habitat) leads to demographically skewed expansion into habitats is dissipating as intraspecific density in the flood-
lower-quality habitat and accompanying expansion of the plain continues to increase; although waterbuck in the
population-level dietary niche. We expected that this floodplain achieved higher net energy balance (limited
niche expansion would occur primarily through individ- support for prediction 6), body condition was similar in
ual differentiation rather than increased individual gener- both habitats (prediction 7). Collectively, our results pro-
alization—i.e., that the population would segregate into vide evidence of despotic density-dependent habitat selec-
floodplain- and savanna-affiliated individuals with corre- tion, enabled by individual behavioral flexibility that
spondingly different diets—and the data were consistent dampens the fitness costs of occupying low-quality (but
with this notion (with some caveats discussed below). also lower density) habitat.
Recent theory holds that niche expansion should occur Although we acknowledge some uncertainty in the
via this route only when individual generalization is costly energetic and body-condition results, as several of our
(Sj€
odin et al. 2018). Our results suggest that the costs of energetic parameters were approximations derived from
savanna occupancy include fewer reproductive opportuni- research in other systems and our body-condition met-
ties and reduced diet quality. The fitness implications of rics have not been formally validated for waterbuck, the
these costs should be greatest for prime-age potential results withstood sensitivity analysis and are consistent
breeders with high energetic demands, consistent with the with predictions of life-history theory. Our sensitivity
observed demographic skew in habitat use. Individuals in analysis showed that savanna waterbuck could achieve
the poorer habitat may be able to mitigate these costs if equal or greater energy balance if handling times were
behavioral flexibility is sufficient to compensate for the high in both habitats (Appendix S2: Fig. S4). We con-
differences in diet quality, potentially enabling them to sider this scenario unlikely—the greater toughness and
trade off current for future reproduction. height of savanna food plants (Fig. 5C,D) suggest that
In agreement with our predictions 1 and 2, we found handling time is probably higher in savanna—but it is
that Gorongosa’s waterbuck have increasingly expanded possible that depletion of high-quality food in the flood-
out of the historically preferred but currently food-limited plain (Figs. 1, 5) has increased handling time there,
floodplain and into the historically avoided savanna. which could reduce the energy-balance differential and
Notably however, proportional use of the floodplain contribute to convergence in body condition across habi-
increased through time despite resource depletion, under- tats. We also note that our estimates of energy expendi-
scoring the continuing value of floodplain habitat and ture captured only the costs of basal metabolism and
suggesting a difference between habitats in the relation- locomotion. We hypothesize that females in the flood-
ship between density and fitness. In accordance with pre- plain (biased toward breeding-age individuals) expend
diction 3, breeding individuals predominantly remained more energy on reproduction (higher pregnancy and lac-
in the floodplain, whereas savanna occupancy was biased tation rates, fewer reproductive pauses, larger calves),
toward pre-reproductive individuals and solitary (perhaps which could prevent these individuals from subsisting on
senescent) males that are less likely to attain mating lower-quality savanna diets and might likewise promote
opportunities in the floodplain. Waterbuck in savanna ate convergence in body condition across habitats. Future
a taxonomically and functionally distinct (and more work on the relative reproductive investment and life-
diverse) suite of plants (prediction 4), reflecting differ- time fitness of floodplain and savanna waterbuck would
ences in plant community composition across habitats, be a useful next step.
yet their diets were less digestible and protein rich than
those of waterbuck in the floodplain; floodplain water-
Behavioral and ecological signatures of density-dependent
buck also had a more seasonally reliable source of drink-
habitat expansion
ing water and fewer ectoparasites than savanna
waterbuck, all of which supports the prediction (5) that Our results suggest that flexibility in fine-scale forag-
savanna is the lower-quality habitat. Nevertheless, our ing behavior plays an important role in how ungulateArticle e01476; page 12 JUSTINE A. BECKER ET AL. Ecological Monographs
Vol. 0, No. 0
A 65 B
20.0
60
Disgestible protein (%)
Disgestibility (%)
17.5
55 15.0
12.5
50
10.0
C 70 D
12
Force required to tear leaf (N)
Water content (%)
65
10
8
60
6
55
4
E F 0.6
4
0.5
Dietary plant height (m)
Sodium content (%)
3
0.4
2
0.3
1
0.2
2016 2017 2018 2019 2016 2017 2018 2019
Floodplain Savanna
FIG. 5. Waterbuck diet quality was generally higher, but declining, in the floodplain. (A) Digestibility was higher on average but
declined over time in the floodplain (linear model: habitat F1,105 = 55.56, P < 0.001; year F1,105 = 3.91, P = 0.05; habitat 9 year
F1,105 = 4.71, P = 0.03). (B) Digestible-protein content was consistently higher in the floodplain, with no directional temporal trend
in either habitat (habitat F1,105 = 43.36, P < 0.001; year F1,105 = 1.56, P = 0.21; habitat 9 year F1,105 = 0.80, P = 0.37). (C) Diet-
ary water content was initially higher but declined monotonically in the floodplain over time, leading to convergence across habitats
(habitat F1,105 = 4.34, P = 0.04; year F1,105 = 7.54, P = 0.007; habitat 9 year, F1,105 = 18.90, P < 0.001). (D) Leaf toughness was
initially lower but increased monotonically in the floodplain, leading to convergence across habitats (habitat F1,105 = 23.57,
P < 0.001; year F1,105 = 0.10, P = 0.75; habitat 9 year F1,105 = 16.27, P < 0.001). (E) Plant height was initially lower but increasedXxxxx 2021 DRIVERS OF DENSITY-DEPENDENT HABITAT USE Article e01476; page 13
(FIG. 5. Continued)
through time in the floodplain, leading to convergence across habitats (habitat F1,105 = 30.12, P < 0.001; year F1,105 = 7.30,
P = 0.008; habitat 9 year F1,105 = 17.25, P < 0.001). (F) Sodium content was generally higher in savanna (habitat F1,105 = 8.69,
P = 0.004; year F1,105 = 9.13, P = 0.003; habitat 9 year F1,105 = 0.99, P = 0.32). Quality indicators (mean SE) were calculated
by averaging the trait values of food-plant taxa (weighted by their RRA) in each waterbuck fecal sample.
populations mitigate the effects of density dependence (Wirtz and Oldekop 1991). Ultimately, this behavioral
and intraspecific competition more broadly (Morris flexibility and the positive energy balance of individuals
2003). Despite the reduced diet quality associated with in both habitats may be enabling continued population
habitat expansion, individual flexibility in the types of growth, despite the increasing saturation of the flood-
plants eaten and the amount of time spent eating plain. Yet, the lower energy and protein intake of
enabled females to maintain positive energy balance in savanna individuals suggests that savanna may only be a
savanna. Part of this response may reflect a unique fea- viable refuge so long as interspecific competition and
ture of ruminant physiology: the rate of food intake is predation pressure remain low, plants remain sufficiently
limited by the time required to process food in the abundant to allow large bite sizes, and the floodplain
rumen, which is negatively correlated with food quality remains a source habitat.
(Wirtz and Oldekop 1991). Spending less time eating Behavioral flexibility enables animals to rapidly adjust
while taking larger bites might allow savanna waterbuck to shifting environmental conditions, thereby promoting
to increase gut-processing time to accommodate low- the maintenance of individual condition, reproductive
quality food while still meeting daily energy require- success, and population persistence (Huey et al. 2003,
ments. Indeed, such fine-scale adjustments to activity Kearney et al. 2009, Long et al. 2014). Individual differ-
budgets have been observed in waterbuck elsewhere entiation in behavior and diet is often observed in popula-
when individuals were restricted to nutritionally poor tions responding to biotic stressors that limit resource
habitats. In Kenya, bachelor males that were excluded availability, such as competition (Svanb€ ack and Bolnick
from high-quality territories spent less time foraging 2007). In this regard, our results accord with predictions
than territory holders, and females within these high- of foraging theory (Stephens and Krebs 1986) and theo-
quality areas spent more time eating than those outside ries of niche expansion (Sj€ odin et al. 2018). Consistent
A B
***
1000
15
Total no. ectoparasites on head and neck
log([eggs/g feces] +1)
100
10
10
5
0 1
2017 2018 2019
Floodplain Savanna
FIG. 6. Ectoparasite burdens were higher in savanna waterbuck, whereas endoparasite loads were similar across habitats. (A)
No ticks or lice were counted on the ears, faces, or necks of waterbuck collared in the floodplain in 2016 (n = 10) whereas those col-
lared in savanna (n = 15) had more. (B) Numbers of strongyle nematode eggs per gram of feces (n = 26, 29, and 31 in 2017, 2018,
and 2019, respectively) did not differ significantly between habitats (negative-binomial GLM: habitat = 0.29 0.27, Z = 1.06,
P = 0.29) but did increase significantly from 2017–2019 (year = 0.45 0.17, Z = 2.73, P = 0.01). Box plot components are mid
line, median; box edges, interquartile range; and whiskers, 1.5 x interquartile range.Article e01476; page 14 JUSTINE A. BECKER ET AL. Ecological Monographs
Vol. 0, No. 0
A B C
8
95% home-range isopleth area (km2)
0.45
Proportion of time eating per day
7
Movement rate (m/minute)
6 6 0.40
5
4 0.35
4
2 0.30
3
0 0.25
0.00 0.25 0.50 0.75 1.00 0.00 0.25 0.50 0.75 1.00 0.00 0.25 0.50 0.75 1.00
Proportion time in grassland habitat Proportion time in grassland habitat Proportion time in grassland habitat
FIG. 7. Savanna waterbuck spent less time eating than floodplain waterbuck. (A) Area of each individual’s 95% home-range
isopleth (derived from the utilization distribution, i.e., the relative intensity of space use; R2 = 0.03, F1,20 = 1.56, P = 0.23). (B)
Individual movement rate in m/min (R2 < 0.01, F1,20 = 1.19, P = 0.29). (C) The proportion of time that individuals spent
eating (R2 = 0.39, F1,11 = 8.79, P = 0.01). One outlier was removed from the data set before fitting the regression in panel C owing
to implausibly low activity levels (resting >75% of the time) suggesting accelerometer malfunction (Appendix S1); the full data set is
plotted in Appendix S1: Fig. S4. The behavioral states used in panel C were determined using classification algorithms trained on
the accelerometry data and verified using high-definition animal-borne video data (Park et al. 2019; Appendix S1). Behavioral
attributes were assessed using linear regression as a function of the proportion of time each individual spent in the interior of the
floodplain.
with the niche variation hypothesis (Van Valen 1965), and on insular populations (often introduced). In those
total dietary niche width of the population expanded cases, similar patterns of density-dependent habitat and
mainly through inter-individual differentiation in diet diet expansion typically follow a period of irruptive
composition that occurred when intraspecific competition growth after populations are introduced or after preda-
forced some waterbuck to move from floodplain into the tors are removed (Caughley 1970, Coulson et al. 2001,
floristically distinct savanna (where dietary niche width Forsyth and Caley 2006, White et al. 2007). Multi-
was also greater than in the floodplain: Appendix S2: generational data sets from these systems show that such
Fig. S2). Niche expansion through the alternative path- dynamics often result in population crashes if habitat
way of individual generalization (parallel release) expansion delays the effects of density-dependent regula-
would entail costs of travel, nutrition, reproduction, tion (Caughley 1970, Coulson et al. 2001, Forsyth and
parasite load, and water availability, which reflect the Caley 2006, White et al. 2007). Our focus on the proxi-
scale-dependence of habitat selection and help to mate mechanisms underpinning the expansion of ungu-
explain the observed pattern of niche differentiation lates into new habitats provides a complementary
(Morris 1992, Sj€ odin et al. 2018). One caveat to this perspective on how density-dependent habitat selection
interpretation is that owing to the short duration of our and niche expansion occur at the individual level. Pre-
movement data, we could not conclusively determine vious studies have also found that ungulates often vio-
whether this individual differentiation arose from fixed late the assumptions of the ideal free distribution (van
phenotypic differences among individuals or within- Beest et al. 2014). Although not designed to test such
individual plasticity over timescales longer than our models, our study suggests that waterbuck conform
measurements (e.g., frequent movement across habitat broadly to the ideal despotic distribution or the pre-
boundaries with facultative behavioral adjustments to emptive model of habitat selection (Fretwell and Lucas
the habitat occupied at any given time). Our demo- 1969, Pulliam and Danielson 1991, Beckmann and Ber-
graphic data suggest that individuals may move ger 2003). Individuals do not move into savanna at ran-
between savanna and floodplain depending on age and dom; rather, pre-reproductive females, lone males, and
reproductive stage; however, the GPS data did show bachelors were more likely to occupy savanna, perhaps
that most individuals remained either in the floodplain because they are competitively excluded from the
or in savanna for at least two consecutive weeks, and we higher-quality floodplain. These individuals may incur
consider it likely that habitat affiliations are relatively fitness costs by virtue of occupying a lower-quality
stable on seasonal or annual timescales. habitat during development and/or by having fewer
Our findings from a naturally occurring tropical ante- breeding opportunities outside of the high-quality
lope population contribute to a larger body of research floodplain territories—but may also be making the best
on density-dependent processes in ungulates, much of of a bad situation by trading short-term reproductive
which has focused on high-latitude species (often cervids) opportunities for future ones.You can also read