An installation of interactive furniture
←
→
Page content transcription
If your browser does not render page correctly, please read the page content below
An installation
of interactive furniture

                                                                  by O. Omojola                B. Schoner
                                                                     E. R. Post                P. R. Russo
                                                                     M. D. Hancher             R. Fletcher
                                                                     Y. Maguire                N. Gershenfeld
                                                                     R. Pappu

We report on a project that explored emerging                    power into everyday objects such as clothing and fur-
technologies for intuitive and unobtrusive                       niture. There have been some projects such as the
information interfaces in a compelling setting. An
installation at the Museum of Modern Art, New                    Brain Opera 1,2 that cross the boundaries of individ-
York, was part of a public exhibit and included                  ual, small-scale demonstrations and have explored
an interactive table that presented information                  the issues of interconnecting these disparate pieces,
associated with the exhibit to the gallery visitors              but these have been few and far between.
without visible conventional computing elements.
The enabling devices included noncontact
sensing of low-cost tags in physical icons,                      Based on common interests in the potential appli-
electrostatic detection of hand location in three                cation of these technological goals, the Museum of
dimensions, and sensor fusion through                            Modern Art (MoMA), New York, and the MIT Me-
lightweight Internet Protocol access.                            dia Laboratory agreed to a collaboration driven by
                                                                 the desire to increasingly use technology in their ex-
                                                                 hibits without making aesthetic concessions. Their
                                                                 main motivation was to use smart spaces 3 in museum
                                                                 exhibits, without the obvious elements of the asso-
                                                                 ciated computing. They offered a very useful error

A     dvances in computing technology and the ad-
      vent of the Internet have brought about dra-
matic increases in the amounts of information avail-
                                                                 metric that is lacking in a laboratory: a very high aes-
                                                                 thetic sensibility. In many Media Lab demonstra-
                                                                 tions, the visual appearance is a distant second to
able to people. However, the interfaces used to                  the functionality of the technology. The museum was
handle this information have not changed much with               unwilling to compromise the appearance of the ex-
time: the mouse, the keyboard, and the computer                  hibit spaces as a result of any such limitations.
monitor, connected to a box containing the proces-
sor and its peripherals. The mouse and the keyboard              The collaboration centered on the Un-Private
are nonintuitive interfaces. Touch-typing, as an ex-             House, an exhibition of architectural projects that
ample, is a skill that takes significant experience or           offered interesting blends of public and private
training to acquire, because the layout of the stan-             spaces. A significant amount of information about
dard computer keyboard groups letters in a nonin-                the projects was in electronic form, and, tradition-
tuitive fashion. Also, the boxes for the processor and           ally, this information is presented through computer
the monitors have, over time, gotten smaller, qui-
eter, and cheaper, but are essentially the same, typ-
                                                                 娀Copyright 2000 by International Business Machines Corpora-
ically unsightly, and occupy visible space. More im-             tion. Copying in printed form for private use is permitted with-
portantly perhaps, they cut users off from the rest              out payment of royalty provided that (1) each reproduction is done
of the world: sitting in front of a computer often               without alteration and (2) the Journal reference and IBM copy-
means ignoring the surrounding environment.                      right notice are included on the first page. The title and abstract,
                                                                 but no other portions, of this paper may be copied or distributed
                                                                 royalty free without further permission by computer-based and
Much technology has been developed in disparate                  other information-service systems. Permission to republish any
pieces to enable the vision of embedding computing               other portion of this paper must be obtained from the Editor.

IBM SYSTEMS JOURNAL, VOL 39, NOS 3&4, 2000     0018-8670/00/$5.00 © 2000 IBM                                        OMOJOLA ET AL.      861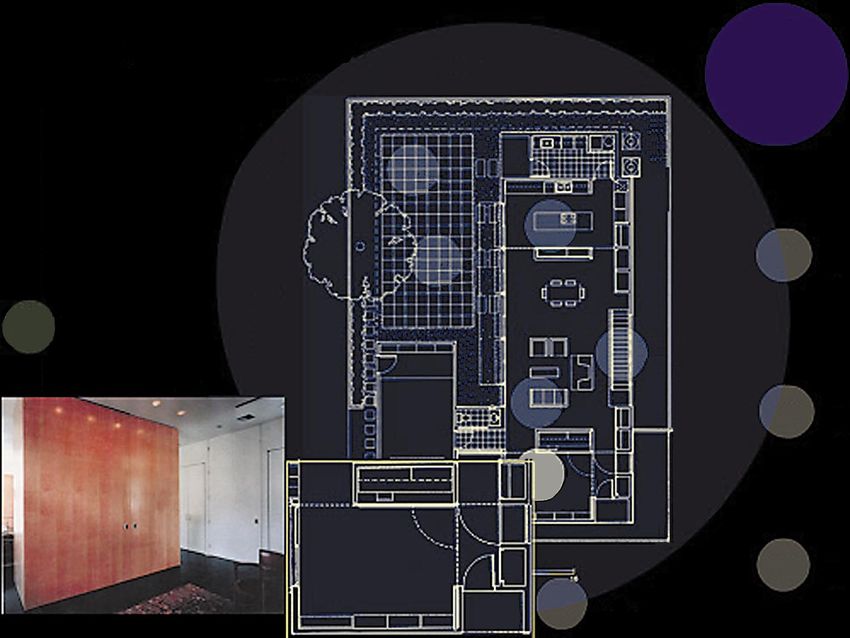
kiosks placed away from the exhibit. The curator,           Another of the initial ideas had the welcome mat
      Terence Riley, and the exhibition’s production man-         track the motion of people across it and respond to
      ager, Andrew Davies, were eager to have this infor-         this in some way. This was first tried using a mat with
      mation presented to the exhibit’s visitors within the       electric-field-sensing electrodes and a projected im-
      rich context of the exhibit itself. They wanted to spark    age that followed the path of the person walking
      more social interaction and discussion, and wanted          across it. Issues of robustness for this tracking
      the space to react to the presence of the visitors.         method caused this idea to be dropped as well.

      These ideas had elements in common with much of             Of some interest is the fact that in the final design
      the work done within the Media Lab on smart                 the tracking methods used were the same, but used
      spaces 3 and provided a very interesting environment        for different applications: the interactive table inter-
      to apply much of our technology. From the begin-            face used electric-field sensing, whereas the welcome
      ning there were a number of significant design ob-          mat installation used a vision-based system.
      jectives. There obviously could not be any exposed
      technology, since the clash with the appearance and         There was a significant amount of information to be
      layout of the rest of the exhibit would detract from        displayed, and there were both human resource lim-
      the museum experience. The museum wanted the                itations and a lack of interest in content development,
      technology to be used in ways that enhanced con-            editing, and formatting for the project. MoMA and
      ventional functions within the home (as an exam-            NearLife, Inc., a Boston-based interactive entertain-
      ple, the interactive welcome mat, described later, is       ment company, handled those functions as well as
      not so much a new idea, but an enhancement of the           the purchase, setup, and maintenance of the com-
      traditional welcome mat). The installation needed           puters that drove the various parts of the installa-
      to be reliable enough to handle the crowds of mu-           tion.
      seum visitors without permanent supervision. Finally,
      the information to be displayed was in a range of           Overview
      formats that included text, images, and video, and
      the chosen interface had to provide display and             The gallery arrangement for the Un-Private House
      browse access to all of these in a straightforward fash-    was modeled after a house, with sections of the gal-
      ion.                                                        lery and the associated furniture imitating the var-
                                                                  ious rooms and functions present in a house. The
      During one of the visits Terence Riley paid to the          exhibit had 26 architectural projects on display, and
      Media Lab, he was exposed to the work of Hiroshi            there were models and other display pieces for each
      Ishii on tangible interfaces 4 and was led to an in-        house distributed throughout the gallery on the ta-
      terest in similarly tactile interfaces. Given the de-       bles and other pieces of furniture. Figure 1 shows
      sire for a simple, intuitive interface, the first propos-   the layout of the gallery, with the entrance to the
      als planned to use a tagged object as a physical icon       gallery in the upper right corner and the dining ta-
      to start the display of information.                        ble as a round gray and white circle in the lower left.

      A dining table offered the most potential as the phys-      The interactive installation consisted of two parts.
      ical surface on which the information would be dis-         The first part was the interactive welcome mat sta-
      played. It also had the added benefit of both sym-          tioned at the gallery entrance, as shown in Figure 2.
      bolizing, and providing a good framework for, the           An image of a traditional welcome mat appeared on
      kind of social interaction that was desired.                the floor outside the entrance, and the image moved
                                                                  in response to the motion of the visitors across it.
      Initially, a vision-based system similar to that de-
      signed by Flavia Sparacino and Kent Larson for the          The main part of the installation was the interactive
      Unbuilt Ruins exhibit at the MIT Compton Gallery 5          table, built around the gallery’s dining table. The ta-
      would track the position of various objects on the          ble was an 8-foot-diameter, five-legged table with a
      table. The user could place these at certain points         solid-white, 3/4-inch-thick Corian** surface that
      on the table to interact with the information. This         seated eight people. Each of the eight place settings
      idea was abandoned because of concerns about a              featured a display projected from above that was 18
      cluttered interface that would be confusing or require      inches wide by 14 inches high on the tabletop. In the
      extensive supervision to prevent people from walk-          center of the table was a 5-foot-diameter lazy Su-
      ing away with the objects.                                  san, also made of solid white Corian, with recessed

862   OMOJOLA ET AL.                                                              IBM SYSTEMS JOURNAL, VOL 39, NOS 3&4, 2000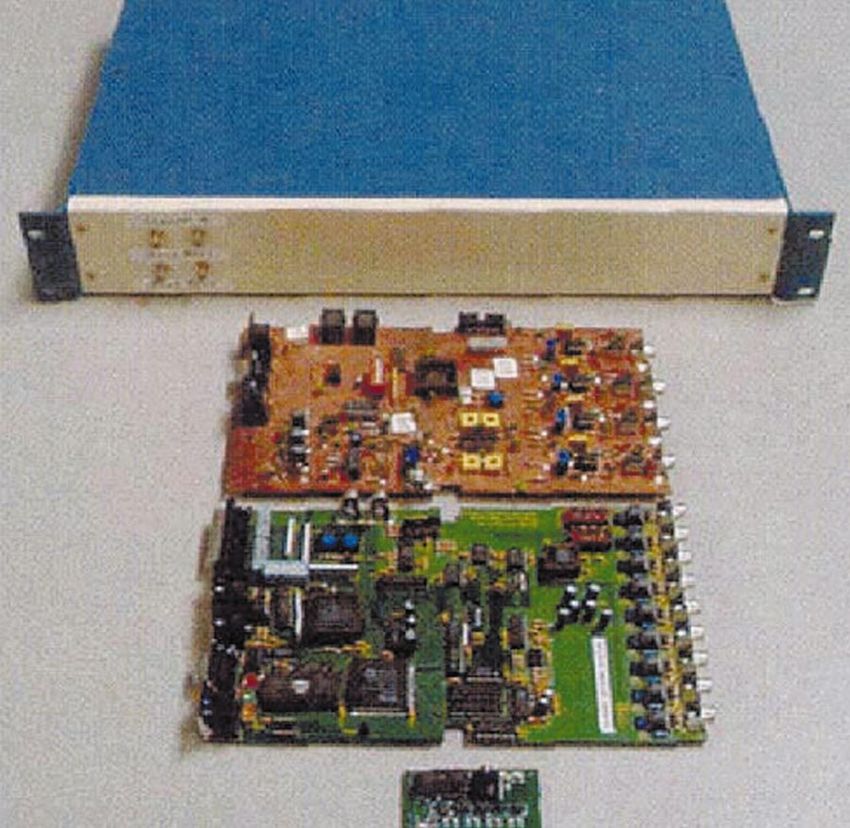
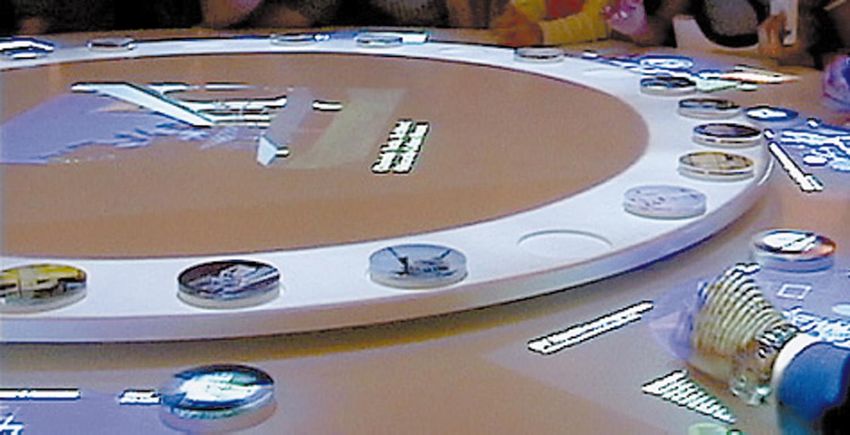
Figure 1   The Un-Private House gallery floor plan        Figure 2   Welcome mat

                                                          Figure 3   Photograph of default place setting
holes on its outer edge. Placed in these indentations
were a set of 26 coasters (one in each indentation)
with an image of a different architectural project on
the face of each coaster. The outer edge of the lazy
Susan was illuminated with a number of fiber optic
light sources from the drop ceiling above (which also
served as the projector housing), and there was a top-
projected display above it.

The interface presented by an inactive place setting
is shown in Figure 3, with the blue circle in the up-
per right corner displaying the words “Place coaster
here to begin.” A pictorial animation of picking a
coaster and placing it on the active spot was peri-
odically displayed in the center of each place setting.

After the user chooses a specific coaster from the
lazy Susan and places it over the blue circle, the dis-   it to the center. When the user touched the “send-
play changes to show a floor plan of the project in       to-center” hot spot, the associated image was pro-
traditional blue print. Highlighted on the display are    jected onto the center of the lazy Susan, facing that
a number of “hot spots,” places within the specific       user. Another user at the table interested in looking
house with information that may be of interest to         at the image could rotate the lazy Susan, which would
the user. When a hot spot is touched the associated       cause the image to also rotate. Comments about the
information is displayed in the lower left corner, as     exhibit entered on the museum’s Web site by the pub-
shown in Figure 4. This information included text,        lic were displayed in the center of the table when
images, and animations that showed interesting parts      not in use by any of the place settings. The lazy Su-
of the house, comments from the museum curator,           san with a projected image is shown in Figure 5.
the house’s architect, and the client, as well as in-
formation about the technology used to build the ta-      The remainder of this paper is organized as follows.
ble itself.                                               The next section describes the welcome mat instal-
                                                          lation and its use of computer vision technology.
Depending on the content, an extra hot spot would         Then, the physical icons used in the dining table ex-
appear that allowed a user who wished to share a          hibit are described and the use of noncontact sens-
certain image with the other users at the table to send   ing technology. The following section focuses on the

IBM SYSTEMS JOURNAL, VOL 39, NOS 3&4, 2000                                                            OMOJOLA ET AL.   863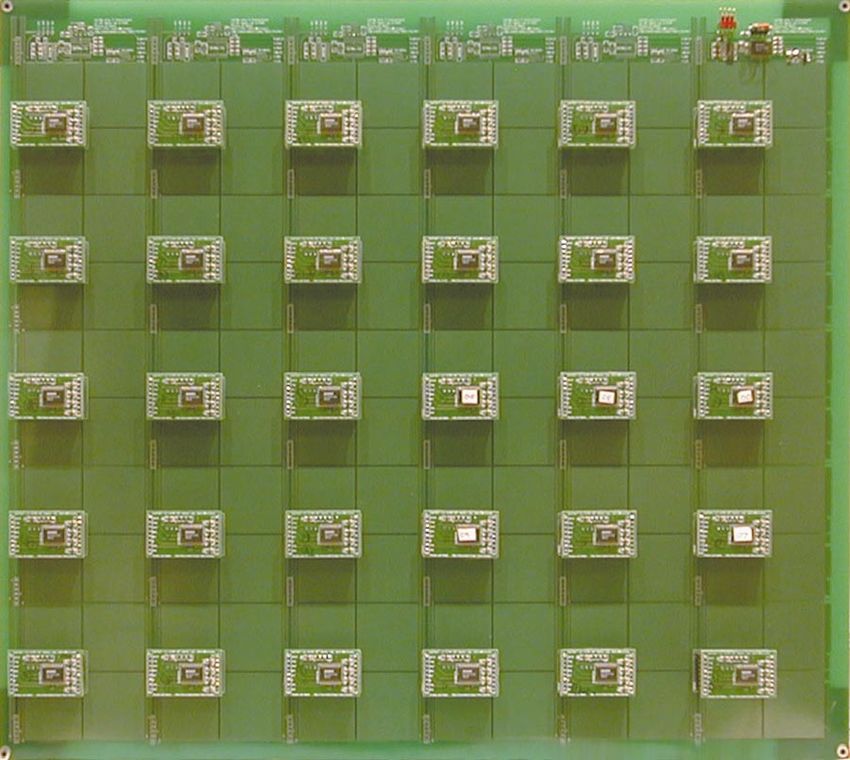
Figure 4   Photograph of activated place setting

                                                                                                                                            Place
                                                                                                                                            coaster
                                         Shorthand House                    Francois de Menil, Architect                                    here to
                                                                                                                                            begin

                               Shorthand Foyer
                               The open plan of the Shorthand House
                               allows one room to flow into another.
                               However, pivoting doors and sliding panels           Courtyard
                               can transform the space, revealing a work
                               area that can be closed off as a private
                               study.
                               With its sliding and pivoting partitions,                                      Kitchen                       Curator
                               the Shorthand House reflects the word                                                                        Viewpoint
                               play between the French word for office,                Windows
                               cabinet, and the English sense of the
                    Send to    same word, which refers to a piece of
                    center     furniture with sliding drawers and
                    of table   pivoting doors. In the architect’s words,                                                  Second
                               “What defines one space from another                                                       Floor
                               are things that move.”

                                                                                                                                            Architect
                                                                                                           Living Room                      Viewpoint

                                                                                                           Shorthand
                                                                                                           Foyer

                                                                                                                                            Client
                                                                                                                                            Viewpoint

                                                                                                               Play Animation

      gestural interface and the use of electric-field sens-                              at the entrance to the gallery and consisted of an im-
      ing for enabling the use of the human hand as a point-                              age projected from the ceiling that responded to the
      ing device. Next, the lazy Susan installation is                                    motion of the visitors as they walked across it. A sim-
      described including the mechanism, based on                                         ilar installation is reported in Reference 6.
      quadrature encoding, for sensing its speed and di-
      rection of rotation. A section follows describing the                               As noted earlier, the original design called for elec-
      local area network and its role in the communica-                                   tric-field sensing as the core technology supporting
      tion infrastructure for the installation. The follow-                               the welcome mat application, whereas computer vi-
      ing section on system software describes the browser-
                                                                                          sion was used as the gesture-sensing technology for
      based client software for displaying the information
                                                                                          the dining table. However, further reflection led us
      on the various exhibits. A brief description of the
                                                                                          to implement the gesture detection using electric-
      display hardware setup is given in the next section.
      The final section summarizes the lessons learned                                    field sensing, and to use the computer vision for the
      from this project.                                                                  welcome mat.

                                                                                          The schematic drawing of the installation is shown
      Welcome mat
                                                                                          in Figure 6. A video camera and a projector were
      The interactive welcome mat was included in the in-                                 arranged in an approximately coaxial configuration
      stallation to give visitors a hint of what they were                                directly above the projected area. The camera de-
      about to encounter inside the gallery. It was installed                             tects changes in the visual field, changes caused by

864   OMOJOLA ET AL.                                                                                                   IBM SYSTEMS JOURNAL, VOL 39, NOS 3&4, 2000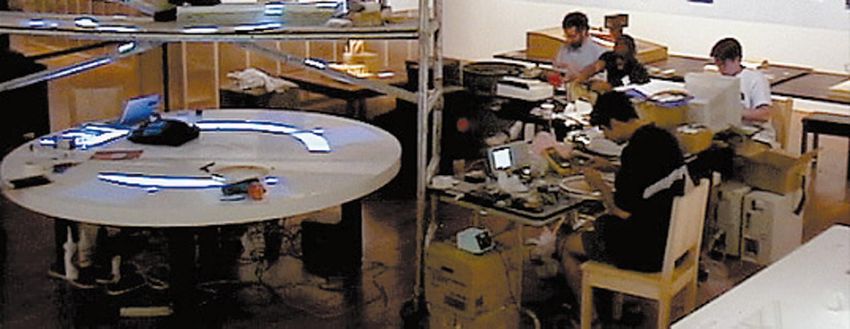
Figure 5 Photograph of lazy Susan with projected image
visitors moving across the carpet, and presents these
Figure 6 Schematic of the welcome mat installation
changes to a simple physical model.
The physical model behind the interactive image is
based on an MⴱN lattice of unit masses, all located CAMERA PROJECTOR
above a reference plane. Each mass is connected to
the reference plane by a spring with a spring con-
stant K and a damping constant D. The input image
from the projector is averaged down to a resolution
of MⴱN.
As a visitor moves across the area of the mat, a mass FLOOR
proportional to the difference between the images
of two adjacent frames is created in a second plane
located above the lattice. This additional mass grav-
itationally attracts the unit masses and causes them Here the mass m is unity, a is the acceleration ex-
to move toward regions of activity in the lattice. Fig- perienced by the mass, F g is the force due to gravity,
ure 7 shows a representative image of the lattice of F s is the restoring force, and F d is the force due to
masses. The image activity causing the distortion is damping. Furthermore,
in the upper right corner, and the red dots are the
individual masses. Gm
Fg ⫽ ⫺
R
The equation representing the dynamics of the phys-
ical model is: where G is a gravitational constant and R is the dis-
tance of the mass from its reference location. The
exponent controls the interaction distance and thus
ma ⫽ Fg ⫺ Fs ⫺ Fd the range that the masses move. Short-range inter-
IBM SYSTEMS JOURNAL, VOL 39, NOS 3&4, 2000 OMOJOLA ET AL. 865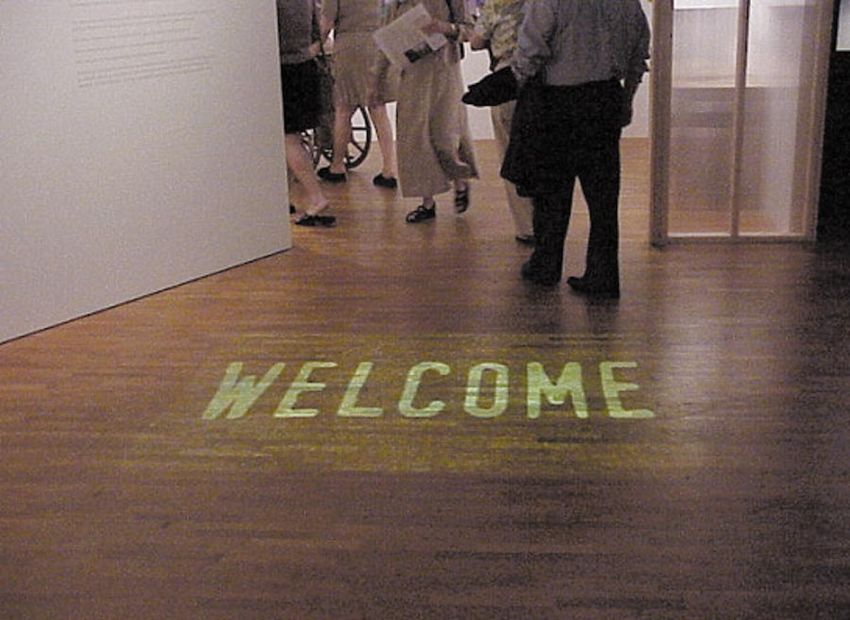
where ⌬t is the time difference between each posi-
Figure 7 Image of the welcome mat showing image
activity and the unit mass lattice
tion (which we arbitrarily chose to be unity). An iden-
tical derivation can be performed for the change in
position in the y direction.
The final image of a welcome mat is texture mapped
onto the distorted lattice of unit masses and rendered
using OpenGL**. Figure 8 depicts the data pipeline
of the welcome mat system.
Physical icons
The coasters serving as physical icons are depicted
in Figure 9. The person holding the coaster, and only
that person, has access to the information on the as-
sociated exhibit. Each coaster is approximately 3.5
inches in diameter, 0.75 inches thick, and is made
of a hollowed-out Corian base and a clear acrylic cap.
An image of the associated exhibit is attached to the
bottom of the cap, as shown in Figure 9.
One component of the tagging system used to iden-
action requires a higher value of than a longer range tify the coasters and retrieve the associated data is
one. a radio frequency identification device (RFID) tag em-
bedded in the coaster. The tag, shown in the fore-
Fs ⫽ ⫺Kx ground of Figure 9, is a simple LC (inductor-capac-
itor circuit) resonator built from a 3-inch diameter
where K is the spring constant, x is the distance the printed copper coil and a ceramic chip capacitor sol-
spring is extended, and dered onto the coil. Using the same coil size with a
different capacitance for each coaster results in res-
Fd ⫽ ⫺Dv onant frequencies ranging between 5.4 MHz and 13.2
MHz, in increments of 300 kHz. When compared
where D is the damping constant and v is the ve- with conventional silicon RFID tags, our tags have
locity of the mass. lower cost and are easier to replace. The 300-kHz
value chosen for the resonant frequency separation
Thus takes into account the manufacturing tolerances of
the capacitors and the safety margins desired.
Gm
ma ⫽ ⫺ ⫹ K共 x ⫺ xr兲 ⫹ Dv Each place setting at the table is equipped with a
R tag reader as shown in Figure 10. The tag reader,
whose design is based on a design developed at the
where x r is the reference point for the system (cho- Media Lab, 7 measures 6.5 inches wide by 5 inches
sen to be 0 for the ensuing derivation). This equa- long, and is located underneath the upper right cor-
tion may be solved numerically using a method of ner of the display area at each place setting. The
differences to yield the new position ( x t⫹1 ) of each reader is mounted above the tauFish electrode ar-
mass in terms of its current position ( x t ) and its po- ray in order to minimize signal losses through the
sition 1 time period earlier ( x t⫺1 ) and this is given copper electrodes. (The tauFish array is described
by in the next section.)
xt⫹1 ⫽ 冉 D
⫹
K
m⌬t m共⌬t兲 冊 冉
2 ⫹ 2 xt ⫹
D
m⌬t
⫺ 1 xt⫺1 冊 The tag reader operates in a frequency range be-
tween 5 MHz and 40 MHz, because tags operating
冉冊 2 in this range are relatively cheap, and the transmit
G 1 antenna can be implemented as a single-turn coil
⫺
R ⌬t etched onto the printed circuit board. The tag reader
866 OMOJOLA ET AL. IBM SYSTEMS JOURNAL, VOL 39, NOS 3&4, 2000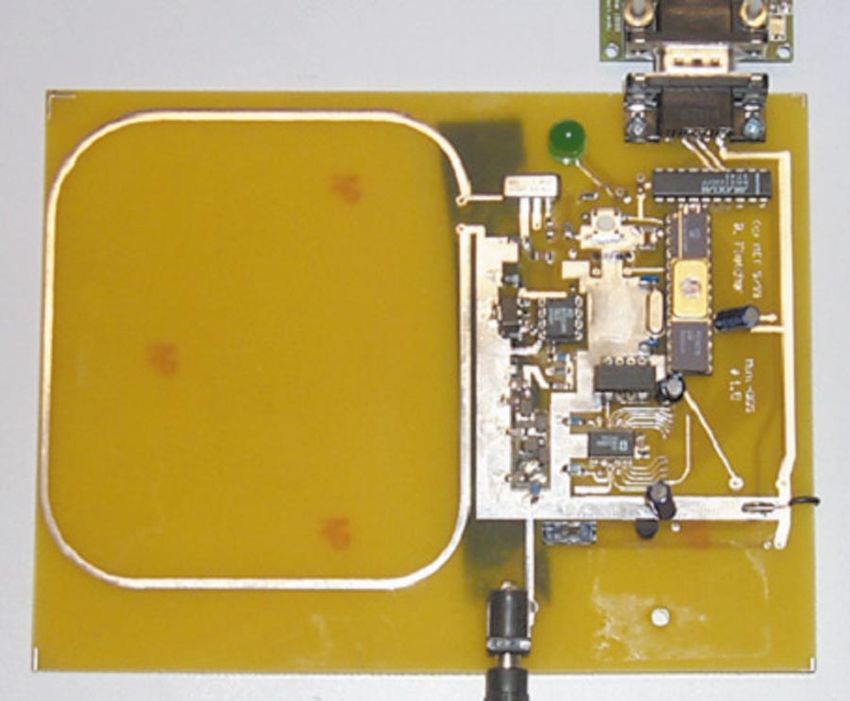
Figure 8   Functional block diagram of the welcome mat system

                                             PHYSICAL                 OPEN GL
                CAMERA                        MODEL                  RENDERING                  PROJECTOR

Figure 9   Photograph of the coasters with an exposed           Figure 10   Photograph of the tag reader
           resonator in the foreground

is powered by a 9-volt power supply. Access to the
measurement data is through an RS-232 serial port.

The functional block diagram of the tag reader is
included in Figure 11. The design is based on a                 frequency a dip in the reflected power results. This
PIC16C76 microcontroller. The frequency is generated            method of detection eliminates the need for a broad-
by a single direct digital synthesis (DDS) device, able         band tuned antenna, and because the antenna is
to generate any frequency from DC up to 60 MHz                  untuned, the tag reader is immune to spurious
using a lookup table and a digital-to-analog con-               responses caused by stray reactance in the environ-
verter. The output of the DDS is passed through a               ment.
four-pole low-pass filter to remove the higher-order
alias frequency harmonics, and the filtered signal is           The directional coupler’s output is rectified by a di-
then amplified by a fast operational amplifier.                 ode detector and the signal is sampled by the analog-
                                                                to-digital converter built in the microcontroller. The
The presence of a resonator is detected by a 50 ⍀               microcontroller scans the output range of the DDS
directional coupler designed to measure antenna                 device, from 5.4 MHz to 13.3 MHz in increments of
loading. In this configuration, the untuned single-             100 kHz, and records an 8-bit sample at each fre-
turn antenna presents an unmatched load and the                 quency. The sampled data are transmitted through
reflected power is channeled through the directional            the serial port as 80-byte data packets. A sampling
coupler output. When a resonant structure is placed             cycle of 105 milliseconds was found adequate.
within range of the antenna, however, the imped-
ance of the resonator dominates the response. More-             The serial port output is connected directly to a Fil-
over, when the frequency signal equals the resonant             ament card (described later in the subsection on net-

IBM SYSTEMS JOURNAL, VOL 39, NOS 3&4, 2000                                                                  OMOJOLA ET AL.   867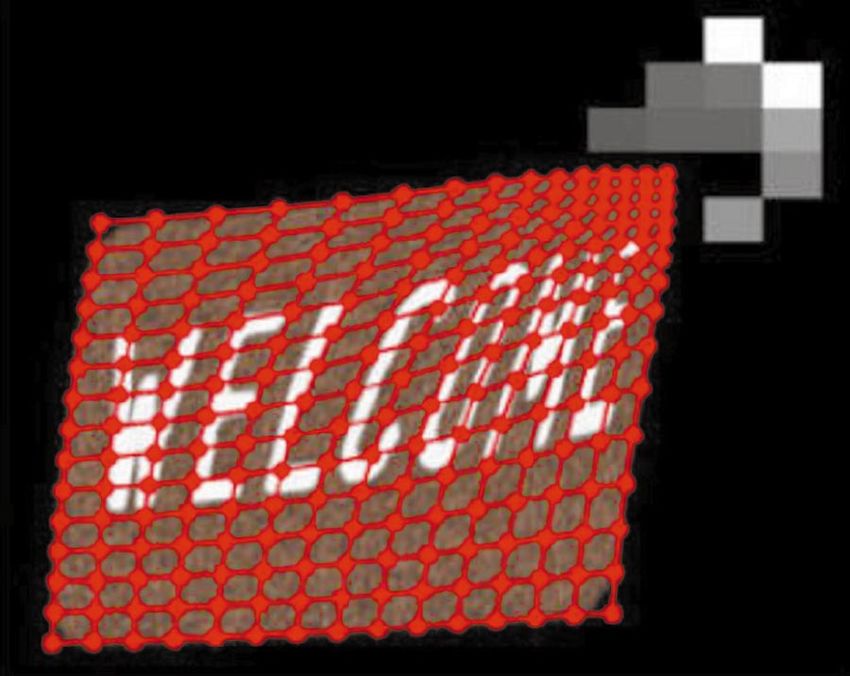
Figure 11    Functional block diagram of the dining table installation

                                                                    EIGHT MORE CONTENT                               EIGHT MORE
                                                                    BROWSER COMPUTERS                                PROJECTORS

                                                     CLOSET
                                                    NETWORK
                                                      HUB

                                                                          COMPUTER
                                                                                               WEB BROWSER

                                                                                JAVA/                                             HTML

                                                                                                 JAVASCRIPT & JAVA
                                                                             JAVABEANS
                                                                                                                               DHTML
                   SEVEN MORE
                  PLACE SETTINGS                                                                                                  CSS
                                                                              TAUFISH
                                                                               DATA
                                                                            PROCESSING
                                                                                                                                  TEXT
                                                     TABLE
                                                    NETWORK
                                                      HUB                                                                      IMAGES

                                                                                                                                  VIDEO

            ONE PLACE SETTING

             FILAMENT                                          FILAMENT

               CS8900A ETHERNET CONTROLLER                       CS8900A ETHERNET CONTROLLER                                DOWN-FACING
                                                                                                                                NEC
                                                                                                                               VIDEO
                                                                                                                             PROJECTOR
                  PIC16C76 MICROCONTROLLER                         PIC16C76 MICROCONTROLLER

             TAG READER                                        TAUFISH ARRAY                                                       SLAVE SX18AC-50
                                                                                                                                      (30 TOTAL)
                       PIC16C76 MICROCONTROLLER                             SCENIX SX18AC-50 MICRO                       ELECTRODES
                                                                               (CONCENTRATOR)                            (120 TOTAL)

               DIODE DETECTOR             AD9850 DDS

                     TDC-10-1 DIRECTIONAL COUPLER

                                ANTENNA

                           COASTER (LC TAG)                                                USERS’ HANDS

868   OMOJOLA ET AL.                                                                          IBM SYSTEMS JOURNAL, VOL 39, NOS 3&4, 2000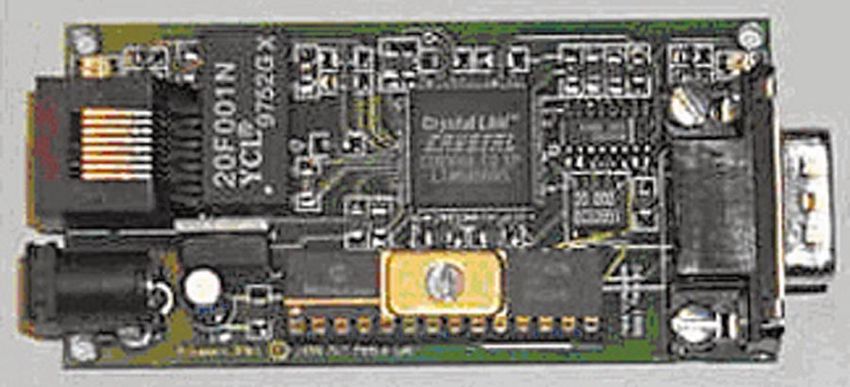
Figure 12   Tag reader interpreter and data visualization

work infrastructure), which broadcasts the data on          against the contents of the database file. The data-
the local Ethernet network. Remote computers con-           base file contains pairs of numbers: the first value
nected to the network take the data off the network         in each pair is a tag number; the second value is the
and run the data through a tag reader interpreter           associated centroid value. The closest match to the
program, running as a background process.                   calculated centroid is found, and this identifies the
                                                            information content to be called up (or switched off).
The interpreter, whose graphical user interface is          A simple state machine allows the interpreter to track
shown in Figure 12, is written in Java** and takes          only updates (i.e., changes in the tag reader’s data
the following input parameters: the TCP/IP (Trans-          that indicate either introduction or removal of a tag
mission Control Protocol/Internet Protocol) port            from the area of the antenna). The interpreter, upon
number the Filament transmits to the port number            detecting an event, sends a data packet to the ap-
on which the Filament receives, the network address         propriate place setting’s display system software,
of the machine running the specific place setting’s         which takes the appropriate action (either loading
display system software, and the port number on             or unloading a particular project’s information).
which the system software listens for updates. The
mapping between tags and exhibits is specified in a         Gestural interface
file accessible to the interpreter.
                                                            To maintain the illusion of direct interaction with
The interpreter receives the broadcast data originat-       a projected image, we chose a form of electric-field
ing at the tag reader and filters the data using a four-    sensing (EFS) 8 to determine the position of the us-
tap wavelet filter. The filter is needed to compen-         er’s hand over the image. The musical instrument
sate for certain hardware limitations in the tag            known as the Theremin 9 is a classic example of an
reader, remove environmental noise, and eliminate           EFS device. Invented in 1917 by Lev. S. Theremin,
the DC bias added by the analog-to-digital converter.       this eponymous instrument senses small variations
The output of the filter is a 76-point sequence scaled      in the capacitance of two antennae induced by the
between 0 and 15. The centroid of this sequence is          user’s body and converts these measurements to an
calculated and the resultant number is checked              audible form.

IBM SYSTEMS JOURNAL, VOL 39, NOS 3&4, 2000                                                          OMOJOLA ET AL.   869
ronments, including the gymnotiforms and mormyri-
      Figure 13   Four generations of electric-field-sensing
                  instrumentation
                                                                 formes). It consisted of two transmitters, four pro-
                                                                 grammable-gain receivers, and a microcontroller
                                                                 equipped with MIDI (Musical Instrument Digital In-
                                                                 terface) and RS-232 serial interfaces used for data
                                                                 acquisition. The second system (SmartFish) incor-
                                                                 porated two transmitters, eight programmable-gain
                                                                 receivers, a fast 8-channel analog/digital (A/D) con-
                                                                 verter, and a 32-bit, 20-MHz DSP used to perform
                                                                 synchronous detection in software. This complex de-
                                                                 sign was ultimately abandoned because of its sen-
                                                                 sitivity to weak fringe fields and, more importantly,
                                                                 to its own digital noise.

                                                                 The most recent design, named LazyFish and shown
                                                                 as the smallest board in Figure 13, represents a shift
                                                                 in our design of synchronous EFS instrumentation.
                                                                 Instead of using a powerful DSP and several configu-
                                                                 rable analog input stages, the LazyFish incorporates
                                                                 a simple microcontroller, four transmitters, two
                                                                 fixed-gain receivers, and a synchronous undersam-
                                                                 pling algorithm implemented in firmware, a design
                                                                 which outperforms the earliest Fish boards in speed,
                                                                 sensitivity, and simplicity.

                                                                 In the quest for an even simpler EFS sensor we es-
      In this section, we describe the instrumentation and       chewed synchronous detection, choosing instead to
      algorithm used to detect the user’s interaction with       implement time-domain measurement of capacitive
      an image projected onto a surface. The instrumen-          loading. The resulting module, known as the tauFish
      tation is based on the tauFish capacitive sensor (de-      and shown in Figure 14, is even smaller than its pre-
      scribed below). Capacitance is measured at points          decessors, and controls four channels in a loading-
      uniformly covering the image region. The measured          mode measurement.
      capacitance vector is then compared to vectors cal-
      culated using a forward electrostatic model, which         The 5 ⫻ 6 array of tauFish modules positioned un-
      we describe. The calculated vectors are the charge         derneath each place setting, as shown in Figure 15,
      or capacitance distributions expected when the us-         measures 18 inches by 16 inches. Each unit senses
      er’s finger is placed at various points on the image       the capacitance of four 1.5-inch-by-1.5-inch elec-
      surface. These finger locations are referred to as “hot    trodes. The units are connected by a multidrop se-
      spots.” If sufficient total capacitance is observed over   rial bus attached to a microcontroller located on the
      the entire image, then the calculated vector most          array board. The microcontroller sequences the sens-
      closely matching the observed vector indicates the         ing and readout operations of the tauFish units and
                                                                 produces a sensor data stream. The entire array
      user’s interaction with a particular hot spot.
                                                                 board outputs data at 115 Kb/s, and full frames of
                                                                 data are generated at a rate of about 10 Hz (where
      Our early work with EFS 10,11 employed synchronous         a full frame of data is a 24-bit value for the capac-
      detection to measure the perturbation of weak, qua-        itance measurement for each one of 120 electrodes).
      si-static (50 –500 kHz) electric fields. The evolution
      of the EFS hardware is shown in Figure 13. The first       The physical model underlying the EFS application
      prototype transmitted on two electrodes, received          is a forward model 12 of induced charge on the elec-
      on one electrode and comprised several boards’ worth       trodes. Consider the case of a point charge above
      of hand-wired analog circuitry tucked into a 19-inch       an infinitely conducting plane. If a charge q is lo-
      rack-mount cabinet. The first production-level sys-        cated at ( x, y, z), then the method of images can
      tem was dubbed the Fish (named after the aquatic           be used to find the electric field at the surface of the
      animals that use electric fields to sense their envi-      conducting plane. Since the plane is considered a per-

870   OMOJOLA ET AL.                                                             IBM SYSTEMS JOURNAL, VOL 39, NOS 3&4, 2000
Figure 14 Top and bottom views of four-channel tauFish
fect conductor, there will be no transverse field, and
Figure 15 tauFish array with 30 tauFish (120 electrodes)
the perpendicular electric field will be determined
by the presence of the charge above the plane and
its inverse reflection below the plane. The electric
field at a position ( x , y , 0) will be
qz
Ez ⫽
2 r 3
qz
⫽
2 关共 x ⫺ x兲 ⫹ 共 y ⫺ y兲 2 ⫹ z 2兴 3/ 2
2
where is the electric permittivity.
Integrating this field over an infinitesimal Gaussian
“pillbox” at the surface gives the surface charge den-
sity :
冕 dV ⫽ 冕 ជ dV
ⵜ䡠D
Q⫽ 冕 ជ
E 䡠 dA
Now assume that (infinitesimal) square electrodes
tile the plane. The induced surface charge for each
⫽ Ez A electrode will be
Q
A
⫽ Ez Q⫽ 冕 冕
x0⫹␦x
x0
y0⫹␦y
y0
共 x, y兲dxd y
⫽
qz
2 关共 x ⫺ x兲 ⫹ 共 y ⫺ y兲 2 ⫹ z 2兴 3/ 2
2
⫽
q
2
arctan 冋 共 x0 ⫺ x兲共 y0 ⫺ y兲
z 冑共 x0 ⫺ x兲 2 ⫹ 共 y0 ⫺ y兲 2 ⫹ z 2 册
IBM SYSTEMS JOURNAL, VOL 39, NOS 3&4, 2000 OMOJOLA ET AL. 871Figure 16 Electrode voltage vs time during tauFish capacitance measurement cycle. The first plot is measuring the
parasitics and the electrode self-capacitances. The second plot is measuring the parasitics and the electrode-
hand capacitances.
Note that the charge q is only a leading term, while 1 ⫺ e ⫺t/ ⫽ 0.7
the surface charge distribution is shaped strongly by
z; when z is small, the distribution is narrow, and as to be t ⬇ 1.21
z increases the charge distribution broadens. The to-
tal charge varies linearly as the capacitance (Q ⫽ In this implementation, charge is transferred dur-
CV) and is proportional to the capacitive load due ing 40 nanosecond intervals (two instructions at an
to charge induction. execution rate of 50 MHz) through a 2M⍀ resistance.
Since the charging time is linear in C, we find that
The tauFish measurement strategy is deceptively one current pulse corresponds to charging a capac-
simple. One pin of a microcontroller is alternately itance of
charged and discharged by using a second pin to
pulse a voltage source through a known resistance
R. The first pin is also attached to an electrode that ␦ t 共40 ⫻ 10 ⫺9s兲
C⫽ ⫽ ⫽ 2 ⫻ 10 ⫺15F
serves as the capacitance C under test. The CMOS R 共2 ⫻ 10 6⍀兲
(complementary metal-oxide semiconductor) input
at the pin is configured to have hysteretic thresholds or 20 femto-Farads. Because this measurement is
at 0.3V DD and 0.7V DD (where V DD is the positive sup- done in the time domain with minimal analog cir-
ply voltage of the microprocessor). The electrode cuitry (i.e., one additional resistor), its precision de-
charging cycle covers the range [0 . . . 0.7V DD ], pends on the stability of the clock as well as the mi-
while the discharging cycle covers the range croprocessor’s timing jitter. The measurement can
[V DD . . . 0.3V DD ]. The capacitor voltage evolves in be made arbitrarily precise by averaging several mea-
time as surement cycles. Figure 16 shows the voltage on an
electrode as it is charged and discharged during a
V ⫽ Ae ⫺t/ measurement cycle. Finally, to minimize the first-
order effects of 60-Hz noise that couples into the
where is the charging time constant ⫽ RC. It is measurement, the values of the charging and dis-
the measurement of this time constant that gives the charging cycles are summed.
tauFish its name. The charging and discharging
thresholds are as described above, so the measure- While it is simple to evaluate the forward electro-
ment time is found from static model going from a known set of charges to
872 OMOJOLA ET AL. IBM SYSTEMS JOURNAL, VOL 39, NOS 3&4, 2000Figure 17 Display of tauFish array data. The first image is the array’s response to the index finger touching the tabletop.
The second image is the array’s response to a palm touching the tabletop.
the induced surface charge on the plane, the gen-
eral case of the inverse problem is not so easily Figure 18 Lazy Susan aperture ring and sensor board
solved. Instead, we use a priori knowledge of the tar-
get activation regions or hot spots that represent hy-
perlinks in the presented content, and use the for-
ward model from above to predict an expected
induced charge distribution for each hot spot. Each
page of content specifies a list of hot spots by their
positions on the image plane. When a page is pre-
sented, the content browser transfers that page’s hot
spot list to the hot spot interpreter, a separate pro-
gram that receives tauFish array data and reports
activation events back to the browser. The hot spot
interpreter can also be used to display the sensor data
in real time, as shown in Figure 17. The intensity of
the large red squares in these images corresponds
to variations in capacitance, while the small purple
or green dots indicate hot spots (where green de-
notes a triggered hot spot).
To determine hot spot activation, the observed sen- Lazy Susan
sor data are normalized and linearly projected onto
the charge distributions calculated for each hot spot The sensing system in the lazy Susan (shown in sche-
by the forward model. This may be thought of as a matic form in Figure 19) consists of three parts: a
distance metric that ignores the total charge. If the sensor board, a reflective aperture ring, and an in-
best fit exceeds a certain threshold (or rather, the terface board. The sensor board, shown in Figure
angle between the observed and predicted charge 18, includes two Omron phototransistor/LED pairs
and a pair of AD790 comparators. The aperture ring,
vectors is less than a certain value) then the hot spot
also shown in Figure 18, is a perforated acrylic ring
is activated and an activation event is sent to the
with a reflective Mylar** coating, mounted on the
browser.
IBM SYSTEMS JOURNAL, VOL 39, NOS 3&4, 2000 OMOJOLA ET AL. 873lazy Susan, catching up only after the lazy Susan had
Figure 19 Schematic of lazy Susan installation
slowed significantly. Rather than trying to redisplay
the image for every aperture unit of motion, the lo-
cation of the lazy Susan at the end of a redraw was
INTERFACE BOARD identified and used as target for the next redraw. As
(UNDER TABLE)
a result, when the lazy Susan spun faster, the rota-
tion of the image was closer to the actual motion of
the lazy Susan and more pleasing to the eye.
SENSOR BOARD
(FIXED) Network infrastructure
The seventeen sensors used in the dining table in-
APERTURE RING stallation (eight tauFish arrays, eight tag readers, and
(ROTATES WITH LAZY SUSAN)
the lazy Susan sensor board) were connected to each
other and the controlling computers via an Ether-
net data network. A single Ethernet cable brought
network service to the table, and each sensor was
connected to the network by means of a custom-
underside of the lazy Susan. The sensor board is sta- made embedded network adapter, which we call the
tionary and its spacing below the aperture ring can Filament. The Filament represents the minimum
be adjusted with pieces of card stock. level of resources required to connect a device to
the network.
A schematic diagram of the sensing system opera-
tion is shown in Figure 19. The sensing system op- Despite the increasing ubiquity of data networks,
erates on the principle of quadrature encoding, us- most devices in the computing industry are still de-
ing the pattern of alternating reflective strips and signed for use with a single computer. Unfortunately,
nonreflective apertures caused by the rotation of the this model meshes poorly with the mounting demand
aperture ring. The two phototransistors on the sen- for delocalized information access and distributed
sor board are offset in space by half the distance be- processing. The Filament was designed to address
tween a reflective strip and a nonreflective aperture. those needs. It consists primarily of an Ethernet con-
troller (the CrystalLAN CS8900A) and a microcon-
The interface board consists of a PIC16F84 micropro- troller (the PIC16F876) that contains a minimal im-
cessor, a MAX202 serial line driver, and a voltage reg- plementation of UDP/IP, the User Datagram Protocol
ulator for the power supplied to the sensor board. over the Internet Protocol. When connected to an
The high/low outputs of the detectors are received arbitrary device (via a standard serial port) the Fil-
as digital inputs by the interface board, and a simple ament allows that device to communicate with any
state-machine-driven program in the microcontroller
other device or computer on the network.
determines the rate and the direction of rotation of
the lazy Susan.
This combination (Ethernet and IP) was chosen in
The output of the microcontroller is a string of “R” large part because it has become the de facto stan-
and “L” ASCII characters. An “R” is generated when dard for building-level networking. Computers can
the lazy Susan rotates through an angular distance communicate with Filament-enabled devices as eas-
of one aperture unit to the right, and an “L” when ily as they can communicate with other computers
the rotation is to the left. These data are transmit- on the network. No unusual protocols or expensive
ted to a Filament card and onto the network. A com- and cumbersome translation or gateway systems
puter in the back room receives the data packets and need to be used, as is the case with existing commer-
rotates the coordinates of the center image accord- cial offerings such as those of emWare. Furthermore,
ingly. because this system communicates directly using IP,
it is capable of easily interoperating with a wide range
In the course of testing the setup, it was discovered of networks and can benefit from the over 30 years
that the redraw time for the center image was slow of experience the networking industry has had in us-
enough for it to visibly lag behind the rotation of the ing that protocol.
874 OMOJOLA ET AL. IBM SYSTEMS JOURNAL, VOL 39, NOS 3&4, 2000For all those reasons, IP has recently gained accep-
Figure 20 Photograph of the Filament F3r3
tance as the appropriate protocol for embedded sys-
tems, and a number of engineers and companies have
introduced IP-compatible embedded products. These
existing devices fall broadly into two classes. Rep-
resentatives of the first class simply use IP as a packet-
data protocol on top of a traditional serial link, us-
ing SLIP (Serial Line Interface Protocol) or PPP
(Point-to-Point Protocol). However, a serial multi-
plexing system is still needed to connect a large num-
ber of devices. The second class of systems does use
Ethernet or another network technology as the phys-
ical transport layer. Unfortunately, the existing de-
vices tend to be bulky or overcomplicated, render-
ing them inappropriate for many simple embedded System software
applications. For this installation, what was needed
In designing the interactive dining table we wanted
was an extremely simple Ethernet/IP implementa-
to allow visitors seamless access to the multimedia
tion that could be used to connect the various de-
content within the exhibit environment. We wanted
vices.
to create a space where people without computer
skills could interact with the museum exhibit as flu-
The particular device we used, the Filament F3r3, idly and easily as they would with a piece of furni-
was designed to perform this function in an inexpen- ture or a book.
sive, highly scalable manner. The device itself has a
cost of between $10 and $20 per unit in large quan- In implementing the system software for the dining
tities, but the F3r3 is really an eight-wire device (pow- table we had three major constraints. First, time to
er, ground, two serial pins, and four Ethernet pins) completion for this part of the project was a short
and so the limit of simplification for the F3r3 is a couple of months. Second, since our group knew how
single eight-pin chip capable of connecting any se- to build hardware and software, but knew little about
rial device directly to the network. The device is authoring content, we needed to create a software
shown in Figure 20. environment that enabled the design company Near-
life to focus on content creation. Third, our system
Using an Ethernet/IP network to connect the var- software needed to interact with our sensing devices
ious devices offered a wealth of advantages over more over Ethernet in real time, by human perception
standards.
traditional serial multiplexing systems. Cabling was
trivial, and in particular there were none of the dis-
We chose to use an Internet browser as our software
tance constraints often associated with serial mul-
environment because of the built-in support for a
tiplexers. Also, by plugging a laptop computer into variety of interactive content and the ability to rap-
the Ethernet hub in the table, network debugging idly prototype using the HyperText Markup Lan-
tools could monitor the flow of information in real guage (HTML). There were two problems with using
time and in great detail, without interfering with the HTML alone. First, straight HTML does not give de-
normal operation of any of the devices or the over- signers enough control over layout and content. Sec-
all system. The sensors, data processing programs, ond, and a much larger problem, Web browsers are
and display programs were also engineered to com- based on a client/server model. In this model a
municate using UDP as a form of network-compat- browser makes an HTTP request to a server and in
ible interprocess communication. The end result was a time usually long enough to be perceived by the
perhaps the most important advantage of using an user, the server responds. This information exchange
Ethernet-based architecture: everything was com- had too much overhead for our system to work in
pletely delocalized. Individual software subsystems real time. In addition, there was no built-in means
could be moved from one computer to another to for browsers to respond to User Datagram Protocol
take advantage of different debugging environments (UDP) packets. Fortunately, modern browsers inter-
or to rule out computer-specific troubles and other pret a number of other languages that enrich the
software interactions. experience of our modern Internet. In the end we
IBM SYSTEMS JOURNAL, VOL 39, NOS 3&4, 2000 OMOJOLA ET AL. 875were able to make images, videos, and text dynam- for creating quick, beautiful animations that are
ically change in response to physical icons and touch. Web-ready.
Figure 11 shows the overall architecture. The first The software environment we created spanned many
task was to enable the browser to receive content levels: there is microcode on RISC (reduced instruc-
from our local input devices on the Ethernet. To tion-set computer) microcontrollers that communi-
achieve this, we wrote a small Java applet that com- cate over Ethernet to a Java applet encapsulated as
municates with our devices using UDP. Modern a JavaBeans component that communicates to
browsers make it trivial to embed Java applets in a JavaScript, which controls the HTML and DHTML of
Web page, but the events within an applet and the a Web page that then renders text, images, and video.
events within the Web page itself are usually kept This seems complex, but the beauty of having so
separate. JavaScript** is a scripting language built many levels of description was that the end product
into modern browsers that allowed us to make this was exactly as intended: seamless.
connection. To do this, the Java applet was encap-
sulated in a JavaBeans** component. This encap- Projection display hardware
sulation creates a standard interface (a bean) that
allows two software objects to communicate with- The ten projectors used in the welcome mat and the
out the need to know the internals of the other ob- dining table installations were NEC MultiSync**
ject. This solved our real-time user input problem. MT1035 projectors, with light output of 1300 ANSI
This could be an interesting pathway for future (American National Standards Institute) lumens. For
projects to receive real-time sensor input to a Web the dining table, the projectors were mounted in a
page without needing remote servers. This could also circular drop ceiling directly above the place settings,
be a means for people with browsers to send infor- with an additional projector over the lazy Susan. They
mation to Web servers via nonstandard sensor or in- were all side-mounted with lenses facing downwards.
put devices. Special lenses were used to focus the display area
to the size of each place setting. The apertures in
the ceiling for the projectors were designed to cre-
With user input worked out, we then turned to the ate the impression of spotlights from the ceiling. Ca-
content design aspect. Dynamic HTML (DHTML) and bling (the VGA, or video graphics adapter, cables for
Cascading Style Sheets (CSS) are the industry’s re- the display and the remote control cables for the pro-
sponse to creating dynamic content with full control jectors) was run through the roof of the gallery to
of the layout. One can specify the location and vi- the back room used to store the computers running
sual attributes of objects precisely on the screen. The the exhibit. Figure 21 shows a section of the table
other important piece is that these attributes can and projector housing with the display paths for the
change— by using JavaScript, one can quickly script projectors in red.
a complex series of events given a user’s input. For
example, when a user touches a hot spot, visual feed- As mentioned in the introduction to this paper, the
back is given by brightening the color of hot spots forward projection display was chosen over flat-panel
through a transparency effect of one image over an- touch screens or rear projection screens. In the kiosk
other. We were able to display text, images, and vid- environment, where the panel is vertical and users
eos dynamically to delve into more information about are viewing it head-on, traditional LCD technology
a building. We chose Microsoft Internet Explorer** makes a great deal of sense. But to enable the user
5.0 running on Microsoft Windows 98** because its to drop things, cut things, and generally use the ta-
vast, albeit nonstandard, set of multimedia effects ble as a table, the forward projection method is far
allowed us to create a rich environment that could superior to any conventional touch-screen technol-
not have been done with any other browser. ogy. Indeed, an embedded flat panel touch screen
would require a thick protective layer of glass, which
JavaScript, as a scripting language, suffers in perfor- would make viewing the screen at an angle difficult.
mance relative to compiled code. It was paramount
to the overall control of the software project, but As for the rear projection method, the projection
there were certain pieces such as animations, which hardware would occupy space underneath the table.
needed to be precompiled to maximize performance. This might impair the look or the functionality of
We turned to Macromedia Flash** to solve this prob- the table. The use of forward projection did not in
lem. Macromedia has made a set of intuitive tools any way change the feel of the table or the ability
876 OMOJOLA ET AL. IBM SYSTEMS JOURNAL, VOL 39, NOS 3&4, 2000to sit comfortably at it. There is a definite psycho-
Figure 21 Section of the table showing projector
logical difference between an LCD screen that is in- mountings and display paths
destructible because it has a thick slab of glass in front
of it, and a table that is indestructible because it is
a simple, solid piece of furniture. There was some
concern that display occlusion (which would occur
when a user places a hand into the path of the pro-
jected image onto a place setting) would have a neg-
ative impact, but the area occluded by the hand was
not visible to the user anyway. The projectors them-
selves were well concealed, and the overall effect was
closer to a magical glowing panel than a traditional
projected image.
Results and conclusions
The technology development cycle for this project
was significantly different from any other internal
project of similar scale. One of the major observa-
tions from the time spent setting up the installation
in the gallery was the difficulty of doing significant
hardware debugging on site (see Figure 22): the level
of developmental support that can be obtained in
art museums is much less than in a conventional lab- hand gestures, and sharing information using the lazy
oratory, and it took much longer than initially ex- Susan were met with widespread understanding and
pected to complete the installation. Integrating the acceptance by all the visitors to the gallery. The speed
array boards and tag readers with the low-level net- with which visitors acquired an understanding of how
working hardware and software proceeded without to use and navigate the interface told us we suc-
a hitch. However, the development and integration ceeded in making the interface simple and intuitive.
of the software on the back-room computers was ex- There seemed to be many people who had vague
tremely difficult, despite the fact that the interpret- ideas that there had to be a better way to get at in-
ers being used were performing relatively simple-to- formation than a monitor and mouse, but no con-
describe computations. The lion’s share of the cept of what that could be; seeing and using the din-
development time was spent debugging the devel- ing table really brought those ideas into focus for
opment environments rather than the actual algo- them. Perhaps the best reaction was that of an el-
rithms. Coming out of these experiences was a stron- derly museum benefactor who pulled Neil Ger-
ger realization of the need for a system that would shenfeld aside and commented that she loved the
allow limited arbitrary computation to be performed installation and the fact that there were no comput-
without the overhead of a full operating system, and ers anywhere near the table, because she hated com-
further development of this concept is under way. puters but she loved being able to look at all the in-
formation. With all the fast microprocessors in the
Once the development was complete, it was most dining table installation she was probably closer to
gratifying to observe visitors use the various exhib- more computing power than she had ever been in
its. The reactions to the welcome mat ranged from her life, but the interface was so simple that it did
the mildly amused to the completely visceral, and not matter, and that more than anything else was
even with the fairly simple mapping described in the the desired goal.
section on the welcome mat, the behavior was still
novel enough to engage some of the younger users Acknowledgments
for some time. Most users seemed to grasp the con-
cept that the space was, in some way, “aware” of their Flavia Sparacino built the initial prototype for the
presence. interactive table. The projectors used in the project
were supplied by NEC Technologies. Furniture Co.,
The concepts of attaching information to physical New York, supplied the table. At MoMA, Andrew
objects, navigating through this information with Davies, project manager and interactive environment
IBM SYSTEMS JOURNAL, VOL 39, NOS 3&4, 2000 OMOJOLA ET AL. 877Figure 22 Photograph of gallery during installation
producer, and Paul Niebuhr, the director of infor- Conference on Human Factors in Computing Systems (CHI
mation systems, gave invaluable assistance during the ’97), Atlanta, March 1997, ACM (1997), pp. 234 –241.
5. F. Sparacino, K. Larson, R. MacNeil, G. Davenport, and
installation. Greg Van Alstyne, the art director, di- A. Pentland, “Technologies and Methods for Interactive Ex-
rected the team from NearLife, Inc., that designed hibit Design: From Wireless Object and Body Tracking to
the final interface and handled the content editing Wearable Computers,” International Cultural Heritage Infor-
and formatting for the project. The images of the matics Meeting (ICHIM 99), Washington, DC, September
1999, Archive and Museum Informatics, Pittsburgh, PA
gallery floor plan, the projector schematic, and the (1999).
place setting and lazy Susan photographs are used 6. See the Boundary Functions installation by Scott S. Snibbe,
courtesy of Andrew Davies, Greg Van Alstyne, Paul http://www.snibbe.com/scott/bf/index.htm.
Niebuhr, and MoMA. The installation would not have 7. R. R. Fletcher, O. Omojola, E. Boyden, and N. Gershenfeld,
been possible without the work of Kelly Dobson and “Reconfigurable Agile Tag Reader Technologies with Com-
bined EAS and RFID Capability,” 2nd Workshop on Auto-
John Paul Strachan. The technology development matic Identification Advanced Technologies (AutoID ’99),
was conducted in the Physics and Media Group and Summit, NJ, October 1999, IEEE, New York (1999), pp. 65–
supported by the Things That Think consortium at 69.
the MIT Media Laboratory. 8. J. R. Smith, “Field Mice: Extracting Hand Geometry from
Electric Field Measurements,” IBM Systems Journal 35, Nos.
**Trademark or registered trademark of E. I. du Pont de Nemours 3&4, 587– 608 (1996).
and Company, Silicon Graphics, Inc., Sun Microsystems, Inc., Mi- 9. L. S. Theremin, “Method of an Apparatus for the Gener-
crosoft Corporation, Macromedia Inc., or NEC Home Electron- ation of Sounds,” U.S. Patent No. 1,661,058 (February 28,
ics (U.S.A.) Inc. 1928).
10. T. G. Zimmerman, “Applying Electric Field Sensing to Hu-
man-Computer Interfaces,” Proceedings of Conference on Hu-
Cited references and note man Factors in Computing Systems (CHI ’95), Denver, 1995,
ACM (1995), pp. 280 –287.
1. S. Wilkinson, “Phantom of the Brain Opera,” Electronic Mu- 11. N. Gershenfeld, “Method and Apparatus for Electromagnetic
sician 13, No. 1 (1997). Non-Contact Position Measurement with Respect to One or
2. J. Paradiso, “The Brain Opera Technology: New Instruments More Axes,” U.S. Patent No. 5,247,261 (September 21, 1993).
and Gestural Sensors for Musical Interaction and Perfor- 12. J. D. Jackson, Classical Electrodynamics, John Wiley & Sons,
mance,” Journal of New Music Research 28, No. 2, 130 –149 New York (1999).
(1999).
3. C. R. Wren, F. Sparacino, A. J. Azarbayejani, T. J. Darrell,
T. E. Starner, A. Kotani, C. M. Chao, M. Hlavac, K. B. Rus- Accepted for publication May 15, 2000.
sell, and A. P. Pentland, “Perceptive Spaces for Performance
and Entertainment: Untethered Interaction Using Computer
Vision and Audition,” Applied Artificial Intelligence 11, No. Olufemi Omojola MIT Media Laboratory, 20 Ames Street, Cam-
4, 267–284 (1997). bridge, Massachusetts 02139-4307 (electronic mail: kingpin@media.
4. H. Ishii and B. Ullmer, “Tangible Bits: Towards Seamless mit.edu). Mr. Omojola is a research assistant in the Physics and
Interfaces Between People, Bits and Atoms,” Proceedings of Media Group at the MIT Media Laboratory. He received the S.B.
878 OMOJOLA ET AL. IBM SYSTEMS JOURNAL, VOL 39, NOS 3&4, 2000degree in electrical engineering and computer science from MIT Richard Fletcher MIT Media Laboratory, 20 Ames Street, Cam-
in 2000 and is currently working toward an M.S. degree. His in- bridge, Massachusetts 02139-4307 (electronic mail: fletcher@media.
terests are in flexible reconfigurable hardware architectures for mit.edu). Mr. Fletcher is a Ph.D. candidate in the Physics and
signal processing, and applications for human-computer inter- Media Group at the MIT Media Laboratory, working in the field
faces. of electromagnetic tagging. His current thesis research is devoted
to developing new ways of encoding information in smart ma-
terial structures. Prior to coming to the Media Lab, Mr. Fletcher
E. Rehmi Post MIT Media Laboratory, 20 Ames Street, Cambridge,
worked for five years at the U.S. Air Force Materials Laboratory
Massachusetts 02139-4307 (electronic mail: rehmi@media.mit.edu).
designing passive microwave structures. He holds undergradu-
Mr. Post is presently a doctoral candidate in the Physics and Me-
ate degrees from MIT in physics and electrical engineering.
dia Group of the MIT Media Laboratory. He received an M.Sc.
in media arts and sciences from MIT in 1998, and a B.Sc. in phys-
ics from the University of Massachusetts, Amherst. Neil Gershenfeld MIT Media Laboratory, 20 Ames Street,
Cambridge, Massachusetts 02139-4307. Dr. Gershenfeld leads the
Physics and Media Group at the MIT Media Laboratory and di-
Matthew D. Hancher MIT Media Laboratory, 20 Ames Street, rects the Things That Think research consortium. His laboratory
Cambridge, Massachusetts 02139-4307 (electronic mail: mdh@mit. investigates the relationship between the content of information
edu). Mr. Hancher is a research assistant in the Physics and Me- and its physical representation, from developing molecular quan-
dia Group of the MIT Media Laboratory and a candidate for an tum computers, to smart furniture, to virtuosic musical instru-
M.S. degree. Mr. Hancher’s research focuses on embedded net- ments. Author of the books When Things Start to Think, The Na-
working and autonomous robotics. ture of Mathematical Modeling, and The Physics of Information
Technology, Dr. Gershenfeld has a B.A. degree in physics with
Yael Maguire MIT Media Laboratory, 20 Ames Street, Cambridge, High Honors from Swarthmore College, a Ph.D. from Cornell
Massachusetts 02139-4307 (electronic mail: yael@media.mit.edu). University, was a Junior Fellow of the Harvard University So-
Mr. Maguire is a Ph.D. candidate at the MIT Media Laboratory. ciety of Fellows, and a member of the research staff at AT&T
He is an IBM Student Fellow holding a master’s degree in media Bell Laboratories.
arts and sciences from MIT. Mr. Maguire received a degree in
engineering physics with Highest Honors from Queen’s Univer-
sity in Canada. He is currently working on building a tabletop
device for quantum computing, which holds the promise of com-
puting faster than traditional, semiconductor-based computers.
He currently holds an NSERC fellowship from Canada and is
generally interested in the fundamental ties between information
processing and physics.
Ravikanth Pappu MIT Media Laboratory, 20 Ames Street, Cam-
bridge, Massachusetts 02139-4307 (electronic mail: pappu@media.
mit.edu). Mr. Pappu is an IBM Fellow in the Physics and Media
Group at the MIT Media Laboratory. His doctoral work focuses
on designing and implementing inexpensive systems for crypto-
graphic authentication schemes. Prior to this, he worked on al-
gorithms for computing holograms for the MIT second-gener-
ation holographic video system and co-created the first dynamic
holographic video system with haptic interaction. Mr. Pappu holds
a bachelor’s degree in electronics and communication engineer-
ing from Osmania University, India. He received a master’s de-
gree in electrical engineering from Villanova University in 1993,
and a master of science in media arts and sciences from MIT in
1995.
Bernd Schoner MIT Media Laboratory, 20 Ames Street, Cam-
bridge, Massachusetts 02139-4307 (electronic mail: schoner@media.
mit.edu). Mr. Schoner holds engineering degrees from the Uni-
versity of Technology in Aachen, Germany, and the École Cen-
trale de Paris, France. He is currently a Ph.D. candidate at the
MIT Media Laboratory, working on the sensing, modeling, and
synthesis of acoustical instruments.
Peter R. Russo MIT Media Laboratory, 20 Ames Street, Cam-
bridge, Massachusetts 02139-4307 (electronic mail: prusso@media.
mit.edu). Mr. Russo is currently a sophomore at MIT studying
physics and electrical engineering. He is an undergraduate re-
searcher at the MIT Media Laboratory, where he works on con-
ductive fabric touch sensors, and near-field electric and magnetic
field sensors.
IBM SYSTEMS JOURNAL, VOL 39, NOS 3&4, 2000 OMOJOLA ET AL. 879You can also read