Carbon sources of benthic fauna in temperate lakes across multiple trophic states
←
→
Page content transcription
If your browser does not render page correctly, please read the page content below
Biogeosciences, 18, 4369–4388, 2021
https://doi.org/10.5194/bg-18-4369-2021
© Author(s) 2021. This work is distributed under
the Creative Commons Attribution 4.0 License.

Carbon sources of benthic fauna in temperate lakes
across multiple trophic states
Annika Fiskal1 , Eva Anthamatten1 , Longhui Deng1 , Xingguo Han1 , Lorenzo Lagostina1 , Anja Michel1 , Rong Zhu1 ,
Nathalie Dubois2,3 , Carsten J. Schubert1,4 , Stefano M. Bernasconi3 , and Mark A. Lever1
1 Institute
         of Biogeochemistry and Pollutant Dynamics (IBP), ETH Zurich, Universitätstrasse 16, 8092 Zurich, Switzerland
2 Department Surface Waters – Research and Management, Eawag, Swiss Federal Institute of Aquatic Science and
Technology, Überlandstrasse 133, 8600 Dübendorf, Switzerland
3 Department of Earth Sciences, ETH Zurich, Sonneggstrasse 5, 8092 Zurich, Switzerland
4 Department of Surface Waters – Research and Management, Swiss Federal Institute of Aquatic Science and Technology

(EAWAG), Seestrasse 79, 6047 Kastanienbaum, Switzerland

Correspondence: Annika Fiskal (annikafiskal@gmail.com) and Mark A. Lever (mark.lever@usys.ethz.ch)

Received: 26 August 2020 – Discussion started: 11 September 2020
Revised: 2 June 2021 – Accepted: 21 June 2021 – Published: 28 July 2021

Abstract. Previous studies have shown that microbially pro-       in so far uncharacterized relationships with detrital organic-
duced methane can be a dominant carbon source of lacus-           matter-degrading bacterial endosymbionts.
trine sedimentary macrofauna in eutrophic lakes, most likely
through grazing on methane-oxidizing bacteria. Here we in-
vestigate the contributions of different carbon sources to
macrofaunal biomass across five lakes in central Switzerland      1   Introduction
that range from oligotrophic to highly eutrophic. Macrofau-
nal communities change with trophic state, with chironomid        Lake sediments are globally important organic C sinks (Ein-
larvae dominating oligotrophic and tubificid oligochaetes         sele et al., 2001; Mendonça et al., 2017) and sources of
dominating eutrophic lake sediments. The 13 C-isotopic data       the greenhouse gas methane (CH4 ) (Bastviken et al., 2004;
suggest that the average contribution of methane-derived car-     Raymond et al., 2013; Holgerson and Raymond, 2016).
bon to the biomass of both macrofaunal groups is similar          Overall the burial of organic carbon is usually higher in
but consistently remains minor, ranging from only ∼ 1 %           eutrophic compared to oligotrophic lakes due to high nu-
in the oligotrophic lake to at most 12 % in the eutrophic         trient loads which increase primary production (Dean and
lakes. The remaining biomass can be explained by the assim-       Gorham, 1998; Maerki et al., 2009; Heathcote and Down-
ilation of detritus-derived organic carbon. Low abundances        ing, 2012; Anderson et al., 2013; Anderson et al., 2014). The
of methane-cycling microorganisms in macrofaunal speci-           resulting increases in aerobic respiration lead to O2 deple-
mens, burrows, and surrounding sediment based on 16S ri-          tion and increased organic matter deposition to sediments
bosomal RNA (rRNA) gene sequences and copy numbers                (Hollander et al., 1992; Steinsberger et al., 2017) where
of genes involved in anaerobic and aerobic methane cycling        this increased organic matter stimulates microbial methane
(mcrA, pmoA) support the interpretation of isotopic data. No-     production (Fiskal et al., 2019). The combination of in-
tably, 16S rRNA gene sequences of macrofauna, including           creased methane production in sediments and decreased aer-
macrofaunal guts, are highly divergent from those in tubes        obic methane consumption in overlying water then results in
or sediments. Many macrofaunal specimens are dominated            higher methane emissions from eutrophic lakes (DelSontro
by a single 16S rRNA phylotype of Fusobacteria, α-, β-,           et al., 2016).
γ -, or ε-Proteobacteria, Bacteroidetes, or Parcubacteria. This      In addition to trophic state, the presence of macrofauna,
raises the question of whether dominant lake macrofauna live      which physically mix sediments, mechanically break down
                                                                  organic particles, or pump O2 into deeper, otherwise anoxic

Published by Copernicus Publications on behalf of the European Geosciences Union.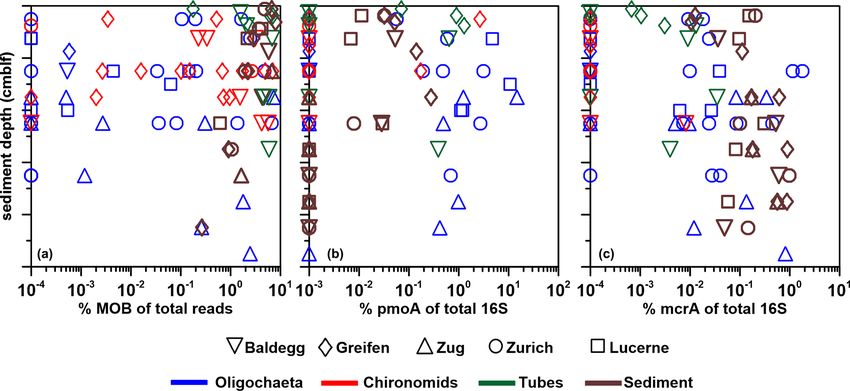
4370                                                                          A. Fiskal et al.: Carbon sources of benthic fauna

layers, influences O2 and C cycle dynamics in sediments
(Meysman et al., 2006; White and Miller, 2008; Kristensen
et al., 2012). While most research on macrofaunal effects on
organic carbon burial and respiration reactions have been on
marine sediments, there have also been numerous studies on
freshwater sediments. These studies suggest that macrofauna
can be present in high abundances (up to 11 000 individu-
als per square meter) (Armitage et al., 1995; Mousavi, 2002)
and significantly influence nutrient fluxes and sedimentary
matrices in lake sediments (Stief, 2013; Holker et al., 2015).
Insects, in particular tube-dwelling chironomid larvae, can
cause oxic–anoxic oscillations around their burrows through
their pumping activity (Lewandowski et al., 2007; Roskosch
et al., 2012; Baranov et al., 2016; Hupfer et al., 2019) These
redox fluctuations affect the sedimentary cycles of nitro-
gen (Pelegri et al., 1994; Jeppesen et al., 1998; Stief et al.,
2009; Stief, 2013), phosphorus (Andersson et al., 1988; Kat-
sev et al., 2006), iron (Hupfer and Lewandowski, 2008), and
methane (Deines et al., 2007b; Gentzel et al., 2012). Worms,
especially tubificid oligochaetes, can also increase oxygena-
tion and O2 uptake in surface sediments (Lagauzère et al.,          Figure 1. Map of the study area from Fiskal et al., (2019). The
2009) and influence the release of ammonium (NH+         4 ), ni-   sampling stations within each of the five lakes are indicated by red
                                   3−
trate (NO− 3 ), and phosphate  (PO 4  ) (Svensson  et al., 2001;    dots and numbered 1 to 3. Color indicates trophic state from light
Mermillod-Blondin et al., 2005; Gautreau et al., 2020) from         blue (oligotrophic) to dark blue (eutrophic). The map is based on
surface sediments. Many tubificids are moreover head-down           aerial images from DigitalGlobe (CO) and CNES/Airbus (France)
deposit feeders that defecate on the sediment surface (Mc-          as provided by Google (CA) and was created with the software R
Call and Tevesz, 1982). This upward movement of reduced             (South, 2011). The small insert map is from d-maps (https://www.
                                                                    d-maps.com/carte.php?num_car=2648&lang=en).
sediment can cause significant reworking and alter the redox
potential in surface sediment (Davis, 1974).
   The community composition of lacustrine sedimentary              locally or seasonally high contributions of methane-derived
macrofauna varies in response to trophic state (Aston, 1973;        carbon (Premke et al., 2010).
Verdonschot, 1992; Nicacio and Juen, 2015) in part due to              Despite these past studies, the conditions under which
differences in hypoxia/anoxia tolerance among macrofaunal           methane-derived carbon becomes an important C source to
species (Chapman et al., 1982). Different lacustrine macro-         chironomid larvae or oligochaetes are not well understood.
faunal species, moreover, vary in their impact on methane           Furthermore, the main pathways of methane-derived carbon
cycling in sediments (Bussmann, 2005; Figueiredo-Barros             incorporation into macrofaunal biomass, e.g., selective graz-
et al., 2009). methane oxidation in surface sediments is of-        ing or gardening of methane-oxidizing bacteria or carbon
ten stimulated by chironomid larval O2 input, which enriches        transfer from methane-oxidizing bacteria gut symbionts, re-
populations of methane-oxidizing bacteria in larval tubes and       main unclear. Here we analyze shallow sublittoral to profun-
surrounding sediment (“microbial gardening”) (Kajan and             dal sediments of five temperate lakes in central Switzerland
Frenzel, 1999). As a result, methane-oxidizing bacteria can         that differ strongly in trophic state and macrofaunal com-
become an important food source, and in some cases the              munity composition. We analyze the community structures
main C source, of chironomid larvae (Kankaala et al., 2006;         of chironomid larvae and oligochaetes and compare their C-
Deines et al., 2007a; Jones et al., 2008; Jones and Grey,           isotopic compositions to those of total organic C (TOC), dis-
2011). High contributions of methane-derived carbon via             solved organic C (DOC), and methane to investigate how C
grazing on methane-oxidizing bacteria are typically found in        sources vary across dominant macrofaunal groups in relation
profundal regions of eutrophic lakes with seasonal stratifica-      to trophic state and water depth. In addition, we analyze mi-
tion and low O2 concentrations (Hershey et al., 2006; Jones         crobial community structure based on 16S rRNA gene se-
and Grey, 2011). Yet, variable isotopic values of chironomid        quences and quantify functional genes involved in aerobic
biomass, even within the same location, suggest that diets of       and anaerobic methane oxidation in macrofaunal specimens,
chironomid larvae vary greatly (Kiyashko et al., 2001; Reuss        macrofaunal burrows, and surrounding sediment to elucidate
et al., 2013). The limited C-isotopic data on tubificid worms       the potential for microbial gardening or symbiotic associa-
suggest that worm C sources also vary from detritus-based to        tions between macrofauna and microbiota.

Biogeosciences, 18, 4369–4388, 2021                                                     https://doi.org/10.5194/bg-18-4369-2021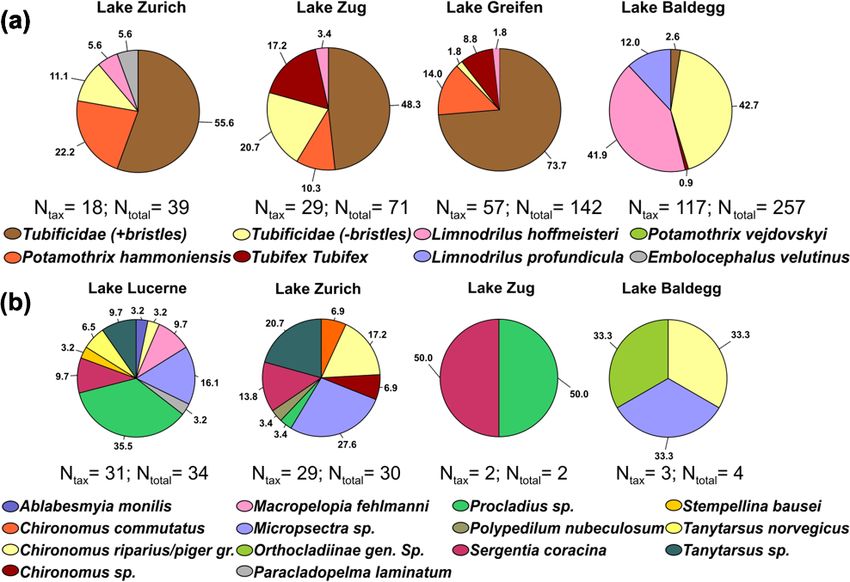
A. Fiskal et al.: Carbon sources of benthic fauna                                                                                        4371

Table 1. Overview of sampled lakes, their trophic status, and maximum water depths, as well as the geographic coordinates, water depths,
and bottom water dissolved O2 concentrations (ranges are O2 concentrations over the time course of 1 year) of the stations that were
sampled. O2 concentrations ≤ 15.6 µM are termed “hypoxic”. All data are from Fiskal et al., (2019). Trophic status and O2 concentrations are
taken from Swiss Federal Office of the Environment (BAFU) (https://www.bafu.admin.ch/bafu/de/home/themen/wasser/fachinformationen/
zustand-der-gewaesser/zustand-der-seen/wasserqualitaet-der-seen.html).

                    Trophic           Max.    depth    Station no.     Latitude         Longitude          Waterdepth (m)   O2 (µM)
                    status            (m)                              (◦ N)            (◦ E)
   Lake Greifen     Eutrophic         32               1               47◦ 21.134       8◦ 40.511          15               Seasonally
                                                                                                                            Hypoxic
                                                       2               47◦ 21.118       8◦ 40.484          32
                                                       3               47◦ 21.038       8◦ 40.185          24
   Lake Baldegg     Eutrophic         66               1               47◦ 11.929       8◦ 15.613          66               15.6–125
                                                                                                                            125–250
                                                                                                                            15.6–125
                                                       2               47◦   11.759     8◦   15.392        45
                                                       3               47◦   11.649     8◦   15.417        21
   Lake Zug         Eutrophic         198              1               47◦   10.272     8◦   30.036        25               125–250
                                                       2               47◦   10.104     8◦   29.946        35               125–250
                                                       3               47◦   09.834     8◦   29.814        50               125–250
   Lake Zurich      Mesotrophic       137              1               47◦   16.995     8◦   35.624        137              Hypoxic
                                                       2               47◦   16.708     8◦   35.033        45               125–250
                                                       3               47◦   16.395     8◦   35.195        25               15.6–125
   Lake Lucerne     Oligotrophic      214              1               47◦   00.051     8◦   20.218        24               > 250
                                                       2               46◦   59.812     8◦   20.820        93               > 250
                                                       3               46◦   59.915     8◦   20.413        45               > 250

                                                                          2     Material and methods

                                                                          2.1     Sampling and site description

                                                                          Sediment cores were obtained from three different water
                                                                          depths in the oligotrophic Lake Lucerne, the mesotrophic
                                                                          Lake Zurich, and the eutrophic Lake Zug, Lake Baldegg, and
                                                                          Lake Greifen in central Switzerland in June and July 2016
                                                                          (Fig. 1, Table 1; for further information on trophic histories,
                                                                          please see Fiskal et al., 2019). Sediment cores were taken
                                                                          using gravity cores with 60 cm long liners that had an inner
                                                                          diameter of 150 mm (UWITEC, AT) from boats or motorized
                                                                          platforms. The four sediment cores per station were used as
Figure 2. Average abundances of macrofauna in each lake. Error            follows: the most undisturbed core was used for microsen-
bars indicate standard deviations of three stations per lake, except      sor measurements (O2 , pH) and afterwards for macrofaunal
for Lake Zurich where the macrofauna-free deep station was not            community sampling. The second core was used for analyses
considered, and error bars indicate the range of the two shallower        of DNA sequences, methane concentrations, δ 13 C-methane,
stations. The degree of eutrophication is based on water column
                                                                          TOC content, and δ 13 C-TOC. The remaining cores were used
phosphorous concentrations measured by the Swiss Federal Office
                                                                          for porewater sampling using rhizons (0.2 µm pore size, Rhi-
of the Environment (BAFU), which uses the OECD model (Vollen-
weider and Kerekes, 1982) to declare trophic state. According to          zosphere), with DOC and δ 13 C-DOC sampling being done
the OECD model, lakes with average total P concentration values           on a separate core than that for dissolved inorganic carbon
of ≤ 15 mg m−3 are oligotrophic, lakes with 15–45 mg P m−3 are            (DIC) and δ 13 C-DIC sampling. A wide range of additional
mesotrophic, and lakes with > 45 mg P m−3 are eutrophic.                  porewater geochemical analyses were performed on the core
                                                                          used for DIC sampling (including concentrations of nitrate,
                                                                          sulfate, hydrogen sulfide, Fe2+ , Mn2+ , and ammonium; for
                                                                          further details, see Fiskal et al., 2019). In all cores, the top
                                                                          4 cm was sampled in 0.5 to 1 cm depth intervals, samples
                                                                          from 4 to 20 cm sediment depth in 2 cm depth intervals, and

https://doi.org/10.5194/bg-18-4369-2021                                                               Biogeosciences, 18, 4369–4388, 2021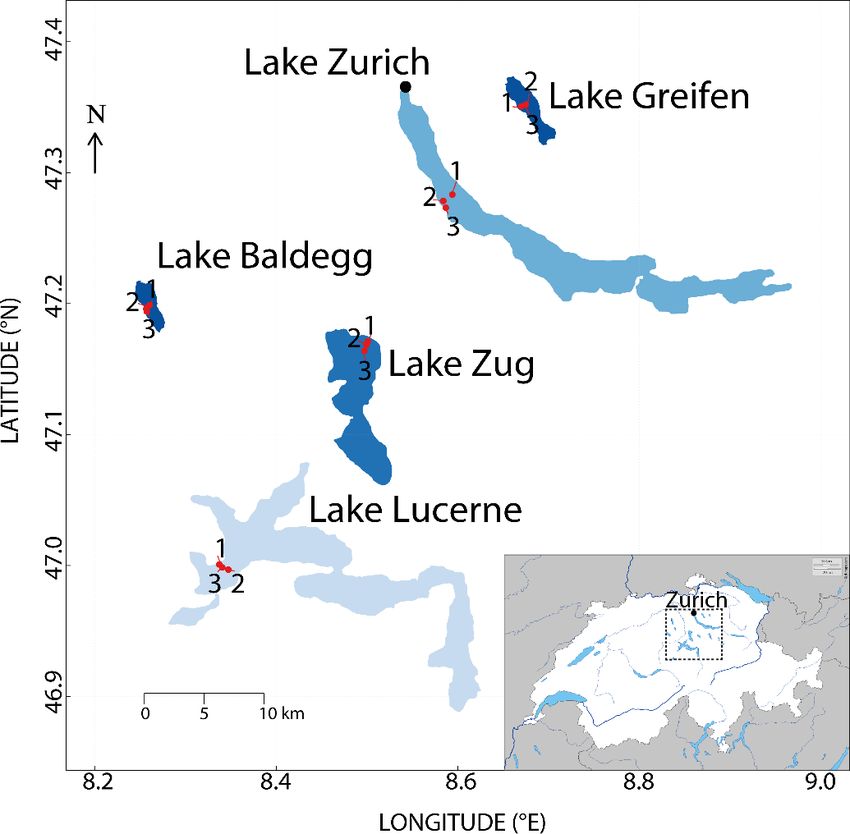
4372                                                                           A. Fiskal et al.: Carbon sources of benthic fauna

Figure 3. Depth distributions of oligochaetes and chironomid larvae at each station. Water depths of each station are indicated in each
subplot. Horizontal lines indicate depth distributions of laminated sediment layers.

all deeper layers in 4 cm depth intervals. Cores were typi-           alytical details, see Fiskal et al., 2019). Cores for macrofau-
cally ∼40–50 cm long; however, the lowermost 5–10 cm was              nal community analyses were extruded and macrofauna col-
discarded due to contamination with lake water during core            lected by sieving sediments through 400 and 200 µm mesh
retrieval. An additional, narrow core 6 cm in diameter was            sieves. Three stations (two in Lake Lucerne, one in Lake
obtained for radionuclide (210 Pb and 137 Cs) analyses (for an-       Baldegg) were revisited in November 2017 and October 2018

Biogeosciences, 18, 4369–4388, 2021                                                      https://doi.org/10.5194/bg-18-4369-2021
A. Fiskal et al.: Carbon sources of benthic fauna                                                                                       4373

Figure 4. Pie charts of taxonomic analyses on oligochaetes (a) and chironomid larvae (b) in each lake (Ntax = number of taxonomically
identified specimens, Ntotal = total number of specimens). No chironomid larvae were found in Lake Greifen. In Lake Lucerne only four
oligochaetes were found of which one was taxonomically analyzed (Potamothrix vejdovskyi; not shown). Numbers show relative abundances
in percentages.

to collect additional macrofaunal specimens and chironomid           2.3   Stable carbon isotope analyses
larval tubes for DNA analyses.
                                                                     Carbon isotope analyses were performed on DOC, methane,
2.2   Macrofaunal abundance and taxonomy                             TOC, macrofaunal specimens, or separately on guts and re-
                                                                     maining bodies of macrofaunal specimens. Values are given
For each depth interval, specimen numbers of oligochaetes            in the δ notation, i.e.,
and chironomid larvae were carefully picked with tweez-
ers, counted, and preserved in 70 % ethanol for taxonomic

                                                                                           12         13 12
and 13 C-isotopic analyses or frozen on dry ice for DNA              δ 13 C =        13
                                                                                          C C               C C                     .
                                                                                               sample                standard
extractions. Detailed taxonomic analyses to the genus and,
when possible, species level were performed on a subset              For δ 13 C-DOC, porewater samples were analyzed as de-
of oligochaetes and chironomid larvae. Oligochaete speci-            scribed in Lang et al. (2012). Briefly, 2–7 mL of sample was
mens were sent to AquaLytis (Wildau, Germany), where they            added to 12 mL Vacutainers® . After removal of dissolved in-
were embedded in epoxy resin and identified by light mi-             organic C by addition of 85 % phosphoric acid and bubbling
croscopy. Chironomid larvae were microscopically identified          with high purity He, DOC was oxidized to CO2 using persul-
by AquaDiptera (Emmendingen, Germany).                               fate (1 h at 100◦ C). The evolved CO2 was analyzed on a Gas-
                                                                     Bench II coupled to a Delta V mass spectrometer (Thermo
                                                                     Fisher Scientific, Bremen). Water soluble organic standards
                                                                     of known isotope composition (phthalic acid and sucrose)
                                                                     were used as standards.

https://doi.org/10.5194/bg-18-4369-2021                                                            Biogeosciences, 18, 4369–4388, 2021
4374 A. Fiskal et al.: Carbon sources of benthic fauna
For δ 13 C-Methane, methane was extracted by creating a 2.6 Quantitative polymerase chain reaction
sediment slurry with Milli-Q water under saturating NaCl
concentrations (∼ 6.3 M). A total of 2 cm3 of sediment was Quantitative polymerase chain reaction (qPCR) was per-
transferred to 20 mL crimp vials containing 2.514 g NaCl formed to quantify bacterial and archaeal 16S rRNA genes,
and 5 mL Milli-Q water, crimped, mixed, and stored on ice as well as genes encoding particulate methane monooxyge-
or at +4 ◦ C until analysis using a trace gas (Isoprime) cou- nase of aerobic methanotrophic bacteria (pmoA) and methyl
pled to an isotope ratio mass spectrometer (GC-IRMS; Iso- coenzyme M reductase of methanogenic and anaerobic
prime, Manchester). Separation was performed through a methane-oxidizing archaea (mcrA) (Table S1 in the Sup-
GC-column (PoraPLOT Q 30 m column). The precision of plement). Standards consisting of plasmids containing 16S
the method was ±0.7 %. After every sixth sample we in- rRNA, pmoA, or mcrA genes from specific organisms (Ta-
cluded a standard with a known δ 13 C value (standards: L- ble S1 in the Supplement) were run in 10-fold dilutions of
iso1 with 2500 ppmv CH4 at −66.5 % δ 13 C-methane and T- ∼ 101 to ∼ 107 gene copies per qPCR reaction. All sample
iso3 with 250 ppmv CH4 at −38.3 % δ 13 C-CH4 ; Air Liq- DNA extracts and standard dilutions were run in duplicate.
uide). The qPCR protocols are shown in Table S2 in the Sup-
For δ 13 C-TOC analyses, 5–10 g of frozen sediment was plement. For each qPCR reaction, 2 µL of DNA extract was
freeze-dried in glass vials and quantified using an elemen- mixed with 1 µL of molecular grade water, 1 µL of bovine
tal analyzer (Thermo Fisher Flash EA 1112) coupled to serum albumin (10 mg mL−1 ; New England Biolabs, USA),
an isotope-ratio mass spectrometer (Thermo Fisher Delta V 0.5 µL each of forward and reverse primers (10 µM), and
Plus) (EA-IRMS) as outlined in Fiskal et al. (2019). 5 µL LightCycler® 480 SYBR Green I Master Mix (Roche,
For δ 13 C-Macrofauna, δ 13 C-analyses were performed on Switzerland). All standards and samples were kept on ice
macrofaunal biomass according to the same method used for throughout the preparations and run immediately after in
δ 13 C-TOC. Single specimens were cleaned with molecular transparent 96-well plates on a Roche LightCycler® 480.
grade water to remove sediment. Whole organisms, or sep-
arated guts and residual bodies, were placed in tin foil cap- 2.7 Next generation sequencing (NGS) and
sules, which were mounted to 96-well plates. The 96-well bioinformatics analyses
plates were sealed using plastic seal foil, the foil above each
well was pierced, and the whole plate was freeze dried. After- Libraries of bacterial and archaeal communities were pro-
ward, the foil was removed, the tin foil capsules were closed, duced using the universal 16S rRNA primer pair Univ519F
and the δ 13 C of macrofaunal biomass was measured. and Univ802R (Claesson et al., 2009; Wang and Qian, 2009).
After library preparation DNA was pooled and sequenced us-
2.4 Two end-member mixing model ing a MiSeq (Illumina Inc., USA). Library preparations and
subsequent data processing, including 97 % zero-radius op-
Assuming TOC and methane as the only carbon sources, a erational taxonomic unit (ZOTU) clustering, were done as
two end-member mixing model was used to estimate the con- outlined in Han et al. (2020) (for polymerase chain reaction
tribution of methane to biomass C of macrofauna. mixtures and cycler conditions, see Table S3 in the Supple-
ment). Briefly, raw sequences were initially quality trimmed
CH4 -Contribution (%) = 100 − δ 13 Cfauna − δ 13 CCH4 using seqtk (https://github.com/lh3/seqtk) and paired-end
reads were merged using flash (Magoč and Salzberg, 2011).
This was followed by a final quality filtering using prinseq
δ 13 CTOC − δ 13 CCH4 × 100 (Schmieder and Edwards, 2011). Sequences were then used
to generate ZOTUs with USEARCH unoise3 using a 97 %
2.5 DNA extraction from macrofauna, macrofaunal clustering identity (Edgar, 2016).
tubes, and sediment
2.8 Statistical analyses
DNA was extracted according to lysis protocol II of the mod-
ular DNA extraction method of Lever et al. (2015) following Statistical differences between C isotope signatures of
the exact procedure outlined in Han et al. (2020). While we macrofauna and C pools, as well as of percentages of bac-
used existing sediment DNA extracts from the latter study, terial 16S rRNA, mcrA, and pmoA gene copy numbers rel-
DNA from empty larval tubes and from macrofauna were ative to total 16S rRNA gene copy numbers across macro-
newly extracted. To remove sediment, macrofaunal speci- fauna, larval tubes, and sediment, were determined using
mens were rinsed with molecular grade water. DNA was then Wilcoxon signed rank tests for paired data. All tests were
extracted from entire specimens, or separately on guts and performed in R (Team, 2018) using the following command:
the remaining body, after being cut into three to four pieces wilcox.test (A, B, paired = TRUE, alternative = “two.sided”
to increase extraction efficiency using a sterile scalpel. All for (a), “greater/less” for (b), mu = 0.0, exact = TRUE, cor-
DNA extracts were stored at −80 ◦ C. rect = TRUE, conf.int = TRUE, conf.level = 0.95). Principal
Biogeosciences, 18, 4369–4388, 2021 https://doi.org/10.5194/bg-18-4369-2021A. Fiskal et al.: Carbon sources of benthic fauna 4375
coordinates analysis (PCoA) on bacterial communities at the
phylum, class, order, family, and genus levels was performed
using Bray–Curtis distances in R (Team, 2018).
3 Results
3.1 Macrofaunal distribution in relation to lake trophic
state
Macrofauna are present at all stations except the hy-
poxic deep station of Lake Zurich and are dominated by
oligochaetes and chironomid larvae. While oligochaetes are
present in all lakes, no chironomid larvae were found in Lake
Greifen. Oligochaete densities increase with trophic state,
from 75 ± 86 individuals per square meter in Lake Lucerne
to 4849±4443 individuals per square meter in Lake Baldegg
(number of individuals are expressed as averages per lake
with standard deviations of three stations). Numbers of chi-
ronomid larvae show the opposite trend, decreasing from
641 ± 346 individuals per square meter in Lake Lucerne and
849 ± 160 individuals per square meter in Lake Zurich to
less than 75 ± 86 individuals per square meter in the three
eutrophic lakes (Fig. 2, Table S5 in the Supplement). Other
macrofauna, e.g., copepods, Daphnia, and leeches, were only
occasionally found and will not be discussed further.
The depth distributions of oligochaetes and chironomid
larvae follow different trends (Fig. 3). Chironomid larvae are
most abundant in surface sediment (0–5 cmblf, centimeters
below lake floor), while oligochaetes occur over a greater
depth interval (Fig. 3). In Lake Greifen and Lake Baldegg,
oligochaetes are present in high numbers to 12 and 15 cm
sediment depth, respectively, including layers that are dis-
tinctly laminated (see horizontal lines in Fig. 3). In Lake Zug,
oligochaetes are present to even greater depths (22 cm). In
sediments of Lake Zurich, where oligochaetes and chirono-
mids occur in similar abundances, chironomids dominate the
top ∼2–3 cm, whereas oligochaetes dominate below. Despite
depth ranges extending significantly below the sediment sur-
face, macrofaunal sediment reworking is minimal based on
radionuclide measurements. These show 137 Cs peaks that
match the 1986 (Chernobyl) and 1963 (bomb test) time Figure 5. Boxplots of 13 C isotopic compositions of CH4 , TOC,
markers, and clear 210 Pbunsupported decreases from the top DOC, oligochaetes, and chironomid larvae for each lake (note:
2 cm downward at all faunated stations (Fig. S6 in the Sup- no larvae were found in Lake Greifen). Boxes show 75 % and
plement; data analyzed but not shown in Fiskal et al., 2019). 25 % quartiles. Whiskers show minimum and maximum values.
Light microscopic images of the two dominant macrofau- Wilcoxon signed rank tests were applied to check whether 13 C-
nal groups and depth distributions of individual macrofaunal isotopic signatures of macrofauna and TOC were significantly
species can be found in Fig. S1 in the Supplement. different (ns = not significant; * = p < 0.05; ** = p < 0.01;
*** = p < 0.001). For each Wilcoxon test, macrofaunal specimens
3.2 Macrofaunal community structure and diversity were paired with TOC isotopic signatures from the same depth
across lakes (±2 cm), and only data were included for which there were data
macrofauna and TOC data from matching depths. Samples with
Oligochaetes and chironomid larvae were assigned to 9 N < 5 are displayed as individual data points. N indicates the num-
and 14 different taxonomic groups, respectively (Fig. 4; ber of data points for each variable above.
for station-specific data, see Fig. S2 in the Supplement).
All oligochaetes belong to the family Naididae (Syn. Tubi-
https://doi.org/10.5194/bg-18-4369-2021 Biogeosciences, 18, 4369–4388, 20214376 A. Fiskal et al.: Carbon sources of benthic fauna
Table 2. Contributions of TOC and methane to oligochaete and chironomid larval biomass C based on a two end-member mixing model.
Estimates outside of the parentheses are maximum values as they assume no isotopic fractionation during aerobic methane oxidation. Values
within parentheses are more conservative and assume a fractionation factor that is in the upper range previously determined for freshwater
sediments and pure-culture incubations (−39 %) (Kruger et al., 2002; Templeton et al., 2006; Kankaala et al., 2007). For the calculations,
only macrofaunal specimens were included that could be paired with TOC and methane isotopic values from the same sediment depth
(±2 cm); values display averages ± standard deviation.
Contribution of TOC (%) Contribution of methane (%)
Oligochaetes Chironomid larvae Oligochaetes Chironomid larvae
Lake Lucerne – 97.3 ± 4.1 (98.6 ± 2.0) – 2.7 ± 4.1 (1.5 ± 2.0)
Lake Zurich 98.5 ± 3.9 (99.2 ± 1.5) 99.1 ± 4.3 (99.5 ± 2.4) 1.5 ± 3.9 (0.8 ± 1.5) 0.9 ± 4.3 (0.5 ± 2.4)
Lake Zug 88.3 ± 3.3 (94.0 ± 1.7) – 11.7 ± 3.3 (6.0 ± 1.7) –
Lake Greifen 93.1 ± 7.6 (96.5 ± 3.5) – 6.9 ± 7.6 (3.5 ± 3.5) –
Lake Baldegg 88.2 ± 2.8 (93.9 ± 1.5) 87.9 ± 1.6 (93.9 ± 0.8) 11.8 ± 2.8 (6.2 ± 1.5) 12.1 ± 1.6 (6.3 ± 0.8)
Table 3. Results of Wilcoxon sign rank test (one-sided) to examine whether the ratios of bacterial 16S rRNA gene (BAC), mcrA, and pmoA to
total 16S rRNA gene copy numbers differ significantly between oligochaete, chironomid larval, and chironomid larval tube samples relative
to surrounding sediment (ns = not significant; * = p < 0.05; ** = p < 0.01; *** = p < 0.001), and actual p values can be found in brackets
below. Only data were included for which matching values existed from the same sediment depth (±2 cm).
% Oligochaetes Larvae Tubes
vs. sediment vs. sediment vs. sediment
BAC of total 16S *** ** **
Oligochaetes higher Larvae higher Tubes higher
(p = 0.000002) (p = 0.006) (p = 0.001953)
mcrA of total 16S ** *** **
Oligochaetes lower Larvae lower Tubes lower
(p = 0.002921) (p = 0.000008) (p = 0.004002)
pmoA of total 16S ** ns ns
Oligochaetes higher Larvae higher Tubes higher
(p = 0.005212) (p = 0.9998) (p = 0.1792)
ficidae) and all chironomid larvae to the family Chirono- partially overlap. Lake Zurich sediment is dominated by Mi-
midae. Two oligochaete morphotypes, Tubificidae + bristles cropsectra sp., Tanytarsus sp., Chironomus riparius, Chi-
and Tubificidae − bristles, could not be assigned to a known ronomus piger gr., and Sergentia coracina, whereas Lake
genus. Lucerne is dominated by Procladius sp., Micropsectra sp.,
For Oligochaete group overlap between lakes, four of the Macropelopia fehlmanni Kieffer 1911, Tanytarsus sp., and S.
nine groups (Tubificidae + bristles, Tubificidae − bristles, P. coracina. Micropsectra sp., Tanytarsus sp., and S. coracina
hammoniensis, L. hoffmeisteri) occur in four of the five lakes. are mainly sedimentary detritus feeders, whereas Chirono-
E. velutinus (Lake Zurich), L. profundicula (Lake Baldegg), mus riparius and C. piger gr. are known to mainly filter
and P. vejdovskyi (Lake Lucerne) were the only species feed. Both Procladius sp. and M. fehlmanni are predators
that were only found in one lake. Comparing the domi- (Table S6 in the Supplement).
nant oligochaete groups reveals the dominance of unchar-
acterized Tubificidae (+ bristles) in Lake Zurich, Lake Zug, 3.3 C isotope composition of macrofauna and bulk C
and Lake Greifen but very different communities in Lake pools
Baldegg, which is dominated by uncharacterized Tubificidae
(− bristles) and L. hoffmeisteri. All identified tubificids ex- Average C isotope compositions of macrofaunal speci-
cept E. velutinus are subsurface deposit feeders that are be- mens are displayed with those of the potential C sources
lieved to mainly feed on sedimentary bacteria, whereas E. methane, TOC, and DOC in Fig. 5 (for depth profiles, see
velutinus is a surface deposit feeder (Table S6 in the Supple- Fig. S3 in the Supplement). Macrofaunal values are lowest
ment). in Lake Baldegg (oligochaetes: −36.7 ± 3.3 %, N = 14; lar-
Chironomid larval communities in Lake Zurich and Lake vae: −37.6 ± 1.9 %, N = 4) and Lake Greifen (oligochaetes:
Lucerne share many members, but the dominant groups only −37.6 ± 2.5 %, N = 12; no larvae found) and highest in
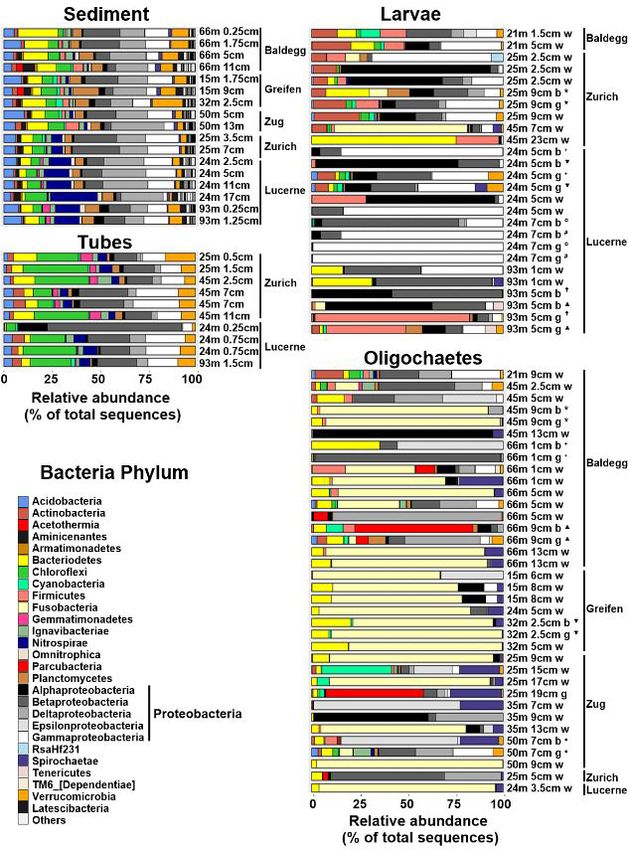
Biogeosciences, 18, 4369–4388, 2021 https://doi.org/10.5194/bg-18-4369-2021A. Fiskal et al.: Carbon sources of benthic fauna 4377 Figure 6. Relative abundances of Bacteria at the phylum level (Proteobacteria at class level) based on 16S rRNA gene sequences. Sequences were obtained from 17 sediment, 10 chironomid larval tube, 26 chironomid larvae (Nbody = 7, Ngut = 7, Nwhole = 12), and 36 oligochaete (Nbody = 5, Ngut = 6, Nwhole = 25) samples. Station and sample IDs are indicated by sample names, which indicate station water depth (m), sediment depth (cm), and portion of macrofaunal body analyzed (w = whole specimen, g = gut, b = body). Bodies and guts of the same specimens are marked by the same symbols. All sediment 16S rRNA gene sequence data are from Han et al. (2020). https://doi.org/10.5194/bg-18-4369-2021 Biogeosciences, 18, 4369–4388, 2021
4378 A. Fiskal et al.: Carbon sources of benthic fauna
3.4 Average contributions of methane-derived carbon
and TOC to macrofaunal biomass C
A two end-member mixing model suggests that on average
≥ 88 % of macrofaunal biomass-C can be explained with as-
similation of detrital organic C (TOC) (Table 2). By contrast,
methane-derived carbon accounts for ≤ 12.1 % or ≤ 6.3 % of
biomass-C depending on the assumed isotopic fractionation
factor during aerobic methane oxidation (for further details,
see Table 1 caption). Chironomid larvae and oligochaetes
from the same lakes have highly similar average methane-
derived carbon contributions to biomass. Consistent with
past studies (Hershey et al., 2006; Jones and Grey, 2011),
the contribution of methane-derived carbon to macrofaunal
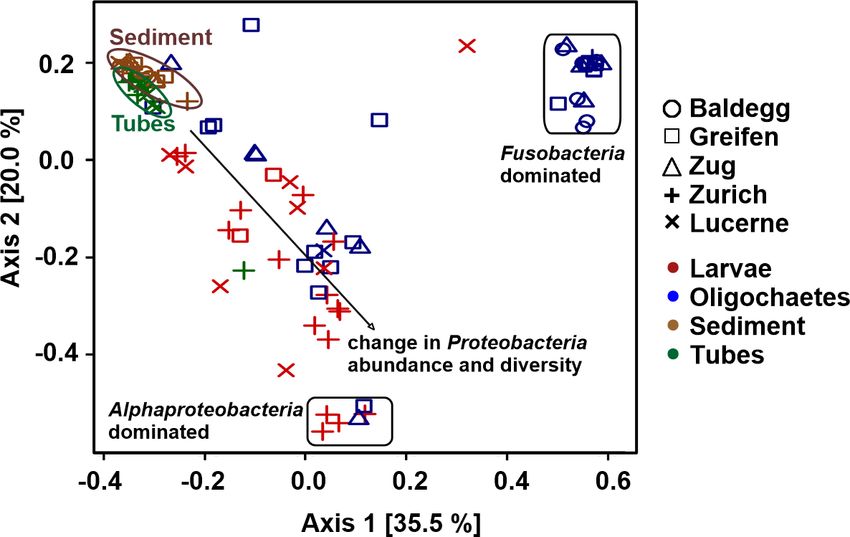
Figure 7. PCoA analysis of bacterial community structure at the
order level using Bray–Curtis distances. All sediment 16S rRNA biomass increases with trophic state, with the lowest contri-
gene sequence data are from Han et al. (2020). butions in Lake Zurich and Lake Lucerne and highest con-
tributions in Lake Baldegg, followed by Lake Zug and Lake
Greifen.
Lake Lucerne (oligochaetes: −31.7 ± 0.4 %, N = 2; larvae:
−31.5 ± 2.2 %, N = 24) and Lake Zurich (oligochaetes: 3.5 Microbial communities of macrofauna, larval
−32.8±0.9 %, N = 5; larvae: −32.5±2.1 %, N = 24). There tubes, and surrounding sediments
was no apparent trend between δ 13 C values of macrofauna
and sediment depth (Fig. S3 in the Supplement). To investigate the nature of macrofauna–microbiota associa-
Average δ 13 C-methane values are in all cases ∼ 35 % to tions, e.g., with respect to microbial gardening or grazing of
50 % more negative than those of macrofauna. The most neg- methane-cycling microorganisms or symbiotic relationships,
ative methane values are present in Lake Lucerne (−78.8 ± we studied 16S rRNA gene sequences of macrofauna (whole
4.3 %, N = 18) and Lake Zurich (−76.7 ± 2.4 %, N = 25), organisms, guts, residual body without guts) and chironomid
followed by Lake Baldegg (−74.3 ± 2.6 %, N = 20), Lake larval tubes and compared these to those in surrounding sed-
Greifen (−73.6 ± 3.7 %, N = 21), and Lake Zug (−70.1 ± iments (Fig. 6).
4.5 %, N = 23). All stations except the middle station in
Lake Baldegg have 13 C-methane increases indicative of 3.5.1 Bacteria
methane oxidation in surface layers (Fig. S3 in the Supple-
ment). Sediment and tube samples share similar bacterial com-
The δ 13 C values of TOC are much closer to those of munities across all lakes, stations, and sediment depths
macrofauna (Fig. 5; Fig. S3 in the Supplement), with av- (Fig. 6). Both sample types are dominated by β-, δ- and
erages ranging from equal (Lake Zurich) to ∼ 5 % higher γ -Proteobacteria, Chloroflexi (mainly Anaerolineae), Aci-
(Lake Baldegg). The lowest average δ 13 C-TOC was mea- dobacteria, Bacteroidetes (dominated by Sphingobacteriia),
sured in Lake Greifen (−34.5 ± 1.5 %, N = 35), followed Planctomycetes, and Verrucomicrobia. Furthermore, sedi-
by Lake Baldegg (−32.4 ± 1.2 %, N = 37), Lake Zurich ments and tubes from Lake Zurich and Lake Lucerne share
(−32.2±1.9 %, N = 29), Lake Zug (−30.8±1.3 %, N = 35), elevated fractions of Nitrospirae. Conspicuous differences
and Lake Lucerne (−29.7 ± 1.2 %, N = 32). Isotopic values are the higher fractions of δ-Proteobacteria in sediments and
of TOC increase by 4 %–6 % with sediment depth at all sites of Chloroflexi, Actinobacteria, Gemmatimonadetes, and Ig-
(Fig. S3 in the Supplement). Despite the small differences navibacteriae in tubes, as well as the virtual absence of
between δ 13 C-TOC and δ 13 C-macrofauna, δ 13 C-TOC values Aminicenantes in tubes. By comparison, chironomid lar-
are significantly higher than those of oligochaetes and larvae vae and oligochaetes have very different bacterial commu-
in all lakes except Lake Zurich (Fig. 5). Average δ 13 C-DOC nities, which moreover vary greatly between and within both
is slightly higher than δ 13 C-TOC in all lakes and significantly macrofaunal groups.
higher than the δ 13 C of macrofaunal biomass (Fig. 5). Ad- Depending on the specimens, bacterial communities
ditional analyses on water column algal material and algal of chironomid larvae are dominated by γ -, β-, and α-
bloom layers in sediment (Fig. S3 and Table S4 in the Sup- Proteobacteria, Firmicutes, Actinobacteria, Bacteroidetes,
plement) suggest δ 13 C values similar to those of TOC. and/or Fusobacteria. Many larval specimens are dominated
(> 50 % of reads) by a single group of α-, β-, or γ -
Proteobacteria or Firmicutes, and guts of two specimens
from Lake Lucerne contain ≥ 99 % γ -Proteobacteria. With
respect to dominant groups or ZOTUs, there is no clear trend
Biogeosciences, 18, 4369–4388, 2021 https://doi.org/10.5194/bg-18-4369-2021A. Fiskal et al.: Carbon sources of benthic fauna 4379 Figure 8. Ratios (expressed in %) of bacterial (BAC) 16S rRNA gene copy numbers (left panel), mcrA copy numbers (middle panel), and pmoA copy numbers (right panel) to total 16S rRNA gene copy numbers (sum of bacterial and archaeal 16S rRNA gene copy numbers). The three x axes differ in ranges and scales (linear and log). All sediment 16S rRNA gene values are from Han et al. (2020). Values on the lower limit of the x axis in the middle and right panels indicate samples in which mcrA or pmoA were below qPCR detection. in relation to lake, trophic state, or water depth. Yet, gut, and the body were detected in oligochaetes. This could, however, to a lesser extent body, bacterial communities from the same be due to the greater difficulty of separating guts from the samples are sometimes highly similar. Furthermore, bacte- rest of the body in oligochaetes. rial communities in guts often differ clearly from those in Ordination plots based on PCoA at the order level (Fig. 7) the remaining body. For instance, Firmicutes in several spec- and at the phylum, class, family, and genus levels (Fig. S5 imens dominate larval guts but are virtually absent from the in the Supplement) confirm the trends observed in Fig. 6. rest of the body. By contrast, the fractions of α- and β- Sediment and tube samples from all lakes and sediment Proteobacteria are often lower in guts than the remaining depths are highly similar and form tight clusters, which only body. Compared to tubes, chironomid larvae generally have become separated at the order level and below. Chirono- lower abundances of Chloroflexi (nearly absent), Verrucomi- mid larvae and oligochaetes are phylogenetically very dif- crobia, Gemmatimonadetes, Nitrospirae, and/or Ignavibacte- ferent from sediments and tubes and phylogenetically highly ria. heterogeneous due to the dominance of Fusobacteria or α- Bacterial communities of oligochaetes are also variable Proteobacteria or the varying relative abundances of diverse and differ clearly from those in chironomid larvae. As for proteobacterial classes and orders. chironomid larvae, these bacterial communities do not fol- low clear trends related to lake, trophic state, or water depth. 3.5.2 Archaea About half of all specimens are strongly dominated (≥ 80 % of 16S reads) by Fusobacteria (Fusobacteriales), a phylum Archaea only account for low percentages (< 10 %) of that accounts for on average only 0.01 ± 0.02 % of total 16S prokaryotic 16S rRNA gene sequences in chironomid larvae, reads in sediment samples and was only detected in ∼ 20 % larval tubes, and oligochaetes and were even below detection of larval specimens. Several other oligochaete specimens are in 69 % of chironomid larval and 39 % of oligochaete sam- dominated (> 50 %) by single groups of α-, β-, δ-, and ε- ples analyzed (Fig. S4 in the Supplement; also see following Proteobacteria, or Parcubacteria, or have elevated relative section). Yet, distinct trends are evident. Larval tubes have a abundances of Spirochaetae or Cyanobacteria. Most phyla lower diversity than sediments, being dominated by Woese-, that are abundant in sediment and/or larval tubes (Chlo- Pace-, and Thaumarchaeota and to a lesser degree Dia- roflexi, Acidobacteria, Gemmatimonadetes, Nitrospirae, Ver- pherotrites. In sediments, Eury- and Bathyarchaeota were ad- rucomicrobiae, Aminicenantes) are less common or nearly ditionally present in high percentages along with low per- absent from oligochaetes. Unlike chironomid larvae, no sys- centages of Altiarchaeales, Lokiarchaeota, and an unclassi- tematic phylogenetic differences between guts and the rest of fied phylum-level cluster of Asgardarchaeota. The archaeal https://doi.org/10.5194/bg-18-4369-2021 Biogeosciences, 18, 4369–4388, 2021
4380                                                                      A. Fiskal et al.: Carbon sources of benthic fauna

community of larvae was highly variable and dominated by         samples. While pmoA contributions decrease with depth in
Pace-, Eury- and Woesearchaeota, with typically only one to      sediments, there is no clear depth trend in oligochaete or
two phyla present per sample. The oligochaete archaeal com-      larval tube samples. The 16S rRNA gene sequences indi-
munity was more diverse and dominated by essentially the         cate that all methane-oxidizing bacteria are γ -Proteobacteria,
same groups as sediments, i.e. Woese-, Pace-, Bathy-, Eury-,     dominated by Crenothrix (Methylococcales). Crenothrix are
and/or Thaumarchaeota and to a lesser degree Lokiarchaeota,      moreover the only methane-oxidizing bacterium detected in
Altiarchaeales, and Diapherotrites.                              oligochaetes, whereas low read percentages of Methylococ-
                                                                 caceae (Methylobacter, Methylocaldum, Methylococcus, and
3.6    Abundance analysis of Bacteria, Archaea, and              Methyloparacoccus) were detected in larvae, larval tubes,
       functional genes related to methane cycling               and sediments. In addition, the denitrifying methanotroph
                                                                 Methylomirabilis (candidate phylum NC10) was detected
To further investigate potential interactions between macro-     in low read numbers in several tube and sediment sam-
fauna and microorganisms in general, and methane-cycling         ples (mostly from Lake Lucerne). Despite the significantly
microorganisms in particular, we compared the contribu-          higher calculated abundance of methane-oxidizing bacteria
tions of Bacteria, methane-cycling archaea, and methane-         in oligochaetes based on ratios of pmoA to total 16S rRNA
oxidizing bacteria across sample types. Trends related to        gene copy numbers, we did not detect significantly different
lake trophic state and gardening of or preferential grazing on   16S read percentages between larvae, tubes, oligochaetes, or
methane-cycling microorganisms are largely absent, but we        sediments (data not shown).
observe other trends.
   Bacteria account for > 80 % of total 16S gene copies in
all samples (Fig. 8, left panel). Significantly higher pro-      4   Discussion
portions are present in oligochaetes, larvae, and tubes rela-
tive to sediments (Table 3). The contribution of Bacteria de-    Methane has been indicated as an important C source to
creases from 94 %–98 % in surface sediments to 82 %–86 %         lacustrine sedimentary macrofauna (Kankaala et al., 2006;
below 12 cmblf. By comparison, Bacteria contribute ≥ 99 %        Deines et al., 2007a; Jones et al., 2008; Jones and Grey,
in most macrofauna samples. The lowest bacterial contribu-       2011). Yet, open questions remain regarding the conditions
tions are ∼ 98 % in chironomid larvae, 90 % in oligochaetes,     under which this methane-derived carbon is an important C
and 96 % in tubes.                                               source or how it is incorporated into macrofaunal biomass.
   In the vast majority of samples, mcrA gene copy numbers       We investigate these questions by analyzing macrofaunal
are ≥ 100 times lower than total 16S rRNA gene copy num-         community structure, isotopic compositions of macrofauna
bers (range: below the detection limit of ∼ 0.0001 % to 2 %)     and possible C sources, and microbial community struc-
(Fig. 8, middle panel), suggesting very low contributions        ture across five temperate lakes with widely differing trophic
of methanogenic and/or anaerobic methanotrophic archaea.         states.
The mcrA contributions are significantly higher in sediments        We observe a clear macrofaunal community shift, with
compared to oligochaetes, larvae, and tubes (Table 2) and        oligochaetes dominating eutrophic lakes, chironomid larvae
are even below qPCR detection in all but one larval speci-       dominating the oligotrophic lake, and similar abundances of
men. While the contribution of mcrA increases with depth         both in the mesotrophic lake (Fig. 2). Maximum abundances
in larval tubes, oligochaetes and sediments show no depth-       of oligochaetes are higher than those of chironomid larvae,
related trends. The 16S rRNA genes of methane-cycling Ar-        and oligochaetes extend deeper into sediments than chirono-
chaea were found in sediments (mainly Methanobacteria and        mid larvae, matching the different feeding behaviors of the
M. fastidiosa) and at very low read numbers in a few tubes       two groups (Fig. 3). Taxonomic analyses reveal overlaps but
(M. fastidiosa) and oligochaetes (M. fastidiosa, M. peredens)    also clear differences in oligochaete and chironomid larval
but not in larvae.                                               communities between lakes (Fig. 4).
   The pmoA contributions range from below detection (≤∼            While chironomid communities vary strongly with water
0.001 %) to ∼ 15 % (Fig. 8, right panel) and are – com-          depth in the same lakes, oligochaete communities are more
pared to sediments – significantly elevated in oligochaetes      similar across different locations within the same lake. This
but not in larval specimens or larval tubes (Table 3). This      suggests that chironomid larval and oligochaete communities
suggests the potential for preferential grazing by, or ele-      are controlled by different environmental factors.
vated populations of symbiotic aerobic methanotrophic bac-          Comparing 13 C isotopic compositions, 13 C-methane is al-
teria within, oligochaetes. Nonetheless, it is worth men-        ways far more negative (−35 to −50 %), while 13 C-TOC
tioning that the median calculated pmoA percentage in            is similar or slightly enriched (+0.3 to +5.2 %) relative to
oligochaetes was only ∼ 1 % and that based on the max-           macrofaunal biomass. This suggests that detrital organic mat-
imum calculated value of 15 % methane-oxidizing bacteria         ter is the main C source of macrofauna (Fig. 5). Estimated
in no case dominated oligochaete bacterial communities. As       contributions of methane-derived carbon range from statisti-
for mcrA, pmoA was only detected in very few (2) larval          cally insignificant to at most 12 % and increase with trophic

Biogeosciences, 18, 4369–4388, 2021                                                https://doi.org/10.5194/bg-18-4369-2021
A. Fiskal et al.: Carbon sources of benthic fauna 4381
state (Table 2). Despite differences in feeding behavior and tain species of chironomid larvae (Pinder, 1995). Additional
environmental drivers of their species compositions, the cal- reasons could be the superior ability of oligochaetes to ex-
culated contribution of methane-derived carbon is highly ploit high organic matter supplies or that deeper burrows of
similar across chironomid larval and oligochaete specimens oligochaetes provide better protection from benthic preda-
from the same lakes, suggesting an important role of lake- tors, such as bottom-feeding fish, which are abundant in eu-
specific variables. trophic lakes (Scheffer et al., 1993).
Bacterial communities of macrofauna differ clearly from While most oligochaete specimens could only be clas-
those in chironomid tubes or sediments. The majority of sified to the family level – Tubificidae (+bristles); Tubi-
reads in many macrofaunal specimens belong to single ZO- ficidae (− bristles); Fig. 4; Table S7 in the Supplement –
TUs, implying potential symbiotic relations with their hosts distributions of those that were taxonomically classifiable
(Figs. 6 and 7; discussed in detail later). Consistent with to the species level match published distributions. On one
the calculated minor contributions of methane-derived C hand, subsurface deposit feeders known to rely on bacte-
to macrofaunal biomass, pmoA copy numbers indicate that ria and algae as food sources dominated eutrophic lakes.
methane-oxidizing bacteria are minor, yet significant, com- L. hoffmeisteri, an indicator species of eu- to hypertrophic
ponents of bacterial communities in numerous macrofaunal lakes (Brinkhurst, 1982), occurs in high abundances in Lake
specimens (∼1 %–10 %; Fig. 8, right panel; Table 3). This Baldegg (Table S7 in the Supplement). P. hammoniensis and
is not the case for methane-cycling archaea, whose con- T. tubifex, which frequently co-occur in high abundances in
tribution, based on mcrA copy numbers, was always small mesotrophic to eutrophic lakes (Lang, 1990; Timm, 1996),
(≤ 1 %) and significantly lower in oligochaetes, chironomid dominate Lake Zurich, Lake Zug, and Lake Greifen. On the
larvae, and chironomid larval tubes than in surrounding sed- other hand, surface-deposit-feeding E. velutinus, which indi-
iment (Fig. 8, middle panel; Table 3). cates oligo- to mesotrophic conditions (Martin et al., 2008),
In the following sections, we discuss in detail the potential was only found in Lake Zurich.
drivers of macrofaunal community structure, the likely car- Even though many tubificids are subsurface conveyor
bon sources of macrofauna, and the potential trophic roles feeders, the lakes investigated show little evidence of sed-
of observed (endo-)symbiotic bacteria in their macrofaunal iment mixing. We observed clear laminations at the deep
hosts. station in Lake Baldegg and the deep and middle station in
Lake Greifen in sediments that were being deposited until
4.1 Abundance and taxonomy of macrofauna along the mid-1980s and ∼ 2010, respectively (Fig. 3, Fig. S7 in
trophic state the Supplement; Fiskal et al., 2019), so until the onset of ar-
tificial water column mixing and oxygenation in these lakes
Oligochaete abundances follow the environmental index pro- (Lake Baldegg in 1984 and Lake Greifen in 2009; Fiskal
posed previously by Milbrink (1983) which predicts a strong et al., 2019). While the subsequent disappearance of lami-
rise in worm abundance with increasing trophic state. Chi- nae suggests rapid re-colonization by macrofauna, it appears
ronomid abundances are also within the range previously re- that mixing has remained limited to surface sediments even
ported for lakes (Mousavi, 2002). While chironomid larvae though burrows of tubificids extend far into laminated lay-
show typical depth distributions (e.g., Panis et al., 1996), ers. Depth profiles of radionuclides confirm this interpreta-
oligochaetes have unusually deep ranges, with high abun- tion and even indicate minimal sediment mixing in the pres-
dances to 10–14 cm in eutrophic lakes. By contrast, most ence of macrofauna (Fig. S7 in the Supplement). Indepen-
publications report that oligochaetes are mainly present at 2– dent of faunal presence, 137 Cs peaks that match the 1986
8 cm sediment depth (reviewed in McCall and Tevesz, 1982). (Chernobyl) and 1963 (bomb test) time markers, and clear
The observed shift in dominance from chironomid larvae 210 Pb
unsupported decreases from the top 2 cm downward, are
to tubificids with increasing trophic state (Fig. 2, Fig. 3) present at all stations. These findings contrast with the rapid
matches past studies reporting the dominance of oligochaetes sediment homogenization to 10 cm by tubificids in the labo-
in eutrophic lakes (Saether, 1980; Lang, 1985; Timm, 1996; ratory (Fisher et al., 1980; Matisoff et al., 1999) and homo-
Bürgi and Stadelmann, 2002) and changes from chironomid- geneous radionuclide profiles to 6 cm in tubificid-dominated
larva- to oligochaete-dominated communities as the first natural lake sediments (Robbins et al., 1977; Krezoski et al.,
signs of eutrophication (Saether, 1979). This dominance 1978). Similar to tubificids, chironomid larval communities
of oligochaetes in eutrophic lakes is possibly related to change in relation to trophic state (Fig. 4; Table S7 in the
an overall higher tolerance of low O2 conditions as many Supplement). Large free-living and predatory larvae account
oligochaetes feed in anoxic parts of sediments (McCall and for half of the specimens in Lake Lucerne, whereas tube-
Tevesz, 1982) and efficiently exchange gases through their building herbivorous, surface detritus-feeding, and garden-
body walls (Martin et al., 2008). Longer survivorship of ing larvae dominate Lake Zurich and the small sample sizes
anoxic conditions among oligochaetes is also possible (Ham- in eutrophic lakes. The shift in diet at higher trophic levels
burger et al., 1998), though anaerobic respiration and tol- matches the higher input of algae and algal detritus (Fiskal
erance of extended anoxic periods is also known for cer- et al., 2019), whereas the potential increase in microbial gar-
https://doi.org/10.5194/bg-18-4369-2021 Biogeosciences, 18, 4369–4388, 20214382 A. Fiskal et al.: Carbon sources of benthic fauna
dening matches observed increases in gardening by C. ripar- growth of methane-oxidizing bacteria is mainly promoted
ius and other Chironomus spp. under hypoxic or eutrophic at narrow oxic–anoxic (high O2 -methane) interfaces pro-
conditions (Stief et al., 2005; Yasuno et al., 2013). By con- duced by ventilating and tube-building chironomid larvae
trast, the reasons for the high abundances of predatory larvae (Brune et al., 2000). Tubificids, which dominated our eu-
in Lake Lucerne are unclear. Possible reasons are the low trophic lakes, do not produce such stable oxic–anoxic inter-
hypoxia tolerance of large predatory Macropelopia and Pro- faces and also perform less burrow ventilation than chirono-
cladius spp. (Hamburger et al., 1998; Brodersen et al., 2008), mid larvae (Gautreau et al., 2020 and references within). Yet,
higher availability of zooplankton food in oligotrophic lakes the fact that all three identified larvae from Lake Baldegg be-
(Jeppesen et al., 1990; Jeppesen et al., 1999), and/or stronger long to tube-building taxa and that the four isotopically ana-
predation pressure in mesotrophic and eutrophic lakes, which lyzed larvae from this lake only had minor methane-derived
often have high populations of bottom-feeding fish (Scheffer carbon contributions suggests that yet unknown factors con-
et al., 1993). tribute to the enrichment of methane-oxidizing bacteria by
tube-building chironomids in surface sediment.
4.2 Carbon sources of lake sedimentary macrofauna Instead of methane-derived carbon, our C-isotopic data in-
dicate that algal or detrital organic carbon, or microorgan-
Similar to previous studies (e.g., Grey et al., 2004; Jones isms that have assimilated the isotopic signatures of algal or
et al., 2008) we calculate an increase in the contribution of detrital organic carbon, is the main food source of dominant
methane-derived carbon with increasing trophic state (Fig. 5; macrofauna (Table 2). Rather than methane-derived carbon,
Table 2). Yet, this contribution is at most 12 %, even in selective feeding on isotopically depleted subportions of the
the highly eutrophic lakes. Other studies have estimated TOC pool could even, in principle, explain the minor isotopic
methane-derived carbon contributions of > 40 % for chi- depletions of oligochaete and chironomid larval biomass in
ronomid larvae in eutrophic lakes (e.g., Deines and Grey, eutrophic lakes. Yet, our limited data on algal bloom layers in
2006; Eller et al., 2007; Jones et al., 2008) and reported sediments and phytoplankton from overlying water indicate
strong δ 13 C depletions in oligochaete specimens from pro- similar 13 C values relative to TOC (Fig. S5 in the Supple-
fundal sediment (Premke et al., 2010). Yet, minor contribu- ment). Preferential feeding on organic C from surface sedi-
tions of methane-derived carbon to the biomass of benthic in- ments, which in many cases has the lowest C-isotopic values,
vertebrates are not new. A survey of 87 lakes suggested that or isotopic fractionations during C-assimilation and biosyn-
marked 13 C depletions were only present in chironomid lar- thesis are also not plausible. As bottom-up conveyor feed-
vae from lakes with seasonal stratification and bottom water ers, tubificids feed mostly at several centimeters depth (Mc-
anoxia (Jones et al., 2008). Moreover, the limited published Call and Tevesz, 1982), and C-isotopic fractionation during
δ 13 C data on lake oligochaetes are mostly similar to those of biosynthesis of bulk animal biomass is typically low (Fry and
TOC (Kiyashko et al., 2001; Premke et al., 2010). Sherr, 1989).
In support of C-isotopic interpretations, DNA-based anal-
yses indicate that neither methane-oxidizing bacteria nor 4.3 Potential diet and host–microorganism interactions
methanogens are dominant microorganisms in surface sed- in tubificid worms
iments or chironomid larval tubes. Thus, strong enrichment
or gardening of methane-oxidizing bacteria or methanogens Minimal sediment reworking and deep sedimentary distribu-
as observed elsewhere in chironomid tubes (e.g., Kajan and tions of tubificids suggest that shallow subsurface deposit
Frenzel, 1999; Kelly et al., 2004) or surface sediments (e.g., feeding may not be the main dietary mode of these worms
Eller et al., 2005; Deines et al., 2007a) is absent for rea- in the lakes studied, raising questions concerning their main
sons that are unclear. Despite being artificially oxygenated, foraging strategy. One possibility is that oligochaetes selec-
bottom water in Lake Baldegg and Lake Greifen experi- tively graze on microbial biofilms inhabiting the walls of
ences seasonally low O2 conditions (0.5–4 mg L−1 ) or hy- their deep and extensive gallery-type burrow networks. Un-
poxic conditions (< 0.5 mg L−1 ), respectively (Fiskal et al., der this scenario one might expect large amounts of DNA
2019). These values are within or below the seasonal O2 of sediment microorganisms in oligochaete intestines. This
threshold (2–4 mg L−1 ) that is characteristic of lakes with is not the case, however, suggesting that grazed communities
marked 13 C depletions in chironomid biomass (Jones et al., are very different from those in sediments or their DNA is
2008). Jones et al. (2008) argued that the contribution of rapidly digested. Another foraging strategy may not involve
methane-derived carbon increases inversely with the depth ingestion via the oral cavity but diffusive uptake. T. tubifex
of the oxic–anoxic interface. In June 2016, this interface can actively take up short-chain organic acids, such as acetate
was ≤ 1 mm at all stations in Lake Baldegg and ≤ 2 mm and propionate, through their body wall (Hipp et al., 1985;
at those in Lake Greifen, while methanogenesis occurred in Sedlmeier and Hoffmann, 1989). The subsequent respiration
the top 1 cm of sediment (Fiskal et al., 2019). Thus, condi- of these organic acids can account for up to 40 % of T. tubifex
tions were potentially well-suited for the strong enrichment energy turnover (Hipp et al., 1986). Other species of tubifi-
of methane-cycling microorganisms. It is possible that the cids take up amino acids through the body wall (Brinkhurst
Biogeosciences, 18, 4369–4388, 2021 https://doi.org/10.5194/bg-18-4369-2021You can also read