Dayara bugyal restoration model in the alpine and subalpine region of the Central Himalaya: a step toward minimizing the impacts
←
→
Page content transcription
If your browser does not render page correctly, please read the page content below
www.nature.com/scientificreports
OPEN Dayara bugyal restoration model
in the alpine and subalpine region
of the Central Himalaya: a step
toward minimizing the impacts
Jagdish Chandra Kuniyal 1*, Priyanka Maiti 1*, Sandeep Kumar2, Anand Kumar1,
Nisha Bisht1, K. Chandra Sekar 1, Satish Chandra Arya1, Sumit Rai1 & Mahesha Nand 1
Eco-restoration initiative work in the high altitude Dayara pastureland (3501 m) from the Indian
Himalayan Region has been considered to be one of the successful field demonstration against
both natural and anthropogenic degradation. The present study therefore attempts to assess the
implications of entire eco-restoration model as practiced by Department of Forest, Government of
Uttarakhand in 2019. Its assessment was done by calculating restoration success index by way of
considering three categories, viz., direct management measure (M), environmental desirability (E)
and socio-economic feasibility (SE) considering 22 individual variables. ‘M’ comprised both biotic and
abiotic pressures. Grazing and tourism were biotic, while abiotic pressure was considered mainly soil
erosion in alpine area due to topographic fragility. Above ground vegetation profile and below ground
soil nutrient profile (N, P, K, pH and water holding capacity) were analyzed in ‘E’ component. In the
last but not least, ‘SE’ was analyzed to assess the social acceptability of the local communities and
stakeholders who are supposed to be ultimate beneficiary of alike interventions. Direct management
measure was found with the variable index score of 0.8 indicating the higher score as compared to
environmental desirability (0.56). Under direct management measure, grazing and tourists’ carrying
capacity of the area was analyzed with high management needs to call the region sustainable in terms
of availability of bio-resources. The ecosystem index score was evaluated for the reference (81.94),
treated (64.5) and untreated zones (52.03), wherein increasing profile of these values were found. The
outcomes like improved vegetation profile in terms of total herb density, soil nutrient profile of the
restored area along with soil pH (4.96) and water holding capacity (49.85%) were found to be restored
significantly along with controlling 169.64 tonne year-1 soil erosion from draining. The assessment of
grazing pattern of 118 migratory Cow Unit (CU) (76 horse/mule and 18 sheep/goat, already controlled),
318 local CU (30 horse/mule and 187 sheep/goat) were calculated and recommended to be controlled.
Tourists’ carrying capacity of 274 tourists per day and manual removal of Rumex nepalensis at the
shepherd camping site were found to be worth to apply in the area. Use of biodegradable but locally
sourced material and engaging local villagers in this endeavor were also found to be in harmony with
SDG Goal 1 (no poverty). Therefore, the restoration and its evaluation model could have its future
prospects to prove as a successful restoration practice. This restoration practice could not only be
worth in high altitude degraded alpine pastures of the Indian Himalayan Region but also to other
mountain alpine and sub-alpine ecosystems.
In the present scenario, gradual degradation of high elevation mountain eco-systems and their rational ecological
management have been a matter of great c oncern1. Although several restoration efforts have been made in high
altitude forests, treeline zone and wetland, yet restoration in meadows especially in alpine and sub-alpine have
not been much reported so far as they are unique, complex, and fragile natural area associated with restoration
implementation difficulties2–4.
1
G. B. Pant National Institute of Himalayan Environment, Kosi‑Katarmal, Almora 263 643, Uttarakhand,
India. 2Divisional Forest Office, Tarai East Forest Division, Uttarakhand Forest Department, Haldwani,
Uttarakhand 263 139, India. *email: jckuniyal@gmail.com; priyankamaiti.06@gmail.com
Scientific Reports | (2021) 11:16547 | https://doi.org/10.1038/s41598-021-95472-y 1
Vol.:(0123456789)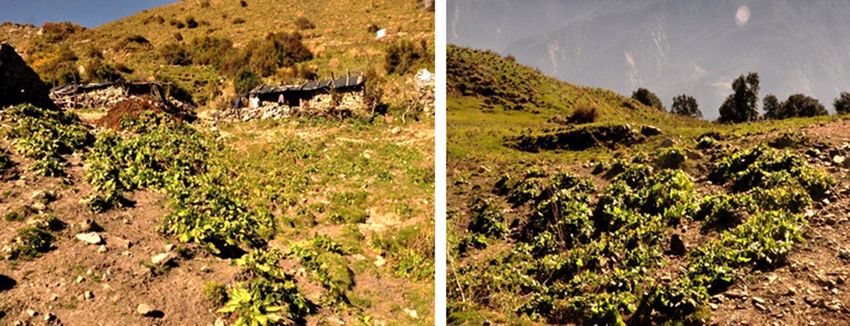
www.nature.com/scientificreports/
Land restoration in high altitude degraded pasture areas addresses diverse issues associated with Sustainable
Development Goals (SDGs). As restoration activities produce employment, thus improving the socioeconomic
conditions of the poor (SDG-1, no poverty) needs a priority. Its successful examples include use of bamboo for
land restoration in China, Ethiopia, Cameroon, Vietnam, India, Madagascar, Ghana, the Philippines and K enya5.
Other co-benefits of land restoration include increased community resilience (SDG-2, zero hunger), improved
good health and well-being (SDG-3) of the associated villages, impacts on access to quality education (SDG-4,
quality education), income generation for women villagers (SDG-5, gender equality), restores ground water and
in turn ensure future clean water availability (SDG-6, clean water and sanitation), and also have direct impact
on SDG-13 (climate action), SDG-15 (life on land) and SDG 17 (partnerships to achieve the goal) (United
Nations Environment Programme, 2020). In context to land restoration, degradation of high altitude pastureland
leading to soil erosion nowadays have become a matter of great concern. Some of the examples of such lands
include, montane grasslands of the north-eastern Italian Alps (Italy)6, Asteroussia Mountains (Greece)7, and
High Himalayas in Nepal and I ndia8.Therefore, restoration of alpine pastures is a global need. Some restoration
guidelines available for low altitude forest and degraded lands include Restoration Opportunities Assessment
Methodology (ROAM)9, International principles and standards for the practice of ecological restoration, Eco-
logical Restoration Guidelines for British C olumbia10 and Assessing Landscape Restoration Opportunities for
11
Uttarakhand, India, etc. .
Some examples of the restoration activities of Govind Ballabh Pant National Institute of Himalayan Envi-
ronment (GBP-NIHE), Kosi, Almora, Uttarakhand, India have been implemented in Indian Himalayan Region
include Sloping Watershed Environment Engineering Technology (SWEET) developed by GBP-NIHE in 1994,
Badrivan Restoration Programme (BRP) at Badrinath, Uttarakhand in 1993, development of an agroforestry
model at Bansbara village, Rudraprayag District Uttarakhand in 2001, forest eco-restoration programme at Kolid-
haik, Lohaghat, Uttarakhand in 2004, community wasteland (open grazing land) restoration at Arah village in
1992, Bageshwar District, Uttarakhand, silvi-pasture development in Uttarakhand, rehabilitation of Bhimtal lake,
Nainital, Restoration of Surya Kunj at Katarmal, Almora, Uttarakhand, Dhoranalla and Mohal Khad (seasonal
stream) restoration work in Mohal, Kullu, Himachal Pradesh, implementation of Contour Hedgerow Farming
System Technology (CHFST) in Sikkim in 2005, and rehabilitation of degraded community land in Gumod,
Champawat district, U ttarakhand12.
Still restoration activities in high altitude degraded grasslands have neither proper guideline nor field exam-
ples available till date. In this regard, the present work is a field illustration of eco-restoration in high altitude
grassland at Dayara alpine pasture (3501 m) which was initiated by the Department of Forest, Govt. of Uttara-
khand. So, the present attempt aims at evaluation of its impact in terms of grazing capacity, carrying capacity
of tourists, overall land stabilization from soil erosion, vegetation profile especially plant growth, soil nutrients
availability, etc. The applied restoration approach for current work is in harmony with the “Scientific Conceptual
Framework for Land Degradation Neutrality” by the United Nations Convention to Combat Desertification
(UNCCD) Science-Policy Interface13, and also concerns restoration definitions established by the Society for
Ecological Restoration14.
Study area
The study area of the current work is the Dayara alpine meadow (3501 m) from Uttarkashi district of Uttara-
khand, India. The Dayara bugyal lies from 30°49′18.53"N to 78°32′31.20"E to 30°50′31.82"N to 78°33′24.71"E
and covers an area of 3.38 sq km (Fig. 1). The entire area comprises extraordinary ecological diversity with a
large adjoining regions that helps in maintaining significant biodiversity of both the Himalayan wildlife flora and
fauna. The pasture area is mainly dominated by three types of vegetation, namely, herbaceous meadow (Rumex
nepalensis Spreng., Anaphalis cuneifolia (DC.) Hook. f., Hackelia uncinata (Royle ex Benth.) C.E.C. Fisch.,etc.),
shrubberies (Rhododendron anthopogon D. Don—Rhododendron campanulatum D. Don) and stable boulder
(Bergenia strachyei (Hook. f. & Thomson) Engl., Arnebia benthamii (Wall. ex G. Don) I.M. Johnst., etc.)15. Faunal
diversity of the area consists of the Himalayan wildlife species like Musk dear (Moschus leucogaster, Hodgson,
1839), Brown bear (Ursus arctos isabellinus Horsfield, 1826), Himalayan Thar (Hemitragus jemlahicus C.H. Smith,
1826), Monal Pheasant (Lophophorus impejanus Latham, 1790), etc. It is the origin site of two important tribu-
taries of River Bhagirathi, locally known as Papad Gad (local stream) and Swari Gad. Both the streams not only
provide drinking and irrigation water to the downstream villages of Raithal, Kyark and Barsu but also maintain
the geo-hydrological system of the entire area. The place is also famous for its natural beauty and a favourable
tourist spot which have led to a variety of adverse impacts like increase in solid waste, trampling due to night
camps and other anthropogenic activities. Apart from these, the ecosystem has experienced the adversities of
climate change as heavy rainfall, flash floods, cloudbursts, etc. leading to disasters in the lower catchment of the
Bhagirathi valley. Along with this, the nomadic tribe known as Gujjars seasonally migrate to this pastureland
for grazing with the onset of spring and stay there till autumn. The unattended cattle of the adjacent villages
also occupy the area in spring and summers resulting in habitat d egradation16. Gradual increase in mean annual
temperature and decrease in mean annual precipitation was also reflected from the climatic profile of the area
with gridded resolution 0.5 x 0.5° (CRU TS 4.04, land) (Supplementary Table S1, S2).
Results
Direct management measure (M). Grazing capacity of the Dayara bugyal was calculated by evaluating
the standard forage production and daily demand of the livestock population. Total 70 species were found in
the sampled grazing areas dominated by Anaphalis cuneifolia, Taraxacum officinale W.W. Weber ex F.H. Wigg.,
Iris kemaonensis Wall. ex Royle, Sibbaldia parviflora Willd., Kobresia nepalensis (Nees) Kk., Trifolium repens L.,
Danthonia cachemyriana Jaub. & Spach, Carex nubigena D. Don, etc. Among the studied vegetation, 37 domi-
Scientific Reports | (2021) 11:16547 | https://doi.org/10.1038/s41598-021-95472-y 2
Vol:.(1234567890)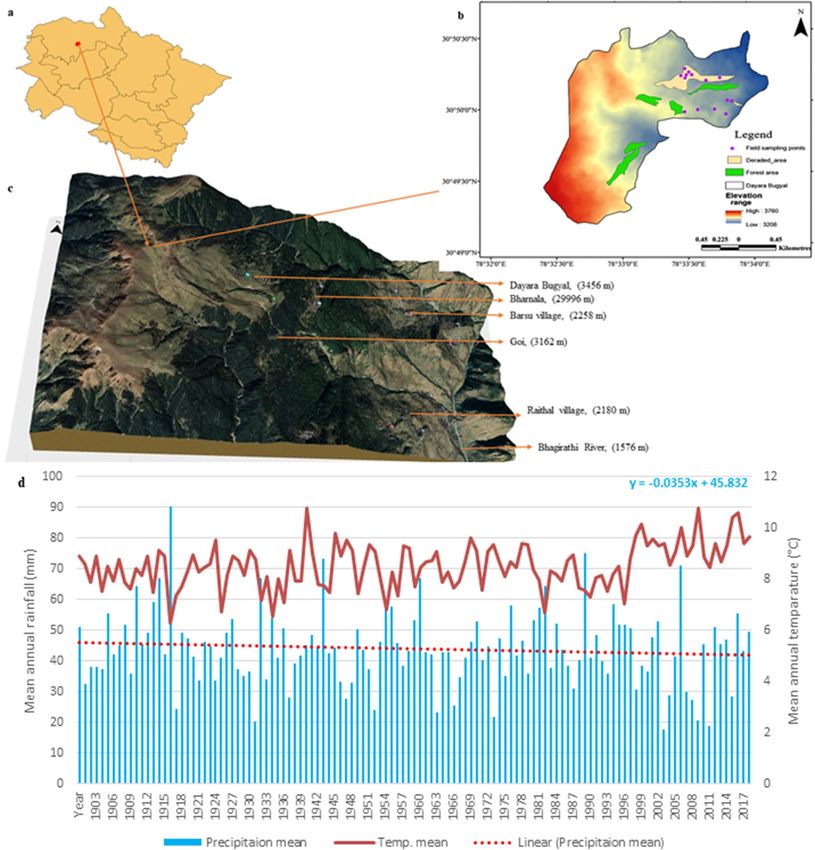
www.nature.com/scientificreports/

                                  Figure 1.  (a, b, c) Geographical extent, and (d) climatic profile of the study area. {Source: CRU TS 4.04 (land),
                                  0.5°}.

                                  nant palatable species recorded with the 52% of the total number of studied species (palatable & unpalatable)
                                  were selected for calculation of forage production (Supplementary Table S3). Total dry forage yield of the Dayara
                                  bugyal was calculated 10,003 quintal per year (Table 1) and yield of standard dry forage was 5001 quintal per
                                  year which was 50% of the total yield for 4.23 sq km area. Only suitable area for grazing was considered for the
                                  present work. Intake of one Cow Unit (CU) was calculated 7.5 kg dry matter per day and 153 (May–September)
                                  days grazing time was taken into account. The grazing capacity of the area was calculated as 436 cow unit per
                                  year. Total migratory animal data for Taknor range and livestock census data for the village livestock were found
                                  increasing in last 10 years (Supplementary Table S4). As a part of management measure, grazing camps of Barsu
                                  villagers were then shifted away from Dayara to Lambidhar. Migratory animals were also found to be reduced
                                  reasonably in the Tanknor range. According to the migratory animal record of Forest Department Uttarkashi
                                  (2020) and livestock census data, total 881 CU were found to be grazed in the area in the year 2019. This value
                                  exceeds the grazing capacity but the numbers of migratory animals (Gujjars) were found to be continuously
                                  decreasing at a rate of 20 CU per year (Fig. 2).

Scientific Reports |   (2021) 11:16547 |               https://doi.org/10.1038/s41598-021-95472-y                                                      3

                                                                                                                                               Vol.:(0123456789)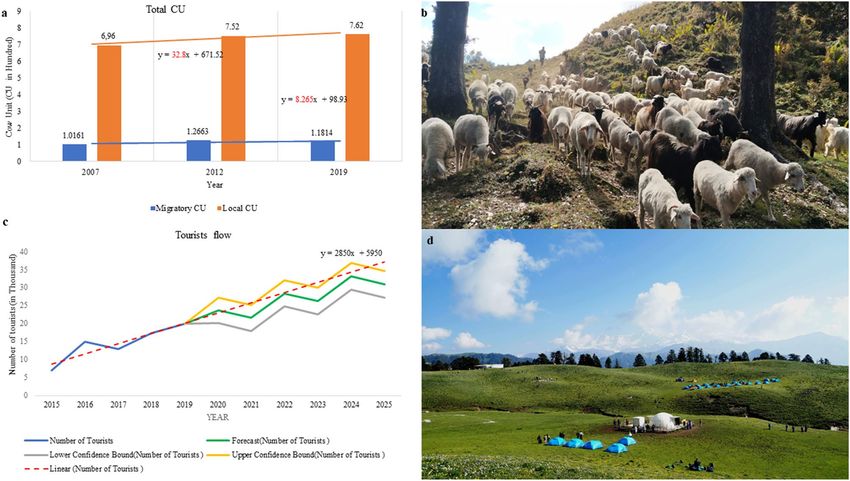
www.nature.com/scientificreports/
Plant name Density (individual/m2)* Above ground biomass (g/m2)* Forage yield (quintal /year)
Aconogonum tortuosum (D. Don) Hara 0.4 4.2 177.86
Anemone obtusiloba D.Don 0.23 2.68 113.49
Arnebia benthamii (Wall. ex G. Don) I.M.
0.06 12.8 542.04
Johnst.
Bistorta vivipara (L.) Gray 9.8 16.8 711.43
Bupleurum longicaule Wall. ex DC 0.2 1.3 55.05
Carex nubigena D. Don 4.42 1.5 63.52
Carex setigera D. Don 0.82 7.2 304.90
Cyananthus lobatus Wall. ex Benth. 0.57 6.1 258.32
Dactylorhiza hatagirea (D.Don) Soo 0.23 1.3 55.05
Danthonia cachemyriana Jaub. & Spach 0.33 60.2 2549.30
Epilobium latifolium L. 0.24 1.1 46.58
Eritrichium canum (Benth.) Kitam. 0.62 1.2 50.82
Euphorbia stracheyi Boiss. 0.2 1.4 59.29
Galium rotundifolium L. 0.23 0.2 8.47
Gentiana argentea (D.Don) Griseb. 0.23 0.8 33.88
Geranium wallichianum D.Don ex Sweet 0.3 0.9 38.11
Geum elatum Wall. ex G. Don 0.2 1.2 50.82
Impatiens scabrida DC. 0.31 1.3 55.05
Origanum vulgare L. 1.22 4.3 182.09
Oxygraphis polypetala (D.Don) Hook.f. &
0.02 1.4 59.29
Thomson
Parnassia nubicola Wall. ex Royle 0.27 3.4 143.98
Picrorhiza kurrooa Royle ex Benth 0.08 1.2 50.82
Poa alpina L. 0.23 1.1 46.58
Polygonum polystachyum Wall. ex Meisn. 0.4 1.8 76.22
Potentilla argyrophylla Wall. ex Lehm. 0.5 2.2 93.16
Potentilla atrosanguinea G. Lodd. ex D. Don 0.3 2.1 88.93
Potentilla fulgens Wall. ex Hook 0.13 1.7 71.99
Primula denticulata Sm. 0.4 2.9 122.81
Prunella vulgaris L. 4.43 6.3 266.79
Ranunculus hyperboreus Rottb. 0.4 6.1 258.32
Rumex nepalensis Spreng. 1.19 10.8 457.35
Salix lindleyana Wall. ex Andersson 0.01 22.6 957.04
Taraxacum officinale F.H. Wigg 9.79 15.04 636.90
Trachydium roylei Lindl. 19.33 22.2 940.11
Trifolium repens L. 0.53 4.2 177.86
Valeriana hardwickii Wall. 0.04 0.5 21.17
Viola biflora L. 4.24 4.2 177.86
Table 1. Standard forage production in the Dayara alpine pastureland. *Mean values are considered.
During the last 5 years, the tourists’ flow in the Dayara bugyal was found to be increased by 186%. Nearly 2850
tourists are found to be increasing every year. According to the linear regression predictive model, the tourists’
number may be projected to be 30,999 per year by 2025, which indicates an expected increase of 343% tourists
(Supplementary Table S5). The tourists’ carrying capacity of the area was calculated to be 80,093–100,116 tour-
ists per year (Table 2), taking into account the correction factors like rainfall, snowfall, tourists’ infrastructure,
ecological parameters and socio-economic parameters. The tourists’ influx of the Dayara bugyal in 2019 was
nearly 54 tourists per day. While based on our estimation, 275 tourists may be allowed for the place which reflects
the necessity to promote tourism in the area.
For the measurement of tourism activity, Hon’ble High Court Uttarakhand, Nainital, in WPPIL No.123 of
2014 order, 200 tourists per day for bugyal areas need to be followed. After analysing tourists’ data of the area,
it was found under control and are not exceeding more than 200 tourists per day.
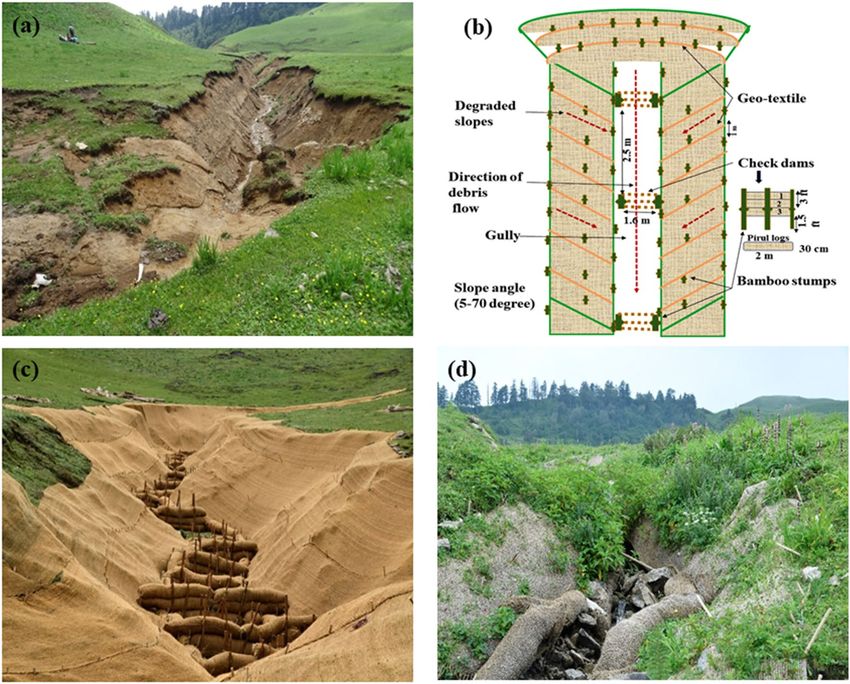
In view of controlling soil erosion, 170 tonne of soil was found to be arrested by the 38 check dams created
among three gullies (Supplementary Table S6). The horizontal sheet erosion in highly steep sloped areas near
the gullies also found to be controlled using the eco-friendly geo textile matting (Fig. 3).
Environmental desirability (E). Environmental desirability was measured by considering both above and
below ground ecological parameters in the area. The negative influence of degradation in alpine meadow on
Scientific Reports | (2021) 11:16547 | https://doi.org/10.1038/s41598-021-95472-y 4
Vol:.(1234567890)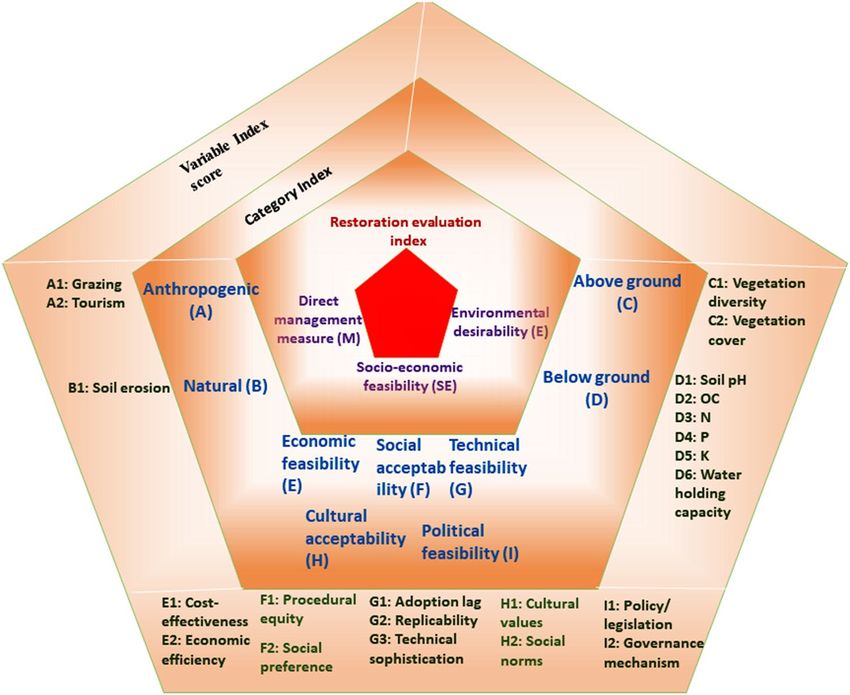
www.nature.com/scientificreports/
Figure 2. Anthropogenic interference at Dayara bugyal: (a) total cow unit of the area from 2007 to 2019, (b)
return of animals from the Dayara bugyal before upcoming winter season, (c) time series analysis of tourists’
influx in the Dayara (2015–2025), and (d) tourists’ influx and their camping in the Dayara before the restoration
period (2d-Photo credit: Mr.Santosh Saklani, Uttarakashi).
Ecologically
Total geographical Total geographical fragile area (m2) Available area Available area for A/AU (A/AU)*Rf
area (km2) area (m2) (I) (II) (m2) (I-II) tourism (m2) (A) (A/5) (Rf = 2) Cf1 Cf2 RCC per year RCC per day
471,360 (12% of
94,272 188,544 0.59 0.72 80,093 219
available area)
3.94 3,940,000 12,000 3,928,000 589,200
(15% of available 117,840 235,680 0.59 0.72 100,117 274
area)
Table 2. Estimation of tourists’ carrying capacity for the Dayara Bugyal (A = Available area for tourists
use, Au = Area required per tourist, Rf = Daily open period / average time of visit, Cf 1 = Correction factor
1(rainfall), Cf2 = Correction factors 2 (snowfall), RCC = Real Carrying Capacity).
regeneration of herbs and soil water availability has considerable impacts. The entire area was evaluated in terms
of three zones, viz., geo-coir treated zone (GTZ), untreated degraded zone (UTZ) and untreated undegraded
zone (R). Both soil and vegetation analyses were done in all the three respective zones to minimize the ecological
effects of the restoration work. In case of above ground parameters, herbs diversity of the treated zone was found
to be increased when compared with the untreated zones. The total herb density per metre square was analysed
for vegetation diversity within geo-coir treated zone (GTZ), untreated degraded zone (UTZ) and untreated
undegraded zone (R), respectively. Dominating plant species existing at the time of field study of the respective
zone are given in Table 3. In the untreated undisturbed reference zone, dominated community was Danthonia
cachemyriana—Sibbaldia parviflora-Anemone obtusiloba D. Don—Achillea millefolium community. Whereas,
geo-coir treated zone was found to be dominated by Sibbaldia parviflora—Taraxacum officinale—Achillea mille-
folium—Artemisia vestita community. Dominance of Danthonia cachemyriana—Rumex nepalensis—Achillea
millefolium community was found in untreated degraded zone.Colonization of Rumex nepalensis was found in
high frequencies in different places where anthropogenic disturbance was reasonably found (Fig. 4).
In case of below ground in the GTZ parameters, like water holding capacity of soil was found to be 50%
which is 3% higher than the untreated degraded site (UTZ), i.e., 47%, within a span of one year after treatment.
The water holding capacity of undisturbed soil was 57% which is expected to be increased in successive years.
Increase in water holding capacity will increase soil moisture content (SMC) which will help plants to grow more
and during later stages it may overcome negative soil water potential (SWP). SWP is a fundamental hydrological
variable that indicates soil water status and is linked with plant physiology. The growth of vegetation in alpine
Scientific Reports | (2021) 11:16547 | https://doi.org/10.1038/s41598-021-95472-y 5
Vol.:(0123456789)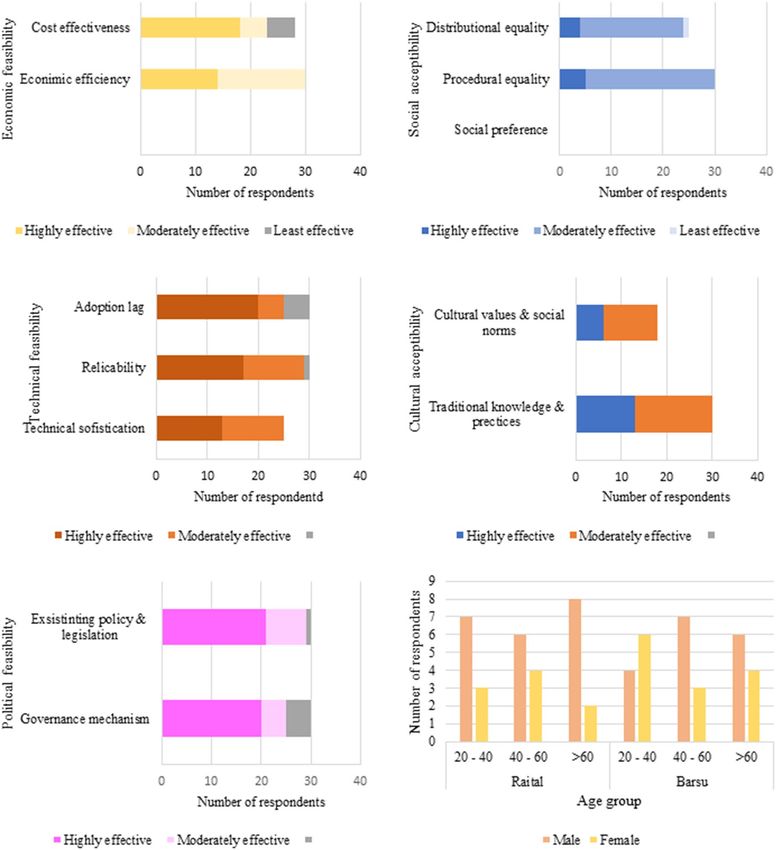
www.nature.com/scientificreports/

                                            Figure 3.  Soil erosion control techniques in the Dayara alpine pasture: (a) eroded gully side areas due to biotic
                                            and abiotic factors in 2018, (b) restoration planning details in 2019, (c) field implementation of the plan initiated
                                            in 2019, and (d) implications of one year outcome of the restoration activity since 13th October, 2020.

                                            regions is generally impeded by rigorous hydrothermal conditions and limitations in soil nutrient. Rise in nitro-
                                            gen, total potassium, and total phosphorus was also examined in the GTZ comparing with the UTZ (Table 4).

                                            Socio‑economic feasibility (SE).           Socio-economic feasibility of the work was evaluated by village sur-
                                            vey conducted in two adjacent villages within a periphery of the Dayara bugyal, Barsu (2258 m) and Raithal
                                            (2180 m). The detailed outline of the respondents regarding the selected socioeconomic parameters are depicted
                                            in Fig. 5 (Supplementary Table S7, S8). Locally available materials like pine needles, bamboo and involving vil-
                                            lagers as workers in view of generating local employment have not only resulted in reduction of cost by about
                                            20% but also has generated direct and alternate livelihood opportunities for 700 households. During restoration
                                            planning, Biodiversity Management Committees (BMCs) of nearest these two villages were involved for ensur-
                                            ing sustainability in alpine and sub-alpine meadows and their downslope located villages. Regular meetings con-
                                            ducted with the villagers since 2018 have shown that there is a significant reduction in the number of unattended
                                            cattle. Innovative techniques using biodegradable coir-geotextile, locally available pine needles and bamboo
                                            have thus emerged out as an economical and sustainable alternative to treat degraded meadows and has resulted
                                            in more effective regeneration of vegetation. Being labour intensive, this has not only generated livelihood alter-
                                            natives to the local people but also has reduced the fire incidences due to Pine forests in the lower altitude of the
                                            district. Being technically simple, the treatment works were carried out by the villagers without any inherited
                                            knowledge and experience according to Divisional Forest Officer (DFO), Uttarkashi. The technique therefore
                                            has emerged as one of the most suitable method of treatment of degraded alpine meadows in the Himalayan
                                            region which was degraded more naturally due to gully erosion than anthropogenic pressures.

                                            Index score. All individual variables of the first two categories were indexed according to the defined scale
                                            formulated on the basis of available literature and expert opinion (Table 5). In case of the last category, scaling
                                            was done directly by considering individual opinion for scoring information. The restoration evolution index
                                            of the entire work was calculated as 69.31 (Supplementary Table S9). Among the three categories of the index,
                                            changes governed by management measures (0.8) used in the work were found to be more effective than the envi-
                                            ronmental changes (0.56). Ecosystem index scores were determined among references, degraded and restored
                                            zones applying one way ANOVA analysis wherein two categories viz., direct management measure (M) and

          Scientific Reports |   (2021) 11:16547 |               https://doi.org/10.1038/s41598-021-95472-y                                                    6

Vol:.(1234567890)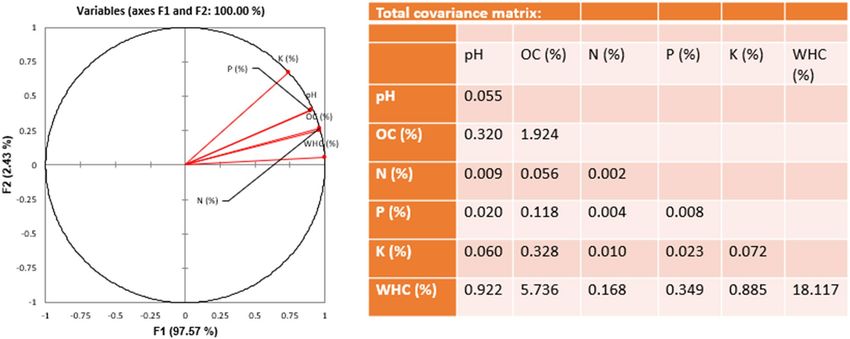
www.nature.com/scientificreports/

                                   Name of plants                                Density (individual/m2) (mean)   Frequency (%)   Abundance
                                   Untreated Undisturbed Zone (R)
                                   Achillea millefolium L.                       1.40                             73.33           1.91
                                   Allium humile Kunth                           0.70                             36.67           1.91
                                   Anaphalis contorta (D. Don) Hook. f.          0.77                             43.33           1.77
                                   Anemone obtusiloba D. Don                     1.47                             70.00           2.10
                                   Arctium lappa L.                              0.40                             26.67           1.50
                                   Artemisia vestita Wall. ex Besser             1.13                             63.33           1.79
                                   Bistorta affinis (D. Don) Greene              0.60                             40.00           1.50
                                   Cyananthus lobatus Wall. ex Royle             0.87                             50.00           1.73
                                   Danthonia cachemyriana Jaub. & Spach          1.70                             90.00           1.89
                                   Epilobium laxum Royle                         0.67                             43.33           1.54
                                   Geranium wallichianum D. Don ex Sweet         0.37                             23.33           1.57
                                   Kobresia nepalensis (Nees) Kk.                0.90                             33.33           2.70
                                   Morina longifolia Wall. ex DC.                0.43                             23.33           1.86
                                   Poa alpina L.                                 0.80                             46.67           1.71
                                   Potentilla argyrophylla Wall. ex Lehm.        0.80                             46.67           1.71
                                   Potentilla atrosanguinea G. Lodd. ex D. Don   1.13                             63.33           1.79
                                   Prunella vulgaris L.                          1.27                             53.33           2.38
                                   Sibbaldia parviflora Willd.                   1.93                             83.33           2.32
                                   Tanacetum longifolium Wall. ex DC.            0.73                             43.33           1.69
                                   Taraxacum officinale F.H. Wigg                1.23                             53.33           2.31
                                   Viola biflora L.                              0.47                             36.67           1.27
                                   Geo- Coir Treated Zone (GTZ)
                                   Achillea millefolium L.                       0.97                             56.67           1.71
                                   Allium humile Kunth                           0.23                             23.33           1.00
                                   Anemone obtusiloba D. Don                     0.50                             40.00           1.25
                                   Artemisia vestita Wall. ex Besser             0.93                             53.33           1.75
                                   Danthonia cachemyriana Jaub. & Spach          0.80                             60.00           1.33
                                   Epilobium laxum Royle                         0.60                             46.67           1.29
                                   Impatiens sulcata Wall.                       0.30                             23.33           1.29
                                   Morina longifolia Wall. ex DC.                0.13                             13.33           1.00
                                   Poa alpina L.                                 0.43                             30.00           1.44
                                   Polygonum polystachyum Wall. ex Meisn.        0.50                             36.67           1.36
                                   Potentilla argyrophylla Wall. ex Lehm.        0.57                             40.00           1.42
                                   Potentilla atrosanguinea G. Lodd. ex D. Don   0.60                             40.00           1.50
                                   Prunella vulgaris L.                          0.77                             40.00           1.92
                                   Senecio chrysanthemoides DC.                  0.60                             40.00           1.50
                                   Sibbaldia parviflora Willd.                   1.23                             73.33           1.68
                                   Tanacetum longifolium Wall. ex DC.            0.27                             20.00           1.33
                                   Taraxacum officinale F.H. Wigg                1.13                             56.67           2.00
                                   Untreated Degraded Zone (UTZ)
                                   Achillea millefolium L.                       0.43                             30.00           1.44
                                   Anemone obtusiloba D. Don                     0.30                             20.00           1.50
                                   Artemisia vestita Wall. ex Besser             0.40                             33.33           1.20
                                   Danthonia cachemyriana Jaub. & Spach          0.63                             33.33           1.90
                                   Epilobium laxum Royle                         0.27                             20.00           1.33
                                   Potentilla argyrophylla Wall. ex Lehm.        0.40                             23.33           1.71
                                   Rumex nepalensis Spreng.                      0.57                             33.33           1.70
                                   Taraxacum officinale F.H. Wigg                0.40                             30.00           1.33
                                   Polygonum polystachyum Wall. ex Meisn.        0.30                             23.33           1.29

                                  Table 3.  Dominant herbs (density/m2) frequency (%) and abundance among comparison in Untreated
                                  Undisturbed Zone (R), Geo-Coir Treated Zone (GTZ), and Untreated Degraded Zone (UTZ) of the Dayara
                                  bugyal.

Scientific Reports |   (2021) 11:16547 |                     https://doi.org/10.1038/s41598-021-95472-y                                            7

                                                                                                                                              Vol.:(0123456789)
www.nature.com/scientificreports/
Figure 4. Colonization of Rumex nepalensis distributed in the Dayara bugyal.
Investigation zone
Variables Untreated Un degraded zone (R) * Geo-coir Treated Zone (GTZ)* Untreated Degraded Zone (UTZ)*
Vegetation profile
Total herb density / m2 19.77 ± 0.04 10.56 ± 0.02 3.7 ± 0.05
Soil chemical profile
pH 5.15 ± 0.24 4.96 ± 0.28 4.69 ± 0.21
OC (%) 6.64 ± 0.26 4.83 ± 0.04 3.76 ± 0.14
N (%) 0.133 ± 0.01 0.09 ± 0.03 0.047 ± 0.02
P (%) 0.35 ± 0.04 0.29 ± 0.03 0.14 ± 0.01
K (%) 0.81 ± 0.02 0.78 ± 0.04 0.26 ± 0.02
WHC (%) 56.96 ± 0.13 49.85 ± 0.13 47.76 ± 0.59
Table 4. Chemical characteristics of the different soil zones (upto 30 cm depth) from R, GTZ and UTZ in the
Dayara bugyal (n = 3 per investigation zone; 50 random soil cores per replicate for soil analysis ; 30 randomly
placed quadrates of 1 × 1 m in 5-50 m in triplicate per investigation zone). *(mean ± standard error).
environmental desirability (E) were used. The average ecosystem index score for treated zones was 72% (± 3.78
standard error [SE]) which was significantly higher than the average score of degraded zones 55.61% (± 4.79) but
lower than the average score of reference zones 88% (± 3.17) (one way ANOVA test, p = 0.003, Fig. 6b). The high-
est variation was observed in a degraded zone (68%), followed by treated zone (42%) and reference zone (30%).
Now, considering the individual variables, the score of water holding capacity and soil pH of treated land were
found to be in most comfortable zone comparing with the non-degraded zone as a reference. Tourism activity
was not found to be responsible for the degradation as the scores were almost equal in reference and degraded
zones. From the hit map analysis of the variables, it was made clear that soil chemical properties like OC, N and
K were not found to be in good agreement in case of the treated land (Fig. 6). Direct field values of the variables
considered under ecological category were further evaluated in three respective zones by discriminate function
analysis. The results revealed two significant functions, factor 1 accounted for 97% of the explained variance, and
factor 2 accounted for 2% of the explained variance. All individual variables of soil were found to be strongly
correlated across the three zones with little low values in case of P and K (Fig. 7).
Discussion
The alpine pastures in the Himalaya provide a wide range of ecosystem services such as carbon sequestration,
water storage and provisioning, maintaining biodiversity, food security and livelihoods. But current days, these
ecological treasure houses are facing degradation threats like upcoming invasive species, inappropriate manage-
ment and development policies, soil erosion, extraction of medicinal plants, overgrazing and climate c hange23.
Therefore, these areas require not only the protection of native vegetation but also its restoration wherever neces-
sary. Eco-restoration is an attractive strategy in this regard that will provide the ecological and socioeconomic
benefits like expanding coverage and connectivity of the remaining native vegetation; increasing the flow of
ecosystem goods and services (e.g., water, food, biological control, pollination, grazing livestock products, timber
and non-timber forest products, climate regulation, control and mitigation of erosion and floods); and creation
of social and economic development opportunities for rural community24. On the other hand, implementing
eco-restoration is a challenging work for these regions. The outcomes of the present work, depicts a clear eco-
restoration and its evaluation framework for degraded high altitude alpine pastures of the Himalayan region. The
degradation parameters considered for the present work was found in harmony with other affected areas of the
Scientific Reports | (2021) 11:16547 | https://doi.org/10.1038/s41598-021-95472-y 8
Vol:.(1234567890)www.nature.com/scientificreports/
Figure 5. Socio-economic responses by the local stakeholders regarding feasibility assessment criteria related to
the Dayara bugyal restoration.
Himalayan Region. Like, overgrazing is reported for the areas of high altitude grasslands of Kashmir, Tungnath,
Garhwal in the Indian Himalaya, Sagarmatha (Mt. Everest) National Park, Nepal and China25–28, and other places
of the Himalaya. In case of the Dayara bugyal, local livestock populations were found to be increased at a rate of
33 CU per year and also evaluated to be more responsible for overgrazing. Migratory livestock unit was found
to be controlled after the restoration phase. Overgrazing is strongly associated with soil cracking and vegetation
disturbance, important processes and features of degradation in alpine ecosystems29. Shifting of grazing land from
Dayara towards Lambidhar was an excellent management measure in this aspect, where more control measures
are needed. According to our calculations, if 445 CU will be deducted from the local livestock from Dayara,
grazing will be under carrying capacity. Therefore, the grazing pattern of 118 migratory CU (76 horse/mule and
18 sheep/goat, already controlled) and 318 local CU (30 horse/mule and 187 sheep/goat, need to be controlled)
is recommended for the area. Rest of the animals may be shifted to some other areas like Lambidhar, Devkund,
and Suriyatop. One check post for checking the livestock should be made in this regard.
Further, in alpine region, tourism is also reported to reflect impacts like reduction in litter biomass, soil
nutrient supply and soil enzyme activities, generation of solid waste, thus adversely affect the whole plant-soil
system30. On the other hand, tourism sector is considered as growth engine for the future development of the
Indian Himalayan R egion31. In Uttarakhand, due to lack of attentive strategies, and the existing policy framework,
incongruous practice of tourism, unplanned developmental activities, and the massive inflow of visitors are
Scientific Reports | (2021) 11:16547 | https://doi.org/10.1038/s41598-021-95472-y 9
Vol.:(0123456789)www.nature.com/scientificreports/
Satisfactory Average Not Satisfactory References
Soil chemical properties
pH 4.7–5.3 4–4.7 < 4.0
OC (%) > 7.5 5.0–7.5 < 5.0
N (%) > 0.75 0.50–0.75 < 0.50
17, 18, 19
P (%) > 0.50 0.25–0.50 < 0.25
K (%) >2 2–1 60 30–60 < 30 Based on field observation
Management measures
Grazing control < 285 285 -857 > 857
Based on field observation, experts’ opinion and survey,
Tourists’ control < 65 65–200 > 200
Order of Hon’ble High court, Uttarakhand (WPPIL No.123
Erosion control of 2014 ), 21, 22
35
(t h-1y-1)
Table 5. Scoring criteria for calculation of restoration evaluation index.
Figure 6. Evaluation of different components under restoration evaluation index; (a) category comparison
between different zones, (b) ecosystem index score comparison between restore, reference and degraded zones,
(c) evaluation of individual variables for their effectiveness in different zones, and (d) ecological profile of
different zones (R_S = satisfactory for reference zone, R_A = average for reference zone, R_NS = not satisfactory
for reference zone, similarly T = treated zone, D = degraded zone).
some of the key factors adversely affecting the sustainable tourism d evelopment32. The results of tourist carrying
capacity inflow of 274 tourists per day for the area was also in compliance with Hon’ble High court, Uttarakhand
(WPPIL No.123 of 2014) where 200 tourists per day are allowed to visit on alike locations.
Tourism activity of the study area was found to be below carrying capacity and further eco-tourism may
be promoted in the area which will also have socioeconomic impact for the two adjacent villages. Promotion
of homestays for tourists, training of local people as tour guides and bird watching are suggested for the same.
Some base framework suggested for a community-based rural tourism development include activities followed
in Darap and Pastanga villages in Sikkim and Dhanolti Eco-park in U ttarakhand33,34. A village level committee
like Dayara Ecotourism Development Committee (DEDC) may be formed in the upcoming phases, consisting of
20 members (10 from Raithal, 10 from Barsu villages) representing 50% women members. The main role of the
Scientific Reports | (2021) 11:16547 | https://doi.org/10.1038/s41598-021-95472-y 10
Vol:.(1234567890)www.nature.com/scientificreports/
Figure 7. Discriminant function analysis of (a) direct field evaluated values, and (b) their covariance matrix.
committee will be to manage the tourists’ influx, conserve forest and ecosystem, dispose of and recycle garbage,
and collect fees for various amenities as provided to the tourists. A small nature interpretation and learning
centre may be also established in Barsu village, by engaging localities in Eco-huts. The role of the centre will be
conducting amusement facilities like flying fox and burma bridge, plantation of memory saplings, and nature
trails with yoga for the tourists. Localities may be made aware of the activities, by way of nature learning and
interpretation training provided by GBP-NIHE, Kosi-Katarmal, Almora, Uttarakhand, India. Further, practices
like packaging with less waste prone materials such as decomposable wrappers, establishment of a waste dealer
centre (Could one earn 25 paise per bottle upon submission, if sold to a dealer) are also adopted in the area for
the management of solid w aste35.
Soil erosion of the area was found to be controlled at the rate of 0.5 tonne per hectare per year. The newly
introduced geo-coir matting approach was found to be successful in this aspect. The geo-coir matting technique
was successful for controlling soil erosion in the Amachal watershed in Trivandrum District in the Western Ghat
region of Kerala, India36. But its use in such a high-altitude alpine in the present work is first time found to be
successful. Further, use of dry pine needles (Piruls) in the construction of cheek-dams was also found to be an
effective strategy as these are highly inflammable because of presence of turpentine oil in them and cause hunting
forest fire incidences in the north western Himalaya during s ummer37.
Thereafter, environmental desirability in the treated area was found to have improved vegetation and soil
profile. The total herb density in per metre square of the treated area indicates good values. But colonization of
Rumex nepalensis was found in different places where anthropogenic disturbance was frequently found. This
species has good forage value, higher crude protein (CP) and digestibility for cattle. On the other hand, it has
become dominant and outcompete desirable pasture species and degrade pasture quality. It regenerates from
tap roots and establishes quickly as seedlings. Once established, tough tap roots become difficult to remove and
are not readily damaged by t illage38. Therefore, manual removal of Rumex nepalensis at the shepherd camping
(30°50′3.48"N, 78°34′2.21"E to 30°50′0.49"N, 78°34′2.76"E, 3348 m) is recommended to stop the future spread
of this difficult weed in the pasture area. Small plots of 10 m2 can be considered for this purpose stating from
the camping sites. Simultaneously, plantation activity should be done to stop the surface soil erosion. Herbs like
Trifolium repens, Carex setosa and Dolomiaea macrocephala are recommended for this purpose. In below ground,
water holding property of soiland soil nutrients were also found to increase in the treated area. Soil pH of the
treated area was also found to be undisturbed. Pine needles are a matter of concern as these were introduced in
the bugyal area during the restoration work. Soil ‘C’ and ‘N’ storage and other physiochemical components were
found to be increased in the treated zone comparing with the untreated zone. This will ultimately increase the
above ground biomass of the a rea39. Reduction of the grazing activity could be one of the reasons behind it. On
the other hand, during upcoming 10 years, exclusion of the grazing activity may reduce the vegetation diversity
of the area and may allow the vegetation to be dominated by a few species with strong colonization a bilities40.
The socio-economic parameters used in the present study was the field implementation of the conceptual
framework designed by Pandit et al. (2020) for land degradation and restoration responses for improved planning
and decision-making considering 141 current articles in this context. Although the framework was for forest land
degradation assessment, but the parameters also strongly correlate with the pasture area of the current work. The
results of the present work revealed good success rate and popularity of the work among the localities as well as
in Government departments. Community involvement is a vital parameter behind the success of any work. Like
Community Forest User Groups in Nepal benefited nearly 2.908 million households by 2018 and also managed
total of 2.238 million ha of forests41. The ecological index of the treated zones was found to be increased in com-
parison with the degraded zone which indicated improving ecological profile of the area. Direct management
measures like control in grazing and tourism activity along with geo-textile matting and check dams for erosion
control are found to have more impact in this aspect.
Scientific Reports | (2021) 11:16547 | https://doi.org/10.1038/s41598-021-95472-y 11
Vol.:(0123456789)www.nature.com/scientificreports/
Therefore, the eco-restoration strategies and their evaluation model of the present work, could have its future
avenue for successful restoration practice. The planning of geo-coir mats and pirul check dams for the soil erosion
control may be further used for restoration of other high-altitude regions prone to erosion. The grazing pattern
and herbs colonization controlling strategies, tourism management strategies as suggested in the work are also
useful for other degraded pasture lands facing the same problem in high altitude degraded alpine pastures of the
Indian Himalayan Region as well as in other mountain alpine and sub-alpine ecosystems.
Methods
Restoration response evaluation. Multi-criteria response analysis has been a crucial part of restoration
evaluation work as a proper practical achievement which always includes multiple objectives defined by diverse
stakeholders. In current work, a new framework was designed for restoration response evaluation by assessing
three categories, direct management measure (M), environmental desirability (E) and socio-economic feasibility
ork41
(SE). In total, 9 sub-categories and 22 individual variables were considered for evaluation of the present w
(Table 6).
Direct management measure (M) evaluation. During the starting phase of the work, excessive graz-
ing, uncontrolled tourism and continuous soil erosion were identified as major drivers behind the degradation
of Dayara bugyal. Therefore, in the first category of the evaluation work, direct management measures to control
the above-mentioned activities were analysed. The disturbances were controlled by managing both anthropo-
genic (M1) and natural (M2) processes. Under anthropogenic control process, grazing (A1) and tourism (A2)
control activities were measured and soil erosion (B1) control activities was considered under natural control
sub-category.
Livestock carrying capacity. Livestock carrying capacity of the pastureland was a measure for proper
control of the estimation of grazing capacity. Forage yield of the area was calculated by considering the shoot
production of 10 dominant palatable species of the area. Sample plant materials at the end of the growing season,
were oven-dried at 80 ◦ C till it reached at constant weight and then weighed in the laboratory. Thereafter, density
of individual plant was measured by laying 30 quadrates of 1 × 1 m randomly placed within 50 × 50 m grid in the
herb community (Eq. 1)42. Total 80 grids were sampled for analysis of 40 hectare degraded grazing land of the
Dayara alpine pasture from the Papad Gad and Swari Gad area. Thereafter, 10 dominant palatable species cover-
ing ~ 33% of the total dry weight of the palatable and unpalatable species were considered for forage production
calculation. Peak biomass was calculated by summing up the peak biomass of each individual to get the forage
yield (Eq. 2). Finally, standard dry forage yield and proper rangeland carrying capacity was calculated by using
Eqs. (3) and (4)43 as follows.
Total number of individuals of a species in all quadrates
Density = (1)
Total number of quadrates laid
Y = Yp × A (2)
where, Y = forage yield in a certain area (kg), Yp i = forage yield per unit area (kg/km ), A = land area of rangeland
2
(km2) (i.e., total grazing area of the Dayara occupies 3.235 k m2).
n
F= Yi × Ui × Ci (3)
i=1
where F = yield of standard dry forage (kg), Yi = forage yield (kg), Ui = utilizable rate (%), Ci = conversion
coefficient.
Utilization rate 50% and conversion coefficient 1 for meadow was considered for current w ork43 .
F
Cc = (4)
I×D
where, Cc = proper livestock numbers that meadow can bear, F = yield of standard dry forage (kg), I = daily intake
for an animal unit (7.5 kg/day, Table 7)*, D = Grazing days (May to September, 153 days).
*One animal consumes 3% of its body weight as dry f orage44. Animal unit conversion was done after Rawat
(2020)45.
Tourists’ Carrying Capacity (TCC). The general formula of carrying capacity assessment for protected areas
was first proposed by Cifuentes (1992), which was further applied in different fields46. The approach is to estab-
lish the capacity of an area for maximum visits based on existing physical, biological, and management condi-
tions through the physical carrying capacity (PCC), and real carrying capacity (RCC). TCC is divided into the
following levels:
Physical Carrying Capacity (PCC). The PCC is the maximum number of tourists that can physically accom-
modate into or onto a specific area, over a particular time. The PCC (Eq. 5) may be estimated as follows:
PCC = A/Au × Rf (5)
Scientific Reports | (2021) 11:16547 | https://doi.org/10.1038/s41598-021-95472-y 12
Vol:.(1234567890)www.nature.com/scientificreports/
Categories Sub- categories Individual variable
A1: Grazing
M1: Anthropogenic (A)
Direct management measure (M) A2: Tourism
M2: Natural (B) B1: Soil erosion
C1: Vegetation diversity
E1: Above ground (C)
C2: Vegetation cover
D1: E4: Soil pH
D2: Organic carbon (OC)
Environmental desirability (E)
D3: Total Nitrogen (N)
E2: Below ground (D)
D4: Total Phosphorus (P)
D5: Total Potassium (K)
D6: Water holding capacity
E1: Cost-effectiveness
SE1: Economic feasibility (E)
E2: Economic efficiency
F1: Procedural equity
SE2: Social acceptability (F)
F2: Social preference
G1: Adoption lag
Socio-economic feasibility (SE) SE3: Technical feasibility (G) G2: Replicability of the response
G3: Technical sophistication
H1: Cultural values
SE4: Cultural acceptability (H)
H2: Social norms
I1: Policy/legislation
SE5: Political feasibility (I)
I2: Governance mechanism
Table 6. Response evaluation parameters.
Animals Avg. body weight (kg) Forage requirement (dry matter in kg/day) Animal Unit
Adult milking cow 250 7.5 1
Horse / mule 312.5 9.38 1.18
Goat 35.78 1.07 0.23
Sheep 32.74 0.98 0.22
Table 7. Animal unit and forage requirement.
where, PCC = physical carrying capacity; A = Available area for tourists use ; 15%-18% area of the total geo-
graphical area is considered for the present work according to the expert opinion and URDPFI guidelines for
hill towns47.
2. However in the present work, 5 m
Au = Area required per tourist; in general, it is considered 3 m 2 area is
considered for one person based on nature of the area is relatively more sensitive to degradation.
Rf = Daily open period / average time of visit.
Average opening time = 6 h (according to the field survey, tourists like timing for a day visit between 9 AM
to 3 PM), time required by one tourist to visit the Dayara bugyal = 3 h.
Rf = 6 h/3 h = 2.
Real Carrying Capacity (RCC) (Eq. 6)
Maximum permissible number of tourists to a specific site could be determined once the Correction fac-
tors (CF) becomes possible to derive out of the particular characteristics of the site. CF is applied to the PCC
as follows.
RCC = PCC × (Cf1 × Cf2 × Cf3 × Cf4 × · · · Cfn) (6)
where RCC = Real Carrying Capacity, PCC = Physical Carrying Capacity, Cf = Correction factors.
Correction factors are calculated using the following formula.
Cfx = 1− Lmx / Tmx
where Cfx = Correction factors of variable x, Lmx = Limiting magnitude of variable x, Tmx = Total magnitude
of variable x.
Tourism is dependent on nature. In the present work, number of days with heavy rain (> 250 mm per day)
and snowfall (> 8 cm per day) were considered as limiting variables that control tourism for the area. The calcula-
tions were done by analyzing the rainfall and snowfall data from 2017 to 2019 considering March to November
Scientific Reports | (2021) 11:16547 | https://doi.org/10.1038/s41598-021-95472-y 13
Vol.:(0123456789)www.nature.com/scientificreports/
as rainfall months and December to February as snowfall months. Total numbers of days in the months were
considered as total variables (Tmx) and the days with heavy rain/snow fall were considered as limiting variables
(Lmx). For example, during 2017 to 2019 total number of days from March to November were 909 days (Tmx)
and in 369 heavy rainfall occurred, therefore, Cf1 was 0.59 (1—Lmx/Tmx). Similarly, during this time heavy
snowfall occurred for 51 days out of 186 days, and Cf2 was 0.72.
Measurement of soil erosion control. Eco-friendly bio-degradable coir geo-textile (9000 sq m) pur-
chased from Coir Board of India, locally available pine needle (240 tonne) along with bamboo were roped in, to
create a series of check dams and channels to control soil erosion, gully formation and vegetation loss. Prior to
commencement, the leveling of uneven surfaces was done before laying the coir geo-textile. The open degraded
sites in different patches of the bugyal, the eroded lateral sites of the gullies were then covered with geo-textile to
control soil erosion. Total 38 check dams in the Swari Gad area were examined for draining soil holding capacity.
After one year of the treatment, total mass of debris stored by each check dams was evaluated using core density
method. The core density of bulk soil in each check dam was determined in triplicates, using an iron core of
2.5 cm radius and 30 cm height. The mass of draining soil checked by each check dam was calculated as u nder48:
Md = V × ρb
where, Md = The mass of debris in each check dam, V = Volume of check dam, ρb = Mean core density of bulk
of soil in each check dam.
Environmental desirability (E) assessment. In this part, environmental desirability, the direct ecologi-
cal outputs of the work were considered under this category, as habitat enhancement is the most crucial compo-
nent of the activity. The sub-component considered under the category included vegetation structure (vegetation
diversity, vegetation cover) and ecological progress (soil chemical properties)20. Vegetation sampling was done
by considering 30 randomly placed quadrates of 1 × 1 m inside 9 sample plots of 5-50 m along three different
zones of the treated water channel areas using vertical belt transact method49. The zones were: (i) geo-coir treated
area, (ii) untreated degraded area, (iii) reference untreated non-degraded area along with both sides of the water
channels wherein total vegetation density (Eq. 1) was analysed following the methodology of Misra (1968) and
Mueller-Dombois & Ellenberg (1974)50,51.
Soil sampling. Soil samples (30 cm depth) were collected from the experimental site in triplicates using
random sampling method from all the three investigation zones, namely, Untreated undegraded zone (R), Geo-
coir Treated Zone (GTZ) and Untreated Degraded Zone (UTZ). Fresh samples were taken from each plot (50
random soil cores per replicate per investigation zones) and were mixed thoroughly as one composite sample for
further study. Here, it is to mention that utmost care was taken to collect each replicate as composite soil sample
to appropriately represent the investigation zones of varied topography. Hence, total 9 soil samples (3 samples
per investigation zones) were collected to determine its physico-chemical characteristics. After collection, the
soil samples were preserved in a portable storage box and transported to the lab immediately. After air drying
and grinding, it was passed through 2-mm sieve, and selected soil properties viz. soil organic carbon (SOC) (%),
soil pH, total nitrogen (N), phosphorus (P), potassium (K) contents (%), and water holding capacity (WHC) (%)
were determined.
Soil physico‑chemical analysis. The SOC content in soil was determined by wet oxidation method using
2Cr2O752. The soil pH was measured with a suspension of soil in water at a 1:2.5 (soil : water) soil-to-solution
K
ratio using a glass electrode. Calibration of the pH meter was done with the help of two buffer solutions of pH
7.0 and 9.253. The WHC of the soil was determined by measuring the ratio of total water in the wet soil to the
weight of the air-dried soil using a Keen– Rackzowski box54. Total N was analysed following the micro Kjeldahl
method55. Total phosphorous (TP) was determined using the HClO4-H2SO4 method56 and total potassium (TK)
was measured by Flame Photometer (NaOH melting)57.
Socio‑economic feasibility (SE) assessment. To investigate the opinion of local residents about the
restoration initiative, village survey was conducted in two adjacent villages of the Dayara bugyal, Barsu (2232 m)
and Raithal (2258 m). Participants had to indicate the degree of the work in above mentioned three scales
(M, E and SE). The questionnaire comprising of questions covered perception about the above discussed six
categories (Supplementary S10). Total 60 respondents from different households were randomly selected from
each village. The sample consisted of villagers as well as administrative staff. The informants were randomly
chosen across 3 different age groups, 20–40, 40–60 and > 60 year58. Economic feasibility was the first class and
parameters considered under this category included cost-effectiveness of the material used, economic efficiency,
i.e., benefit–cost ratio and economic impact of the generated income. In addition, social acceptability is the
next category, where two sub-parameters were considered, procedural equity (inclusivity and participatory) in
response to planning and designing and social preference that covers over current practices, access to resources
and services. In the fourth category, technical feasibility was considered which included three subcategories.
Adoption lag means waiting period required to adopt the response, replicability of the response and technical
sophistication associated with response. In sixth category, cultural acceptability was considered to deal with
alignment of the work with cultural, spiritual and aesthetic heritage values, beliefs and social norms and use of
traditional (indigenous and local) knowledge and practices. In the last category, political feasibility was consid-
ered, where existing policy/legislation and governance mechanism (clarity on roles/responsibilities of stakehold-
Scientific Reports | (2021) 11:16547 | https://doi.org/10.1038/s41598-021-95472-y 14
Vol:.(1234567890)www.nature.com/scientificreports/
Figure 8. Detailed outline of the scoring process applied for restoration evaluation index calculation for the
Dayara bugyal.
ers) was analysed. Each restoration response is ranked using a relative effectiveness or performance rating scale
of low (L), moderate (M), or high (H). These effectiveness response ratings for each sub-criterion also reflect no
(or minimal), some (or moderate) and major (or substantial) improvement, respectively, relative to the initial
condition (pre-response).
Index score calculation. Restoration success index was calculated, by considering three categories, viz.,
direct management measure (M), environmental desirability (E), and socio-economic feasibility (SE). In the first
scoring part, all the 22 individual variables were evaluated for calculation of “variable index”, by assigning index
score between 0 and 3, where 0 rated for ‘not satisfactory’ and 3 rated for ‘satisfactory’. For first two categories,
i.e., direct management measure (M), environmental desirability (E), and direct field values were considered.
The last category, socio-economic feasibility was indexed depending on village questionnaire survey. The sec-
ond score “category index” was calculated by adding all variable index and divided by number of independent
variables within that category. Finally, the “restoration evaluation index” was evaluated by summing all category
scores, dividing by the maximum possible score (16) and multiplying by 10059 (Fig. 8). Ecosystem differences
between reference, degraded and restored sites category and ecosystem index scores were determined using
unpaired one way ANOVA by using categories viz., direct management measure (M) and environmental desir-
ability (E). To estimate the most affected variable between references, degraded and restored sites, discriminant
function analysis (DFA) was carried out, using the field values of all measured independent variables under
second category.
Data availability
Initially, the digital elevation model data used in the study area map which is available in ALOS PALSAR – Radio-
metric Terrain Correction section of NASA earth science data (https://s earch.a sf.a laska.e du/). The shape file data
used for Uttarakhand map is available at DIVA-GIS (http://www.diva-gis.org/). Datasets used from different
climatic analysis are available at CRU (https://sites.uea.ac.uk/cru/data). All other data are available either in the
main text or as supplementary materials. Nomenclatures of the plants were validated from the book, ‘Flora of
Gangotri National Park, Western Himalaya’, Botanical Survey of I ndia60.
Received: 23 March 2021; Accepted: 26 July 2021
Scientific Reports | (2021) 11:16547 | https://doi.org/10.1038/s41598-021-95472-y 15
Vol.:(0123456789)www.nature.com/scientificreports/
References
1. Trant, A., Higgs, E. & Starzomski, B. M. A century of high elevation ecosystem change in the Canadian Rocky Mountains. Sci. Rep.
10, 9698. https://doi.org/10.1038/s41598-020-66277-2 (2020).
2. Kricsfalusy, V. et al. Biodiversity Restoration of the Treeline in Mountain Ecosystems: A Case Study in the East Carpathians (within
the Ukraine). 16th International Conference, Society for Ecological Restoration at Victoria, Canadain, 1–2. https://www.researchga
te.net/publication/257721339 (2004).
3. Mohandass, D. Biodiversity recovery and sustainable land management of a montane rain forest (shola) ecosystem of the Upper
Nilgiri Hills Sout India, Edhkwehlynawd Botanical Refuge, Technical Report. 1–49. https://doi.org/10.13140/RG.2.1.2828.7208
(2008).
4. Kumar, R. Rehabilitation of degraded mountain forests with an integrated eco restoration model- A case study of the Attappady
Hills, Kerala, India. SARRC For. J. https://www.researchgate.net/publication/287200083 (2015).
5. Bamboo for land restoration, International Bamboo and Rattan Organization (INBAR), Policy Synthesis Report, Headquarters
Beijing, China, New report. https://www.inbar.int/bambooforlandrestoration (2018).
6. Torresani, L., Wu, J., Masin, R., Penasa, M. & Tarolli, P. Estimating soil degradation in montane grasslands of North-eastern Italian
Alps (Italy). Heliyon 5, 1825. https://doi.org/10.1016/j.heliyon.2019.e01825 (2019).
7. Kosmas, C. et al. Exploring long-term impact of grazing management on land degradation in the socio-ecological system of
Asteroussia Mountains, Greece. Land 4, 541–559. https://doi.org/10.3390/land4030541 (2015).
8. Chalise, D., Kumar, L. & Kristiansen, P. Land degradation by soil erosion in Nepal: A review. Soil Syst. 3, 12. https://doi.org/10.
3390/soilsystems3010012 (2019).
9. Restoration Opportunities Assessment Methodology (ROAM). International Union for Conservation of Nature (IUCN), Head-
quarters, Rue Mauverney 28, CH-1196 Gland, Switzerland. https://www.iucn.org (2016).
10. Gann, G. et al. International principles and standards for the practice of ecological restoration. Restor. Ecol. 27, 1–46. https://doi.
org/10.1111/rec.13035 (2019).
11. G.B. Pant National Institute of Himalayan Environment. Assessing Landscape Restoration Opportunities for Uttarakhand, India.
International Union for Conservation of Nature (IUCN), 1–108. https://www.iucn.org (2018).
12. Bhatt, I. D., Negi, V. S. & Rawal, R. S. Promoting Nature-Based Solution Through Restoration of Degraded Landscapes in the
Indian Himalayan Region. in Nature-based Solutions for Resilient Ecosystems and Societies. Disaster Resilience and Green Growth,
197–211. https://doi.org/10.1007/978-981-15-4712-6_12 (2020).
13. Orr, B. J. & Cowie, A. L. Scientific conceptual framework for land degradation neutrality: a report of the science-policy interface.
United Nations Convention to Combat Desertification, (UNCCD) Publications, 1–105, https://www.unccd.int (2017).
14. Mc Donald, T., Gann, G. D., Jonson, J. & Dixon, K. W. International standards for the practice of ecological restoration – including
principles and key concepts, 1–48. http://www.SER.org (Society for Ecological Restoration, Washington, D.C., 2016).
15. Singh, G., Rai, I. D. & Rawat, G. S. Alpine meadows of Uttarkashi, Plant Species Diversity, Grazing Pressure and Conservation Status
(2012).
16. Anonymous, Ecorestoration of Dayara alpine meadow in Uttarakashi, Namami Gange Newsletter, National Mission on clean Ganga
under Ministry of Jal Shakti, 24–25. https://nmcg.nic.in/Newsletter/sept2020/index.html (2020).
17. Saha, S., Rajwar, G. S. & Kumar, M. Soil properties along altitudinal gradient in Himalayan temperate forest of Garhwal region.
Acta Ecol. Sin. 38, 1–8. https://doi.org/10.1016/j.chnaes.2017.02.003 (2018).
18. Rawat, G. S. Alpine vegetation of the western Himalaya: species diversity, community structure, dynamics and aspects of conserva-
tion. Thesis Doctor of Science in Botany, 1–239. https://doi.org/10.13140/2.1.3230.1765 (2008).
19. Poulenard, J. & Podwojewski, P. Encyclopedia of Soil Science. Ch. Alpine Soils, 75–79. https://doi.org/10.1081/e-ess3 (Taylor &
Francis, 2006).
20. Kaur, R., Joshi, V. & Joshi, S. P. Impact of degradation on biodiversity status and management of an alpine meadow within Govind
Wildlife Sanctuary and National Park, Uttarkashi, India. Int. J. Biodivers. Sci. Ecosyst. Serv. Manag. 6, 146–156. https://doi.org/10.
1080/21513732.2011.568972 (2010).
21. Hon’ble High Court Uttarakhand, WPPIL No.123 of 2014, Aali-Bedini Bagzi Bugyal Sanrakshan Samiti vs. State of Uttarakhand,
1–60, https://indiankanoon.org (2018).
22. Mandal, D. & Sharda, V. N. Appraisal of soil erosion risk in the eastern Himalayan region of India for soil conservation planning:
Soil erosion risk in the eastern Himalayan region of india. Land Degrad. Dev. 4, 430–437. https://doi.org/10.1002/ldr.1139 (2013).
23. Ingty, T. Pastoralism in the highest peaks: Role of the traditional grazing systems in maintaining biodiversity and ecosystem func-
tion in the alpine Himalaya. PLoS ONE 1, 1–19. https://doi.org/10.1371/journal.pone.0245221 (2011).
24. Bustamante, M. M. C. et al. Ecological restoration as a strategy for mitigating and adapting to climate change: Lessons and chal-
lenges from Brazil. Mitigat. Adapt. Strateg. Glob. Chang. 24, 1249–1270. https://doi.org/10.1007/s11027-018-9837-5 (2019).
25. Khan, R. W. A., Shaheen, H., Mehmood, A. & Awan, S. N. Grazing intensity impacts on soil carbon stocks of Western Himalayan
Alpine paddocks. Carbon Manag. 10, 533–540. https://doi.org/10.1080/17583004.2019.1667701 (2019).
26. Nautiyal, M. C., Nautiyal, B. P. & Prakash, V. Effect of grazing and climatic changes on alpine vegetation of Tungnath, Garhwal
Himalaya, India. Environmentalist 24, 125–134. https://doi.org/10.1007/s10669-004-4803-z (2004).
27. Byers, A. Contemporary Human Impacts on Alpine Ecosystems in the Sagarmatha (Mt Everest) National Park, Khumbu, Nepal.
. Ann. Assoc. Am. Geogr. 95, 112–140. https://doi.org/10.1111/j.1467-8306.2005.00452.x (2005).
28. Cao, J., Yeh, E. T., Holden, N. M., Qin, Y., & Ren, Z. The roles of overgrazing, climate change and policy as drivers of degradation
of China’s Grasslands. Nomadic Peoples 17, 82–101. https://doi.org/10.3167/np.2013.170207 (2013).
29. Vu, Q. M., Le, Q. B., Frossard, E. & Vlek, P. L. G. Socio-economic and biophysical determinants of land degradation in Vietnam:
An integrated causal analysis at the national level. Land Use Policy 36, 605–617. https://doi.org/10.1016/j.landusepol.2013.10.012
(2014).
30. Niu, Y. et al. Overgrazing leads to soil cracking that later triggers the severe degradation of alpine meadows on the Tibetan Plateau.
Land Degrad. Dev. 30, 1243–1257 (2019).
31. Gaur, V. S, & Kotru, R. Sustainable tourism in the Indian Himalayan region. Report of working group II. 1–87. https://www.niti.
gov.in (NITI Aayog, Government of India, 2019).
32. Chandra, P. & Kumar, J. Strategies for developing sustainable tourism business in the Indian Himalayan Region: Insights from
Uttarakhand, the Northern Himalayan State of India. J. Destin. Mark. Manag. 19, 100546. https://doi.org/10.1016/j.jdmm.2020.
100546 (2021).
33. Prakash Kala, C. Ecotourism and Sustainable Development of Mountain Communities: A Study of Dhanolti Ecopark in Uttara-
khand State of India. AEES 1, 98–103 (2013).
34. Chaudhary, M. & Lama, R. Community Based Tourism Development in Sikkim of India-A Study of Darap and Pastanga Villages.
Transnational Corporations Review 6, 228–237. https://doi.org/10.5148/tncr.2014.6302 (2014).
35. Kuniyal, J. C., Jain, A. P. & Shannigrahi, A. S. Solid waste management in Indian Himalayan tourists’ treks: A case study in and
around the Valley of Flowers and Hemkund Sahib. Waste Manag. 23, 807–816. https://doi.org/10.1016/S0956-053X(03)00027-8
(2003).
36. Vishnudas, S., Savenije, H. H. G., Van der Zaag, P., Anil, K. R. & Balan, K. The protective and attractive covering of a vegetated
embankment using coir geotextiles. Hydrol. Earth Syst. Sci. 10, 565–574. https://doi.org/10.5194/hess-10-565-2006 (2006).
Scientific Reports | (2021) 11:16547 | https://doi.org/10.1038/s41598-021-95472-y 16
Vol:.(1234567890)You can also read