Aerosol characteristics at the Southern Great Plains site during the HI-SCALE campaign
←
→
Page content transcription
If your browser does not render page correctly, please read the page content below
Atmos. Chem. Phys., 21, 5101–5116, 2021
https://doi.org/10.5194/acp-21-5101-2021
© Author(s) 2021. This work is distributed under
the Creative Commons Attribution 4.0 License.

Aerosol characteristics at the Southern Great Plains site during
the HI-SCALE campaign
Jiumeng Liu1,2 , Liz Alexander3 , Jerome D. Fast1 , Rodica Lindenmaier1 , and John E. Shilling1
1 Atmospheric Sciences and Global Change Division, Pacific Northwest National Laboratory, Richland, WA 99352, USA
2 School of Environment, Harbin Institute of Technology, Harbin, 150001, China
3 Environmental Molecular Sciences Laboratory, Pacific Northwest National Laboratory, Richland, WA 99352, USA

Correspondence: John E. Shilling (john.shilling@pnnl.gov)

Received: 21 October 2020 – Discussion started: 29 October 2020
Revised: 4 February 2021 – Accepted: 8 February 2021 – Published: 31 March 2021

Abstract. Large uncertainties exist in global climate model      SOA at SGP was more highly oxygenated, likely due to
predictions of radiative forcing due to insufficient under-      the relatively weak local emissions of isoprene. Biogenic
standing and simplified numerical representation of cloud        emissions appear to largely control the formation of or-
formation and cloud–aerosol interactions. The Holistic Inter-    ganic aerosol (OA) during the HI-SCALE campaign. Po-
actions of Shallow Clouds, Aerosols and Land Ecosystems          tential HOM (highly oxygenated molecule) chemistry likely
(HI-SCALE) campaign was conducted near the DOE’s At-             contributes to the highly oxygenated feature of aerosols at the
mospheric Radiation Measurement (ARM) Southern Great             SGP site, with impacts on new particle formation and global
Plains (SGP) site in north-central Oklahoma to provide a bet-    climate.
ter understanding of land–atmosphere interactions, aerosol
and cloud properties, and the influence of aerosol and land–
atmosphere interactions on cloud formation. The HI-SCALE
campaign consisted of two intensive observational periods        1   Introduction
(IOPs) (April–May and August–September, 2016), during
which coincident measurements were conducted both on             Atmospheric aerosols have been the subject of intensive on-
the G-1 aircraft platform and at the SGP ground site. In         going research due to their important impacts on the climate.
this study we focus on the observations at the SGP ground        They affect the climate not only through the direct scatter-
site. An Aerodyne high-resolution time-of-flight aerosol         ing and absorption of solar radiation, but also by influenc-
mass spectrometer (HR-ToF-AMS) and an Ionicon proton-            ing the formation and properties of clouds, including radia-
transfer-reaction mass spectrometer (PTR-MS) were de-            tive properties, precipitation efficiency, thickness, and life-
ployed, characterizing chemistry of non-refractory aerosol       time (IPCC, 2013). Accurate and thorough descriptions of
and trace gases, respectively. Contributions from various        aerosol condensation and growth kinetics are crucial for the
aerosol sources, including biogenic and biomass burning          prediction of aerosol size distributions and therefore cloud
emissions, were retrieved using factor analysis of the AMS       condensation nuclei (CCN) number concentrations, which
data. In general, the organic aerosols at the SGP site was       are crucial to understand for evaluating the impact of aerosols
highly oxidized, with oxygenated organic aerosol (OOA)           on climate (Zaveri et al., 2018; Scott et al., 2015; Riipinen
identified as the dominant factor for both the spring and sum-   et al., 2011). However, there are large uncertainties associ-
mer IOP though more aged in spring. Cases of isoprene-           ated with cloud–aerosol interactions in global climate models
epoxydiol-derived secondary organic aerosol (IEPOX SOA)          (Fan et al., 2016), partly due to insufficient coincident data
and biomass burning events were further investigated to un-      that couple cloud macrophysical and microphysical proper-
derstand additional sources of organic aerosol. Unlike other     ties to aerosol properties. These studies demonstrate that co-
regions largely impacted by IEPOX chemistry, the IEPOX           located measurements of meteorology, radiation, aerosols,
                                                                 and clouds are needed to evaluate treatments of aerosol pro-

Published by Copernicus Publications on behalf of the European Geosciences Union.
5102                                                   J. Liu et al.: Aerosol characteristics at the SGP site during HI-SCALE

cesses in climate models. In addition, surface processes in-        logical conditions. As the first field measurement site estab-
volving land–atmosphere interactions have potential impacts         lished by the Atmospheric Radiation Measurement (ARM)
on aerosol properties, which consequently influences cloud          user facility, the SGP site is known as a hotspot of land–
formation. To address these knowledge gaps, the Holistic In-        atmosphere interactions that influences the life cycle of shal-
teractions of Shallow Clouds, Aerosols and Land Ecosystems          low convection (e.g., Dirmeyer et al., 2006; Koster et al.,
(HI-SCALE) campaign was conducted near the DOE’s At-                2004, 2006). The central facility is located in a rural environ-
mospheric Radiation Measurement (ARM) Southern Great                ment, immediately surrounded by cropland and pasture with
Plains (SGP) site in north-central Oklahoma in 2016.                a small portion of forest also in close proximity (Sisterson
   The Southern Great Plains (SGP) site is one of the world’s       et al., 2016). Several urban areas are located within 200 km
largest and most extensive climate research facilities. While       of the site, including Wichita (∼ 110 km to the north), Ok-
the SGP site is located in a rural environment with the nearest     lahoma City (∼ 135 km to the south), and Tulsa (∼ 150 km
population centers approximately 40 km away (Fig. S1 in the         to the southeast). Several smaller towns such as Enid, Still-
Supplement), it is impacted by a mixture of anthropogenic,          water, and Ponca City are located within 100 km of the site.
biogenic, and biomass burning sources of aerosols and their         In addition, a refinery is located approximately 45 km ENE
precursors. Indeed, a previous study has shown that aerosols        of the site, and a 1138 MW coal-fired power plant is located
arriving in the SGP site are of diverse origins (Parworth et al.,   50 km to the ESE. Therefore, the air masses arriving at the
2015). The HI-SCALE campaign consisted of two 4-week                SGP site are diverse, originating from anthropogenic, bio-
intensive observational periods (IOPs), one occurring from          genic, and biomass burning sources. During the two IOPs of
24 April to 21 May (denoted as “spring” IOP) and one run-           the HI-SCALE campaign, a suite of supplemental online in-
ning from 28 August to 24 September (denoted as “summer”            struments were deployed at the SGP central facility to char-
IOP) to take advantage of different stages and distribution of      acterize both the gas- and particle-phase composition. Most
the “greenness” of cultivated crops, pasture, herbaceous, and       instruments were located in the guest user facility, which is
forest vegetation types (Fast et al., 2019). One goal of the HI-    a separate trailer 300 m from the main building of the central
SCALE campaign was to provide a detailed set of aircraft            facility (Sisterson et al., 2016). Due to the proximity of the
and surface measurements needed to obtain a more com-               guest instrument trailer to the permanent aerosol equipment
plete understanding and improved parameterizations of the           located at the central facility, the instruments are expected to
life cycle of aerosols and their impact on shallow clouds. To       sample the same air mass.
achieve these objectives, coincident measurements of meteo-
rological, cloud, and aerosol properties collected routinely        2.2   Instrumentation
at ARM’s SGP facility were augmented by additional in-
strumentation, in particularly by gas and particle-phase mass       An Aerodyne high-resolution time-of-flight aerosol mass
spectrometers.                                                      spectrometer (abbreviated as AMS hereafter) was deployed
   In this study we focus on aerosol mass spectrometer              at the SGP site to provide the mass concentration and
particle-phase measurements collected at the SGP site, with         chemical composition of submicron, non-refractory aerosols
measurements of volatile organic compounds (VOCs) pro-              (Jayne et al., 2000; DeCarlo et al., 2006). The AMS was op-
viding insights into the precursors and helping to identify the     erated in the standard “V” mass spectrometer (MS) mode,
sources of air parcels. The characteristics of the aerosol prop-    with a 5 min data averaging interval. Filter blanks were per-
erties are summarized, and a comparison between the spring          formed every day by diverting AMS-sampled air through a
and summer IOPs is shown. Potential sources of aerosols and         HEPA filter, and these filter periods were used to account
aerosol precursors are investigated using positive matrix fac-      for gas-phase interferences with isobaric particulate signals.
torization (PMF) and back trajectory analyses. In addition,         Based on the standard deviation of these blank measurements
several case studies are discussed in detail to examine the         (3σ ) as described in the literature (DeCarlo et al., 2006), the
impacts of seasonal variations in biogenic and anthropogenic        detection limits of the AMS at the 5 min sampling interval
sources, long-range transport, and meteorology on aerosol           were 0.07, 0.015, 0.006, 0.009, and 0.005 µg m−3 for organ-
properties.                                                         ics, sulfate, nitrate, ammonium, and chloride, respectively.
                                                                    The AMS was operated continuously during the entire spring
                                                                    IOP and first half of the summer IOP (28 August–9 Septem-
2     Experimental methods                                          ber 2016); the AMS suffered an ion optics failure during the
                                                                    second half of the summer IOP. During the campaign, the
2.1    SGP site description                                         AMS was routinely calibrated using monodisperse NH4 NO3
                                                                    particles quantified with a TSI condensation particle counter
The central facility at the SGP site is located in north-central    (CPC). Calibration with (NH4 )2 SO4 particles was conducted
Oklahoma, at 36.60◦ N and 97.48◦ W, as shown in Fig. S1. It         before and after campaign. Data were analyzed in Igor Pro
was designed to measure cloud, radiation, and aerosol prop-         (v6.37) using the high-resolution analysis package (Squir-
erties in a region that experiences a wide variety of meteoro-      rel v1.57, PIKA v1.16) and techniques described in the lit-

Atmos. Chem. Phys., 21, 5101–5116, 2021                                               https://doi.org/10.5194/acp-21-5101-2021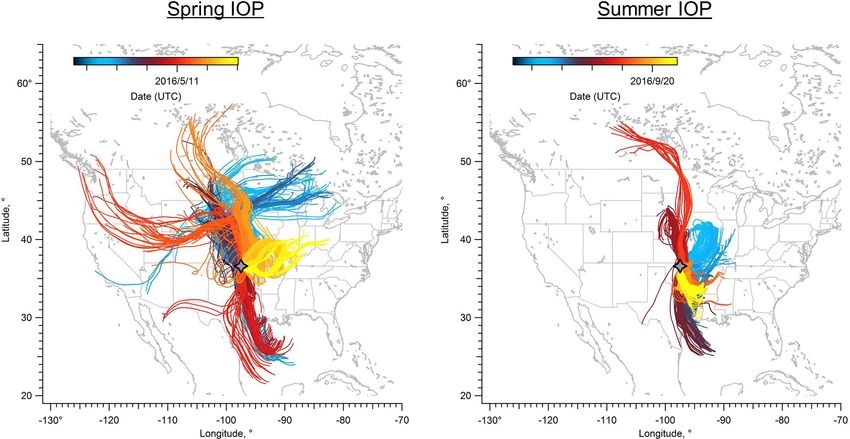
J. Liu et al.: Aerosol characteristics at the SGP site during HI-SCALE                                                      5103

erature (Canagaratna et al., 2015; Kroll et al., 2011; Aiken      2.3    Back trajectory analyses
et al., 2008; Allan et al., 2004; Jimenez et al., 2003). The
values of atomic oxygen-to-carbon (O : C) and hydrogen-to-        To investigate the potential sources and transport pathways
carbon (H : C) ratios were calculated using the updated frag-     of aerosols and aerosol precursors observed at the SGP
mentation tables in Canagaratna et al. (2015). Positive matrix    site, back trajectories were performed by utilizing the Na-
factorization (PMF) analysis was performed using the high-        tional Oceanic and Atmospheric Administration (NOAA)
resolution data and the PMF Evaluation Tool (v3.05A; Ul-          Air Resources Laboratory Hybrid Single-Particle Lagrangian
brich et al., 2009).                                              Integrated Trajectory (HYSPLIT; http://ready.arl.noaa.gov/
   The AMS sampled air drawn from an inlet located 10 m           HYSPLIT_traj.php, last access: 22 June 2020) (Draxler and
above the ground. Sample air was drawn through a PM2.5            Rolph, 2012). 72 h backward trajectories initialized from the
cyclone, passed through a Nafion dryer, brought into the          SGP site were computed every 3 h at multiple altitudes. The
guest facility with 0.5 in. (12.7 mm) stainless-steel tubing,     back trajectory analyses help identify sources of aerosols for
and shared by three aerosol sampling instruments, includ-         specific events during the campaign.
ing a high-resolution time-of-flight aerosol mass spectrom-
eter (HR-ToF-AMS), a single-particle laser ablation time-of-
                                                                  3     Results and discussion
flight mass spectrometer (SPLAT II), and a scanning mobil-
ity particle sizer (SMPS). The SMPS system consisted of           3.1    Analysis of HYSPLIT trajectories
a TSI model 3081 long-column differential mobility ana-
lyzer (DMA) with a recirculating sheath flow of 3 L min−1         Figure 1 shows the HYSPLIT back trajectory paths for both
and a TSI model 3775 CPC operated in the low-flow mode            spring and summer IOPs. In the spring campaign, the back
(0.3 L min−1 ) and was set to measure the particle size distri-   trajectories suggested that the air masses arriving at the SGP
bution from 14 to 710 nm (mobility diameter) at a sampling        site mainly originated from the north during first half of the
frequency of one scan every 4 min. Data from the SMPS were        IOP and gradually transitioned to originating from the south.
also used in evaluating the AMS collection efficiency.            At the end of the spring IOP there was a several-day pe-
   An Ionicon quadrupole high-sensitivity proton-transfer-        riod when the dominant winds became easterly, which would
reaction mass spectrometer (PTR-MS) was used to measure           bring air masses from the biogenic-rich eastern region (Par-
the mixing ratios of gas-phase VOCs (Lindinger and Jordan,        worth et al., 2015). Approximately 45 % of the time during
1998). Similar to the aerosol sampling instrument, the inlet of   the spring IOP, air arriving at the SGP facility originated from
PTR-MS was also positioned 10 m above the ground with an          the northern plains. This set of trajectories passed primarily
inlet filter at the end to remove particles and then connected    over grassland and cropland (Trishchenko et al., 2004) and
to the instrument through Teflon tubing. The PTR-MS was           would therefore be influenced primarily by weak biogenic
run in the mass-scan mode, in which a mass spectrum from          emissions. Air masses from the south are also a major source
m/z 21 to m/z 250 was recorded with 1 s dwell time on each        impacting the SGP site, contributing 36 % of the back tra-
unit m/z. The time resolution for each cycle is ∼ 4 min. Drift    jectories. These trajectories passed by cities such as Houston
tube pressure and temperature were set at 2.2 mbar and 60 ◦ C     and Oklahoma City, which are largely influenced by anthro-
with a 600 V potential across the drift tube. Signal intensity    pogenic emissions. For the remaining ∼ 20 % of the trajec-
of selected species, including m/z 42, 45, 59, 69, 71, 79, 93,    tories, air masses traveled from the east and likely brought
107, 121, and 137, was then converted to parts per billion by     emissions from deciduous and mixed forests in northern
volume (ppbv) using a multi-point calibration with air from a     Arkansas, Missouri, and southern Illinois. It is possible that
calibration cylinder (Apel Riemer Environmental Inc.) con-        air masses originating from the southeastern US can be trans-
taining known concentrations of acetonitrile, acetaldehyde,       ported to the SGP site, but the transport period would be
acetone, isoprene, methacrolein, benzene, toluene, m-xylene,      longer than 3 d.
trimethylbenzene (TMB), and α-pinene. It is assumed in our           During the summer IOP, air masses arriving at the SGP
analysis that the signals at the aforementioned m/z values are    site originated from two main directions (Fig. 1) according
entirely from the indicated species, which could be a source      to HYSPLIT analysis. Southerly winds dominate during the
of uncertainty. The calibration was performed periodically        summer, accounting for ∼ 63 % of the trajectories, which
before, during, and after the campaign. The PTR-MS back-          suggests a larger contribution of aerosols and their precursors
ground was assessed twice per day by diverting air through a      transported from Oklahoma and eastern Texas with urban
stainless-steel tube filled with a Shimadzu platinum catalyst     characteristics. Compared to spring IOP, a smaller fraction
heated to 600 ◦ C, which removes VOCs from the airstream          of the air masses originated from the north, only accounting
without perturbing RH. The catalyst efficiency was tested by      for ∼ 37 % of the trajectories. The back trajectories during
comparing signal from air containing VOCs passed through          summer IOP indicate shorter transport distances than spring
the catalyst with signal from VOC-free air.                       due to lower wind speeds.

https://doi.org/10.5194/acp-21-5101-2021                                           Atmos. Chem. Phys., 21, 5101–5116, 2021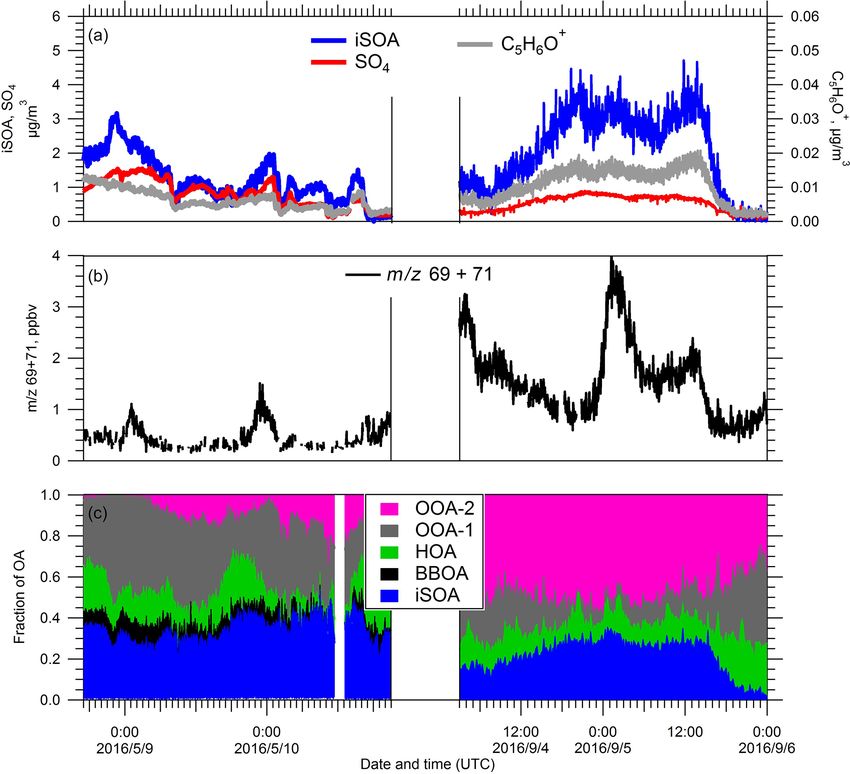
5104                                                      J. Liu et al.: Aerosol characteristics at the SGP site during HI-SCALE

Figure 1. HYSPLIT back trajectories for spring and summer HI-SCALE IOPs. Each line shows a 3 d back trajectory computed every 3 h,
with the SGP site (gray four-point star, ground level) as the end point of each trajectory. The lines are color-coded by date of arrival at the
SGP site.

3.2    Overview of the temporal variations of submicron                   which showed that pH averaged 1.33 ± 0.54 during the sum-
       aerosol composition and trace gases during spring                  mer IOP and 2.28 ± 0.78 during the spring IOP. Details of
       and summer IOPs                                                    ISORROPIA calculation are described in the Supplement. In
                                                                          most circumstances, ammonium nitrate will not partition into
The AMS results for non-refractory submicron aerosols (NR-                the condensed phase until particulate sulfate is fully neutral-
PM1) observed during both the spring and summer IOPs are                  ized (Guo et al., 2016, 2017). Thus the more acidic aerosol
summarized in Fig. 2 and Table 1. Organic aerosol (OA)                    might be another explanation for the lower nitrate concentra-
contributed the largest fraction to the total NR-PM1 mass                 tion in summer. In the spring IOP, ammonium is 13 % higher
concentration during both the spring and summer IOPs, ac-                 than that required to fully balance AMS-measured anions.
counting for > 60 % on average. There are, however, peri-                 This may be due to the potential presence of amines in the
ods where inorganics were greater than 50 % of the total                  particle phase, as amines may contribute to fragments nomi-
mass. Average OA loading was 2.5 ± 1.8 in the spring and                  nally assigned to NH4 (Docherty et al., 2011). Alternatively,
3.8 ± 2.1 µg m−3 in the summer. Similar to organics, sulfate              this difference may be due to slight measurement and cali-
was also more abundant in absolute mass in the summer than                bration errors.
in the spring IOP (average concentration 0.79±0.73 in spring                 Observed concentrations of VOCs are a function of both
versus 1.29 ± 0.80 µg m−3 in summer; details in Table 1), but             their emissions and their removal. The emissions of bio-
the mass fraction is similar (20.1 % during spring IOP ver-               genic VOCs are influenced by ambient temperature and sun-
sus 22.4 % during summer IOP). In contrast, the level of ni-              light, with higher temperatures and more abundant sunlight,
trate is much lower in the summer IOP (0.085 µg m−3 ) than                among other factors, producing higher emissions (Guenther
in the spring IOP (0.244 µg m−3 ; details in Table 1). This               et al., 2012). The average daily temperature at SGP was
may be due to its semi-volatile nature, with warmer tempera-              24.0 ± 4.4 ◦ C during the summer IOP, which is significantly
tures pushing the equilibrium back to the gas phase, decreas-             higher than during the spring IOP (15.9 ± 5.5 ◦ C). Days are
ing nitrate concentrations. Due to incomplete datasets of gas-            also longer in the summer than in the spring. Concentrations
phase NH3 , HNO3 , and SO2 , we were unable to directly de-               of isoprene (m/z 69), a well-known biogenic VOC precur-
termine if there were seasonal variations in inorganic pre-               sor of SOA, are about 2 times higher during the summer
cursor trace gas emissions; however, AMS measurements of                  IOP compared to the spring IOP (Fig. 3). As discussed in
aerosol acidity may be used to infer these potential changes.             the introduction, the design of two IOPs took into considera-
During both IOPs, anions and cations show good correlation                tion the potential impacts of different stages and distribution
(Fig. S2 in the Supplement), but in summer ammonium is                    of “greenness” for cultivated crops, pasture, herbaceous, and
insufficient for full neutralization of the anions, suggesting            forest vegetation types. Our isoprene observations suggest a
the aerosols in summer were more acidic. This was further                 complex relationship between emissions and vegetation. Iso-
confirmed by aerosol acidity estimated using ISORROPIA II,                prene concentrations scaled with temperature and sunlight,

Atmos. Chem. Phys., 21, 5101–5116, 2021                                                      https://doi.org/10.5194/acp-21-5101-2021
J. Liu et al.: Aerosol characteristics at the SGP site during HI-SCALE                                                             5105

Figure 2. Time series of (a) absolute mass concentrations and (b) fractions of particle chemical composition, measured by the AMS for the
spring and summer IOPs during the HI-SCALE campaign.

Table 1. Statistics of aerosol chemical composition measured by the AMS at the SGP site during the two HI-SCALE IOPs. Measurement
units are µg m−3 for all species.

                                                  Spring IOP                                Summer IOP
                                mean     median        25th         75th       mean    median     25th         75th
                                                     percentile   percentile                    percentile   percentile
                 Organic        2.466     1.923        1.192        3.483      3.821   3.098       2.177       5.314
                 Sulfate        0.790     0.504        0.337        1.073      1.290   1.162       0.635       1.690
                 Nitrate        0.244     0.122        0.062        0.291      0.085   0.071       0.047       0.105
                 Ammonium       0.444     0.312        0.193        0.605      0.469   0.450       0.255       0.609
                 Chloride       0.011     0.008        0.006        0.012      0.012   0.010       0.005       0.016

despite the fact that summer was significantly drier and that           because they may be more reactive due to higher OH con-
back trajectories suggest a smaller impact from biogenic-               centrations in summer. High concentrations of benzene and
rich regions during summer IOP. Monoterpenes (m/z 137),                 toluene were observed during the first several days of sum-
another category of biogenic VOCs emitted into the atmo-                mer IOP, but they were also accompanied by high levels of
sphere, also show a similar pattern with higher concentra-              biogenic precursors (i.e., isoprene, monoterpenes) (Fig. 3).
tions observed in the summer IOP. Back trajectories suggest             During these time periods, back trajectories were from the
more prevalent transport from the south in summer, which                southeast, and the paths over the 3 d period were generally
suggests higher anthropogenic impact. However, several rep-             short (Fig. S3 in the Supplement). Thus, the high concentra-
resentative anthropogenic VOCs observed by PTR-MS, in-                  tions were probably locally accumulated due to lower wind
cluding benzene, toluene, and TMB, did not show significant             speeds. Acetonitrile, a key tracer for biomass burning, did not
enhancements during the summer season (Table 2), partially              show significant changes during the two IOPs. Therefore, the

https://doi.org/10.5194/acp-21-5101-2021                                                 Atmos. Chem. Phys., 21, 5101–5116, 2021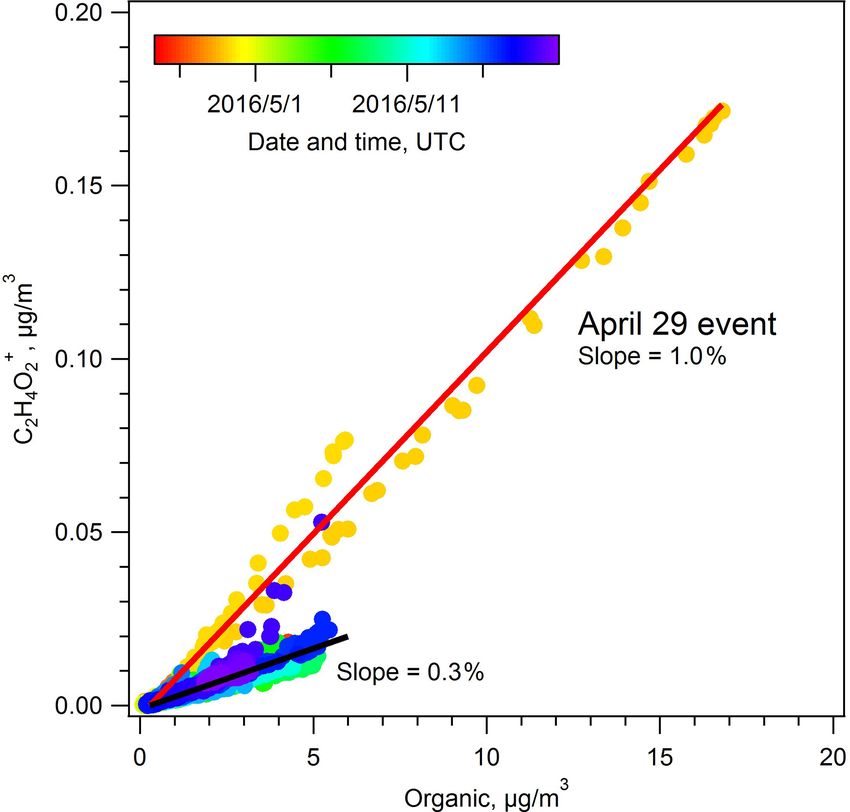
5106                                                J. Liu et al.: Aerosol characteristics at the SGP site during HI-SCALE

higher OA concentrations observed in the summer IOP rela-        (fC5 H6 O ) of 1.7 ‰ is roughly the background level (Hu et al.,
tive to the spring are likely related to more-intense biogenic   2015), while the resolved first factor has an fC5 H6 O value
emissions rather than enhanced transport from urban areas or     of 4.5 ‰. This factor correlates with SO4 , with r = 0.55
from biomass burning.                                            (Fig. 6). Based on the correlation of this factor with SO4 , and
   Recently, there has been intense research into the forma-     comparison of the mass spectrum to literature, we classify
tion of highly oxygenated organic compounds from biogenic        this factor as IEPOX-derived SOA. During the spring IOP,
precursors. This new group of highly oxygenated molecules        the IEPOX-derived SOA factor contributed 27.9 ± 12.3 % of
(HOMs) has been proposed to be the source of a major frac-       the total OA mass on average.
tion of tropospheric submicron SOA (Bianchi et al., 2019;           The second factor features a prominent marker at m/z 60
Ehn et al., 2014, 2017). During the HI-SCALE campaign            (primarily C2 H4 O+ 2 ) with a f60 value of 0.9 %. Based on pre-
we observe indication that the bulk submicron OA con-            vious studies (e.g., Cubison et al., 2011) this f60 fraction is
tained a significant HOM fraction. Shown in Fig. 4, the          representative of air masses impacted by aged biomass burn-
O : C ratios of submicron OA were mostly distributed in the      ing. The trend of this factor (Fig. 6b) tracks the time evolu-
range of 0.5–1.3 during the spring IOP, with an average of       tion of C2 H4 O+               +
                                                                                  2 and C3 H5 O2 well, with r values of 0.96 and
0.84 ± 0.14. The average of H : C ratios is 1.39 ± 0.09, and     0.92, respectively. The signals of these two ions are thought
the mean carbon oxidation state (OSc = 2 × O/C−H/C) is           to represent tracers for levoglucosan, which are also tracers
0.289 ± 0.31. The OA observed in the summer IOP was sig-         for biomass burning organic aerosol (BBOA) (Cubison et al.,
nificantly less oxygenated, with O : C, H : C, and mean OSc      2011; Jolleys et al., 2015). In addition, the time series of the
values of 0.59 ± 0.09, 1.52 ± 0.11, and −0.34 ± 0.24, respec-    second factor tracks a biomass burning event on 29 April well
tively. There are several possible reasons for this relatively   (details will be discussed in Sect. 3.6). Thus, we identify this
large difference in the O : C, H : C, and OSc values observed    second factor as BBOA. On 29 April, CO also showed an
in the spring and summer season. The first possible explana-     enhancement (Fig. S5 in the Supplement), suggesting poten-
tion is that the aerosol in the spring is more aged due to a     tial influence from biomass burning. We also note that this
longer residence time in the atmosphere, potentially differ-     BBOA factor has a relatively high f44 value of 0.16, which
ent oxidant concentrations, or a combination of both. Pho-       suggests that the BBOA observed at SGP was aged. The
tochemical aging leads to an increase in f44 (Fig. 5), O : C,    BBOA factor accounts for 10.0 % of total OA mass during
and OSc, all of which were higher in the spring than in the      the spring IOP on average but at times can rise to over 50 %
summer (Alfarra et al., 2004; de Gouw et al., 2005; Aiken        (Fig. 6f).
et al., 2008; Kleinman et al., 2008). A second possibility          We identify the third factor as hydrocarbon-like organic
is that the VOCs contributing to SOA formation in sum-           aerosol (HOA) by comparison of the mass spectrum with lit-
mer are different than in spring. For example, we previously     erature spectra including the prominent signal at m/z 55 and
discuss that higher concentrations of isoprene and monoter-      57 (Fig. S4). This factor exhibits a similar trend in time with
penes are observed in the summer, likely due to higher emis-     toluene, a typical VOC tracer for primary emissions. Interest-
sions, whereas concentrations of anthropogenics were more        ingly, the evolution of HOA does not correlate strongly with
constant. Finally, it is possible that the more abundant bio-    CO, a well known anthropogenic tracer. Shown in Fig. S5,
genic VOCs in the summer IOP were not transformed into           CO appears to be associated with both HOA and BBOA,
a higher-oxygenated form in the aerosol phase, either due to     which likely impacts the correlation between CO and a sin-
differences in RO2 radical chemistry, oxidants, or their res-    gle PMF factor. Our retrieval of an HOA factor from the PMF
idence time in the atmosphere (e.g., D’Ambro et al., 2017;       analysis contrasts with the results of a previous aerosol chem-
Liu et al., 2016; Pye et al., 2019). Further identification of   ical speciation monitor (ACSM)-based study at SGP. Based
OA sources will be discussed in the next section via PMF         on 1.5 years of observational data, Parworth et al. (2015) sug-
analyses.                                                        gested no HOA factor is extractable due to the rural charac-
                                                                 teristics of the SGP site. In this study, we retrieved an HOA
3.3    Contributions of factors to organic aerosols in the       factor, with an average contribution of 9.6 % of total OA
       spring and summer IOPs                                    mass (Fig. 6f). It is possible that the higher S/N and time
                                                                 resolution of the HR-ToF-AMS used in our study relative to
In order to better understand the sources of organic aerosol,    the quadrupole ACSM used in the Parworth study allows us
we performed PMF analysis on the high-resolution mass            to extract the HOA factor.
spectra data separately for each IOP. For the spring IOP,           The fourth and fifth factors are two OOA (oxygenated
we chose a five-factor solution (Fig. S4 in the Supplement).     organic aerosol) factors that are typically representative of
Shown in Fig. S4, a first factor is characterized by an en-      SOA. The average mass spectra of the two OOA factors
hanced signal of C5 H6 O+ (m/z 82), which is recognized          (Fig. S4) show that the f44 value is higher for OOA-1 (0.25)
as a tracer for isoprene-epoxydiol-derived secondary organic     than OOA-2 (0.18), where the ion signal at m/z 44 com-
aerosol (IEPOX SOA) (iSOA; Budisulistiorini et al., 2013).       monly comes from the thermal decomposition of carboxylic
According to previous studies, a fractional C5 H6 O+ signal      acids and other highly oxygenated compounds on the vapor-

Atmos. Chem. Phys., 21, 5101–5116, 2021                                            https://doi.org/10.5194/acp-21-5101-2021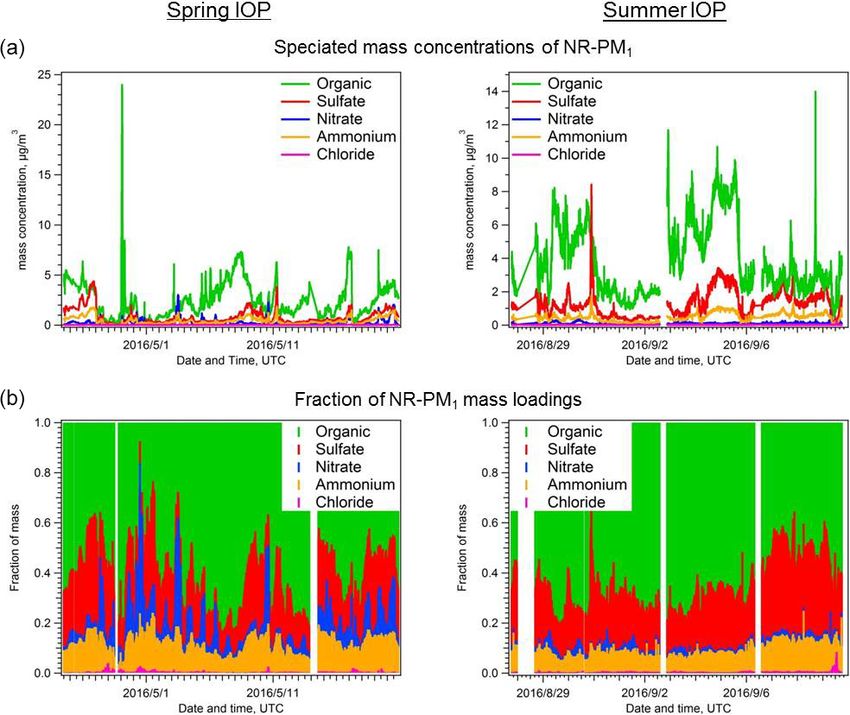
J. Liu et al.: Aerosol characteristics at the SGP site during HI-SCALE                                                             5107

Figure 3. Time series of key VOCs, including isoprene, monoterpenes, acetone, acetonitrile, benzene, and toluene, for both the spring and
summer IOPs during the HI-SCALE campaign.

Table 2. A summary of gas-phase VOCs observed at the SGP site by PTR-MS during the two HI-SCALE IOPs. Measurement units are ppbv
for all VOC species.

                                                     Spring IOP                                Summer IOP
                                   mean     median        25th         75th       mean    median     25th         75th
                                                        percentile   percentile                    percentile   percentile
              Isoprene             0.267     0.188        0.131        0.283      0.513    0.384     0.249        0.622
              Monoterpenes         0.098     0.078        0.062        0.117      0.255    0.186     0.106        0.313
              Acetone              1.464     1.299        1.000        1.808      2.207    1.978     1.500        2.846
              Acetonitrile         0.112     0.103        0.075        0.137      0.137    0.135     0.109        0.162
              Benzene              0.082     0.066        0.046        0.101      0.128    0.105     0.068        0.152
              Toluene              0.115     0.096        0.069        0.138      0.132    0.112     0.077        0.162
              Trimethylbenzene     0.120     0.106        0.088        0.136      0.089    0.079     0.061        0.109

izer. Therefore OOA-1 is identified as more-oxidized OOA                NOx and low-RH conditions (Surratt et al., 2006), and C7 H+  7
(MO-OOA), and OOA-2 is identified as less-oxidized OOA                  has been inferred to be a thermal decomposition product of
(LO-OOA). However, we note that both factors have higher                dimers and oligomers in ISOPOOH-derived SOA (Riva et
signal at m/z 44 than 43, indicating both are still significantly       al., 2016). Shown in Fig. 6e, the time series of both fragment
oxidized. The mass spectra of the LO-OOA factor reveal a                ions track the evolution of LO-OOA well, suggesting the LO-
prominent signal at m/z 91, with C7 H+                   +
                                        7 and C3 H7 O3 as the           OOA factor may indeed be associated with isoprene pho-
                                                       +
dominate ions contributing to m/z 91. The C3 H7 O3 ion was              tooxidation chemistry. In some cases, the C7 H+ 7 ion has been
proposed to be a tracer of isoprene photooxidation under low-           shown to be associated with anthropogenic emissions (Ng

https://doi.org/10.5194/acp-21-5101-2021                                                  Atmos. Chem. Phys., 21, 5101–5116, 2021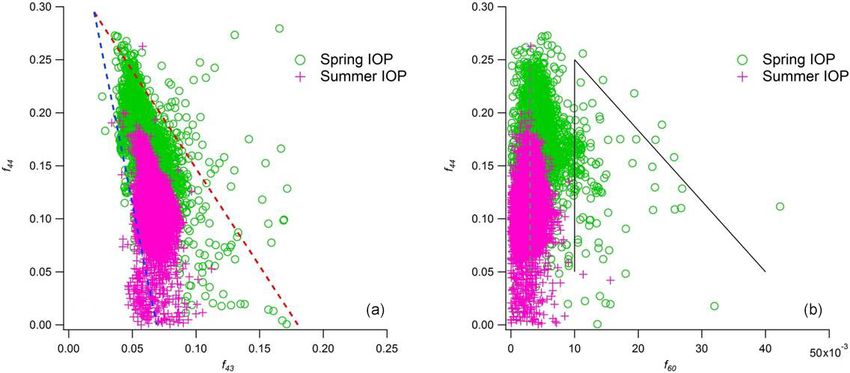
5108                                                      J. Liu et al.: Aerosol characteristics at the SGP site during HI-SCALE

Figure 4. Van Krevelen diagrams of submicron OA observed at the SGP ground site during (a) the spring IOP and (b) the summer IOP.
Linear regression analyses showed a slope of −0.42 for spring IOP and −0.54 for summer IOP.

Figure 5. f44 as a function of (a) f43 and (b) f60 for OA observed during spring and summer IOPs. f44 represents the ratio of signal at
m/z 44 (mainly CO+                                                                                   +            +
                    2 ) to the total organic signal, f43 refers to ratio of total m/z 43 (mainly C3 H7 and C2 H3 O ) to the total organic signal,
                                                        +
and f60 refers to the ratio of m/z 60 (mainly C2 H4 O2 ) to the total organic signal.

et al., 2011), but no correlation was found between m/z 91                 the sum of which contributed > 60 % throughout the sum-
and other anthropogenic tracers such as benzene and toluene                mer IOP. Similar to the spring IOP, OOA-2 is associated with
during our campaign. Thus, we believe the influence of an-                 enhanced signal at m/z 91 (Fig. S6 in the Supplement), and
thropogenic emissions to m/z 91 is minimal, and the signal                 OOA-1 correlates best with acetone (Fig. 7). However the f44
at m/z 91 is most likely attributed to isoprene photooxida-                values for both OOA factors are similar (0.12 vs. 0.11). The
tion chemistry at this site. The MO-OOA factor correlates                  OSc values are somewhat different, −0.099 vs. −0.264 for
most strongly with acetone, which is an oxidation product of               OOA-1 and OOA-2 respectively, though slightly smaller than
several VOCs (Guenther et al., 2012). The sum of these two                 the differences observed for the OOA-1 (0.14) and OOA-2
OOA factors contributed approximately 50 % of the total OA                 (−0.315) factors during spring. Considering the larger frac-
mass, indicating that the majority of the OA arriving at the               tion of OOA-1 than OOA-2 in both spring (35.7 % versus
site is relatively aged.                                                   13.7 %) and summer (34.9 % versus 28.4 %), the smaller OSc
    During the summer IOP, we chose a four-factor PMF so-                  values of the OOA-1 factor in summer indicate that the OOA
lution, consisting of an IEPOX SOA factor, an HOA factor,                  is in general less oxidized during the summer IOP. The con-
and two OOA factors (Fig. 7). A BBOA factor was not iden-                  tribution from the HOA factor is minimal during the first sev-
tified during the summer season, which is consistent with the              eral days of summer IOP (Fig. 7) but begins to increase after
low concentrations of BBOA observed in summer at SGP in                    31 August, with the maximum exceeding 50 % during some
a previous study (Parworth et al., 2015). The major contri-                periods. The transition in the HOA fraction is probably re-
bution to the total OA mass is from the two OOA factors,                   lated to the transition of air mass origin from the northern re-

Atmos. Chem. Phys., 21, 5101–5116, 2021                                                       https://doi.org/10.5194/acp-21-5101-2021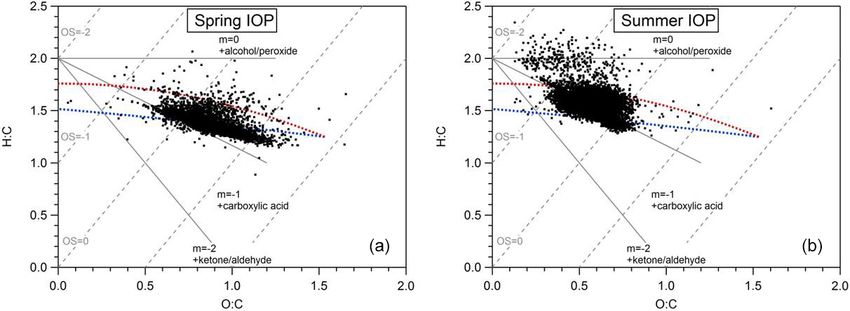
J. Liu et al.: Aerosol characteristics at the SGP site during HI-SCALE                                                                5109

                                                                         Figure 7. Time series of PMF factors extracted from the AMS data
                                                                         for the summer IOP. Time traces of additional species used to eval-
Figure 6. Time series of PMF factors extracted from the AMS data         uate the identity of the PMF factors are also shown.
for the spring IOP. Time traces of additional species used to evaluate
the identity of the PMF factors are also shown.
                                                                         in the spring. Wang et al. (2006) also suggested high aerosol
gion to the anthropogenic-rich regions to the south where pri-           concentrations were strongly correlated with high SO2 con-
mary emissions are stronger. The average contribution of the             centrations when the wind was from the east, south, and
HOA factor during the summer IOP is 13.0 ± 11.3 %, which                 southeast, where several power plants are located. Although
is higher than the fraction in the spring IOP. The higher sum-           the SO2 dataset was unreliable in this study, we did ob-
mer HOA contribution is consistent with higher fraction of               serve co-elevated OA and SO4 concentrations in air masses
air masses originating from the urbanized southern regions               from/traveling through the south region (details in Sect. 3.5).
based on HYSPLIT analyses.                                                  Based on 19 months of continuous measurements with a
   The fourth factor, IEPOX SOA, contributed 25.3 % of                   quadrupole aerosol chemical speciation monitor (ACSM),
the total OA mass, similar to spring IOP. Interestingly, the             Parworth et al. (2015) provided a more comprehensive de-
IEPOX SOA factor has similar f44 values in spring and                    scription on the chemical composition of submicron aerosols
summer (0.116 vs. 0.137) but a significantly different oxi-              at the SGP site. Their 7 d back trajectory analyses showed
dation state (O : C ratios 1.349 vs. 0.653; OSc values 1.606             that aerosol was transported to SGP during the spring from
vs. −0.096). Possible reasons for this difference will be dis-           both the south and north, while southerly winds dominated
cussed in Sect. 3.5.                                                     during the summer. This seasonal variation is consistent with
                                                                         the higher fraction of southernly winds we observed during
3.4   Comparison with previous studies at SGP                            the summer IOP. The seasonal relative fractions of major
                                                                         AMS species, OA, SO4 , NO3 , and NH4 , are also similar be-
Previous analyses have provided insights into the character-             tween our study and theirs. However, Parworth et al. (2015)
istics of aerosols impacting the SGP site and also showed                observed significantly lower absolute aerosol mass concen-
that air mass origin has a large influence on aerosol proper-            trations in the summer compared with the spring, which they
ties. Using simultaneous CO measurements and back trajec-                attributed to temperature-dependent partitioning of semi-
tory analyses in May of 2003, Wang et al. (2006) observed                volatiles. In our study, only nitrate exhibited decreased con-
aged aerosols from wildfires at the SGP surface site, consis-            centrations from spring to summer, whereas both OA and
tent with our results indicating biomass burning contribution            SO4 showed a ∼ 50 % increase. Another difference between

https://doi.org/10.5194/acp-21-5101-2021                                                   Atmos. Chem. Phys., 21, 5101–5116, 2021
5110 J. Liu et al.: Aerosol characteristics at the SGP site during HI-SCALE
the studies relates to the triangle plots for OA. Shown in 2013; Hu et al., 2015). During both iSOA events, the time
Fig. 5, we observe a sorting of the data according to sea- series of C5 H6 O+ ion track that of IEPOX SOA and SO4
son, with most f44 values in the 0.10–0.30 range during (Fig. 8a). Researchers have also identified additional ions
spring and f44 values lower than 0.20 observed during the that are representative of IEPOX SOA such as C3 H7 O+ 2
summer. However in the Parworth study the OA was mostly (Budisulistiorini et al., 2016), and we observe good corre-
aged across the entire observation period, with most f44 val- lation between C3 H7 O+ +
2 (m/z 75) and C5 H6 O (m/z 82)
ues concentrated in the 0.15–0.30 range. In summary, the for both spring IOP and summer IOP. We also investigated
Parworth study suggested the organic aerosols at the SGP the relationship between iSOA and its gas-phase precursors
site were in a more-oxygenated state throughout the year, (Fig. 8b). We attribute the PTR-MS signal at m/z 71 as the
whereas the OA observed in our study demonstrated more sum of methyl vinyl ketone (MVK), methacrolein (MACR),
seasonal variation. and isoprene hydroxyhydroperoxide (ISOPOOH), all first-
There are also significant differences in the factor analysis generation oxidation products of isoprene, and use the sum
results between the two studies. In the Parworth study, only of m/z 69 (isoprene) and m/z 71 as an indicator of gas-phase
three factors were isolated, including a BBOA factor and two iSOA precursors. During both events, generally speaking,
OOA factors, while we isolate an additional IEPOX factor in the sum of isoprene and its first-generation oxidation prod-
both seasons and an HOA factor in the spring. In the Par- ucts did not track the evolution of IEPOX SOA well, but at
worth study, the OOA factor with a smaller f44 value (OOA- times an enhancement in IEPOX SOA followed after a peak
2) was a larger fraction of the total mass in summer relative in the sum of m/z 69 and 71. Given the good correlation
to spring, which is consistent with our observations that the between SO4 and IEPOX SOA, we speculate that the vari-
summer OA appeared to be more fresh. It should be noted ation of IEPOX SOA at the SGP site was mostly driven by
that the three factors retrieved in the Parworth study were variations in the concentration and the acidity of particles, as
based on data throughout the 19 months, and the contribu- IEPOX SOA precursors appear to be abundant during most
tion by BBOA was only evident in winter and spring seasons, of the campaign (Lin et al., 2012). Back trajectories provide
which is again consistent with our results. One factor the Par- some insights into the transport pathways associated with the
worth study did not extract is the HOA factor, which they iSOA events (Fig. S7 in the Supplement). In both the spring
attributed to the rural setting of the SGP site. In our study, al- and summer iSOA events, air masses passed over urban areas
though the HOA contributed ∼ 10 % of the total OA mass on before reaching the SGP site, though there was some vari-
average, the occasional spikes were accompanied with high ation in the detailed trajectories. As seen in Fig. S7, back
concentrations of anthropogenic tracers and are likely asso- trajectories indicate air masses during the spring iSOA event
ciated with transition of air mass origins. With respect to the were uniformly transported from Houston, the refineries, and
IEPOX SOA factor, the Parworth study did take spatial dis- the shipping channels in Texas and the Gulf of Mexico. Dur-
tribution of isoprene emissions into consideration and sug- ing the summer IOP, air masses originated in Missouri and
gested biogenic emissions likely contribute to SOA mass at Arkansas and then passed near Oklahoma City and the Dal-
SGP primarily during the summer, but this contribution was las/Fort Worth region before arriving at SGP. The computed
not directly attributed to IEPOX chemistry. However, Par- trajectories are entirely within the boundary layer, indicat-
worth et al. (2015) were not able to isolate an IEPOX SOA ing that surface emissions should influence the air masses. In
factor in their analysis. In our analyses, although the retrieved both cases, air masses pass through regions where SO2 emis-
IEPOX SOA had similar fractions in spring and summer, the sions are abundant, likely resulting in formation of acidic
absolute mass concentration was indeed higher in summer, aerosol, which drives production of IEPOX SOA.
which agrees with the more intense biogenic emissions and While the back trajectories during the spring iSOA event
photochemistry associated with higher solar insolation and were mostly from Texas and the Gulf of Mexico to the
temperatures as suggested in Parworth et al. (2015). south, summer back trajectories indicate air masses orig-
inate to the east. Parworth et al. (2015) suggested higher
3.5 Case study 1: IEPOX SOA events isoprene emissions originate from regions east of the SGP,
which is supported by our observations of higher m/z 69+71
An IEPOX SOA factor was resolved during the spring and in the summer iSOA event compared to the spring event
summer IOPs, and it was a substantial contribution to the (Fig. 8b). Higher concentrations of isoprene and isoprene
total OA mass. Here we selected one period of high IEPOX oxidation products in summer were accompanied by higher
SOA (iSOA) from each IOP to describe in detail. For the abundance of the C5 H6 O+ ion, with the summer average
spring IOP, we chose the period from 20:00 on 8 May to fC5 H6 O = 6.51 ‰, which is much higher than that in spring
18:00 on 10 May (UTC) (noted as spring iSOA event) and the (fC5 H6 O = 3.44 ‰). To roughly estimate the relative age and
period from 06:00 on 4 September to 21:00 on 5 September oxidation level of the aerosol during iSOA events, we present
(UTC) for the summer IOP (noted as summer iSOA event). triangle plots similar to those described in Hu et al. (2015) in
The C5 H6 O+ ion has been recognized as a unique marker Fig. S8 in the Supplement. The iSOA events group into dis-
for IEPOX SOA (Robinson et al., 2011; Lin et al., 2012, tinct regions of these plots with the spring iSOA more similar
Atmos. Chem. Phys., 21, 5101–5116, 2021 https://doi.org/10.5194/acp-21-5101-2021J. Liu et al.: Aerosol characteristics at the SGP site during HI-SCALE 5111 Figure 8. Temporal evolutions of (a) the iSOA PMF factor and SO4 (left subpanel) and C5 H6 O+ (right subpanel), (b) the sum of m/z 69 (isoprene) and 71 (first-generation oxidation products of isoprene), and (c) fractional contribution of PMF-resolved factors to the total OA during the two iSOA events in spring and summer IOPs, respectively. to the OH-aged aerosols observed in southeast US (Hu et al., values for ambient IEPOX SOA. In this study, the summer 2015) and the summer iSOA more similar to fresher aerosol. IEPOX SOA factor had an fC5 H6 O value of 12.1 ‰, which Note that the fC5 H6 O and fCO2 values shown in Fig. S8 are is at the lower end of previous results, whereas the fC5 H6 O for the total OA, not just the IEPOX SOA factor. For iSOA, value of spring IEPOX SOA was only 4.55 ‰. During the the mean carbon oxidation state, OSc, was estimated to be specific period of spring iSOA event, the fC5 H6 O values of −0.05 for summer event and 0.75 for the spring event, re- 3.44 ‰ for bulk OA were also significantly lower than the spectively. Considering the higher levels of isoprene and its average value of 6.5 ‰ suggested for ambient OA strongly first-generation oxidation products observed during the sum- influenced by isoprene emission (Hu et al., 2015). In addi- mer iSOA events, the higher fC5 H6 O value might suggest tion, during the spring iSOA event, fCO2 values of bulk OA that the IEPOX pathway was favored over isoprene oxidation were significantly higher than previously reported results of pathways producing higher-generation, more-oxidized prod- ambient OA strongly impacted by isoprene emission. Recent ucts, such as ISOP(OOH)2 (D’Ambro et al., 2017; Liu et work has suggested some major IEPOX SOA components, al., 2016). In contrast, lower biogenic VOC concentrations specifically methyltetrol sulfates, may undergo further OH in spring might result in a relatively higher ratio of oxidant oxidation accompanied by the formation of HSO− 4 ion (Chen to VOC, leading to the formation of more highly oxygenated et al., 2020; Lam et al., 2019). Thus, one possibility is that organic aerosols. this mechanism produces more oxygenated IEPOX SOA in Compared to other sites where IEPOX SOAs were exten- the spring, contributing to the higher fCO2 . Considering the sively studied, the IEPOX chemistry at the SGP site appeared relatively weak local emission of isoprene in spring at SGP, to be unique, especially for the iSOA event observed dur- the higher fCO2 but lower fC5 H6 O values might suggest ag- ing spring IOP. Hu et al. (2015) summarized the character- ing of the IEPOX SOA during long-range transport. Since istics of IEPOX SOA factors retrieved from a set of ambi- most IEPOX SOA studies were previously conducted in the ent observations covering urban, downwind urban, and pris- summer season with intense isoprene emissions, the distinct tine regions and suggested a range of 12 ‰–40 ‰ of fC5 H6 O observations at the SGP site, especially those during spring https://doi.org/10.5194/acp-21-5101-2021 Atmos. Chem. Phys., 21, 5101–5116, 2021
5112                                                   J. Liu et al.: Aerosol characteristics at the SGP site during HI-SCALE

IOP, provided a unique point of view on SOA chemistry in a
rural environment with weak biogenic emissions.

3.6    Case study 2: biomass burning event on 29 April

In our PMF analysis, a BBOA factor was extracted during the
spring IOP but not during the summer IOP, in broad agree-
ment with a previous observation of more substantial contri-
bution from fire events during spring (Parworth et al., 2015).
In this study we selected a specific biomass burning event to
examine the evolution of typical tracers, sources, and charac-
teristics.
   On 29 April 2016, two spikes of organic aerosol con-
centration were observed, as shown in Fig. 1. From 00:00–
09:00 (UTC) on 29 April, OA is by far the dominant com-
ponent of the aerosol phase, with an average fraction of
79.13 ± 6.70 %. Particulate ammonium and nitrate also in-
creased during these events, likely due to increased emissions
of their precursors, NH3 and NOx (Paulot et al., 2017; Souri
et al., 2017). No increase in sulfate concentrations was ob-        Figure 9. Scatter plot of the C2 H4 O+  2 ion (a biomass burning
served.                                                             marker) against total OA during the spring IOP. The 29 April pe-
   This period was identified as a biomass burning event            riod is clearly differentiated from much of the data, with a slope of
based on enhanced signal at m/z 60 in AMS spectra, primar-          1.0 %. The slope for the remaining IOP data is 0.3 %.
ily composed of the C2 H4 O+                   +
                                2 ion. C2 H4 O2 , a fragment of
levoglucosan and other plant carbohydrate breakdown prod-
ucts (mannosan, galactosan), has long been recognized as a          et al., 2015), again consistent with the relatively long range
tracer for biomass burning. As seen in Fig. 9, we observe           transport that was needed to bring BBOA to the SGP site.
a positive correlation between C2 H4 O+    2 and OA during the      Although the SGP site was strongly influenced by biomass
spring campaign with a slope of 0.3 %. During the BBOA              burning, the oxidation state of OA during the 29 April event
event, this slope increased to 1.0 %. According to previous         did not show significant differences relative to other periods
studies, an m/z 60 (C2 H4 O+    2 ) fraction of 0.3 % is an ap-     in the spring IOP, with an OSc value of 0.281 (29 April event)
proximate background level, representing air masses without         versus 0.289 (spring IOP average).
biomass burning influence. An elevated fraction of C2 H4 O+    2       Interestingly, the elevated levels of C2 H4 O+2 and BBOA
suggests a significant contribution from biomass burning to         were not accompanied by significantly elevated levels of ace-
OA (Cubison et al., 2011). Indeed, the PMF-resolved BBOA            tonitrile (m/z 42 measured by PTR-MS), which has been
fraction also showed an increase from the spring IOP average        traditionally used as a gas-phase marker of biomass burn-
of 10 % to as high as 77 % on 29 April.                             ing emissions. The average acetonitrile concentration for the
   Active fire data show relatively intense fire hotspots north     spring IOP was 0.11, while during the biomass burning pe-
of the SGP site, with two concentrated areas in Kansas and          riod it was 0.09 ppbv (Table 1). Even during the spikes in
Canada. Back trajectory analysis suggests that these emis-          BBOA concentrations, acetonitrile concentrations were ob-
sions need to travel at least 6 h before arriving at the SGP site   served to only increase moderately, up to 0.2 ppbv (Fig. S11
from fires in Kansas and 2–3 d if transported from Canada           in the Supplement). The specific reason we do not see a con-
(Fig. S9 in the Supplement). According to previous studies,         comitant increase in acetonitrile with the clear BBOA plume
levoglucosan has an atmospheric lifetime of approximately           remains ambiguous. We have ruled out the possibility that
2 d (Hennigan et al., 2010), suggesting that a significant frac-    dilution and processing of acetonitrile reduced its concentra-
tion of the levoglucosan may have decayed before reaching           tion below the PTR-MS detection limit; BBOA concentra-
SGP, particularly for BBOA originating in Canada. The f60           tions remain high despite dilution, acetonitrile has an atmo-
value of 1.0 % during the 29 April event, compared to lit-          spheric lifetime of 1.4 years, and the acetonitrile detection
erature studies that find higher f60 values during periods of       limit was 0.06 ppbv during the spring IOP. A second pos-
BBOA influence, also implied the BBOA arriving at the SGP           sibility is that the biomass burning did not emit significant
site was highly aged. The van Krevelen analysis (Fig. S10 in        amounts of acetonitrile. Acetonitrile emissions were reported
the Supplement) shows that the bulk organic aerosols dur-           to be significantly different among various biomass burn-
ing the 29 April event were highly oxygenated, with an av-          ing sources, with lower nitrogen-containing biomass emit-
erage O : C ratio of 0.839 ± 0.120, which is much higher            ting less acetonitrile (Coggon et al., 2016). Thus it is possible
than typical characteristics of primary BBOA (Canagaratna           that the fuel had lower nitrogen content.

Atmos. Chem. Phys., 21, 5101–5116, 2021                                                https://doi.org/10.5194/acp-21-5101-2021
J. Liu et al.: Aerosol characteristics at the SGP site during HI-SCALE 5113
4 Conclusions and discussions sources of OA at the SGP site provides an opportunity to
rigorously evaluate explicit and parameterized treatments of
Observations of gas-phase VOCs and particle-phase chemi- a range of SOA pathway mechanisms.
cal composition were taken at the SGP site during the HI-
SCALE campaign in 2016, with two intensive operation pe-
riods covering the spring and summer season. Aerosol and Data availability. Data are available on request.
trace gases were characterized using the AMS and PTR-
MS as well as a suite of supplementary instruments. During
both IOPs, organic aerosol is the most abundant particulate Supplement. The supplement related to this article is available on-
component. The OA concentrations were significantly higher line at: https://doi.org/10.5194/acp-21-5101-2021-supplement.
during summer IOP, and PTR-MS observations showed bio-
genic VOCs, including isoprene and monoterpene, were 2–3
times higher in the summer relative to the spring. PMF analy- Author contributions. JDF, LA, and JES designed the experiments.
JL, LA, and RL carried out the measurements. JL analyzed the data
ses were used to investigate aerosol sources and revealed that
and prepared the manuscript with contributions from all co-authors.
OOA was the dominant factor for both the spring and sum-
mer IOP. An IEPOX SOA factor was retrieved for both IOPs
and contributed, on average, the second-largest fraction of Competing interests. The authors declare that they have no conflict
the OA. The retrieved IEPOX SOA factor had lower levels of of interest.
fC5 H6 O and higher fCO2 in the spring relative to the summer,
suggesting the IEPOX SOA was more aged in the spring than
in the summer. Biomass burning events were only observed Acknowledgements. The HI-SCALE field campaign was supported
during the spring IOP, when they episodically contributed a by the Atmospheric Radiation Measurement (ARM) Climate Re-
significant fraction of the OA. The biomass burning aerosol search Facility and the Environmental Molecular Science Labora-
was also found to have a higher oxidation state by the time tory (EMSL), both of which are US Department of Energy (DOE)
it arrived at the SGP site, relative to other BBOA aerosol Office of Science user facilities sponsored by the Office of Bio-
reported in the literature, likely due to aging occurring dur- logical and Environmental Research. Data analysis and research
ing the long-range transport. An HOA factor was also ob- were supported by the US Department of Energy (DOE) Office of
served but was a small fraction of the total OA, suggesting a Science, Office of Biological and Environmental Research, Atmo-
spheric Systems Research (ASR) program. The Pacific Northwest
limited contribution of fresh anthropogenic emissions during
National Laboratory is operated for the DOE by the Battelle Memo-
HI-SCALE. These observations suggest that biogenic emis- rial Institute under contract DE-AC05-76RL01830.
sions play the dominant role in formation of organic aerosol
at the SGP site during HI-SCALE.
The SGP site is located in a rural setting, and biogenic Financial support. This research has been supported by the US De-
emissions appear to largely control the concentrations of OA partment of Energy (grant no. DE-AC05-76RL01830).
during the HI-SCALE campaign. In recent years, a number
of studies have focused on HOMs produced from biogenic
precursors, and these components are expected to play a key Review statement. This paper was edited by Jason Surratt and re-
role in new particle formation (Ehn et al., 2014; Jokinen et viewed by two anonymous referees.
al., 2015; Qi et al., 2018). The high oxidation state of the
OA observed at the SGP site during HI-SCALE suggests that
these molecules could indeed be important SOA components References
at SGP. Nevertheless, due to the lack of molecule-level infor-
mation, we were not able to quantitatively evaluate the con- Aiken, A. C., DeCarlo, P. F., Kroll, J. H., Worsnop, D. R., Huff-
tribution of HOM chemistry to the oxidation state of OA at man, J. A., Docherty, K. S., Ulbrich, I. M., Mohr, C., Kim-
the SGP site. Since HOMs likely contribute to new particle mel, J. R., Sueper, D., Sun, Y., Zhang, Q., Trimborn, A.,
formation (NPF), they will also impact subsequent aerosol Northway, M., Ziemann, P. J., Canagaratna, M. R., Onasch, T.
growth, CCN populations, and the influence of aerosols on B., Alfarra, M. R., Prevot, A. S. H., Dommen, J., Duplissy,
global climate. Actually during the HI-SCALE campaign, J., Metzger, A., Baltensperger, U., and Jimenez, J. L.: O/C
and OM/OC Ratios of Primary, Secondary, and Ambient Or-
NPF events were more frequently observed in spring than
ganic Aerosols with High-Resolution Time-of-Flight Aerosol
in summer (Fast et al., 2019), in agreement with the more-
Mass Spectrometry, Environ. Sci. Technol., 42, 4478–4485,
oxygenated feature of OA observed during the spring IOP https://doi.org/10.1021/es703009q, 2008.
in this study. Considering the potential climate impacts, the Alfarra, M. R., Coe, H., Allan, J. D., Bower, K. N., Boudries, H.,
highly oxygenated nature of aerosols at the SGP site is an Canagaratna, M. R., Jimenez, J. L., Jayne, J. T., Garforth, A.
interesting topic which should be investigated further. The A., Li, S.-M., and Worsnop, D. R.: Characterization of urban
mixture of anthropogenic, biogenic, and biomass burning and rural organic particulate in the Lower Fraser Valley using
https://doi.org/10.5194/acp-21-5101-2021 Atmos. Chem. Phys., 21, 5101–5116, 20215114 J. Liu et al.: Aerosol characteristics at the SGP site during HI-SCALE two Aerodyne Aerosol Mass Spectrometers, Atmos. Environ., T., Riemer, D., Sachse, G. W., Sessions, W., Weber, R. J., Wein- 38, 5745-5758, https://doi.org/10.1016/j.atmosenv.2004.01.054, heimer, A. J., Wisthaler, A., and Jimenez, J. L.: Effects of aging 2004. on organic aerosol from open biomass burning smoke in aircraft Allan, J. D., Delia, A. E., Coe, H., Bower, K. N., Al- and laboratory studies, Atmos. Chem. Phys., 11, 12049–12064, farra, M. R., Jimenez, J. L., Middlebrook, A. M., Drewnick, https://doi.org/10.5194/acp-11-12049-2011, 2011. F., Onasch, T. B., Canagaratna, M. R., Jayne, J. T., and de Gouw, J. A., Middlebrook, A. M., Warneke, C., Goldan, P. Worsnop, D. R.: A generalised method for the extrac- D., Kuster, W. C., Roberts, J. M., Fehsenfeld, F. C., Worsnop, tion of chemically resolved mass spectra from Aerodyne D. R., Canagaratna, M. R., Pszenny, A. A. P., Keene, W. C., aerosol mass spectrometer data, J. Aerosol Sci., 35, 909–922, Marchewka, M., Bertman, S. B., and Bates, T. S.: Budget of or- https://doi.org/10.1016/j.jaerosci.2004.02.007, 2004. ganic carbon in a polluted atmosphere: Results from the New Bianchi, F., Kurtén, T., Riva, M., Mohr, C., Rissanen, M. P., Roldin, England Air Quality Study in 2002, J. Geophys. Res., 110, P., Berndt, T., Crounse, J. D., Wennberg, P. O., Mentel, T. F., D16305, https://doi.org/10.1029/2004JD005623, 2005. Wildt, J., Junninen, H., Jokinen, T., Kulmala, M., Worsnop, D. D’Ambro, E. L., Lee, B. H., Liu, J., Shilling, J. E., Gaston, C. J., R., Thornton, J. A., Donahue, N., Kjaergaard, H. G., and Ehn, Lopez-Hilfiker, F. D., Schobesberger, S., Zaveri, R. A., Mohr, M.: Highly Oxygenated Organic Molecules (HOM) from Gas- C., Lutz, A., Zhang, Z., Gold, A., Surratt, J. D., Rivera-Rios, Phase Autoxidation Involving Peroxy Radicals: A Key Con- J. C., Keutsch, F. N., and Thornton, J. A.: Molecular compo- tributor to Atmospheric Aerosol, Chem. Rev., 119, 3472–3509, sition and volatility of isoprene photochemical oxidation sec- https://doi.org/10.1021/acs.chemrev.8b00395, 2019. ondary organic aerosol under low- and high-NOx conditions, At- Budisulistiorini, S. H., Canagaratna, M. R., Croteau, P. L., Marth, mos. Chem. Phys., 17, 159–174, https://doi.org/10.5194/acp-17- W. J., Baumann, K., Edgerton, E. S., Shaw, S. L., Knipping, 159-2017, 2017. E. M., Worsnop, D. R., Jayne, J. T., Gold, A., and Surratt, J. DeCarlo, P. F., Kimmel, J. R., Trimborn, A., Northway, D.: Real-Time Continuous Characterization of Secondary Or- M. J., Jayne, J. T., Aiken, A. C., Gonin, M., Fuhrer, ganic Aerosol Derived from Isoprene Epoxydiols in Down- K., Horvath, T., Docherty, K. S., Worsnop, D. R., and town Atlanta, Georgia, Using the Aerodyne Aerosol Chemi- Jimenez, J. L.: Field-Deployable, High-Resolution, Time-of- cal Speciation Monitor, Environ. Sci. Technol., 47, 5686–5694, Flight Aerosol Mass Spectrometer, Anal. Chem., 78, 8281–8289, https://doi.org/10.1021/es400023n, 2013. https://doi.org/10.1021/ac061249n, 2006. Budisulistiorini, S. H., Baumann, K., Edgerton, E. S., Bairai, S. T., Dirmeyer, P. A., Koster, R. D., and Guo, Z.: Do Global Mueller, S., Shaw, S. L., Knipping, E. M., Gold, A., and Sur- Models Properly Represent the Feedback between Land ratt, J. D.: Seasonal characterization of submicron aerosol chem- and Atmosphere?, J. Hydrometeorol., 7, 1177–1198, ical composition and organic aerosol sources in the southeastern https://doi.org/10.1175/JHM532.1, 2006. United States: Atlanta, Georgia,and Look Rock, Tennessee, At- Docherty, K. S., Aiken, A. C., Huffman, J. A., Ulbrich, I. M., De- mos. Chem. Phys., 16, 5171–5189, https://doi.org/10.5194/acp- Carlo, P. F., Sueper, D., Worsnop, D. R., Snyder, D. C., Peltier, 16-5171-2016, 2016. R. E., Weber, R. J., Grover, B. D., Eatough, D. J., Williams, B. Canagaratna, M. R., Jimenez, J. L., Kroll, J. H., Chen, Q., Kessler, J., Goldstein, A. H., Ziemann, P. J., and Jimenez, J. L.: The 2005 S. H., Massoli, P., Hildebrandt Ruiz, L., Fortner, E., Williams, L. Study of Organic Aerosols at Riverside (SOAR-1): instrumental R., Wilson, K. R., Surratt, J. D., Donahue, N. M., Jayne, J. T., intercomparisons and fine particle composition, Atmos. Chem. and Worsnop, D. R.: Elemental ratio measurements of organic Phys., 11, 12387–12420, https://doi.org/10.5194/acp-11-12387- compounds using aerosol mass spectrometry: characterization, 2011, 2011. improved calibration, and implications, Atmos. Chem. Phys., 15, Draxler, R. R., and Rolph, G. D.: Evaluation of the Transfer Co- 253–272, https://doi.org/10.5194/acp-15-253-2015, 2015. efficient Matrix (TCM) approach to model the atmospheric ra- Chen, Y., Zhang, Y., Lambe, A. T., Xu, R., Lei, Z., Olson, N. dionuclide air concentrations from Fukushima, J. Geophys. Res.- E., Zhang, Z., Szalkowski, T., Cui, T., Vizuete, W., Gold, Atmos., 117, D05107, https://doi.org/10.1029/2011JD017205, A., Turpin, B. J., Ault, A. P., Chan, M. N., and Surratt, J. 2012. D.: Heterogeneous Hydroxyl Radical Oxidation of Isoprene- Ehn, M., Thornton, J. A., Kleist, E., Sipila, M., Junninen, H., Epoxydiol-Derived Methyltetrol Sulfates: Plausible Formation Pullinen, I., Springer, M., Rubach, F., Tillmann, R., Lee, B., Mechanisms of Previously Unexplained Organosulfates in Am- Lopez-Hilfiker, F., Andres, S., Acir, I.-H., Rissanen, M., Joki- bient Fine Aerosols, Environ. Sci. Technol. Lett., 7, 460–468, nen, T., Schobesberger, S., Kangasluoma, J., Kontkanen, J., https://doi.org/10.1021/acs.estlett.0c00276, 2020. Nieminen, T., Kurten, T., Nielsen, L. B., Jorgensen, S., Kjaer- Coggon, M. M., Veres, P. R., Yuan, B., Koss, A., Warneke, C., gaard, H. G., Canagaratna, M., Maso, M. D., Berndt, T., Gilman, J. B., Lerner, B. M., Peischl, J., Aikin, K. C., Stock- Petaja, T., Wahner, A., Kerminen, V.-M., Kulmala, M., Worsnop, well, C. E., Hatch, L. E., Ryerson, T. B., Roberts, J. M., Yokel- D. R., Wildt, J., and Mentel, T. F.: A large source of low- son, R. J., and de Gouw, J. A.: Emissions of nitrogen-containing volatility secondary organic aerosol, Nature, 506, 476–479, organic compounds from the burning of herbaceous and arbora- https://doi.org/10.1038/nature13032, 2014. ceous biomass: Fuel composition dependence and the variability Ehn, M., Berndt, T., Wildt, J., and Mentel, T.: Highly Oxygenated of commonly used nitrile tracers, Geophys. Res. Lett., 43, 9903– Molecules from Atmospheric Autoxidation of Hydrocarbons: 9912, https://doi.org/10.1002/2016GL070562, 2016. A Prominent Challenge for Chemical Kinetics Studies, Int. J. Cubison, M. J., Ortega, A. M., Hayes, P. L., Farmer, D. K., Day, Chem. Kinet., 49, 821–831, https://doi.org/10.1002/kin.21130, D., Lechner, M. J., Brune, W. H., Apel, E., Diskin, G. S., Fisher, 2017. J. A., Fuelberg, H. E., Hecobian, A., Knapp, D. J., Mikoviny, Atmos. Chem. Phys., 21, 5101–5116, 2021 https://doi.org/10.5194/acp-21-5101-2021
You can also read