Discovery of a new molecule inducing melanoma cell death: dual AMPK/MELK targeting for novel melanoma therapies

Page created by Karen Holt
 
CONTINUE READING
Discovery of a new molecule inducing melanoma cell death: dual AMPK/MELK targeting for novel melanoma therapies
Jaune et al. Cell Death and Disease (2021)12:64
                                    https://doi.org/10.1038/s41419-020-03344-6                                                                                                             Cell Death & Disease

                                     ARTICLE                                                                                                                                                    Open Access

                                    Discovery of a new molecule inducing melanoma
                                    cell death: dual AMPK/MELK targeting for novel
                                    melanoma therapies
                                    Emilie Jaune 1,2,3, Elisa Cavazza 1,2,3, Cyril Ronco3,4, Oleksandr Grytsai3,4, Patricia Abbe1,2,3, Nedra Tekaya1,2,3,
                                    Marwa Zerhouni1,2,3, Guillaume Beranger 1,2,3, Lisa Kaminski3,5, Frédéric Bost3,5, Maeva Gesson1,2,3, Meri Tulic1,2,3,
                                    Paul Hofman6,7,8, Robert Ballotti 3,9, Thierry Passeron1,2,10, Thomas Botton1,2,3, Rachid Benhida3,4 and
                                    Stéphane Rocchi1,2,3

                                      Abstract
                                      In the search of biguanide-derived molecules against melanoma, we have discovered and developed a series of
                                      bioactive products and identified the promising new compound CRO15. This molecule exerted anti-melanoma effects
                                      on cells lines and cells isolated from patients including the ones derived from tumors resistant to BRAF inhibitors.
                                      Moreover, CRO15 was able to decrease viability of cells lines from a broad range of cancer types. This compound acts
                                      by two distinct mechanisms. First by activating the AMPK pathway induced by a mitochondrial disorder. Second by
                                      inhibition of MELK kinase activity, which induces cell cycle arrest and activation of DNA damage repair pathways by
                                      p53 and REDD1 activation. All of these mechanisms activate autophagic and apoptotic processes resulting in
                  1234567890():,;
1234567890():,;
                  1234567890():,;
1234567890():,;

                                      melanoma cell death. The strong efficacy of CRO15 to reduce the growth of melanoma xenograft sensitive or resistant
                                      to BRAF inhibitors opens interesting perspective.

                                    Introduction                                                                                        including BRAF inhibitors such as vemurafenib (or
                                      Melanoma is the most aggressive skin cancer and pos-                                              PLX4032), dabrafenib and encorafenib, as well as MEK
                                    sesses a strong invasive capability that allows the devel-                                          inhibitors such as selumetinib, trametinib, cobimetinib or
                                    opment of metastasis principally in the lymph nodes, liver,                                         binimetinib1. The results with combination between
                                    lungs, and central nervous system. Metastatic melanoma                                              BRAF and MEK inhibitors seem promising with an
                                    is one of the deadliest cancers because of its ability to                                           increase in the median progression-free survival
                                    develop resistance to current therapies.                                                            (9.9 months for combination versus 6.2 months for BRAF
                                      For 15 years, targeted therapies against BRAF (mutated                                            inhibitors alone) and shrinkage of the tumor2,3. However,
                                    in 50–60% of primary melanoma) or MEK protein has                                                   after a few weeks of treatment, patients develop strong
                                    been developed, and some of them are commercialized,                                                resistance to therapies, allowing metastasis growth and
                                                                                                                                        relapse4–6.
                                                                                                                                          Melanoma cells have the capacity to escape the immune
                                    Correspondence: Thomas Botton (Thomas.BOTTON@univ-cotedazur.fr) or                                  response. This observation led to the development of
                                    Rachid Benhida (benhida@unice.fr) or Stéphane Rocchi (srocchi@unice.fr)
                                    1
                                                                                                                                        immune checkpoint inhibitors allowing the reactivation of
                                     INSERM, U1065, Equipe 12, Centre Méditerranéen de Médecine Moléculaire
                                                                                                                                        the immune system to kill melanoma cells7,8. Currently,
                                    (C3M), Bâtiment ARCHIMED, 151 route de saint Antoine de Ginestière, 06204
                                    Nice cedex 3, France                                                                                two different types of immunotherapies are available in
                                    2
                                     Equipe Labellisée Fondation pour la Recherche Médicale (FRM) 2020, Paris,                          the form of blocking antibodies: Ipilimumab (anti-CTLA-
                                    France
                                                                                                                                        4) and Nivolumab or Pembrolizumab (anti-PD-1). Ipili-
                                    Full list of author information is available at the end of the article
                                    These authors contributed equally: Emilie Jaune, Elisa Cavazza                                      mumab targets the CTLA-4 receptor of CD4+ T cells
                                    Edited by D. Aberdam

                                    © The Author(s) 2021
                                                        Open Access This article is licensed under a Creative Commons Attribution 4.0 International License, which permits use, sharing, adaptation, distribution and reproduction
                                                        in any medium or format, as long as you give appropriate credit to the original author(s) and the source, provide a link to the Creative Commons license, and indicate if
                                    changes were made. The images or other third party material in this article are included in the article’s Creative Commons license, unless indicated otherwise in a credit line to the material. If
                                    material is not included in the article’s Creative Commons license and your intended use is not permitted by statutory regulation or exceeds the permitted use, you will need to obtain
                                    permission directly from the copyright holder. To view a copy of this license, visit http://creativecommons.org/licenses/by/4.0/.

                                    Official journal of the Cell Death Differentiation Association
Discovery of a new molecule inducing melanoma cell death: dual AMPK/MELK targeting for novel melanoma therapies
Jaune et al. Cell Death and Disease (2021)12:64                                                                   Page 2 of 20

allowing their activation. This treatment increases survival     initial screening, an extensive structure-activity-based hit-
rate in patients, but only 15% respond to this treatment9.       to-lead optimization led us to identify a new potential
PD-1 is also expressed on T cells and its expression             candidate called CRO15.
inhibits T cell activation. Its target PDL-1 is widely found
in melanoma cells. Anti-PD-1 treatment elicits a response        Results
in approximately 30% of patients10. Even if these                CRO15 exerts deleterious effects on melanoma cell
responses are objective and long-lasting, approximately          viability
65–70% of patients do not respond to this treatment.               After extensive screening of new molecules derived
More recently, the result of phase III trial using combi-        from metformin, based on structure/activity character-
nation of ipilimumab and nivolumab demonstrated an               istics, a lead compound, called CRO15, with an original
increase of efficacy compared with ipilimumab alone with          structure was discovered. This molecule, described in Fig.
the detriment of higher toxicity11. Indeed, grade 3/4            1A, shows a biguanide cyclized form, with an additional
toxicity rate were observed in 55% cases for combination         aromatic ring compared to metformin.
therapy. Thus, identification of new anti-melanoma                  The effect of CRO15 on melanoma cells viability was
compounds is essential to developing new therapies.              determined using a blue trypan exclusion assay. Time
  In this perspective, we previously used a structure/           course experiments showed that after 4 h of treatment
function approach that led to the characterization of the        with 5 μM CRO15, melanoma cell viability decreased in
anti-melanoma properties of Thiazolbenzenesulfonamide            comparison to the DMSO control condition (Fig. 1B).
(TZB). We thus identified HA15 as the lead compound of            These experiments were performed in A375 melanoma
this family, able trigger melanoma cell death by induction       cells, which are sensitive to BRAF inhibitors. After 48 h of
of a strong endoplasmic reticulum stress12.                      treatment, only 15% of melanoma cells were still alive.
  Here, we use a similar approach to improve the biolo-            Figure 1C shows a dose-dependent response after 48 h
gical activity of biguanides on melanoma.                        of treatment of A375 melanoma cells with CRO15. The
  Metformin is the most commonly used biguanide in               50% inhibitory concentration (IC50) of this molecule was
diabetic treatment. It assumes little side effects and is well   identified to be between 2.5 and 5 μM. Our previous
tolerated. A number of studies have shown that metfor-           results obtained on the same cell line demonstrated that
min induces cell death by apoptosis in numerous types of         metformin was inducing cell death after 96 h of treatment
cancer, including melanoma13. We have shown that                 at 5 and 10 mM14. The effects of CRO15 were confirmed
metformin is responsible for cell cycle arrest of melanoma       on other melanoma cell lines with various mutational
cells in G1–G0 after 24 h of treatment14–16. This cell cycle     statuses (Fig. 1D). We observed a large decrease in mel-
arrest induces AMPK pathway activation, which activates          anoma cell viability after 48 h, independent of their
autophagy and apoptosis signaling cascades, leading to           mutations. The anti-melanoma effects of CRO15 were
melanoma cell death. In vivo, we have demonstrated that          also confirmed in a more physiological model of mela-
metformin decreases tumor growth in a xenograft mouse            noma cell cultures freshly isolated from patient tumors
model14. Furthermore, we have shown that metformin               with BRAF mutation (Patient 1), NRAS mutation
decreases the invasive capacity of melanoma cells in an          (Patients 2 and 3), PTEN and p53 mutations (Patient 4)
AMPK/p53 dependent manner without affecting their cell           and with no know mutation (Patient 5). Importantly, we
migration ability16. These results were confirmed by the          no toxicity of CRO15 (5 μM) was observed on normal
observation that metformin strongly decrease in mela-            human cells, such as melanocytes, fibroblasts and kerati-
noma pulmonary metastasis formation in C57BL/6 mice.             nocytes, at 48 h of treatment (Fig. 1F).
These results prompted us to perform a multicentric
clinical trial aiming to test the efficacy of metformin as        CRO15 induces a mitochondrial disorder and activates
monotherapy for melanoma treatment. Unfortunately,               AMPK pathway
very few patients responded to this treatment17. It is             To understand the signaling pathway induced by
worth noting that metformin has low activity (IC50 in the        CRO15, we first examined metabolic alterations and
millimolar range) and low oral bioavailability requiring         AMPK pathway activation. Indeed, it is known that met-
therefore high daily dose for treatment of cancer. More-         formin can induce the AMPK (AMP-activated protein
over, taking into account the small molecular size of            kinase) pathway by inhibition of the complex I of the
metformin, its pleiotropic effects and mechanism of              respiratory chain of mitochondria.
action remain unclear and controversial.                           To determine whether CRO15 has the same effects as
  As a result, we started a medicinal chemistry program          metformin, we first studied the mitochondrial potential of
aimed at developing new metformin-derived molecules              melanoma cells after drug treatment (6 h) by Seahorse
with improved potency and suitable pharmacological               experiments (Fig. 2A). We observed a significant reduc-
profile to obtain a better response in patients. After an         tion in basal mitochondrial respiration in response to

Official journal of the Cell Death Differentiation Association
Discovery of a new molecule inducing melanoma cell death: dual AMPK/MELK targeting for novel melanoma therapies
Jaune et al. Cell Death and Disease (2021)12:64                                                                                                                                                                                                    Page 3 of 20

                                                                            A.

                                                                                        Metformine                                                                                                    CRO15
                                                                                        (Biguanide)                                                                                               (Biguanide-Like)

        B.                                                                                                                                                         C.
                        100                                                                                                                                                100
                                                                      *

                                                                                                                                                      Cell Viability (%)
                        80                                                                                                                                                                                           **
   Cell Viability (%)

                                                                                                                                                                            80
                                                                                                                                    **                                                                                                                **
                        60                                                  **                                                                                              60
                                                                                   **
                        40                                                                  ***                                                                             40                                             ***
                                                                                                        ***
                        20                                                                                              ***                                                 20                                                      ***

                                                                                                                                                                                                                                             ***
                         0                                                                                                                                                   0
                              DMSO                               2h   4h    6h     8h   12h              24h            48h PLX4032                                                                   DMSO 0.5µM 2.5µM 5.0µM 7.5µM 10µM PLX4032
                                                                                                                             5µM                                                                                                          5µM
                                                                                 CRO15 5µM                                                                                                                            CRO15 48h

             D.                                                                                                                                                                                       A375 BRAF V600E
                                           100
                                                                                                                                                                                                      WM9 CDKN2A*/PTEN*
                                                   80                                                                                                                                                 SKmel28 (BRAF V600E, P53*)
                          Cell Viability (%)

                                                                                                                                                                                                      1205Lu (BRAF V600E, CDKN2A*)
                                                   60                                                          **                               **                                                    G-361   (BRAF V600E, PTEN*)
                                                                                                                        ***                                                                           C8161   (BRAF G464E, KRAS*)
                                                   40                                                                                                **
                                                                                                        ***                                                                                            WM3912 (BRAF N581Y, CDKN2A*)
                                                                                                                              ***        ***
                                                   20                                             ***
                                                                                                                                          ***                                                          MeWo   (BRAF WT, P53*, CDKN2A*)
                                                                                                                                                                                                       WM3918 (BRAF WT, NRAS WT)
                                                         0
                                                                           DMSO                                     CRO15 5µM

                                          E.                                            Patient 1 (BRAF V600E)                                                                                   F.
                                                                                                                                                                                                                                              Melanocytes
                                                                                        Patient 2 (BRAF WT, NRAS*)
                                                                                        Patient 3 (BRAF WT, NRAS*)                                                                                                                            Fibroblasts
                                                                                        Patient 4 (BRAF WT, P53*/CDKN2A*)                                                                                                                      Keratinocytes
                                                                                        Patient 5 (BRAF WT)                                                                             140

                                                         100                                                                                                                            120
                                                                                                                                                                            Cell Viability (%)
                                    Cell Viability (%)

                                                                                                                                                                                        100
                                                         80
                                                                                                                    *
                                                                                                                                                                                                 80
                                                         60
                                                                                                                                                                                                 60
                                                                                                                               **
                                                         40                                                                                                                                      40
                                                                                                  ***
                                                                                                          **
                                                                                        *
                                                         20                                                                                                                                      20

                                                             0                                                                                                                                   0
                                                                      DMSO                    CRO15 5µM                                                                                                      DMSO                CRO15 5µM

  Fig. 1 CRO15 exerts a deleterious effect on melanoma cell viability. A Chemical structure of metformin and CRO15. B–F Cell viability assay using
  trypan blue exclusion method on B. A375 melanoma cells treated with 5 μM CRO15 at different times. C A375 melanoma cells were treated with the
  indicated concentrations of CRO15 for 48 h. D Melanoma cell lines of various genotypes treated with 5 μM CRO15 for 48 h. E Human melanoma cells
  freshly isolated from tumors treated for 48 h with 5 μM CRO15. F Primary human melanocytes, keratinocytes and fibroblasts treated 48 h with 5 μM
  CRO15. For B to F, results are expressed as percentages of control and data given as the means ± SEM of three independent experiments performed
  in triplicate. *p < 0.05; **p < 0.01; ***p < 0.001.

Official journal of the Cell Death Differentiation Association
Discovery of a new molecule inducing melanoma cell death: dual AMPK/MELK targeting for novel melanoma therapies
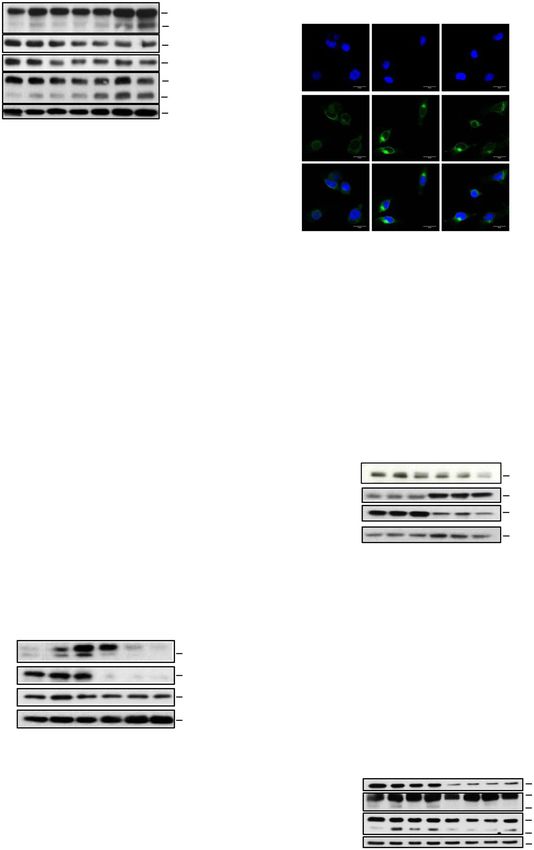
Jaune et al. Cell Death and Disease (2021)12:64                                                                                                                                                                  Page 4 of 20

        A.                                                                                        B.
                                                                                                                                                 100
                                                                                                                                                                                                  *

                                                                                                                    Fluorescence Intensity (%)
                                                                                Control
                                                                                                                                                     80                      *
              O.C.R (pmol/min)

                                                                                CRO15 (5µM)
                                                                                Metformin (10mM)
                                                                                                                                                     60

                                                                                                                                                     40

                                                                                                                                                     20
                                                  Time (min)
                                                                                                                                                                                                                ***
                                                                                                                                                      0
                                                                                                                                                          Control       CRO15            Metformin             CCCP
                                                FCCP AntimycinA &                                                                                                        5 μM             10 mM                20 μM
                                     Olygomycin       Rotenone

        C.                       Cytochrome C                                            14 kDa    D.         P-AMPK                                                                                           62 kDa

                                 SMAC/Diablo                                             21 kDa
                                                                                                                           AMPK                                                                                62 kDa
                                       HSP60                                             60 kDa
                                                                                                                       HSP90                                                                                   90 kDa
                                        Actin                                            45 kDa
                                                                                                                                                          Ctl       1    2         4          6          8
                                                Ctl    6h 24h St     Ctl    6h 24h St
                                                      Cytosol              Mb /                                                                                                  CRO15 5µM (h)
                                                                       Mitochondria                    Ratio AMPK/
                                                                                                        P-AMPK:    1                                            1,66    1,07      2,14       2,37       1,01

        E.
                                                                                                                        F.
                                        P-ACC                                        280 kDa
                                        ACC tot                                      280 kDa                                                                                                          AdCT
                                       P-mTOR                                        289 kDa                                                                                                          AdAMPK ( 1+ 2)
                                                                                                                       100
                                        mTOR                                          289 kDa
                                                                                                                                       80                                                *
                                                                                                        Cell Viability (%)

                                       P-AMPK                                         62 kDa                                                                                                      ***
                                                                                                                                       60
                                        AMPK                                          62 kDa
                                                                                                                                                                                   ***
                                                                                                                                       40
                                       AMPK 1                                         62 kDa

                                       AMPK 2                                         62 kDa                                           20

                                        HSP90                                         90 kDa                                                     0
                                                      Ctl   CRO15                                                                                          Control                  CRO15 5μM
                                                                      Ctl    CRO15
                                                        Ad Control     Ad AMPK
                                                                         1+ 2

  Fig. 2 CRO15 induces a mitochondrial disorder and activates AMPK pathway. A Measurement of mitochondrial function in A375 melanoma
  cells with a Seahorse XF Cell Mito stress test after 6 h of treatment with 5 μM CRO15, 10 mM metformin or DMSO used as control. At 20 min, cells are
  treated with oligomycin, an inhibitor of complex V of respiratory chain; at 50 min, with FCCP, which disrupts the mitochondrial membrane potential;
  and at 80 min, with Rotenone and antimycin A, inhibitors of complex I and III, respectively. B A375 cells were treated with 5 μM CRO15 (6H), 10 mM
  metformin (6H) for or 20 μM CCCP (20 min). Measurement of mitochondrial potential membrane was performed by flow cytometry with a TMRE
  probe. C Lysates from A375 melanoma cells exposed for the indicated durations to CRO15 were analyzed by western blotting using the indicated
  antibodies after cell fractionation. One representative experiment of three is shown. D Lysates from A375 cells treated with 5 μM CRO15 for the
  indicated durations were analyzed by western blotting using the indicated antibodies. One representative experiment of three is shown. E Lysates
  form A375 cells transduced with dominant negative AMPK subunits α1 and α2 for 24 h and treated with 5 μM CRO15 were analyzed by western
  blotting using the indicated antibodies. One representative experiment of three is shown. F Quantification of cell viability from E using trypan blue
  exclusion method. Results are expressed as percentages of DMSO control and data given as the means ± SEM of three independent experiments
  performed in triplicate. *p < 0.05; **p < 0.01; ***p < 0.001.

Official journal of the Cell Death Differentiation Association
Discovery of a new molecule inducing melanoma cell death: dual AMPK/MELK targeting for novel melanoma therapies
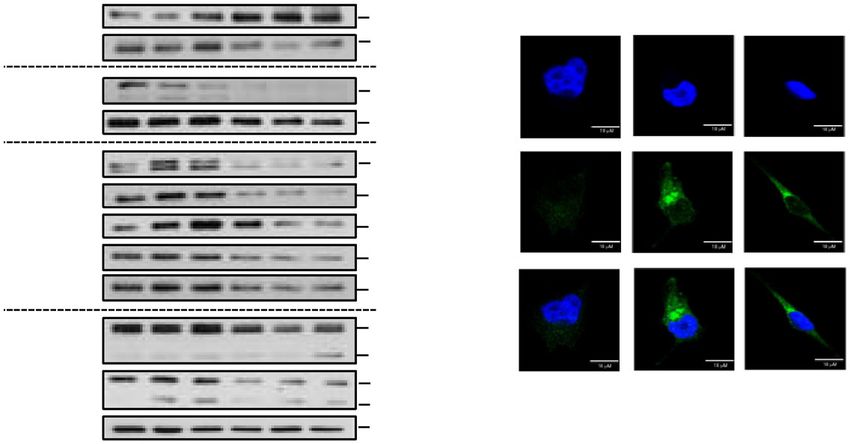
Jaune et al. Cell Death and Disease (2021)12:64                                                                         Page 5 of 20

CRO15, which was not as great as that seen with met-            Table 1 Results of in vitro Kinome assay in response to
formin. Interestingly, the results showed a problem in          CRO15 (1 μM) or metformin (1 mM) (n = 2).
restoration of maximal respiration after FCCP injection.        Kinase                                      CRO15   Metformin
This experiment demonstrates that although CRO15 does                                                       1 µM    1 mM
not have exactly the same efficiency as metformin on             MAPKAPK2             Activity   Km app      90      −2
mitochondrial respiration, it induces significant dysregu-       AKT2 (PKB beta)      Activity   100         74      3
lations. To confirm the effects of CRO15 on mitochon-            GSK3B (GSK3 beta)    Activity   Km app      72      2
drial    metabolism,      we     measured mitochondrial         MELK                 Activity   Km app      72      2
transmembrane potential in melanoma cells (Fig. 2B). We         JAK2                 Activity   Km app      64      −1
used TMRE, a cell-permanent dye that readily accumu-            MAPK8 (JNK1)         Binding                64      −5
lates in active mitochondria. Depolarized or inactive           FER                  Activity   Km    app   61      7
mitochondria have decreased membrane potential and fail         SRC                  Activity   Km    app   49      22
                                                                ABL1 T315I           Activity   Km    app   46      0
to sequester TMRE. We observed a depolarization of the
                                                                CHEK1 (CHK1)         Activity   Km    app   42      6
mitochondria in response to metformin (10 mM) but also
                                                                AKT1 (PKB alpha)     Activity   Km    app   40      0
CRO15 treatment (5 μM). This result was confirmed by a
                                                                YES1                 Activity   Km    app   40      7
decrease in ATP production after CRO15 treatment                AURKA (Aurora A)     Activity   Km    app   39      4
(Supplemental Fig. 1A) and a release of cytochrome C and        WEE1                 Binding                39      4
SMAC/Diablo in the cytoplasm after 6 and 24 h of                GSK3A (GSK3 alpha)   Activity   Km app      38      5
treatment with CRO15 (Fig. 2C).                                 MAPK9 (JNK2)         Binding                36      −3
  Dysregulation of mitochondria implicated activation of        EPHA7                Binding                35      −7
signaling pathways such as the AMPK pathway. Indeed, a          BRAF V599E           Activity   100         34      4
decrease in ATP/AMP ratio is responsible for activation         CDK5/p35             Activity   Km app      33      4
by phosphorylation of AMPK. Thus, treatment with                AMPK (A1/B2/G3)      Activity   Km app      32      1
                                                                CHEK2 (CHK2)         Activity   Km app      28      6
CRO15 induced a time-dependent phosphorylation of
                                                                MAP3K14 (NIK)        Binding                28      0
AMPK on multiple melanoma cell lines (Fig. 2D and
                                                                ABL1                 Activity   Km app      27      3
Supplemental Fig. 1B) but had minimal effects on mela-
                                                                MAPK10 (JNK3)        Binding                27      0
nocytes and fibroblasts consistent with its lack of toxicity     MST1R (RON)          Activity   Km    app   27      −2
normal cells (Supplemental Fig. 1C).                            BLK                  Activity   Km    app   26      0
  AMPK kinase can act on many effectors. For example,           MAPK7 (ERK5)         Activity   Km    app   25      4
AMPK activation can induce the phosphorylation of ACC           MST4                 Activity   Km    app   24      15
(Acetyl-CoA carboxylase) and the dephosphorylation of           AMPK (A1/B2/G2)      Activity   Km    app   23      7
mTOR (mammalian target of rapamycin) and thus                   FGFR1                Activity   Km    app   23      −12
inactivates their activities and stop diverse metabolisms       RPS6KB1 (p70S6K)     Activity   Km    app   22      1
activities. To confirm the involvement of the AMPK               ERN1                 Binding                21      1
                                                                KDR (VEGFR2)         Activity   Km app      21      3
pathway in the mechanism of action of CRO15, we
                                                                AMPK (A1/B1/G2)      Binding                20      2
infected A375 cells with adenoviruses expressing domi-
                                                                MET (cMet)           Activity   Km app      20      −4
nant negative forms of AMPK α1 and α2, the two catalytic
                                                                PRKCH (PKC eta)      Activity   Km app      20      5
subunits of AMPK kinase. These adenoviruses, by                 EPHB4                Activity   Km app      19      5
expression of dominant negative forms of AMPK, shut             FES (FPS)            Activity   Km app      19      1
down activation of endogenous AMPK (Fig. 2E) and                IKBKB (IKK beta)     Activity   Km app      19      1
patially restored cell viability of melanoma cells treated      MAP2K1 (MEK1)        Activity   100         19      16
with CRO15 (5 μM) for 24 h (Fig. 2F). These results             PRKCQ (PKC theta)    Activity   Km app      19      −4
demonstrate that the AMPK pathway plays a role in               ROS1                 Activity   Km app      19      3
CRO15-induced decrease in melanoma cell viability.              CSNK1G3 (CK1         Activity   Km app      18      2
                                                                gamma 3)
                                                                RAF1 (cRAF)          Activity   100         18      4
CRO15 inhibits MELK kinase activity                             Y340D Y341D
  To discover other pathways implicated in CRO15                EGFR (ErbB1)         Activity   Km app      16      −1
                                                                T790M L858R
mechanisms, we performed a kinome assay in comparison
                                                                PAK1                 Activity   Km app      16      −1
to metformin in which more than 120 kinases involved in
                                                                PIM1                 Activity   Km app      16      0
cancer were analyzed (Table 1). This in vitro experiment
                                                                BRAF                 Activity   100         15      11
allowed us to observe the percentage of direct modulation       AMPK (A1/B1/G3)      Binding                14      2
of different kinase activities induced by CRO15 in func-        DYRK1B               Activity   Km app      14      3
tion of Z′ factor (Fig. 3A). We showed a strong inhibition
of activity of MAPKAPK2 (inhibition: 90%, Z′: 0.82) and

Official journal of the Cell Death Differentiation Association
Jaune et al. Cell Death and Disease (2021)12:64                                                                                 Page 6 of 20

Table 1 continued                                                           Table 1 continued
Kinase                                              CRO15       Metformin   Kinase                                     CRO15   Metformin
                                                    1 µM        1 mM                                                   1 µM    1 mM

KIT                         Activity    Km app      14          −2          MAPK13 (p38 delta)   Activity   Km   app   1       14
MAPK1 (ERK2)                Activity    Km app      14          6           TAOK2 (TAO1)         Activity   Km   app   1       9
DDR2                        Binding                 13          −1          ERBB2 (HER2)         Activity   Km   app   0       3
MAPK3 (ERK1)                Activity    Km app      13          9           FLT1 (VEGFR1)        Activity   Km   app   0       1
NTRK3 (TRKC)                Activity    Km app      13          1           ZAP70                Activity   Km   app   0       0
AXL                         Activity    Km app      12          0           FGFR4                Activity   Km   app   −1      8
DNA-PK                      Activity    Km app      12          4           TEK (Tie2)           Activity   Km   app   −1      5
HCK                         Activity    Km app      12          5           FLT3                 Activity   Km   app   −2      6
MAPK11 (p38 beta)           Activity    Km app      12          12          EGFR (ErbB1)         Activity   Km   app   −4      2
PDGFRA D842V                Activity    Km app      12          2           AMPK (A1/B2/G1)      Binding               −5      2
PLK2                        Activity    Km app      12          11          AMPK (A2/B2/G1)      Binding               −5      5
CSK                         Activity    Km app      11          10          ALK                  Activity   Km app     −7      5
PDK1                        Activity    100         11          6           AMPK (A2/B2/G2)      Binding               −8      0
FGFR2                       Activity    Km app      10          −4          MAPK15 (ERK7)        Binding               −11     1
FLT3 D835Y                  Activity    Km app      10          5           KIT V560G            Activity   Km   app   −13     6
HIPK3 (YAK1)                Activity    Km app      10          3           NTRK1 (TRKA)         Activity   Km   app   −14     2
PDGFRA (PDGFR alpha)        Activity    Km app      10          0           BMX                  Activity   Km   app   −22     7
AMPK (A2/B2/G3)             Activity    Km app      9           12          PRKD1 (PKC mu)       Activity   Km   app   −56     18
CDK1/cyclin B               Activity    Km app      8           5
DAPK3 (ZIPK)                Activity    Km app      8           0
DYRK2                       Binding                 8           1
FGFR3                       Activity    Km   app    8           1           MELK kinase (inhibition: 72%, Z′: 0.90). Our results
IGF1R                       Activity    Km   app    8           2
                                                                            regarding MAPKAPK2, also known as MAPK2, indicate
IKBKE (IKK epsilon)         Activity    Km   app    8           2
                                                                            that this kinase is not involved in AMPK-independent
ERBB4 (HER4)                Activity    Km   app    7           1
MAPK14 (p38                 Activity    Km   app    7           7
                                                                            effects of CRO15 in intact cells as its downstream effector
alpha) Direct                                                               HSP27 is not modulated (Supplemental Fig. 2A). Indeed,
PRKACA (PKA)                Activity    Km app      7           16          MAPK2 is also directly regulated by p38 MAPK protein,
DCAMKL1 (DCLK1)             Activity    Km app      6           7           which, is activated under CRO15 treatment.
EGFR (ErbB1) T790M          Activity    Km app      6           −2            We thus focused our attention on MELK (maternal
EIF2AK2 (PKR)               Binding                 6           12          embryonic leucine zipper kinase). This kinase is described
FLT4 (VEGFR3)               Activity    Km   app    6           4
                                                                            to be an oncogene and is overexpressed in multiple can-
FRAP1 (mTOR)                Activity    Km   app    6           3
                                                                            cers, including melanoma18,19. Furthermore, MELK pro-
PAK4                        Activity    Km   app    6           2
RET                         Activity    Km   app    6           0
                                                                            motes mitosis and proliferation of melanoma cells via the
CSNK1G2 (CK1                Activity    Km   app    5           −2          NF-κB pathway20 and increases DNA damage tolerance to
gamma 2)                                                                    promote proliferation of breast cancer cells21.
KIT D816H                   Binding                 5           13            As shown in Fig. 3B, a probe consisting in CRO15
PRKCI (PKC iota)            Activity    Km app      5           −3          labeled with a fluorescent tag showed a strong co-
PRKCZ (PKC zeta)            Activity    Km app      5           6           localization of CRO15 with MELK antibody (approxi-
PTK2 (FAK)                  Activity    Km app      5           2
                                                                            mately 60%) in CT26 cells supporting an interaction
EGFR (ErbB1) L861Q          Activity    Km app      4           1
                                                                            between CRO15 with MELK. We next determined in vitro
EPHA2                       Activity    Km app      4           9
MAP2K2 (MEK2)               Activity    100         4           7
                                                                            inhibition of MELK activation by CRO15 in comparison
NIM1K                       Activity    Km app      4           9           with a known MELK inhibitor, OTS167 (Fig. 3C). As
ROCK1                       Activity    Km app      4           0           OTS167, CRO15 decreases MELK activity in a dose-
CDK2/cyclin A               Activity    Km app      3           11          dependent manner. However, in contrast to CRO15,
CSNK1G1 (CK1                Activity    Km app      3           6           OTS167 is toxic to normal cells, such as melanocytes,
gamma 1)                                                                    keratinocytes, and fibroblasts (Supplemental Fig. 2C).
DCAMKL2 (DCK2)              Activity    Km   app    3           4
                                                                              To determine whether MELK is a target of CRO15 in
EGFR (ErbB1) L858R          Activity    Km   app    3           −3
                                                                            intact cells, we performed pull-down and biotin pre-
HIPK2                       Activity    Km   app    2           7
MAPK12 (p38 gamma)          Activity    Km   app    2           4
                                                                            cipitation experiments in A375 cells infected with a
MERTK (cMER)                Activity    Km   app    2           4           MELK adenovirus and treated with a biotin-tagged
                                                                            CRO15. For the pull-down experiment, A375 lysates
                                                                            were incubated overnight with 100 μM biotin-CRO15 or

Official journal of the Cell Death Differentiation Association
Jaune et al. Cell Death and Disease (2021)12:64                                                                                                                                                                                  Page 7 of 20

                                            1,00
                                                                                                                                                                                          MELK
            A.                              0,90

                                            0,80
                                                                                                                                                                                                        MAPKAPK2
                                       Z'

                                            0,70

                                            0,60

                                            0,50
                                                   80                60               40           20          0            20           40                               60              80                    100
                                                                                                              % of inhbition
            B.

                                 DMSO

                                                Dapi                                       MELK                                  CRO15                                                    Merge

                         CRO15
                          - 2h
                                               Dapi                                        MELK                                 CRO15                                                     Merge

           C. 140
                                 120
                                                                                                        D.                  Pull Down                                               Biotin-precipitation
             MELK activity (%)

                                                                                                        MELK                                                                                                                  74 kDa
                                 100

                                 80
                                                                                                                                 Input                                                              Input
                                 60
                                                                                                        MELK                                                                                                                  74 kDa
                                 40

                                 20                                                                     ERK                                                                                                                   44 kDa
                                                                                                               MTF465 CRO15 MTF465 CRO15 MTF465 CRO15 MTF465 CRO15
                                  0
                                         Ctl    0.8        1     2        4       6   40   80 160                  Ad Control          Ad MELK                                     Ad Control                    Ad MELK
                                                        CRO75 (M)                     OTS167 (nM)

                                                                                                                             F.
            E.                            MELK                                                     74 kDa
                                                                                                                            P-ATM                                                                                350 kDa
                                       P-NF- B                                                    65 kDa                        ATM                                                                             350 kDa
                                         NF- B                                                    65 kDa
                                                                                                                             H2AX                                                                               15 kDa
                                       Cyclin E                                                    48 kDa
                                                                                                                             HSP90                                                                               90 kDa
                                            CDK1                                                   34 kDa                                Ctl                         1         2     4         6        8
                                            CDK2                                                   33 kDa                                                                    CRO15 5μM (h)
                                         HSP90                                                      90 kDa
                                                           Ctl       1        2        4       6
                                                                                                                                                                                           *
                                                                         CRO15 5μM (h)                                           H.                            150                                          *
                                                                                                                                          Cell Viability (%)

                                                                                                                                                                                      *
           G.                                                                                                                                                            ***                       **
                                                      Ad Control                           Ad Melk
                                                                                                                                                               100
                                                   SiCtl         SiAMPK                                                                                                                                                    Control
                                                                             SiAMPK    SiCtl
                                                                                                                                                                                                                           CRO15
                                               Ctl CRO15 Ctl CRO15 Ctl CRO15 Ct CRO15
                                                                                                                                                               50
                                 Melk                                         l       74 kDa

                                 AMPK                                                                                                                           0
                                                                                                                   62 kDa
                                                                                                                                       SiControl                         +           -             +             -
                                                                                                                                 SiAMPK ( 1+ 2)                          -           +             -             +
                                 Actin                                                                             43 kDa                 AdCT                           +           +             -             -
                                                                                                                                         AdMelk                          -           -             +             +

  Fig. 3 (See legend on next page.)

Official journal of the Cell Death Differentiation Association
Jaune et al. Cell Death and Disease (2021)12:64                                                                                         Page 8 of 20

  (see figure on previous page)
  Fig. 3 CRO15 inhibits MELK kinase activity. A Scatter plot representing the percentage of kinase inhibition and their Z′ factor measured during
  two independent in vitro kinome assay with 1 μM CRO15. B Immunofluorescence pictures of CT26 cancer cells treated with 5 μM CRO15 for 2 h.
  MELK was labeled with a specific antibody (in red), CRO15 was coupled to a fluorescent tag (in green) and nuclei were stained with DAPI (in blue). C
  In vitro test of kinase activity using recombinant MELK protein treated with CRO15 with the MELK inhibitor OTS167. D A375 cells were infected with
  MELK adenovirus for 24 h. For the pull down assay, cells lysates were incubated overnight with 100 μM Biotin-CRO15 or its inactive analog MTF465.
  For Biotin precipitation, cells were treated for 2 h with 20 μM Biotin-CRO15 or MTF465 before lysis and western blot analysis with the indicated
  antibodies. One representative experiment of three is shown. E and F A375 cells were treated with 5 μM CRO15 with the indicated durations, and
  lysates were analyzed by western blotting using the indicated antibodies. One representative experiment of three is shown. G A375 cells were
  transfected with siRNA directed against AMPK α1 and AMPK α2 (20 nM each) or 40 nM of control siRNA. Twenty-four hours later, cells were infected
  with a MELK adenovirus or a control adenovirus before treatment with 5 µM of CRO15. After 24H, viable cells were counted using the trypan blue dye
  exclusion method (n = 3) (right panel). In parallel, cell lysates were analyzed by western blotting with the indicated antibodies (left panel). One
  representative experiment of three is shown.

with biotin-MTF465, a non-active CRO15 analog devoid                         experiment unequivocally demonstrates the implication
of its pharmacophore. We thus demonstrated a direct                          of both AMPK activation and MELK inhibition in the
interaction of MELK with biotin-CRO15 (Fig. 3D) but                          mode of action of CRO15.
very weak with the negative control, biotin-MTF465. This
result was further confirmed by detecting MELK after                          DNA damage repair pathway induces p53 pathway
biotin precipitation on lysates of A375 treated for 2 h with                 activation
20 μM of biotin-CRO15.                                                         As described in the literature, the ATM/CHK2 axis is
   We then determined the consequences of MELK inhi-                         often responsible for p53 activation on serine 15 after
bition for melanoma cells. Importantly, MELK expression                      DNA damage23. Furthermore, AMPK activators included
correlates with melanoma progression22. A bio-informatic                     metformin-activated p53 by phosphorylation on serine 15.
analysis of expression data on melanoma shows that                           Thus, we wanted to determine whether CRO15 can also
MELK is significantly overexpressed in metastatic mela-                       activate this protein. We first examined the viability of
noma compared to primary melanoma (Supplemental Fig.                         different melanoma cells mutated for p53 after CRO15
2B). Its overexpression correlates with the overexpression                   induction and we observed that, in the cells expressing an
of its downstream target CDK1 (Cyclin-Dependent Kinase                       inactive form of p53, the decrease of viability is less
1), implicated in the mitosis process. We performed                          important than in the other melanoma cell lines expres-
kinetics of CRO15 (5 μM) in A375 cells, and detected a                       sing Wild Type p53 (Fig. 4A). We next wanted to deter-
time-dependent decrease in expression of MELK but also                       mine whether p53 is implicated in CRO15 mechanisms.
of NF-κB phosphorylation and some mitosis markers,                           CRO15 induced a time-dependent phosphorylation of p53
such as Cyclin E, CDK1, and CDK2 (Cyclin-Dependent                           on Ser15 that suggested p53 activation in A375 cells (Fig.
Kinase 1 and 2) (Fig. 3E). Interestingly, we confirmed the                    4B). We confirmed an increase in p53 activity upon
inhibition of all actors implicated in the NF-κB pathway to                  CRO15 treatment by luciferase assays (Fig. 4C).
induce melanoma cell proliferation (Supplemental Fig.                          As expected, the activity of endogenous p53 was not
2A). Finally, MELK is known to increase DNA damage                           detectable in response to CRO15 or positive control
tolerance in breast cancer cells21. In our system, the                       actinomycin in p53-mutated SK-MEL-28 cells (Fig. 4D,
inhibition of MELK by CRO15 was associated with a                            right part). When we infected these cells with wild type
strong inhibition of the DNA damage repair pathway with                      p53, CRO15 induced a strong activity of p53. In parallel,
decreased phosphorylation of ATM (Ataxia Telangiecta-                        shutting down p53 expression with a siRNA induced a
sia Mutated) associated with an increase in the DNA                          partial restoration of cell viability mediated by CRO15
damage marker γH2AX. CRO15-mediated activation of                            (Fig. 4D, left part). This result is confirmed by western
CHK2 (Checkpoint Kinase 2) and γH2AX were also                               blot analysis, which showed that knockdown of endo-
observed by immunofluorescence in A375 cells (Supple-                         genous p53 abolished the phosphorylation of p53 on
mental Fig. 2D, E). To confirm that the biological activity                   Ser15 and attenuated the increase in expression of a direct
of CRO15 involves the activation of AMPK and the                             target gene of p53, REDD1 (Regulated in Development
inhibition of the MELK oncogene, we tried to counteract                      and DNA damage response 1) in response to CRO15 (Fig.
its effects on rescue experiments (Fig. 3G). Noticeably,                     4E).
knocking-down AMPK using siRNA or over-expressing                              Finally, SK-MEL-28 cells were infected with an adeno-
MELK using adenoviral construct partially restored cell                      virus encoded an active form of p53, and we observed that
viability and the combination of both almost completely                      when we restored p53 function, we restored the sensitivity
abolished the anti-melanoma effect of CRO15. This                            to CRO15 (Supplemental Fig. 3A, B).

Official journal of the Cell Death Differentiation Association
Jaune et al. Cell Death and Disease (2021)12:64                                                                                                                                                                        Page 9 of 20

                  A.                                                                     A375 S                                               SKMel28 S
                                                                        WT P53           WM9          Mutated P53                             MeWo
                                                                                         Patient 1                                            Patient 4

                                                                  100

                                             Cell Viability (%)
                                                                  80                                                                          **

                                                                  60

                                                                  40                                      ***

                                                                  20

                                                                   0
                                                                                   Control                 CRO15 5 M

           B.                                                                                                                           C.                                      500

                                                                                                                                                    Luciferase activation (%)
                                                                                                                                                                                                   *
                                                                                                                                                                                400
                P-p53(Ser15)                                                                     53 kDa

                        p53                                                                      53 kDa                                                                         300
                                                                                                                                                                                                            **

                        GAPDH                                                                    37 kDa                                                                         200
                                      Ctl    1                     2      4        6         8
                                                                                                                                                                                100
                                                                    CRO15 5µM (h)

                                                                                                                                                                                 0

                                                                                                                                                                                        Ctl      CRO15    Acti.

           D.
                                                                              siControl                                                 400
                                                                              sip53                                                                                                                        ***
                  100
                                                                                                            Luciferase activation (%)

                                                                                   *                                                    300
                   80                                                                  ***
                   60                                                                                                                                                                                             **
                                                                              **                                                        200
                   40

                   20                                                                                                                   100

                    0
                                   Control                                CRO15 5 M
                                                                                                                                          0
                                                                                                                                              Ctl                               CRO15    Acti.     Ctl   CRO15    Acti.

                                                                                                                                                               Ad control                                Ad p53

                              E.
                                             P-P53 (Ser15)                                                                                                               53 kDa
                                                                          P53                                                                                              53 kDa
                                                                        REDD1                                                                                           28 kDa
                                                                        HSP90                                                                                             90 kDa
                                                                                       Ctl 2h 4h 6h Ctl 2h 4h 6h
                                                                                           CRO15 5µM      CRO15 5µM
                                                                                        siControl                          siP53

  Fig. 4 (See legend on next page.)

Official journal of the Cell Death Differentiation Association
Jaune et al. Cell Death and Disease (2021)12:64                                                                                         Page 10 of 20

  (see figure on previous page)
  Fig. 4 CRO15 treatment induces p53 pathway activation. A Indicated melanoma cell lines were treated with 5 μM CRO15 for 48 h before viable
  cells were counted using the trypan blue dye exclusion method. B A375 cells were treated with 5 μM CRO15 for the indicated duration, and lysates
  were analyzed by western blotting with indication antibodies. One representative experiment of three is shown. C Luciferase activity in A375 cells
  transfected with a p53 luciferase reporter upon 5 μM CRO15 treatment or actinomycin used as a positive control for p53 induction. D (left part) A375
  cells were transfected with sip53 and then treated with 5 μM CRO15. After 24 h of treatment, viable cells were counted using the trypan blue
  exclusion method. The results are expressed as percentages of the DMSO control. (Right part) SK-MEL-28 cells were infected with control or p53-
  encoding adenoviruses and transfected with a p53 luciferase reporter. Cells were treated 24H with 5 μM CRO15 and a luciferase assay was performed.
  E A375 cells were transfected with control or p53 siRNA and treated with 5 μM CRO15 for the indicated duration. Lysates were analyzed by western
  blotting with the indicated antibodies. One representative experiment of three is shown. For C and D, data given as the means ± SEM of three
  independent experiments performed in triplicate. *p < 0.05; **p < 0.01; ***p < 0.001.

CRO15 mediates the activation of autophagy and                                autophagolysosomes with a double membrane char-
apoptosis in melanoma cells                                                   acteristic of autophagy.
  Metformin induces both autophagy and apoptosis in                             To determine whether these two mechanisms are
melanoma cells to induce cell death14. We observed that                       dependent on each other, we blocked autophagy by siLC3,
CRO15 induced a time-dependent accumulation of LC3-                           apoptosis by Q-VD (inhibitor of pan caspase) and both
II (Fig. 5A). This was confirmed by confocal microscopy,                       mechanisms at the same time (Supplemental Fig. 4E, F).
with accumulation of LC3 in melanoma cells under                              We observed that when the two mechanisms are blocked,
CRO15 stimulation in the same manner as that accu-                            all melanoma cell viability is restored. When we blocked
mulation of LC3 under rapamycin stimulation, which is                         only autophagy or apoptosis, we partially restored mela-
an autophagy activator (Fig. 5B and Supplemental Fig.                         noma cell viability. Interestingly, when the two mechan-
4A). To confirm that in our system, autophagy favors                           isms are blocked independently, the other mechanism is
melanoma cell death and does not protect them, we                             still activated. Thus, autophagy and apoptosis are two
blocked the autophagic flux with a protease inhibitor,                         mechanisms activated independently by CRO15.
pepstatin and a cysteine protease inhibitor, E64d. After                        We identify pathways involving AMPK and/or p53,
stimulation with CRO15 for 24 h, we observed a partial                        which are responsible for the cell death mechanism
restoration of melanoma cell viability when autophagy                         induced by CRO15. To confirm that only these two pro-
was blocked (Supplemental Fig. 4B, C). Finally, it was also                   teins are responsible for melanoma cell death induced by
shown by autophagy inhibition with siRNA against LC3                          CRO15, we blocked these two proteins and studied cell
and ATG5 (Data not shown). For the apoptosis pathway,                         viability. After infection with adenoviruses of dominant
we observed a characteristic cleavage of PARP (Poly-                          negative forms of AMPKα1 and α2 and transfection of
ADP-Ribose polymerase) in a time-dependent manner                             sip53, we observed a total restoration of melanoma cell
under CRO15 treatment (Fig. 5A). We also observed a                           viability after CRO15 stimulation for 24 h (Fig. 5D, E),
decrease in total caspase 3 and 9 expression, which are                       indicating that these 2 proteins are responsible for cell
specific markers for caspase-dependent apoptosis. To                           death induced by CRO15. Interestingly, by western blot
confirm the implication of apoptosis in CRO15-induced                          analysis, we observed that CRO15 increased the expres-
cell death, we performed flow cytometry analysis (Fig. 5C).                    sion of REDD1 after 2 h of stimulation but that this
First, we examined the presence of annexin V on the                           increase was lost when the AMPK and p53 pathways were
cellular membrane in melanoma cells. Indeed, when cells                       inhibited (Fig. 5E). Thus, we wanted to determine whether
enter apoptosis, a flip-flop into the plasma membrane                           REDD1 can be implicated in melanoma cell death
takes place and phosphatidylserines, which are normally                       mechanisms induced by CRO15. REDD1 is a protein
inside the cells, are exposed to the extracellular medium                     implicated in the stress response (i.e., DNA damage,
and can link with annexin V. After CRO15 stimulation,                         metabolic dysregulation, etc.) and can activate different
we observed a large increase in melanoma cells stained                        cell death mechanisms when restoration of melanoma cell
with annexin V. We also studied the presence of caspase 3                     viability stress is too strong for the cell. We observed that
active cells after CRO15 stimulation. We observed that                        REDD1 is activated by CRO15 at an early time point post-
melanoma cells treated with this drug present approxi-                        stimulation and that its principal target, mTOR, is no
mately 60% of caspase-3 active cells compared to the                          longer phosphorylated and therefore inactivated (Fig. 5F).
control. Finally, autophagy and apoptosis after                               To confirm the implication of REDD1 in the cell death
CRO15 stimulation were also observed in electronic                            mechanism, we inhibited REDD1 expression with siRNA,
microscopy (Supplemental Fig. 4D). In these pictures, we                      and in blue trypan exclusion, we observed that there was a
observed the formation of apoptotic blebs and                                 total restoration of melanoma cell viability after 24 h of

Official journal of the Cell Death Differentiation Association
Jaune et al. Cell Death and Disease (2021)12:64                                                                                                                                                                                       Page 11 of 20

              A.                                                                                                             B.
                                                                                                                    116 kDa                     Control                                CRO15           Rapamycin
                                                     PARP
                                                                                                                    89 kDa
              Total Caspase 9                                                                                       47 kDa
              Total Caspase 3                                                                                       35 kDa             Dapi
                                                                                                                    16 kDa
                                                       LC3
                                                                                                                    14 kDa
                                                     HSP90                                                          90 kDa
                                                             Ctl     2     4      6       8       12       24                          LC3
                                                                          CRO15 5µM (h)

                  C.                                                                                                               Merge

                                                     100
                     Active Caspase 3

                                                     80
                         cells (%)

                                                     60                     ***
                                                     40                                                                           D.                                                                             SiControl

                                                                                                                *                                                                                                Sip53+AdAMPK 1+ 2
                                                     20
                                                                                                                                              120                                                      **
                                                                                                                                                                                                             #
                                                      0                                                                                       100
                                                              Ctl         CRO15 PLX4032 Stauro.                                                80

                                                                                                                                               60
                                                                                                                                                                                                 ***
                          Cell Death Inudction (%)

                                                                                                                                               40
                                                                                                                Dapi                           20
                                                     100
                                                                                                                Annexin V-Dapi                 0
                                                     80                                                         Annexin V
                                                                           **                                                                                                  Ctl           CRO15 5 M
                                                     60
                                                     40                                                                           E.
                                                     20
                                                                                                                                                REDD1                                                                       28 kDa
                                                       0
                                                              Ctl        CRO15 PLX4032 Stauro.                                                AMPK tot                                                                      62 kDa
                                                                                                                                               p53 tot                                                                      53 kDa

                                                                                                                                                HSP90                                                                       90 kDa
                                                                                                                                                                                 Ctl     2 24 Ctl 2 24
                                                                                                                                                                                       CRO15 (h) CRO15 (h)
                                                                                                                                                                                       SiCtl +   Sip53 +
                                                                                                                                                                                        AdCtl    AdAMPK
                                                                                                                                                                                                   1+ 2
                                                                                                                                                                                                                                SiControl
                F.                                                                                                                                                                                                ***           SiREDD1
                                                       REDD1                                                          28 kDa      G.
                                                                                                                                                    Cell Viability (%)

                                                                                                                                                                         100                                            #
                                                     P-mTOR                                                           289 kDa                                             80
                                                                                                                                                                          60
                                                      mTOR                                                            289 kDa
                                                                                                                                                                         40                                 ***
                                                      HSP90                                                           90 kDa                                              20
                                                                    Ctl     1         2       4        6        8
                                                                                                                                                                          0
                                                                                CRO15 5µM (h)                                                                                          Ctl             CRO15 5 M

                                                                                                                                  H.            REDD1                                                                          28 kDa
                                                                                                                                                                                                                               116 kDa
                                                                                                                                                    PARP                                                                       89 kDa
                                                                                                                                                                    LC3                                                        16 kDa
                                                                                                                                                                                                                               14 kDa
                                                                                                                                                HSP90                                                                          90 kDa
                                                                                                                                                                                 Ctl     6 12 24 Ctl 6 12 24
                                                                                                                                                                                        CRO15 (h)            CRO15 (h)

                                                                                                                                                                                         SiCtl               SiREDD1

  Fig. 5 (See legend on next page.)

Official journal of the Cell Death Differentiation Association
Jaune et al. Cell Death and Disease (2021)12:64                                                                                          Page 12 of 20

  (see figure on previous page)
  Fig. 5 CRO15 mediates the activation of autophagy and apoptosis in melanoma cells. A A375 cells were treated with 5 μM CRO15 for the
  indicated duration. Lysates were analyzed by western blotting with the indicated antibodies. One representative experiment of three is shown. B
  Immunofluorescence pictures of A375 melanoma cells treated with DMSO, 5 μM CRO15 or 400 nM of the autophagy inducer rapamycin for 6 h. LC3B
  was labeled with antibody (green), and DNA was visualized with DAPI (blue). C A375 melanoma cells were treated for 24 h with 5 μM CRO15, 5 μM
  PLX4032 or with 1 μM of the pan-kinase inhibitor staurosporine for 6 h used as positive control of apoptosis induction. Cells were analyzed by flow
  cytometry using a specific antibody against Caspase 3 active protein conjugated with FITC (upper panel) or Annexin V conjugated with ALEXA and
  DAPI (lower panel) or against. *p < 0.05; **p < 0.01; ***p < 0.001. D A375 cells were infected with dominant negative adenoviruses against α1 and α2
  AMPK subunits for 24 h before transfection with sip53 for another 24 h. Cells was determined by trypan blue staining after a 24 h treatment with 5 μM
  CRO15 or DMSO control. E A375 cells were infected with dominant negative adenoviruses against α1 and α2 AMPK subunits for 24 h and were
  transfected with sip53 for another 24 h. Cells were treated with 5 μM CRO15 for the indicated durations, and lysates were analyzed by western blot
  with the indicated antibodies. One experiment of three is shown. F A375 cells were treated with 5 μM CRO15 for the indicated durations, and lysates
  were analyzed by western blotting with the indicated antibodies. One representative experiment of three is shown. G A375 cells were transfected
  with siREDD1 for 24 h and then treated with 5 μM CRO15 for 24 h before cell viability was determined using the trypan blue exclusion method. H.
  A375 cells were transfected with siREDD1 for 24 h and then treated with 5 μM CRO15 for the indicated duration. Lysates were analyzed by western
  blotting with the indicated antibodies. One representative experiment of three is shown. For D and G, the results are expressed as percentages of the
  control and data given as the means ± SEM of three independent experiments performed in triplicate. *p < 0.05; **p < 0.01; ***p < 0.001.

CRO15 stimulation (Fig. 5G). Interestingly, we showed in                      with LC3 antibody, and we observed an increase in LC3
western blot analysis that when REDD1 is inhibited,                           expression in CRO15 conditions, confirming the activa-
autophagy (with LC3 II conversion) and apoptosis (with                        tion of autophagy by CRO15 in vivo (Fig. 6E). For apop-
PARP cleavage) are lost under CRO15 stimulation (Fig.                         tosis, we stained the tumor sections with active-caspase 3
5H).                                                                          antibodies and TUNEL assay. We observed an increase in
  In conclusion, we demonstrate that CRO15 induces                            both active caspase 3 and TUNEL staining in CRO15
melanoma cell death by AMPK and p53 pathways to                               conditions (Fig. 6E). These results confirmed the activa-
induce autophagy and apoptosis of melanoma cells, and                         tion of autophagy and apoptosis in vivo by CRO15.
this process is REDD1 dependent.
                                                                              CRO15 induces cell death in melanoma cells resistant to
CRO15 decreases tumor growth in mouse models                                  BRAF inhibitors
  To assess the antineoplastic potential effect of CRO15                        As mentioned above, treatment of BRAF V600E mela-
in vivo, A375 melanoma cells (1.0 × 10⁶) were injected                        noma patients with BRAF inhibitors, such as PLX4032,
subcutaneously into 5-week-old female athymic nude                            leads to systematic resistance and metastasis relapse. In
mice. After tumor apparition (approximately size of 50                        Fig. 7A, we showed that CRO15 induces melanoma cell
mm3), mice were treated every day with Labrafil (control),                     death in A375, SK-MEL-28 and WM9 melanoma cells
PLX4032 (0.7 mg/mouse/day) and CRO15 (0.7 mg/                                 that had acquired resistance to PLX4032. Interestingly, we
mouse/day) over a period of 4 weeks. This dose corre-                         confirmed that in SK-MEL-28 cells mutated for p53,
sponds to the equivalent dose of PLX4032 given to patient                     CRO15 was less efficient. In addition, we observed that
in melanoma therapy. Untreated control mice rapidly                           CRO15 induces the same molecular and death mechan-
developed visible tumors, and we observed a dramatic                          isms in A375 resistant melanoma cells. Indeed, in western
increase in tumor growth throughout the study (Fig. 6A).                      blot analysis, we observed phosphorylation of AMPK after
By contrast, treatment of mice with PLX4032 or CRO15                          CRO15 stimulation. We also observed a decrease in
markedly attenuated the development of tumors. More-                          MELK expression and CDK1 in a time-dependent man-
over, the tumors derived from CRO15-treated mice pre-                         ner. Phosphorylation of p53 (ser15), increased expression
sent consistently and significantly lower weight than those                    of REDD1 and decreased phosphorylation of mTOR were
from untreated control mice (Fig. 6B). Furthermore, the                       confirmed at early time of stimulation by CRO15 at 5 μM
treatment of mice with CRO15 induced no apparent                              (Fig. 7B). For cell death mechanisms induced by CRO15,
toxicity, and we noted no change in their behavior and                        PARP cleavage and LC3-II accumulation were observed in
body mass (Fig. 6C). Furthermore, we evaluated hepatic                        western blot analysis (Fig. 7B). These two mechanisms
toxicity by measuring hepatic transaminases in the sera of                    were confirmed by confocal microscopy with staining of
treated mice (Fig. 6D), and no change appeared between                        LC3 for autophagy (Fig. 7C) and flow cytometry, with
control and CRO15-treated mice, indicating the absence                        increasing annexin V and active caspase 3 staining for
of hepatic toxicity. We then investigated the molecular                       apoptosis (Fig. 7D). Finally, we tested the anti-
mechanisms involved in the anti-tumorigenic effects of                        tumorigenic effect of CRO15 in mice injected with A375
CRO15 in vivo. Tumor sections from mice were stained                          R melanoma cells presenting acquired resistance to the

Official journal of the Cell Death Differentiation Association
Jaune et al. Cell Death and Disease (2021)12:64                                                                                                                                                                                                                                                                                             Page 13 of 20

                 A.                                                                     1000                               Labrafil
                                                                                             900                           Metformine
                                                                                             800                           PLX4032
                                                                 Tumoral Volume (mm3)

                                                                                             700                           CRO15
                                                                                             600

                                                                                             500

                                                                                             400

                                                                                             300

                                                                                             200

                                                                                             100

                                                                                              0
                                                                                                        D+14             D+16         D+19                     D+21                                            D+23                 D+27           D+30       D+33                                         D+36
                                                                                                                                                                                             Days After Treatment
                                                                                                                                                                                                                                                                                                                  B.
               B.                 1,4
                                                                                                                                  C.                                                                                                                D.
                                  1,2
                  Tumoral Weight (g)

                                                                                                                                                                                                                                                                       60
                                                                                                                                                     29                       Labrafil                                                                                                                                           Labrafil
                                  1,0
                                                                                                                                                     27                       PLX4032                                                                                                                                            CRO15
                                                                                                                                        Weight (g)

                                  0,8                                                                                                                25                       CRO15                                                                                    40

                                                                                                                                                                                                                                                                 U/L
                                                                                                                    *                                23

                                  0,6                                                                                                                21                                                                                                                20
                                                                                                                           **                        19
                                  0,4
                                                                                                                                                     17
                                                                                                                                                                                                                                                                         0
                                                                                                                                                     15
                                  0,2                                                                                                                     0    2                 5            7     9    12   14 16   19 21   23 27 30   33   36                                                      AST                  ALT
                                                                                                                                                                                              Days after treatment
                                  0,0
                                                      Labrafil
                                                       Labrafil                                     Metf. PLX4032
                                                                                                   Metformine PLX4032    CRO15
                                                                                                                          CRO15

               E.
                                       Control                                                        CRO15             PLX4032                               Control                                         CRO15                 PLX4032                            Control                                CRO15          PLX4032

              Dapi                                                                                                                    Dapi                                                                                                                Dapi

                                                                                                                                      TUNEL                                                                                                          Cleaved
               LC3                                                                                                                                                                                                                                  Caspase 3

             Merge                                                                                                                    Merge                                                                                                               Merge

                                                                                                   Integrated density of                                                                            Integrated density of TUNEL                                                                    Integrated density of Caspase 3
                                                                                                     LC3 fluorescence                                                                                           assay                                                                                    active-fluorescence
                                                                                                                                                                                                                                                                       Integrated density (AU)
                                                                                                                                                                   Integrated density (AU)
                                       Integrated density (AU)

                                                                         8              105                                                                                                                                    **                                                                 4 106                *
                                                                                                                                                                                              1 106
                                                                                                               **                                                                                                                                                                                 3 106
                                                                     6 105                                                                                                                   7.5 107
                                                                                                                                                                                                                                                                                                  2 106
                                                                                                                                                                                             5.0 107
                                                                    4 105
                                                                                                                                                                                                                                                                                                  1 106
                                                                                                                                                                                             2.5   107
                                                                    2 105                                                                                                                                                                                                                        0.5 106

                                                                                                                                                                                                   500                                                                                                0
                                                                                         0                                                                                                          0                                                                                                      Control CRO15 PLX4032
                                                                                               Control CRO15 PLX4032                                                                                          Control CRO15 PLX4032

  Fig. 6 CRO15 decreases tumor growth in mouse models. A Female immune-deficient BALB/c nu/nu (nude) mice were inoculated
  subcutaneously with 1.0 × 10⁶ A375 cells. After 4 days, mice (n = 6 in each group) were treated with CRO15 (0.7 mg/mouse/day), PLX4032 (0.7 mg/
  mouse/day) or vehicle (Labrafil). Tumor growth curves were determined by measuring the tumor volume. The bars indicate the mean ± SEM. *p <
  0.05; **p < 0.01. B Tumor weight of A375 xenograft after mouse euthanasia. The bars indicate the mean ± SEM *p < 0.05. C. Mice weight over the
  course of the experiment. D Quantification of hepatic transaminases (AST and ALT) on plasma of nude mice treated with vehicle or CRO15 at end
  point. E Immunofluorescence staining on xenograft tumor sections. LC3B (green) and active caspase 3 (red) were immunolabeled, and apoptotic
  cells were visualized with a TUNEL kit. Nuclei were visualized with DAPI (blue). Integrated density was determined for each condition on Fuji. Data are
  geometric means with 95% CI of three independent experiments performed in triplicate. *p < 0.05; **p < 0.01; ***p < 0.001.

BRAF inhibitor PLX4032. Briefly, as previously described,                                                                                                                                                                  Labrafil, PLX4032 (0.7 mg/mouse/day) and CRO15
we subcutaneously injected A375 Resistant cells (1.0 ×                                                                                                                                                                    (0.7 mg/mouse/day). Untreated mice or PLX4032-treated
106) into nude mice, which were then treated with                                                                                                                                                                         mice rapidly developed dramatic tumor growth

Official journal of the Cell Death Differentiation Association
Jaune et al. Cell Death and Disease (2021)12:64                                                                                                                                                                                                                                            Page 14 of 20

                                                                                                               A375 Sensitive
                                                                                                                                                                                        SkMel28 Sensitive                                                        WM9 Sensitive
            A.                                                                                                 A375 Resistant 1
                                                                                                                                                                                        SkMel28 Resistant                                                            WM9 Resistant
                                                                                                               A375 Resistant 2
                                                                                                                                                    100                                                                          100
                            100                                                                                                                                                                       *

                                                                                                                                      Cell viability (%)
                                                                                                                                                                                                                                                                                       *

                                                                                                                                                                                                                Cell viability (%)
                                                                                                                                                                                                                                     80
               Cell viability (%)

                                                                                                                    **                                     80
                                    80                                                                                                                                                   *
                                                                                                                                                                                 ***
                                                                                                                                                           60                                   ***                                  60
                                    60
                                                                                                   ***                                                     40                                                                        40
                                    40                                                                                                                                                                                                                         ***

                                    20                             ***
                                                                                                                                                           20                                                                        20
                                                                             ***   ***                                                                                                                                                                                    ***
                                     0                                                                                                                     0                                                                         0
                                           Ctl                        CRO15                             PLX4032                                                    Ctl           CRO15         PLX4032                                          Ctl            CRO15              PLX4032

          B.                                                                                                                    C.                                                                                                                                              Dapi
                          P-AMPK                                                                                         62 kDa                                 Control         CRO15         Rapamycin
                                                                                                                                                                                                                             D.
                                                                                                                                                                                                                                                                                Annexin V-DAPI
                                    AMPK                                                                                 62 kDa                                                                                                                80                               Annexin V

                                                                                                                                                                                                                         induction (%)
                                                                                                                                                                                                                           Cell death
                                                                                                                                                Dapi
                                                                                                                                                                                                                                                                     **
                                                                                                                                                                                                                                               60
                                     MELK                                                                                74 kDa
                                                                                                                                                                                                                                               40
                                     CDK1                                                                                34 kDa
                                                                                                                                                                                                                                               20
         P-P53(Ser15 )                                                                                                   53 kDa                                                                                                                 0
                                                                                                                                              LC3

                                         P53                                                                             53 kDa                                                                                                                         Ctl CRO15 PLX4032 Stauro.
                                                                                                                         28 kDa

                                                                                                                                                                                                                            Caspase 3 active
                                    REDD1                                                                                                                                                                                                       30

                       P-mTOR                                                                                            289 kDa

                                                                                                                                                                                                                               cells (%)
                                                                                                                                                                                                                                                                      *
                                                                                                                                                                                                                                                20
                                    mTOR                                                                                 289 kDa
                                                                                                                                              Merge

                                                                                                                         116 kDa                                                                                                                10
                                     PARP
                                                                                                                         89 kDa
                                         LC3                                                                             16 kDa                                                                                                                     0
                                                                                                                         14 kDa                                                                                                                         Ctl CRO15 PLX4032 Stauro.
                                    HSP90                                                                                90 kDa
                                                 Ctl 1                       2 4 6 8
                                                                           CRO15 5µM (h)

                                                   E.
                                                                           1600

                                                                           1400                                      Labrafil
                                                    Tumoral Volume (mm3)

                                                                           1200                                      Metformine
                                                                                                                     PLX4032
                                                                           1000
                                                                                                                     CRO15
                                                                            800

                                                                            600

                                                                            400

                                                                            200
                                                                                                                                                                                                           **                                  **         **
                                                                                                                                                                                        **      **
                                                                               0                                                                            **            **
                                                                                         D+5                        D+7         D+9                        D+12          D+14          D+16    D+19       D+21                           D+23            D+26
                                                                                                                                                                  Days After Treatment
                                                                                                              2,5
                                                    F.
                                                                                         Tumoral Weight (g)

                                                                                                              2,0

                                                                                                              1,5

                                                                                                              1,0

                                                                                                              0,5                                                               **
                                                                                                              0,0
                                                                                                                    Labrafil Metformin PLX4032 CRO15
                                                                                                                    LabrafilMetformine PLX4032 CRO15

  Fig. 7 (See legend on next page.)

Official journal of the Cell Death Differentiation Association
Jaune et al. Cell Death and Disease (2021)12:64                                                                                         Page 15 of 20

  (see figure on previous page)
  Fig. 7 CRO15 induced death in melanoma cells resistant to BRAF inhibitors. A Indicated melanoma cell lines were treated with 5 μM CRO15 or
  5 μM PLX4032. After 48 h, cell viability was determined by Trypan blue exclusion method. The results are expressed as percentages of the
  corresponding control and data given as the means ± SEM of three independent experiments performed in triplicate. *p < 0.05; **p < 0.01; ***p <
  0.001. B A375-resistant cells were treated with 5 μM CRO15 for the indicated durations. Lysates were analyzed by western blotting with the indicated
  antibodies. One representative experiment of three is shown. C Immunofluorescence images of A375-resistant melanoma cells treated with 5 μM
  CRO15 or 400 nM rapamycin for 6 h or DMSO control. LC3B was labeled with antibody (green), and the nuclei were visualized with DAPI (blue). D
  A375-resistant melanoma cells were treated for 24 h with 5 μM of CRO15 or PLX4032 for 24 h or with 1 μM staurosporine for 6 h. Cells were analyzed
  in flow cytometry with a specific antibody directed Annexin V (conjugated with ALEXA) or Caspase 3 active protein (conjugated with FITC). *p < 0.05;
  **p < 0.01; ***p < 0.001. E Female immune-deficient BALB/c nu/nu (nude) mice were inoculated subcutaneously with 1.0 × 10⁶ A375-resistant cells.
  After 7 days, mice (n = 6 in each group) were treated with CRO15 (0.7 mg/mouse/day), PLX4032 (0.7 mg/mouse/day) or vehicle (Labrafil). Tumor
  growth curves were determined by measuring the tumor volume. The bars indicate the mean ± SEM. *p < 0.05; **p < 0.01. F Tumor weight of A375-
  resistant xenograft after mouse euthanasia. The bars indicate the mean ± SEM *p < 0.05; **p < 0.01.

throughout the study (Fig. 7E). In contrast, CRO15-                           important and dependent on mitochondria for cell sur-
treated mice markedly attenuated the development of                           vival27. In this context, mitochondria seem to be very
tumors. Moreover, tumors derived from CRO15-treated                           important, and their pharmacological dysregulation could
mice were consistently and significantly lower than those                      pave the road to develop new melanoma therapies. Fur-
from untreated or PLX-treated mice (Fig. 7F). These data                      thermore, AMPK is an energy sensor of the cells; it plays a
clearly demonstrate the anti-melanoma activity of CRO15                       role in cellular energy homeostasis. It is composed of
in vivo in BRAF inhibitor-resistant cells. As observed in                     3 subunits α, β, and γ28. Both subunits play a specific role
tumors from melanoma cells sensitive to BRAF inhibitor,                       in the stability and activity of AMPK, and the α subunits
CRO15 induced a strong increase in LC3, active caspase 3                      play a role in catalytic activity29. AMPK plays an impor-
and TUNEL staining compared to tumor sections from                            tant role in metabolism regulation with inhibition of fatty
control or PLX4032 (Supplemental Fig. 5B). In this                            acid synthesis, cholesterol and triglycerides by ACC
experiment, no apparent toxicity appeared with no change                      phosphorylation30. However, AMPK also plays a role in
in mouse behavior, body mass (Supplemental Fig. 5A) or                        the induction of autophagy and apoptosis by a number of
liver mass (data not shown).                                                  different mechanisms. For example, AMPK can directly
                                                                              phosphorylate ULK1 (UNC-51-like kinase)31 or activate
Discussion                                                                    REDD132, both of which dephosphorylate mTOR and
  Currently, therapies against metastatic melanoma are                        induce autophagy. Interestingly, AMPK can also activate
not efficient enough. Indeed, targeted therapies against                       the apoptosis pathway by eIF2a (eukaryotic Initiation
BRAF V600E/MEK initially show very efficient responses,                        Factor 2 α)33 or by p5334. In our study, we showed that the
but after a few weeks of treatment, melanoma relapses                         AMPK pathway is partially responsible for melanoma cell
and metastases begin to grow again3–6,11. For immu-                           death induced by CRO15. Despite the fact that the AMPK
notherapies, objective responses are sustainable but only                     pathway is present in all human cells and in cancer
in 30 to 40% of patients in the best way7,8,24. Thus, for                     human cells, but we did not observe any toxicity in nor-
many patients (more than 50%), there are no effective                         mal human cells. Interestingly, we observed that CRO15 is
treatments for their melanoma, and discovering new                            able to induce minimal AMPK phosphorylation in both
therapies is essential. In this report, we present anti-                      normal keratinocytes and melanocytes without affecting
melanoma effects of a new biguanide-derived compound                          their viability. Our hypothesis is that the AMPK pathway
CRO15. Melanoma presents many different mutations                             is constitutively more activated in melanoma cells because
and oncogene proteins. In this study, we showed that                          of their metabolic activity. When CRO15 is added to these
CRO15 induces melanoma cell death independently of                            cells, a threshold is exceeded, and this high level of AMPK
their mutational status, and this is due to activation of the                 induces the activation of autophagy and apoptosis in
AMPK and p53 pathways and inhibition of MELK kinase                           melanoma cells. In normal human cells, the level of
activity. As biguanides, CRO15 is able to activate the                        AMPK is lower than this threshold, and thus, no cellular
AMPK pathway by disrupting mitochondrial metabolism                           death is induced. However, the other scenario is that
and by changing the ATP/AMP ratio. Interestingly, in                          cancer cells might overexpress CRO15 transporters.
melanoma glycolytic metabolism, mediated by mito-                                To determine the AMPK-independent effects of
chondrial activity, is very important25,26. Furthermore, it                   CRO15, we performed a kinome assay, and we identified 2
was described that melanoma cells resistant to BRAF                           kinases significantly inhibited by our compound. The first
inhibitors showed an oxidative metabolism that was more                       candidate is a member of the Ser/Thr protein kinase

Official journal of the Cell Death Differentiation Association
Jaune et al. Cell Death and Disease (2021)12:64                                                                Page 16 of 20

family, MAPKAPK2. This kinase is regulated through              and keratinocytes. MELK is also implicated in the DNA
direct phosphorylation by p38 MAP kinase. In conjunc-           damage response21. Indeed, MELK was shown to increase
tion with p38 MAP kinase, this kinase is known to be            the tolerance of cancer cells to the DNA damage response
involved in many cellular processes, including stress and       by inhibiting the phosphorylation of ATM. This allows
inflammatory responses, nuclear export, gene expression          cancer cells to inhibit activation of death mechanisms
regulation, cell proliferation and metastasis invasion. Heat    induced by this response. When melanoma cells are
shock protein HSP27 was shown to be one of its sub-             treated with CRO15, ATM phosphorylation is observed
strates35,36. Our experiments quickly allowed us to elim-       during early stimulation, which induces activation of the
inate this candidate in the CRO15 mode of action in             DNA damage pathway response. These results suggest
melanoma cells. Indeed, CRO15 rapidly increases the             that CRO15 could remove ATM inhibition induced by
activation of p38 and does not decrease the phosphor-           MELK and reactivate the DNA damage response pathway.
ylation of MAPKAPK2 and of its substrate HSP27. Fur-            This activation allows phosphorylation of p53 on ser15 by
thermore, our preliminary experiments indicate that             CHK2, which leads to the activation of REDD146, which is
CRO15 is not able to inhibit melanoma cell invasion,            responsible for melanoma cell death. Indeed, p53 plays an
which constitutes one of the main effects of the enzyme         essential role in human cells and is implicated in the DNA
(data not shown)36–38.                                          damage response induced by ATM23. Activation of p53
  The second evaluated candidate of CRO15 was the               induced a protective response against DNA damage and
oncogene MELK. This protein is a member of the AMPK/            tried to repair it. However, sustainable activation of DNA
Snf1 family, which is a serine/threonine kinase that is         damages induced an increase in REDD1 expression by
highly conserved across a variety of mammalian and non-         p53 and thus activation of cell-death mechanisms. REDD1
mammalian species. MELK has been shown to be acti-              (RTP801/Dig2/DDIT4) was identified as a hypoxia-
vated by auto-phosphorylation in vitro, which is a unique       inducible factor 1 (HIF-1) target gene involved in the
mechanism among the AMPK/Snf1 family members39.                 regulation of cell survival. REDD1 is also regulated in
This kinase is overexpressed in several human cancers           response to DNA damage, nutrient depletion, gluco-
and stem cell populations, including melanoma                   corticoid and insulin47,48. This protein is a negative reg-
cells19,40,41. MELK plays a prominent role in cell cycle        ulator of mTOR and is defined as a key metabolic
control, cell proliferation and cancer treatment resistance     regulator suppressing tumorigenesis thought effects on
and is a good candidate for potential anti-cancer thera-        mTOR activity49 and mitochondria. After CRO15 treat-
pies. Further, a recent study demonstrated the importance       ment, REDD1 expression is quickly increased and induces
of MELK expression and its effects on the NF-κB pathway         mTOR dephosphorylation. This is responsible for
in melanoma proliferation20. Indeed, MELK is over-              autophagy induction, which is confirmed by the loss of
expressed in primary and even more in metastatic mela-          LC3-II conversion when REDD1 is deleted. In addition,
noma, suggesting its implications in melanoma                   REDD1 also activates apoptosis50 and the knock down of
progression22. This increasing expression is correlated         REDD1 leads to loss of PARP cleavage in melanoma cells
with increased expression of CDK1, an essential protein         upon CRO15 treatment. REDD1 is the key protein acti-
promoting proliferation and mitosis42. However, two             vated in melanoma cells in response to CRO15 treatment
recent articles questioned the role of MELK in cancer           and is responsible for melanoma cell death.
development since, contrary to siRNA, disruption of               When the AMPK and p53 pathways are independently
MELK using the CRISP-Cas9 approach had no appreci-              inhibited, activation of REDD1 by CRO15 is still con-
able impacts on tumor cell growth43,44. This apparent           served at a lower level. The fact that REDD1 can be
discrepancy could be explained by a conditional depen-          independently activated by these two pathways is an
dency on MELK for the proliferation of cancer cells45 as it     advantage for CRO15 treatment. Indeed, many melanoma
is required for clonogenic cell growth like other onco-         cells and other cancer cells present p53 inactivation.
genes such as MYC or KRAS.                                      However, CRO15 can induce cell death even in p53-
  Our results showed that CRO15 directly decreases              mutated melanoma cells. Moreover, MELK is important
MELK kinase activity during in vitro kinase assay but also      in melanoma progression and therefore may be impli-
in intact melanoma cells, as indicated by the inhibition of     cated in resistance against current therapies. Indeed, we
NF-κB phosphorylation and some mitotic makers, such as          observed that MELK, as well as CDK1, is significantly
Cyclin E, CDK1 or CDK2. These results suggest that in           overexpressed in metastatic melanoma. We next con-
our system, inhibition of MELK induced a decrease in            firmed the efficiency of CRO15 in resistant melanoma
mitosis and cell proliferation after CRO15 stimulation          cells. Counterintuitively, the decrease in viability induced
mediated by NF-κB pathway inhibition. Interestingly, in         by CRO15 seems to be more dramatic in PLX4032-
contrast to the other MELK inhibitor OTS167, CRO15 is           resistant cells than in their parental counterpart, except
non-toxic in normal cells, such as fibroblasts, melanocytes      for the SK-MEL-28 cell line, mutated for p53. The same

Official journal of the Cell Death Differentiation Association
You can also read