Disruption of spatiotemporal clustering in dengue cases by wMel Wolbachia in Yogyakarta, Indonesia

Page created by Dean Schroeder
 
CONTINUE READING
Disruption of spatiotemporal clustering in dengue cases by wMel Wolbachia in Yogyakarta, Indonesia
www.nature.com/scientificreports

                OPEN             Disruption of spatiotemporal
                                 clustering in dengue cases by wMel
                                 Wolbachia in Yogyakarta, Indonesia
                                 Suzanne M. Dufault1*, Stephanie K. Tanamas2, Citra Indriani3, Adi Utarini3,
                                 Riris Andono Ahmad3, Nicholas P. Jewell1,4, Cameron P. Simmons2 & Katherine L. Anders2

                                 Dengue exhibits focal clustering in households and neighborhoods, driven by local mosquito
                                 population dynamics, human population immunity, and fine scale human and mosquito movement.
                                 We tested the hypothesis that spatiotemporal clustering of homotypic dengue cases is disrupted
                                 by introduction of the arbovirus-blocking bacterium Wolbachia (wMel-strain) into the Aedes aegypti
                                 mosquito population. We analysed 318 serotyped and geolocated dengue cases (and 5921 test-
                                 negative controls) from a randomized controlled trial in Yogyakarta, Indonesia of wMel deployments.
                                 We find evidence of spatial clustering up to 300 m among the 265 dengue cases (3083 controls) in
                                 the untreated trial arm. Participant pairs enrolled within 30 days and 50 m had a 4.7-fold increase
                                 (compared to 95% CI on permutation-based null distribution: 0.1, 1.2) in the odds of being homotypic
                                 (i.e. potentially transmission-related) as compared to pairs occurring at any distance. In contrast, we
                                 find no evidence of spatiotemporal clustering among the 53 dengue cases (2838 controls) resident
                                 in the wMel-treated arm. Introgression of wMel Wolbachia into Aedes aegypti mosquito populations
                                 interrupts focal dengue virus transmission leading to reduced case incidence; the true intervention
                                 effect may be greater than the 77% efficacy measured in the primary analysis of the Yogyakarta trial.

                                 Dengue places seasonal pressure on healthcare systems and public health resources throughout the tropical and
                                 subtropical world, with an estimated 100 million cases globally each year. The disease burden is growing in both
                                 case load and countries ­affected1. The four serotypes of dengue virus (DENV) are transmitted between humans
                                 primarily by the Aedes aegypti mosquito, a species that thrives in urban settings where breeding sites and human
                                 blood sources co-exist in close proximity. These bionomic factors make households a primary location for DENV
                                 transmission risk and the focal nature of DENV transmission has been well ­observed2–6.
                                     The temporal and spatial scale at which dengue case clustering occurs is informative about both the underly-
                                 ing transmission dynamics and the opportunity to intervene and interrupt transmission. A prospective index-
                                                        ­ ailand2 demonstrated highly focal DENV transmission among children residing within
                                 cluster study in rural Th
                                 100 m and 15 days of an index case. A retrospective analysis of serotyped dengue cases in ­Bangkok5 showed
                                 spatial dependence in both homotypic (same serotype) and heterotypic (different serotype) dengue cases at
                                 different time scales, reflecting complex interactions between local population immune profiles and dengue
                                 transmission. Local mosquito population dynamics, and human population density, immunity and m       ­ obility7–9 are
                                 understood to be key determinants of these patterns. Peridomestic space spraying of insecticide is a mainstay of
                                 dengue control efforts in endemic settings, and the observed focal clustering of dengue cases provides a rationale
                                 for the common approach of targeted reactive insecticide spraying around the immediate neighbourhood of
                                 one or more notified dengue cases. The temporal scale of focal dengue transmission is important here, however,
                                 with some studies finding serological evidence for clustering of recent DENV infections but no excess of acute,
                                 prospectively-detected DENV ­infections10, suggesting limited opportunity for reactive efforts to interrupt chains
                                 of transmission after detection of an index case. A lack of evidence for the efficacy and optimal implementation
                                 of conventional approaches to Aedes c­ ontrol11,12 together with the challenge of sustaining these activities at scale
                                 and over the long ­term13, helps explain the ongoing occurrence of dengue outbreaks worldwide in spite of the
                                 efforts of vector control programs.

                                 1
                                  Division of Biostatistics, School of Public Health, University of California, Berkeley, Berkeley, USA. 2World
                                 Mosquito Program, Institute of Vector‑borne Disease, Monash University, Clayton 3800, Australia. 3World Mosquito
                                 Program Yogyakarta, Centre for Tropical Medicine, Faculty of Medicine, Public Health and Nursing, Universitas
                                 Gadjah Mada, Yogyakarta 55281, Indonesia. 4London School of Hygiene and Tropical Medicine, Bloomsbury,
                                 London WC1E 7HT, UK. *email: sdufault@berkeley.edu

Scientific Reports |   (2022) 12:9890                | https://doi.org/10.1038/s41598-022-13749-2                                                    1

                                                                                                                                                Vol.:(0123456789)
www.nature.com/scientificreports/

                                               An alternative approach to the control of Aedes-borne diseases uses Wolbachia, a naturally occurring bac-
                                           terium that is common in insect species but absent from Ae. aegypti. Wolbachia (wMel-strain) infection of Ae.
                                           aegypti has been shown in the laboratory to reduce their transmission potential for dengue, chikungunya, Zika
                                           and Yellow fever v­ iruses14–18 and releases of wMel-Ae. aegypti have resulted in successful introgression of wMel
                                           into Ae. aegypti populations in the fi­ eld19. Accumulating field evidence from randomized and non-randomized
                                           wMel deployments demonstrates a significant reduction in the incidence of dengue and other Aedes-borne
                                           diseases in communities where wMel has been established at a high ­level19–23. In a recent randomized controlled
                                           trial in Yogyakarta, Indonesia, (the ‘Applying Wolbachia to Eliminate Dengue’ [AWED] trial), the incidence of
                                           virologically-confirmed dengue cases was 77% lower in neighbourhoods where wMel was successfully intro-
                                           gressed into local Ae. aegypti compared to areas that did not receive wMel ­deployments23. The cluster randomized
                                           design of the AWED trial, with wMel deployment into 12 of 24 contiguous clusters (average area 1 km 2 ) in a
                                           highly urban study setting, means that movement of both humans and mosquitoes between treated and untreated
                                           clusters may have biased the measurement of the wMel intervention effect toward the ­null24,25. In a per-protocol
                                           analysis of the AWED trial accounting for participants time spent in the cluster of residence and other visited
                                           clusters, and the measured wMel prevalence in those clusters, protective efficacy increased with incremental
                                           increases in estimated wMel exposure, but never exceeded the intention-to-treat efficacy based on the treatment
                                           assignment of the cluster of r­ esidence23. This supports the home as a primary site of DENV exposure but the per-
                                           protocol analysis, as designed a priori, could not provide further insights into the transmission dynamics of the
                                           detected dengue cases, and specifically the extent to which dengue cases detected in residents of wMel-treated
                                           clusters represented local transmission versus DENV infections acquired in untreated areas of Yogyakarta city.
                                               Here we use spatiotemporal clustering analyses to explore the transmission-relatedness of dengue cases
                                           detected in wMel-treated and untreated areas of Yogyakarta city, and the extent to which human movement
                                           between treated and untreated clusters may have biased the measurement of the wMel intervention e­ ffect25. We
                                           use the geolocated residences of virologically-confirmed dengue cases and test-negative controls enrolled in the
                                           AWED trial to test the hypotheses that dengue cases in Yogyakarta cluster in space and time in the absence of
                                           wMel, and that this clustering is disrupted in wMel-treated areas.

                                           Results
                                           Spatial and temporal distribution of dengue cases and test‑negative controls. We examined
                                           the spatial and temporal distribution of 385 virologically-confirmed dengue cases and 5921 participants with
                                           dengue test-negative febrile illness (test-negative controls) enrolled in the AWED cluster randomized trial of
                                           wMel in Yogyakarta, Indonesia. Among the enrolled participants, those with test-negative illness were distrib-
                                           uted throughout the entire 27-month study period in both intervention and untreated arms, with a peak in the
                                           first quarter of 2019 (Fig. 1A). The majority of dengue cases in both study arms were enrolled during the wet
                                           season (January–May) in 2019 and 2020 (Fig. 1B), with very few cases detected in the first year of trial enrolment
                                           in either study arm. As previously r­ eported23, amongst the 385 dengue cases, only 67 (17%) were resident in one
                                           of the 12 wMel-treated clusters and the remaining 318 (83%) were resident in untreated clusters (Fig. 2A). All
                                           four dengue virus (DENV) serotypes were detected, with a predominance of DENV2 (40%) and DENV4 (23%)
                                           (Supplementary Table 1 and Fig. 2A). Fourteen dengue cases in the intervention clusters and 53 in the untreated
                                           clusters had indeterminable DENV serotypes and were therefore excluded from the spatiotemporal analysis, as
                                           the measure used to infer transmission-relatedness relies on the identification of homotypic dengue case pairs.
                                               Among the 5921 participants with test-negative illness, 2838 (48%) were resident in wMel-treated clusters
                                           and 3083 (52%) in untreated clusters. The map in Fig. 2B incorporates the test-negative controls to account for
                                           the spatial distribution of the underlying healthcare-seeking population that gives rise to the enrolled dengue
                                           cases. Each cluster is shaded according to the cumulative test-positive fraction, i.e., the proportion of enrolled
                                           individuals who tested positive for virologically confirmed dengue in each cluster over the 27 months of enrol-
                                           ment. The cluster-specific test-positive fractions ranged from 5.9% to 23.8% in the 12 untreated clusters, whereas
                                           the test-positive fraction was ≤ 3.7% in 11 of the 12 intervention clusters. The one exception is intervention
                                           cluster 10, on the north east boundary of the study site, which had among the lowest overall enrolment rate of
                                           all clusters, with 87 test-negative controls and eight dengue cases enrolled (8.4% test-positive fraction). Six of
                                           eight dengue cases resided within 50 m of the external boundary.
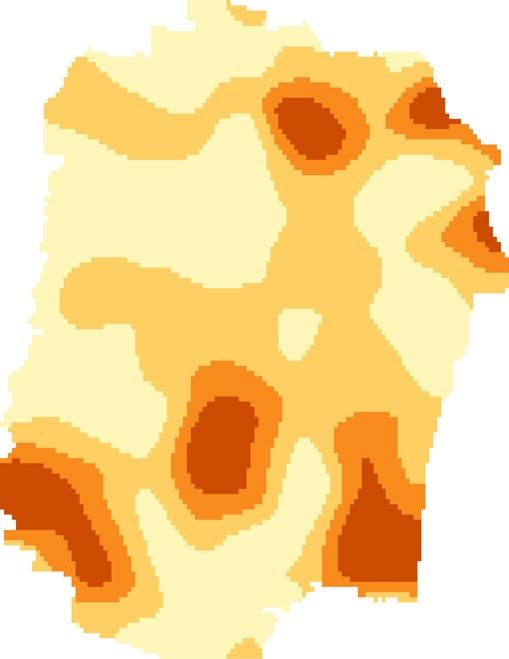
                                               For a more granular view of the spatial distribution of dengue cases and test-negative controls, kernel smooth-
                                           ing was used to visualize the spatially-varying test-positive fraction (Fig. 2C). Consistent with the cluster-level
                                           representation, the highest proportions of dengue case occurrence (aggregate over the 27-month trial period)
                                           fall within untreated clusters, and these areas of heightened dengue enrolment extend across the boundaries
                                           between untreated clusters.

                                           Impact of wMel on spatial dependence. Understanding the dynamics of DENV transmission in the
                                           absence and presence of wMel is of primary interest, but directly inferring chains of transmission is difficult. We
                                           instead assume that pairs of homotypic (same serotype) dengue cases enrolled in the AWED study with illness
                                           onset within 30 days of each other are potentially transmission-related, whereas pairs of heterotypic (different
                                           serotype) dengue cases or test-negative controls within the same space-time window are assumed not to be
                                           transmission-related. We compare the spatial distributions of these two populations of participant pairs as an
                                           indicator of spatiotemporal dependence in DENV transmission.
                                               To assess small-scale spatiotemporal clustering in dengue cases throughout the trial area, we employ a global
                                           measure of spatiotemporal clustering, τ27. This measure captures the overall tendency of homotypic dengue cases
                                           to occur within specified space-time windows above and beyond that observed in the enrolled study population
                                           due to secular factors such as healthcare-seeking behaviour and environmental conditions (“Methods”). The

          Scientific Reports |   (2022) 12:9890 |               https://doi.org/10.1038/s41598-022-13749-2                                                  2

Vol:.(1234567890)
www.nature.com/scientificreports/

                                    A
                                                                                                                           Untreated         Intervention

                                 Test−negative counts (monthly)
                                                                  250
                                                                  200
                                                                  150
                                                                  100
                                                                   50
                                                                    0

                                                                        Ja

                                                                                M

                                                                                          M

                                                                                                    Ju

                                                                                                               Se

                                                                                                                         No

                                                                                                                                 Ja

                                                                                                                                         M

                                                                                                                                                    M

                                                                                                                                                              Ju

                                                                                                                                                                         Se

                                                                                                                                                                                No

                                                                                                                                                                                          Ja

                                                                                                                                                                                                    M
                                                                                    ar

                                                                                              ay

                                                                                                                                             ar

                                                                                                                                                       ay

                                                                                                                                                                                                      ar
                                                                           n

                                                                                                       l

                                                                                                                                    n

                                                                                                                                                                 l

                                                                                                                                                                                             n
                                                                                                                p

                                                                                                                                                                          p
                                                                                                                           v

                                                                                                                                                                                  v
                                                                                                         20

                                                                                                                                                                 20
                                                                          20

                                                                                                                                    20

                                                                                                                                                                                            20
                                                                                     20

                                                                                                                                                2

                                                                                                                                                                                                         2
                                                                                                                           20

                                                                                                                                                                                   20
                                                                                                                 20

                                                                                                                                                                           20
                                                                                               20

                                                                                                                                                        20
                                                                                                                                               01

                                                                                                                                                                                                         02
                                                                                                          18

                                                                                                                                                                    19
                                                                               18

                                                                                                                                        19

                                                                                                                                                                                                 20
                                                                                         18

                                                                                                                               18

                                                                                                                                                                                      19
                                                                                                                    18

                                                                                                                                                                              19
                                                                                                   18

                                                                                                                                                            19
                                                                                                                                                  9

                                                                                                                                                                                                           0
                                                                                                                         Month of illness onset

                                    B                                                     Serotype            DENV1        DENV2         DENV3              DENV4        Unknown

                                                                                                                               Intervention
                                                                   50
                                                                   40
                                                                   30
                                 VCD counts (monthly)

                                                                   20
                                                                   10
                                                                    0
                                                                                                                               Untreated
                                                                   50
                                                                   40
                                                                   30
                                                                   20
                                                                   10
                                                                    0

                                                                                                                                                                               No

                                                                                                                                                                                        Ja

                                                                                                                                                                                                 M
                                                                         Ja

                                                                                    M

                                                                                              M

                                                                                                       Ju

                                                                                                               Se

                                                                                                                         No

                                                                                                                                 Ja

                                                                                                                                         M

                                                                                                                                                    M

                                                                                                                                                             Ju

                                                                                                                                                                      Se
                                                                                                                                             ar

                                                                                                                                                       ay

                                                                                                                                                                                                    ar
                                                                                     ar

                                                                                               ay

                                                                                                                                                                                           n
                                                                            n

                                                                                                          l

                                                                                                                                    n

                                                                                                                                                                l
                                                                                                                p

                                                                                                                                                                         p

                                                                                                                                                                                 v
                                                                                                                           v

                                                                                                                                                                 20
                                                                                                         20

                                                                                                                                                                                           20
                                                                               20

                                                                                                                                    20

                                                                                                                                              20

                                                                                                                                                                                                      20
                                                                                        20

                                                                                                                                                                                   20
                                                                                                                           20
                                                                                                                    20

                                                                                                                                                                          20
                                                                                                                                                        20
                                                                                                  20

                                                                                                                                                                    19
                                                                                                           18

                                                                                                                                                                                               20
                                                                                18

                                                                                                                                        19

                                                                                                                                                  19

                                                                                                                                                                                                         20
                                                                                          18

                                                                                                                                                                                     19
                                                                                                                               18
                                                                                                                      18

                                                                                                                                                                              19
                                                                                                                                                            19
                                                                                                    18

                                                                                                                         Month of illness onset

                                  Figure 1.  Time series plot for illness onset among (A) test-negative controls and (B) virologically-confirmed
                                  dengue cases included in the primary analysis of the AWED trial in Yogyakarta, Indonesia from January 2018
                                  until March 2020, by intervention arm. No dengue cases were enrolled in September 2018 and, in accordance
                                  with the trial ­protocol26, the test-negatives enrolled during that month were excluded from the analysis dataset.

                                  numerator of this ratio-based estimator identifies, among those enrolled within a particular space-time window,
                                  the number of serotype-homotypic dengue pairs relative to the number of pairs of enrolled individuals who are
                                  assumed not to be transmission-related; the latter group includes the test-negative controls as well as any het-
                                  erotypic dengue pairs. As such, the numerator of the τ -statistic is akin to an estimate of the odds of observing a
                                  homotypic dengue pair among all enrolled pairs in a given space-time window. The denominator of the τ-statistic
                                  is constructed the same way, but without restriction on the spatial window. Therefore, τ > 1 indicates that two
                                  enrolees are more likely to be homotypic dengue cases if they fall within the specified space-time window than
                                  if they fall anywhere across the study area. While we will refer to the τ -statistic as an odds ratio, there are subtle
                                  differences in this estimator that do not make it equivalent to the standard epidemiological odds ratio parameter.
                                      The estimator is first applied to the overall study area, naive to local wMel intervention status, with a time
                                  window of 30 days. Given that the intervention and untreated clusters are interspersed across the city, this serves
                                  as a global test to identify whether there is any evidence of spatial dependency in dengue cases overall before
                                  disaggregating by intervention arm. We find evidence of spatial dependence among homotypic cases occurring
                                  within 30 days at distances up to 300 m, with the greatest relative odds of homotypic cases occurring within
                                  50 m of an index case (Fig. 3). The odds that an individual enrolled within 30 days and 50 m of an index case is a
                                  homotypic dengue case is 10.5-fold (95% CI 5.6, 17.5) higher than for any individual with illness onset occurring
                                  within 30 days across the entire study area.
                                      We then employ the τ -statistic to compare whether this spatiotemporal clustering in dengue cases differs
                                  between the untreated and wMel-treated intervention arms by considering each of the 24 randomized clusters as
                                  independent units and estimating the small-scale spatiotemporal dependence of homotypic dengue cases within
                                  each cluster. Figure 4 shows the cluster-level estimates of the τ -statistic, together with the arm-level estimates of
                                  spatial dependence (calculated via a modified geometric mean: “Methods”). Statistical significance is inferred
                                  by comparison of the point estimate with the 95% CI on the permutation-based null distribution (bars) from
                                  1000 permutations of the data. The cluster-specific results highlight the sparsity of homotypic case pairs in the
                                  intervention arm. Six of the twelve clusters randomized to the intervention arm (clusters 2, 9, 16, 19, 21, 24)
                                  and only one of the twelve untreated clusters (cluster 17) had no dengue case pairs enrolled within 30 days of

Scientific Reports |   (2022) 12:9890 |                                                 https://doi.org/10.1038/s41598-022-13749-2                                                                                  3

                                                                                                                                                                                                               Vol.:(0123456789)
www.nature.com/scientificreports/

                     A                                                                         B                                                                                                  C
                     0.0   0.5   1.0 km                                                        0.0   0.5   1.0 km                                                                                 0.0   0.5    1.0 km

                                                                                                                                    01                                                                                                 Intervention
                                                                                                                                                          02                                                                                                    Intervention

                                                                                                                     03                   04                        05                                               Untreated               Untreated                    Untreated

                                                                                                                                                                    09                                                                                                    Intervention
                                                                                                                     06                                                                                             Intervention
                                                                                                                                    07          08                                                                                    Intervention    Untreated
                                                                                                                                                                              10                                                                                                         Intervention

                                                                                                                 11                                                                                                Untreated

                                                                                                                                                               15                                                                                                      Untreated

                                                                                                                                                                         16                                                                                                        Intervention
                                                                                                                                    13           14                                                                                   Untreated         Intervention
                                                                                                                12                                                                                              Intervention

                                                                                                                                                                    17                                                                                                    Untreated

                                                                                                           18                  19
                                                                                                                                                                                                              Untreated
                                                                                                                                                                                                                               Intervention Untreated
                                                                                                                                         20
                                                                                                                                                     21                                                                                                  Intervention
                                                                                                                                                                    22                                                                                                    Untreated
                                                                         Intervention
                                                                             Intervention
                                                                                                                          23                                                                                              Untreated
                                                                             Untreated                                                   24                                                                                               Intervention

                                                                            DENV1                                                                                        Test−positive fraction                                                                                       Test−positive fraction
                                                                            DENV2                                                                                             0.00 to 0.05                                                                                                   0.00 to 0.05
                                                                            DENV3                                                                                             0.05 to 0.10                                                                                                   0.05 to 0.10
                                                                            DENV4                                                                                             0.10 to 0.15                                                                                                   0.10 to 0.15
                                                                            Unknown                                                                                           0.15 to 0.20                                                                                                   0.15 to 0.20

                                                    Figure 2.  Spatial distribution of (A) enrolled dengue cases by serotype across Yogyakarta City, (B) the
                                                    cluster-aggregate test-positive fraction, i.e., the proportion of enrolled dengue cases among the total number of
                                                    individuals enrolled in each cluster, and (C) kernel smoothing estimates of the spatially-varying test-positive
                                                    fraction. Each map includes participants enrolled from January 2018 through March 2020. The borders in each
                                                    map represent the cluster boundaries for the AWED trial. Clusters are labelled with their numerical code in
                                                    panel B and their intervention status in panel C. Points represent the geolocated households of virologically
                                                    confirmed dengue cases. Areas with darker shading in panels B and C have a higher proportion of dengue cases
                                                    among enrolled AWED participants than areas with lighter shading. Smoothing bandwidth was selected by
                                                    cross-validation.

                                                       A
                                                                    15
                                                    θ^(d1,d2)
                                                      θ^(0,∞)

                                                                    10
                                                       τoverall =

                                                                     5

                                                                     0
                                                                                        100          200                   300                 400            500     600                         700                 800                     900                      1000
                                                                                                                                                          Distance (m), d2

                                                       B
                                                                    15
                                                    θ^(d1,d2)
                                                      θ^(0,∞)

                                                                    10
                                                       τoverall =

                                                                     5

                                                                     0
                                                                                        100          200                   300                 400            500     600                         700                 800                     900                      1000
                                                                                                                                                          Distance (m), d2

                                                    Figure 3.  Estimated odds ratio, τ , comparing the odds of a homotypic dengue case pair within (d1 , d2 ) versus
                                                    the odds of a homotypic dengue case pair at any distance across the entire study area among participant pairs
                                                    with illness onset occurring within 30 days. Variability in estimation is visualized in two distinct ways. (A)
                                                    displays the pointwise 95% confidence interval (CI) based on 1000 bootstrap resamples of the data and (B)
                                                    shows the pointwise 95% CI on the permutation-based null rejection region based on 1000 permutations of the
                                                    data.

          Scientific Reports |            (2022) 12:9890 |                                  https://doi.org/10.1038/s41598-022-13749-2                                                                                                                                                                         4

Vol:.(1234567890)
www.nature.com/scientificreports/

                                                 Intervention Arm
                                                       0 to 50m                      50 to 100m                     100 to 200m                 200 to 300m
                                           24                               24                            24                           24
                                           21                               21                            21                           21
                                           19                               19                            19                           19
                                           16                               16                            16                           16
                                           14                               14                            14                           14

                                 Cluster
                                           12                               12                            12                           12
                                           10                               10                            10                           10
                                            9                                9                             9                            9
                                            7                                7                             7                            7
                                            6                                6                             6                            6
                                            2                                2                             2                            2
                                            1                                1                             1                            1
                                                 0     10         20             0   10       20               0     10      20             0    10      20

                                       Overall
                                                 0     10         20             0   10       20            0        10      20             0    10      20
                                                                                                   Odds ratio (τ)

                                                 Untreated Arm
                                                       0 to 50m                      50 to 100m                     100 to 200m                 200 to 300m
                                           23                               23                            23                           23
                                           22                               22                            22                           22
                                           20                               20                            20                           20
                                           18                               18                            18                           18
                                           17                               17                            17                           17
                                 Cluster

                                           15                               15                            15                           15
                                           13                               13                            13                           13
                                           11                               11                            11                           11
                                            8                                8                             8                            8
                                            5                                5                             5                            5
                                            4                                4                             4                            4
                                            3                                3                             3                            3
                                                 0     5     10        15        0   5      10       15        0     5     10     15        0    5     10     15

                                       Overall
                                                 0     5     10        15        0   5      10      15      0        5     10     15        0    5     10     15
                                                                                                   Odds ratio (τ)

                                 Figure 4.  Cluster-specific and pooled arm-level estimates of the τ-statistic (points) and 95% CIs on the null
                                 distribution (error bar) generated from 1000 simulations where the geolocation of participants is randomly
                                 permuted within each cluster. Each panel displays the estimated spatial dependence for homotypic case pairs
                                 with illness onset occurring within 30 days and resident within a given distance interval (meters) from each
                                 other. Estimated spatial dependence that is inconsistent with the null hypothesis is present when the point
                                 estimate falls outside of the 95% CIs of the null distribution and, for improved visibility, is marked by the light
                                 blue points. The overall point estimate for each trial arm is found by taking the geometric mean of the cluster-
                                 level estimates and is then compared against the 95% CIs of the null distribution of the permuted geometric
                                 mean.

                                 each other and with the same infecting serotype (ie. potentially transmission-related). As such, the τ -statistic is
                                 inestimable within these clusters.
                                     Even when there is data to support estimation, the estimated pointwise 95% CIs of the permutation-based
                                 null distributions produce expansive limits. In all but one of the clusters where wMel-infected mosquitoes were
                                 deployed, the observed spatiotemporal dependence is consistent with the null hypothesis of no spatiotemporal
                                 dependence. Visually, this corresponds to the point-estimate from the observed data falling within the confidence
                                 bands on the permutation-based null distribution. The one inconsistent result in the intervention arm is the
                                 estimated spatiotemporal dependence in cluster 10 based on homotypic case pairs occurring within 30 days and
                                 100–200 m. It is worth noting that there were only two pairs of homotypic dengue cases (one pair with DENV1
                                 and one pair with DENV3) observed within 30 days of each other in cluster 10. In contrast, five of 11 untreated
                                 clusters returned point estimates of spatiotemporal dependence within 50 m of an index residence that appear
                                 inconsistent with the null hypothesis of no spatiotemporal dependence. For the untreated arm overall, spatiotem-
                                 poral dependence was estimated to exceed what would be expected under the null hypothesis up to a distance
                                 of 300 m, with the greatest relative odds of a homotypic case occurring for enrolled individuals with residences
                                 within 50 m of an index case (τ (0, 50) = 4.7; 95% CI of the null distribution: 0.1, 1.2).
                                     The disruption of spatiotemporal clustering of dengue cases by wMel is underscored in Fig. 5, which shows the
                                 geolocated residences of the 160 dengue cases that had illness onset within 30 days and residence within 300 m of
                                 another case with the same infecting serotype (ie. homotypic case pairs). In Fig. 5, unlike in the cluster-level τ-sta-
                                 tistic analysis, cluster boundaries have been ignored so that all homotypic case pairs within the given space-time
                                 window are displayed. The vast majority of these potentially transmission-related dengue cases fall within the
                                 untreated regions. As described previously, only two case pairs fall fully in an untreated cluster, namely cluster 10.

Scientific Reports |   (2022) 12:9890 |                      https://doi.org/10.1038/s41598-022-13749-2                                                                 5

                                                                                                                                                                   Vol.:(0123456789)
www.nature.com/scientificreports/

                                                                                                                                Intervention
                                                                                                                                    Intervention
                                                                        01                                                          Untreated
                                                                                             02
                                                                                                                                  DENV1
                                                          03                  04                   05                             DENV2
                                                                                                                                  DENV3
                                                                                                                                  DENV4
                                                                                                       09
                                                          06
                                                                        07         08
                                                                                                                  10

                                                         11
                                                                                                  15
                                                                                                            16
                                                     12                 13          14

                                                                                                       17

                                                    18             19        20
                                                                                        21
                                                                                                       22

                                                              23
                                                                             24

                                                                                                   0.0      0.5        1.0 km

                                           Figure 5.  Residential locations of the 160 enrolled serotyped dengue cases involved in homotypic pairs with
                                           residences within 300 m and illness onset within 30 days, including pairs that cross cluster boundaries.

                                           Sensitivity analysis. The test-negative controls were enrolled after presenting with acute febrile illness and,
                                           as such, may exhibit their own spatial structure beyond that of the underlying healthcare-seeking population.
                                           As a sensitivity analysis, we performed the overall τ-statistic estimation excluding the test-negative controls,
                                           instead relying on the ratio of homotypic to heterotypic dengue case pairs occurring within space-time windows
                                           to estimate spatial dependence. There was no meaningful difference observed when test-negatives were included
                                           or excluded from estimation (Fig. S1).
                                               We additionally performed sensitivity analyses to account for potential contamination effects for residences
                                           near cluster boundaries and to examine the effects of applying differing temporal clustering windows. The results
                                           are presented in Fig. 6 where each panel displays the modified geometric mean and permutation-based 95% CIs of
                                           the null distribution of the geometric mean. The “Full data” panels display the same information as the “Overall”
                                           rows of Fig. 4 and are included for ease of comparison with the sensitivity results. When individuals residing
                                           within 50 m of any cluster boundary are excluded from the analysis, the magnitude of the estimated τ-statistic in
                                           the untreated arm decreases, but remains larger than expected under the null hypothesis of no spatial dependence
                                           up to a distance of 300 m, as observed in the primary analysis. When the window of time between illness onset
                                           of case pairs was decreased from 30 to 7 days, there is evidence of spatial clustering of homotypic dengue cases
                                           up to 50 m, and potentially from 100–200 m, in the untreated arm. Finally, when an temporal interval of 2 weeks
                                           between illness onset of case pairs is used (the most likely serial interval between successive dengue i­ llnesses4),
                                           there is evidence of spatial dependence up to 200 m in the untreated arm. There remains no evidence of small-
                                           scale spatiotemporal clustering of dengue cases in the intervention arm under any of these sensitivity settings.

                                           Discussion
                                           We show here that successful introgression of wMel into the local Ae. aegypti mosquito population disrupts
                                           the focal transmission of dengue virus. The intention-to-treat analysis of a cluster randomised controlled trial
                                           of wMel deployments in Yogyakarta, Indonesia previously reported a 77% reduction in dengue incidence in
                                           wMel-treated ­areas23. However, the inability to account fully in the primary analysis for human and mosquito
                                           movement between treated and untreated clusters may have biased the efficacy estimate towards the null, making
                                           the reported protective efficacy of Wolbachia an ­underestimate25. The findings reported here from a secondary
                                           analysis of the trial data demonstrate an absence of spatiotemporal clustering among the 53 serotyped dengue
                                           cases detected in wMel-treated areas. These results are consistent with the hypothesis of an even larger wMel
                                           intervention effect than measured in the primary analysis of the AWED trial, and raise expectations that area-
                                           wide coverage of Yogyakarta with wMel could result in near elimination of local DENV transmission.
                                               In six of the twelve clusters where wMel deployments occurred, no homotypic dengue case pairs occurred
                                           in any 30-day window throughout the 27 months following wMel releases. Among the remaining six wMel-
                                           treated clusters where the spatial dependence of homotypic dengue case pairs was estimable, only one cluster
                                           on the northeast border of the trial site had any homotypic dengue case pairs that could plausibly have been
                                           transmission-related. In contrast, in untreated areas we found evidence of clustering in dengue incidence within
                                           space-time windows of 30 days and 300 m, with increasing spatiotemporal dependence within decreasing inter-
                                           vals of space (up to 50 m) and time (up to 7 days). The lack of spatiotemporal clustering among the dengue

          Scientific Reports |   (2022) 12:9890 |                            https://doi.org/10.1038/s41598-022-13749-2                                       6

Vol:.(1234567890)
www.nature.com/scientificreports/

                                                      Intervention Arm
                                                             Full data               Excluding 50m border        Within 1 week   Within 2 weeks
                                                  5

                                                  4

                                 Odds ratio (τ)
                                                  3

                                                  2

                                                  1

                                                  0
                                                      0 200 400 600 800 1000 0 200 400 600 800 1000 0 200 400 600 800 1000 0 200 400 600 800 1000

                                                      Untreated Arm
                                                             Full data               Excluding 50m border        Within 1 week   Within 2 weeks
                                                  5

                                                  4
                                 Odds ratio (τ)

                                                  3

                                                  2

                                                  1

                                                  0
                                                      0 200 400 600 800 1000 0 200 400 600 800 1000 0 200 400 600 800 1000 0 200 400 600 800 1000
                                                                                            Distance (m), d2

                                 Figure 6.  Sensitivity analyses and comparison with the primary analysis. Modified geometric mean odds ratio,
                                 τ , comparing the odds of a homotypic dengue case pair within the distance interval (d1 , d2 ) versus the odds of
                                 a homotypic dengue case pair at any distance across the entire study area for (1) the full dataset, (2) the dataset
                                 excluding those within 50 m of a cluster border, (3) participant pairs with illness onset occurring within 1 week
                                 of each other, and (4) participant pairs with illness onset occurring within 2 weeks of each other. The error bars
                                 denote the 95% CI on the null distribution generated by 1000 permutations of the data.

                                 cases resident in wMel-treated areas of Yogyakarta does not preclude the possibility that infection occurred in
                                 the cluster of residence, and that other transmission-related infections went undetected or were asymptomatic.
                                 However, since the sensitivity of dengue case detection can be expected to be equivalent, on average, between
                                 treated and untreated arms of the AWED trial, these findings strongly suggest that the dengue cases in the inter-
                                 vention clusters may have acquired their infection outside of their cluster of residence. Information collected
                                 in the AWED trial on the travel history of participants during the 10 days prior to illness onset, together with
                                 planned genomic analysis of DENV detected in trial participants, will support a more direct assessment of the
                                 potential transmission-relatedness between dengue cases detected in intervention clusters and those resident
                                 elsewhere in the trial area.
                                     The distortion by wMel of spatial patterns in dengue case occurrence is evident in the visualizations of the
                                 dengue case time series aggregate over 27 months, even before considering the two key components in poten-
                                 tial transmission-relatedness: serotype and case onset date. At an aggregate area level, despite being completely
                                 intermixed with the untreated clusters, the cluster-specific test-positive fraction estimates for wMel-treated
                                 clusters are all considerably lower than the test-positive fractions in the untreated clusters, with the exception of
                                 intervention cluster 10. The results of the kernel estimator, which does not differentiate between serotype or take
                                 artificial study boundaries into consideration, suggest that the areas where dengue test-positive febrile illness is
                                 highest are located in untreated clusters and tend to extend across borders with other untreated areas rather than
                                 borders with intervention clusters. When serotype and case onset date are accounted for via the spatial-temporal
                                 clustering τ -statistic, this observation is strengthened further.
                                     The fine scale spatial clustering of dengue cases in untreated areas of Yogyakarta closely mirrors findings
                                 reported by others from ­Vietnam6, ­Thailand4–6, ­Australia3, ­Peru9, and ­Taiwan28 despite differences in analysis
                                 methods, ecological setting and human population characteristics. We observed strongest clustering of dengue
                                 cases within 50 m and 7 days, declining with increasing spatial and temporal distance, which is supportive of focal
                                 DENV transmission within households and the immediate neighbourhood in the absence of Wolbachia. Similar
                                 focal clustering has been reported from Thailand, where the authors found strongest evidence of clustering at a
                                 15–17 day interval and distances less than 200 ­m4. These spatiotemporal patterns provide the rationale for the
                                 common approach of applying conventional vector control interventions, primarily insecticide spraying, in a
                                 reactive manner around the households of notified cases that cluster in space and time. In Yogyakarta, notifica-
                                 tion of hospitalised dengue cases to the District Health Office with evidence of local transmission (i.e. additional
                                 confirmed or suspected dengue cases within 2 weeks and 100 m) will usually trigger perifocal insecticide fog-
                                 ging, with malathion most commonly used in recent years, and application of a larvicide such as pyriproxyfen
                                 to water containers. Insecticide resistance and insecticide penetration to indoor resting places is a challenge, and
                                 the limited ability of these approaches to meaningfully impact dengue virus transmission is evidenced by the

Scientific Reports |   (2022) 12:9890 |                                  https://doi.org/10.1038/s41598-022-13749-2                                      7

                                                                                                                                                    Vol.:(0123456789)
www.nature.com/scientificreports/

                                           high baseline dengue burden and paediatric seroprevalence in ­Yogyakarta29, and recurring dengue outbreaks in
                                           other locations where large efforts are expended on Aedes vector c­ ontrol30.
                                               One of the strengths of the wMel method for dengue control is its efficacy against the four DENV ­serotypes23.
                                           However, this results in very little case data for the estimation of spatiotemporal clustering. Only 67 virologically
                                           confirmed dengue cases were enrolled in the intervention clusters throughout the 27-month AWED study, of
                                           which, only 53 had identifiable DENV serotypes. When examining the spatiotemporal dynamics of transmission,
                                           the lack of potentially transmission-related dengue is itself a critical finding, despite being difficult to represent
                                           statistically. The completion of wMel deployments throughout the AWED untreated clusters in January 2021
                                           is expected to result in an even greater impact on dengue in Yogyakarta in coming years, and even raises the
                                           prospect of local elimination. Monitoring progress towards dengue elimination in Yogyakarta will require the
                                           development of an appropriate surveillance framework and statistical methods for demonstrating absence of
                                           disease, which differ from those used when disease is p    ­ resent31.
                                               A considerable hurdle in spatiotemporal analyses is the identification and geolocation of the underlying
                                           population at risk. Cross-sectional surveys are of limited utility for examining spatiotemporal patterns in the
                                           occurrence of self-limiting acute infections like dengue, as virological markers of acute infection are short-lived
                                           and detection of antibody is not informative about the timing of infection. Prospective cohort studies with
                                           clinical or serological endpoints are expensive, time-consuming and logistically complicated to carry out, and
                                           their sensitivity for detection of case clustering may be limited unless very large. As such, many studies rely on
                                           passively collected case data and compare these counts against “total population” census estimates, introducing
                                           room for bias when the total population is not the true population at risk because it includes individuals with
                                           immunity as well as those whose healthcare-seeking behaviour may preclude their detection in facility-based
                                           data sources. The test-negative design provides a new framework for simultaneously sampling cases and controls
                                           from the underlying at-risk, healthcare-seeking population. Methodological research is in progress to further
                                           explore the benefits of this design for spatiotemporal analyses of infectious disease.
                                               Further research and development of the small-scale spatial dependence estimator τ is underway and will
                                           be helpful for future a­ pplications32. In this work, we have attempted to follow the recommended best practices
                                           when applying τ in a diagnostic ­manner33. In the context of the test-negative design specifically, τ also requires
                                           further methodological assessment. The authors of the method have pointed out that both the numerator and
                                           the denominator are dependent on the spatiotemporal distribution of cases, and importantly, c­ ontrols5,27. The
                                           controls in the AWED study may not be a random sample from the underlying spatial distribution of the popula-
                                           tion. If there are other processes driving spatial dependence in the test-negatives other than the spatial distribu-
                                           tion of the underlying population (e.g., transmission of other pathogens), then this would affect the calculation
                                           and interpretation of the τ -statistic. As such, the test-negatives more likely represent a random sample from the
                                           care-seeking population. The estimates of the τ -statistic should then be interpreted as the spatial dependence in
                                           homotypic dengue cases over and above any spatial patterns in the underlying health-care seeking population
                                           that gave rise to the dengue cases. However, as demonstrated in Fig. S1, the conclusions of spatial dependence
                                           do not change upon the exclusion of test-negatives from the estimation process.
                                               Dengue was a relatively rare outcome in the AWED study sample, present in only 6% of individuals in the
                                           analysis set. As such, using bootstrap resampling as the basis for statistical inference resulted in two complica-
                                           tions. First, previous work has demonstrated that blocked bootstrap resampling of spatial data is generally a more
                                           appropriate approach to inference of spatial estimators as it retains a level of spatial correlation among observed
                                           case locations that is lost when resampling ­individuals34. The performance of the blocked bootstrap has yet to
                                           be explored in the context of the τ -statistic for small-scale spatial dependence. Second, resampling with replace-
                                           ment at the individual-level when there are overwhelmingly more negative controls than cases results in some
                                           bootstrap resamples devoid of any cases. Given the manner in which cases and controls are ascertained in the
                                           test-negative design, resampling conditional on outcome is a problematic solution to this problem. Instead, we
                                           rely on permutation methods for assessing whether the observed spatiotemporal dependence is consistent with
                                           what would be expected under the hypothesis of no spatiotemporal dependence, which only requires a reshuffling
                                           rather than a resampling of the ­dataset27. Further methodological development in estimation and inference for
                                           the τ -statistic is needed in the rare-disease, test-negative design setting.
                                               The current work examines DENV transmission under a binary intervention status based on household resi-
                                           dence. This serves as only a proxy of an individual’s true intervention experience. The presence of wMel in the
                                           monitored mosquito populations was strikingly homogeneous within the intervention areas, but, by the second
                                           year of the trial, was also detected at the edges of the untreated cluster ­borders23. Additionally, human movement
                                           could affect an individual’s risk of infection and t­ ransmission9. AWED participants’ geolocated movements over
                                           the 10 days prior to illness onset were recorded at enrolment, providing a unique opportunity to gain further
                                           insight into the extent of human mobility and its role in transmission. Incorporating such fine-scale spatial and
                                           temporal data will allow for the investigation of DENV transmission beyond the proxies of geolocated residence
                                           and intervention assignment.
                                               This work provides the first report of spatiotemporal clustering of dengue in Yogyakarta in the absence of
                                           wMel, replicating others’ reports from multiple endemic settings. Importantly, it shows that in areas randomly
                                           allocated to wMel deployments, the sustained introgression of wMel into the local Ae. aegypti population suc-
                                           cessfully disrupts the focal transmission of dengue virus, consistent with a protective efficacy of Wolbachia that
                                           may be greater than previously reported.

          Scientific Reports |   (2022) 12:9890 |               https://doi.org/10.1038/s41598-022-13749-2                                                     8

Vol:.(1234567890)
www.nature.com/scientificreports/

                                 Methods
                                 Data source. Data was collected during the Applying Wolbachia to Eliminate Dengue (AWED) trial
                                 (NCT03055585)-a parallel, two-arm, cluster-randomized test-negative design study carried out in Yogyakarta,
                                 Indonesia from January 2018 to March 2020. The trial design and results have been described ­elsewhere23,26.
                                 Written informed consent for participation in the clinical component of the trial was obtained from all the par-
                                 ticipants or from a guardian if the participant was a minor. In addition, participants 13–17 years of age gave writ-
                                 ten informed assent. The trial was conducted in accordance with the International Council for Harmonisation
                                 guidelines for Good Clinical Practice and was approved by the human research ethics committees at Universitas
                                 Gadjah Mada and Monash U    ­ niversity26. Yogyakarta has a population of nearly 420,000 in an area 32.5 km 2 . Peak
                                 dengue incidence in the city has historically coincided with the pronounced rainy season occurring in the first
                                 6 months of the calendar ­year29. The AWED trial site was 26 km 2 in size with a population of approximately
                                 311,700, and was divided into 24 contiguous clusters, twelve of which were randomly assigned to receive wMel-
                                 infected Ae. aegypti releases. Where possible, geographic borders were used in order to slow mosquito dispersal
                                 between ­clusters23. Routine vector control activities continued throughout the study area. Individuals 3–45 years
                                 old presenting to government primary care clinics with acute febrile illness who were resident in the study area,
                                 had no localising symptoms suggestive of a non-dengue diagnosis, and had not been enrolled within the previ-
                                 ous 4 weeks were invited to enrol and their residence and places visited during 10 days prior to illness onset were
                                 geolocated. A positive result in either dengue PCR or NS1 antigen ELISA distinguished virologically-confirmed
                                 dengue cases from test-negative controls (negative in DENV PCR, NS1 ELISA and IgM/IgG ELISA) and a subset
                                 of participants excluded from analysis (negative in PCR and NS1 but positive in IgM/IgG, or with inconclusive
                                 diagnostic results). The infecting serotype was determined for PCR-positive dengue cases.

                                 Statistical methods. Global analysis of spatial dependence. To characterize the small-scale spatiotempo-
                                 ral dependence of homotypic dengue cases, we employ a global measure, the τ-statistic35. This measure captures
                                 the overall tendency of homotypic dengue cases to occur within specified space-time windows above and be-
                                 yond that observed in the enrolled study population due to secular factors (e.g., healthcare-seeking behaviour
                                 and environmental conditions). This method compares the odds that an enrolled pair of individuals within a
                                 given time and distance, θ(d1 , d2 ), are homotypic dengue cases against the odds that an enrolled pair of individu-
                                 als within a given time but at any distance, θ (0, ∞), are homotypic dengue cases (Eqs. (1), (2)). As such, a pair of
                                 enrolled individuals i and j are considered to be potentially transmission-related ( zij = 1) if they have the same
                                 infecting DENV serotype and have illness onset within a specified time window, and are otherwise assumed to
                                 be non-transmission related ( zij = 0). Specifically,
                                                                                             θ(d1 , d2 )
                                                                            τ (d1 , d2 ) =               ,   where                                   (1)
                                                                                             θ (0, ∞)
                                                                              
                                                                                i    j I1 (zij   = 1, d1 < dij < d2 )
                                                               θ (d1 , d2 ) =                                         ,   i �= j                   (2)
                                                                                i    j I1 (zij   = 0, d1 < dij < d2 )

                                 For Eq. (2), the sums range over all test-positive and test-negative trial participants for the overall estimate of
                                 the τ -statistic. For the cluster-specific estimates, the sums range over all cluster-specific test-positive and test-
                                 negative trial participants.
                                     Based on the observed spatial dependence in dengue cases reported previously in other settings, we examine
                                 the τ -statistic at 0–50 m and 50–100 m, and then 100 m intervals up to a maximum distance of 1000 m from
                                 an index case.
                                     Permutation-based null distributions from 1000 reshuffles of the location data provided the basis of hypothesis
                                 testing used to evaluate statistical significance of the estimated τ -statistic. For the overall estimates of τ ignoring
                                 intervention assignment, this includes all enrolled test-negative controls and test-positive cases with determinable
                                 DENV serotype. For the cluster-specific estimates of τ , the location data of the cluster-specific test-negatives and
                                 test-positives are permuted within each cluster. Bootstrapped confidence intervals, obtained by 1000 random
                                 resamples of the individual-level data, were obtained for the intervention-naive τ analysis. Bootstrapped confi-
                                 dence intervals for the cluster-specific estimates of τ are not provided, given the sparsity of specific serotype cases
                                 at the cluster-level. Arm-level estimates of the τ -statistic are based on a modified geometric mean procedure
                                 common in settings with high frequencies of zeroes; the value of one is added to each cluster-level estimate of τ
                                 before the estimation of the geometric mean and then subtracted from the exponentiated ­result36.

                                 Data availibility
                                 The data underlying Figs. 1, 2B, 3, 4 and 6 are accessible at the corresponding author’s GitHub repository (https://​
                                 github.​com/​sdufa​ult15/​awed-​spati​al-​tempo​ral). Participants’ residential address was collected and stored under
                                 the ethical approval of the AWED trial protocol. Because the geolocated residence is considered personally
                                 identifiable information, individuals seeking access to this data should contact Katherine Anders (katherine.
                                 anders@monash.edu) to discuss obtaining ethical approval or accessing a deidentified individual-level version
                                 of the dataset.

                                 Code availability
                                 All analyses were performed using R version 4.0.4 “Lost Library Book”. General data cleaning and manage-
                                 ment relied heavily on the “tidyverse”37, “here”38, “rgdal”39, and “geodist”40 packages. Map visualizations were
                                 constructed using “tmap”41. Kernel smoothing estimation was performed via “spatstat::relrisk”42. The code used

Scientific Reports |   (2022) 12:9890 |                https://doi.org/10.1038/s41598-022-13749-2                                                      9

                                                                                                                                                  Vol.:(0123456789)
www.nature.com/scientificreports/

                                           for this analysis is available at the GitHub repository (https://​github.​com/​sdufa​ult15/​awed-​spati​al-​tempo​ral)
                                           maintained by the first author.

                                           Received: 18 March 2022; Accepted: 27 May 2022

                                           References
                                             1. Bhatt, S. et al. The global distribution and burden of dengue. Nature. https://​doi.​org/​10.​1038/​natur​e12060 (2013).
                                             2. Mammen, M. P. et al. Spatial and temporal clustering of dengue virus transmission in Thai villages. PLoS Med. 5, 1605–1616.
                                                https://​doi.​org/​10.​1371/​journ​al.​pmed.​00502​05 (2008).
                                             3. Vazquez-Prokopec, G. M., Kitron, U., Montgomery, B., Horne, P. & Ritchie, S. A. Quantifying the spatial dimension of dengue
                                                virus epidemic spread within a tropical urban environment. PLoS Negl. Trop. Dis. 4, 1–14. https://​doi.​org/​10.​1371/​journ​al.​pntd.​
                                                00009​20 (2010).
                                             4. Aldstadt, J. et al. Space-time analysis of hospitalised dengue patients in rural Thailand reveals important temporal intervals in the
                                                pattern of dengue virus transmission. Trop. Med. Int. Health 17, 1076–1085. https://​doi.​org/​10.​1111/j.​1365-​3156.​2012.​03040.x
                                                (2012).
                                             5. Salje, H. et al. Revealing the microscale spatial signature of dengue transmission and immunity in an urban population. Proc. Natl.
                                                Acad. Sci. U.S.A. 109, 9535–9538. https://​doi.​org/​10.​1073/​pnas.​11206​21109 (2012).
                                             6. Hoang Quoc, C. et al. Synchrony of dengue incidence in Ho Chi Minh City and Bangkok. PLoS Negl. Trop. Dis. 10, 1–18. https://​
                                                doi.​org/​10.​1371/​journ​al.​pntd.​00051​88 (2016).
                                             7. Salje, H. et al. Dengue diversity across spatial and temporal scales: Local structure and the effect of host population size. Science
                                                1306, 1302–1306. https://​doi.​org/​10.​1126/​scien​ce.​aaj93​84 (2017).
                                             8. Salje, H. et al. Reconstructing unseen transmission events to infer dengue dynamics from viral sequences. Nat. Commun. 12, 1–10.
                                                https://​doi.​org/​10.​1038/​s41467-​021-​21888-9 (2021).
                                             9. Stoddard, S. T. et al. House-to-house human movement drives dengue virus transmission. Proc. Natl. Acad. Sci. U.S.A. 110, 994–999.
                                                https://​doi.​org/​10.​1073/​pnas.​12133​49110 (2013).
                                            10. Anders, K. L. et al. Households as foci for dengue transmission in highly urban Vietnam. PLoS Negl. Trop. Dis. 9, 1–14. https://​
                                                doi.​org/​10.​1371/​journ​al.​pntd.​00035​28 (2015).
                                            11. Bowman, L. R., Donegan, S. & McCall, P. J. Is dengue vector control deficient in effectiveness or evidence? Systematic review and
                                                meta-analysis. PLoS Negl. Trop. Dis. 10, 1–24. https://​doi.​org/​10.​1371/​journ​al.​pntd.​00045​51 (2016).
                                            12. Wilson, A. L. et al. Evidence-based vector control? Improving the quality of vector control trials. Trends Parasitol. 31, 380–390.
                                                https://​doi.​org/​10.​1016/j.​pt.​2015.​04.​015 (2015).
                                            13. Achee, N. L. et al. A critical assessment of vector control for dengue prevention. PLoS Negl. Trop. Dis. 9, 1–19. https://​doi.​org/​10.​
                                                1371/​journ​al.​pntd.​00036​55 (2015).
                                            14. Dutra, H. L. C. et al. Wolbachia blocks currently circulating zika virus isolates in Brazilian Aedes aegypti mosquitoes. Cell Host
                                                Microbe 19, 771–774. https://​doi.​org/​10.​1016/j.​chom.​2016.​04.​021 (2016).
                                            15. Moreira, L. A. et al. A Wolbachia symbiont in Aedes aegypti limits infection with dengue, chikungunya, and plasmodium. Cell 139,
                                                1268–1278. https://​doi.​org/​10.​1016/j.​cell.​2009.​11.​042 (2009).
                                            16. Pereira, T. N., Rocha, M. N., Sucupira, P. H. F., Carvalho, F. D. & Moreira, L. A. Wolbachia significantly impacts the vector com-
                                                petence of Aedes aegypti for Mayaro virus. Sci. Rep. 8, 1–9. https://​doi.​org/​10.​1038/​s41598-​018-​25236-8 (2018).
                                            17. van den Hurk, A. F. et al. Impact of Wolbachia on infection with chikungunya and yellow fever viruses in the mosquito vector
                                                Aedes aegypti. PLoS Negl. Trop. Dis. 6. https://​doi.​org/​10.​1371/​journ​al.​pntd.​00018​92 (2012).
                                            18. Walker, T. et al. The wMel Wolbachia strain blocks dengue and invades caged Aedes aegypti populations. Nature 476, 450–455.
                                                https://​doi.​org/​10.​1038/​natur​e10355 (2011).
                                            19. Ryan, P. A. et al. Establishment of wMel Wolbachia in Aedes aegypti mosquitoes and reduction of local dengue transmission in
                                                Cairns and surrounding locations in northern Queensland, Australia. Gates Open Res. 3. https://​doi.​org/​10.​12688/​gates​openr​es.​
                                                13061.1 (2019).
                                            20. Indriani, C. et al. Reduced dengue incidence following deployments of Wolbachia-infected Aedes aegypti in Yogyakarta, Indonesia:
                                                A quasi-experimental trial using controlled interrupted time series analysis. Gates Open Res. 4. https://​doi.​org/​10.​1101/​2020.​03.​
                                                15.​20036​566 (2020).
                                            21. O’Neill, S. L. et al. Scaled deployment of Wolbachia to protect the community from dengue and other Aedes transmitted arboviruses.
                                                Gates Open Res. 2, 1–29. https://​doi.​org/​10.​12688/​gates​openr​es.​12844.3 (2018).
                                            22. Pinto, S. B. et al. Effectiveness of Wolbachia-infected mosquito deployments in reducing the incidence of dengue and other Aedes-
                                                borne diseases in Niterói, Brazil: A quasi-experimental study. PLoS Negl. Trop. Dis. 15, e0009556 (2021).
                                            23. Utarini, A. et al. Efficacy of Wolbachia-infected mosquito deployments for the control of dengue. N. Engl. J. Med. 384, 2177–2186
                                                (2021).
                                            24. Reiner, R. C. et al. Quantifying the epidemiological impact of vector control on dengue. PLoS Negl. Trop. Dis. 10, 1–11. https://​
                                                doi.​org/​10.​1371/​journ​al.​pntd.​00045​88 (2016).
                                            25. Cavany, S. M. et al. Ignoring transmission dynamics leads to underestimation of the impact of a novel intervention against
                                                mosquito-borne disease. medRxiv (2021)
                                            26. Anders, K. L. et al. Update to the AWED (applying Wolbachia to eliminate dengue) trial study protocol: A cluster randomised
                                                controlled trial in Yogyakarta, Indonesia. Trials 21, 1–5. https://​doi.​org/​10.​1186/​s13063-​020-​04367-2 (2020).
                                            27. Lessler, J., Salje, H., Grabowski, M. K. & Cummings, D. A. Measuring spatial dependence for infectious disease epidemiology.
                                                PLoS One 11, 1–13. https://​doi.​org/​10.​1371/​journ​al.​pone.​01552​49 (2016).
                                            28. Kan, C. C. et al. Two clustering diffusion patterns identified from the 2001–2003 dengue epidemic, Kaohsiung, Taiwan. Am. J.
                                                Trop. Med. Hyg. 79, 344–352. https://​doi.​org/​10.​4269/​ajtmh.​2008.​79.​344 (2008).
                                            29. Indriani, C. et al. Baseline characterization of dengue epidemiology in Yogyakarta City, Indonesia, before a randomized controlled
                                                trial of Wolbachia for arboviral disease control. Am. J. Trop. Med. Hyg. 99, 1299–1307. https://​doi.​org/​10.​4269/​ajtmh.​18-​0315
                                                (2018).
                                            30. Hapuarachchi, H. C. et al. Epidemic resurgence of dengue fever in Singapore in 2013–2014: A virological and entomological
                                                perspective. BMC Infect. Dis. 16, 1–13 (2016).
                                            31. Stresman, G., Cameron, A. & Drakeley, C. Freedom from infection: Confirming interruption of malaria transmission. Trends
                                                Parasitol. 33, 345–352 (2017).
                                            32. Pollington, T. M., Tildesley, M. J., Hollingsworth, T. D. & Chapman, L. A. Developments in statistical inference when assessing
                                                spatiotemporal disease clustering with the tau statistic. Spat. Stat. 42, 100438 (2021).
                                            33. Pollington, T. M., Tildesley, M. J., Hollingsworth, T. D. & Chapman, L. A. The spatiotemporal tau statistic: A review. arXiv preprint
                                                arXiv:​1911.​11476 (2019).
                                            34. Loh, J. & Stein, M. Bootstrapping a spatial point process. Stat. Sin., 69–101 (2004).

          Scientific Reports |   (2022) 12:9890 |                    https://doi.org/10.1038/s41598-022-13749-2                                                                      10

Vol:.(1234567890)
www.nature.com/scientificreports/

                                  35. Salje, H., Cummings, D. A. & Lessler, J. Estimating infectious disease transmission distances using the overall distribution of cases.
                                      Epidemics 17, 10–18. https://​doi.​org/​10.​1016/j.​epidem.​2016.​10.​001 (2016).
                                  36. Cruz, R. D. & Kreft, J. U. Geometric mean extension for data sets with zeros. arXiv:​1806.​06403 (2018).
                                  37. Wickham, H. et al. Welcome to the Tidyverse. J. Open Source Softw. 4, 1686. https://​doi.​org/​10.​21105/​joss.​01686 (2019).
                                  38. Müller, K. here: A Simpler Way to Find Your Files (2017).
                                  39. Bivand, R., Keitt, T. & Rowlingson, B. rgdal: Bindings for the ’Geospatial’ Data Abstraction Library (2020).
                                  40. Padgham, M. & Sumner, M. D. geodist: Fast, Dependency-Free Geodesic Distance Calculations (2020).
                                  41. Tennekes, M. tmap: Thematic Maps in R. J. Stat. Softw. 84, 1–39. https://​doi.​org/​10.​18637/​jss.​v084.​i06 (2018).
                                  42. Baddeley, A. & Turner, R. spatstat: An R package for analyzing spatial point patterns. J. Stat. Softw. 12, 1–42 (2005).

                                 Acknowledgements
                                 We thank Henrik Salje for his informative discussions around the use and interpretation of the τ estimator. We
                                 acknowledge the contribution of all investigators in the AWED Study Group to the implementation of the trial.
                                 We thank the leadership and residents of Yogyakarta for their support and participation in the trial. We grate-
                                 fully acknowledge the Tahija Foundation as funders of the AWED trial, and the Wellcome Trust and the Bill and
                                 Melinda Gates Foundation, which provided financial support to the World Mosquito Program.

                                 Author contributions
                                 All authors were involved in reviewing the final manuscript. S.M.D. contributed to the conceptualization, analysis,
                                 writing of the original draft, and revision of the final manuscript. S.K.T. contributed to the conceptualization,
                                 data curation, and analysis interpretation. C.I. contributed to the data curation, investigation, and provision of
                                 resources. A.U. contributed funding acquisition and project administration. R.A.A. contributed resources and
                                 project administration. N.P.J. contributed to the conceptualization, analysis, supervision and interpretation of
                                 analysis results. C.P.S. contributed to the conceptualization, project administration, and editing of the manuscript.
                                 K.L.A. contributed to the conceptualization, project administration, writing of the original draft and revision
                                 of the final manuscript.

                                 Competing interests
                                 The authors declare no competing interests.

                                 Additional information
                                 Supplementary Information The online version contains supplementary material available at https://​doi.​org/​
                                 10.​1038/​s41598-​022-​13749-2.
                                 Correspondence and requests for materials should be addressed to S.M.D.
                                 Reprints and permissions information is available at www.nature.com/reprints.
                                 Publisher’s note Springer Nature remains neutral with regard to jurisdictional claims in published maps and
                                 institutional affiliations.
                                               Open Access This article is licensed under a Creative Commons Attribution 4.0 International
                                               License, which permits use, sharing, adaptation, distribution and reproduction in any medium or
                                 format, as long as you give appropriate credit to the original author(s) and the source, provide a link to the
                                 Creative Commons licence, and indicate if changes were made. The images or other third party material in this
                                 article are included in the article’s Creative Commons licence, unless indicated otherwise in a credit line to the
                                 material. If material is not included in the article’s Creative Commons licence and your intended use is not
                                 permitted by statutory regulation or exceeds the permitted use, you will need to obtain permission directly from
                                 the copyright holder. To view a copy of this licence, visit http://​creat​iveco​mmons.​org/​licen​ses/​by/4.​0/.

                                 © The Author(s) 2022

Scientific Reports |   (2022) 12:9890 |                    https://doi.org/10.1038/s41598-022-13749-2                                                                    11

                                                                                                                                                                    Vol.:(0123456789)
You can also read