Explainable Abusive Language Classification Leveraging User and Network Data
←
→
Page content transcription
If your browser does not render page correctly, please read the page content below

Explainable Abusive Language Classification
         Leveraging User and Network Data

 Maximilian Wich[0000−0002−9149−9454] , Edoardo Mosca[0000−0003−4045−5328] ,
Adrian Gorniak[0000−0002−6165−5807] , Johannes Hingerl[0000−0002−8260−032X] , and
                       Georg Groh[0000−0002−5942−2297]

                     Technical University of Munich, Germany
    {maximilian.wich,edoardo.mosca,adrian.gorniak,johannes.hingerl}@tum.de
                                grohg@in.tum.de

        Abstract. Online hate speech is a phenomenon with considerable con-
        sequences for our society. Its automatic detection using machine learning
        is a promising approach to contain its spread. However, classifying abu-
        sive language with a model that purely relies on text data is limited in
        performance due to the complexity and diversity of speech (e.g., irony,
        sarcasm). Moreover, studies have shown that a significant amount of hate
        on social media platforms stems from online hate communities. Therefore,
        we develop an abusive language detection model leveraging user and
        network data to improve the classification performance. We integrate
        the explainable AI framework SHAP (SHapley Additive exPlanations) to
        alleviate the general issue of missing transparency associated with deep
        learning models, allowing us to assess the model’s vulnerability toward
        bias and systematic discrimination reliably. Furthermore, we evaluate our
        multimodel architecture on three datasets in two languages (i.e., English
        and German). Our results show that user-specific timeline and network
        data can improve the classification, while the additional explanations
        resulting from SHAP make the predictions of the model interpretable to
        humans.

        Keywords: Hate speech · Abusive language · Classification model ·
        Social network · Deep learning · Explainable AI
        Warning: This paper contains content that may be abusive or offensive.

1     Introduction

Hate speech is a severe challenge that social media platforms such as Twitter and
Facebook face nowadays. However, it is not purely an online phenomenon and can
spill over to the offline world resulting in physical violence [36]. The Capitol riots
in the US at the beginning of the year are a tragic yet prime example. Therefore,
the fight against hate speech is a crucial societal challenge.
    The enormous amount of user-generated content excludes manual monitoring
as a viable solution. Hence, automatic detection of hate speech becomes the
key component of this challenge. A technology to facilitate the identification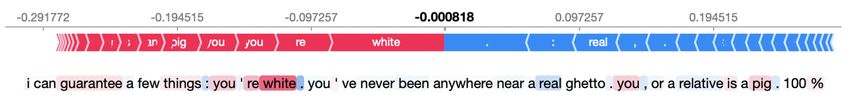
2        Wich et al.

is Machine Learning. Especially in recent years, Natural Language Processing
(NLP) has made significant progress. Even if these advances also enhanced hate
speech classification models, there is room for improvement [29].
    However, gaining the last points of the F1 score is a massive challenge in
the context of hate speech. Firstly, abusive language has various forms, types,
and targets [32]. Secondly, language itself is a complex and evolving construct;
e.g., a word can have multiple meanings, people create new words or use them
differently [29]. This complexity exacerbates classifying abusive language purely
based on textual data. Therefore, researchers have started to look beyond pure
text-driven classification and discovered the relevance of social network data [10].
Kreißel et al. [11], for example, showed that small subnetworks cause a significant
portion of offensive and hateful content on social media platforms. Thus, it is
beneficial to integrate network data into the model [3, 22, 15, 5, 6]. However, to
the best of our knowledge, no one has investigated the impact of combining the
text data of the post that is meant to be classified, the user’s previous posts, and
their social network data.
    An issue with such an approach is its vulnerability to bias, meaning that a
system ”systematically and unfairly discriminate[s] against certain individuals or
groups of individuals in favor of others” [7, p. 332]. Deep Learning (DL) models
often used in NLP are particularly prone to this issue because of their black-box
nature [17]. Conversely, a system combining various data sources and leveraging
user-related data has a more considerable potential of discriminating individuals
or groups. Consequently, such systems should integrate eXplainable AI (XAI)
techniques to address this issue and increase trustworthiness.
    We address the following two research questions in our paper concerning the
two discussed aspects:

RQ1 Can abusive language classification be improved by leveraging users’ previ-
  ous posts and their social network data?
RQ2 Can explainable AI be used to make predictions of a multimodal hate
  speech classification model more understandable?

    To answer the research questions, we develop an explainable multimodal
classification model for abusive language using the mentioned data sources1 . We
evaluate our model on three different datasets—Waseem [33], Davidson [4],
and Wich [35]. Furthermore, we report findings of integrating user and social
network data that are relevant for future work.

2     Related Work
Most work in the abusive language detection domain has focused on developing
models that only use the text data of the document to be classified [29, 16,
24].Other works, however, have started to integrate context-related data into
abusive language detection [29, 24, 18]. One promising data source is the users’
1
    Code available on https://github.com/mawic/multimodal-abusive-language-detection
Explainable multimodal Abusive Language Classifier 3
social network because it has been shown that hater networks on social media
platforms cause a considerable amount of online hate [11, 8]. Combining network
and text data from Twitter was already successfully applied to predict whether
an account is verified [2] or to identify extremist accounts [38]. In the case of
abusive language, Papegnies et al. [19] built a classification model using local and
global topological measures from graphs as features for cyberbullying detection
(e.g., average distance, betweenness centrality). A similar approach has been
applied by Chatzakou et al. [3], but they also integrated user-related data (e.g.,
number of posts, account age) and textual data (e.g., number of hashtags). This
approach was picked up and extended by other researchers [6, 5] (e.g., integrating
users’ gender, geolocation) who confirmed the usefulness of additional context-
related data sources. They all have in common that the network features are only
topological measures and do not contain any information about the relations.
Mishra et al. [15] addressed this downside and modeled the users’ follower network
with a node2vec embedding that serves as an additional input for the classification
model. Ribeiro et al. [22] developed a similar model; they, however, used the
graph embedding GraphSAGE to model the retweet network and combined it
with a document embedding for the text data [9]. For this purpose, they collected
a dataset that has a fully connected network. Unfortunately, they released only
the network data and the document embeddings but not the raw text. Recently,
Li et al. [12] refined this approach.
Another data source that supports abusive language detection is the user’s
history of previous posts. Qian et al. [20] improved a hate speech classifier for
tweets by adding the previous tweets of the author. Raisi and Huang [21] proposed
a model that leverages the user’s history of posts and the post directed to the
user to calculate a bully and victim score for each user. However, to the best of
our knowledge, no one has integrated user’s previous posts and social networks
into abusive language detection.
Besides multimodality, XAI in abusive language detection is another topic
that we have to consider in this section. Since XAI is a relatively new field, it has
not been frequently applied to abusive language detection with some exceptions
[14, 34, 31, 27, 30, 18]. All models use only the text as input, except [30]. Their
model also relies on network data. But the network submodel is very simple; it is
only a binary vector encoding whether the user follows pre-defined hater accounts.
Furthermore, the explanations for this submodel are not detailed. Hence, the
explainable model that we propose is an advancement.
3 Data
For our experiment, we use three abusive language datasets that are from Twitter.
Table 1 provides an overview of the datasets’ characteristics. Figure 1 visualizes
the social network graph of the datasets.
Davidson Davidson et al. [4] released an English abusive language dataset
containing 24,783 tweets annotated as hate, offensive, or neither. Unfortunately,4 Wich et al.
Table 1. Overview of the datasets’ statistics
Davidson Waseem Wich
Number of tweets 14,939 16,907 68.443
Number of users 6,725 2,024 939
Avg. number of
2.22 8.35 72.9
tweets per user
Class hate offensive neither sexism racsim none offensive non-offensive
Class distribution 814 11,800 2,325 3,430 1,976 11,501 26,205 42,238
Network: avg. degree 1.85 3.44 1.63
Network: graph density 0.0005 0.0034 0.0002
the dataset does not contain any data about the user or the network. Therefore,
we used the Twitter API to get the original tweets and the related user and
network data. Since not all tweets are still available on Twitter, our dataset has
shrunk to 14,939 tweets.
Waseem Waseem et al. [33] published an English abusive language dataset
containing 16,907 tweets annotated as sexist, racist, or none. Similar to Davidson,
the dataset does not provide any user- or network-related data. The authors
of [15] shared their enriched Waseem dataset with us containing the user and
network data.
(a) Davidson (blue: hate- (b) Waseem (blue: racist (c) Wich (red: offen-
ful users, red: offensive user, red: sexist user, sive user, green: standard
users, green: standard green: standard user) user)
user)
Fig. 1. Visual comparison of the network topologies. Standalone nodes or very small
subnetworks that do not connect to the main graph for Davidson and Waseem are
excluded.
Wich Wich et al. [35] released a German offensive language dataset containing
4,647,200 tweets annotated as offensive or non-offensive. Most of the tweets are
pseudo-labeled with a BERT-based classifier; a smaller portion of the datasetExplainable multimodal Abusive Language Classifier 5
is also manually annotated. The difference between this dataset and the other
two is the way it was collected. Wich et al. applied a snowball sampling strategy
focusing on users. Starting from seed users, the authors collected the connected
users and their tweets based on their offensiveness. Hence, the network graph has
a star-shaped network topology contrary to the other two, as depicted in Figure
1c. We select only 68,443 tweets and the related user and network information to
better handle the data. The manually annotated tweets are used as a test set.
4 Methodology
The section is split into two subsections. The first one deals with the model
architecture and training of the multimodal classification model. The second
one considers the XAI technique that we use to explain the predictions of our
multimodal model.
4.1 Multimodal Classification Model
Architecture The multimodal classification model for abusive language consists
of three submodels that process the different inputs:
1. Text model: It processes the text data of the tweet that is meant to be
classified. For this purpose, we use DistilBERT with a classification head.
2. History model: It processes the tweet history of the user.
3. Network model: It processes the social network data of the tweet’s user.
To model the network data, we use the vector embedding framework Graph-
SAGE.
The three models’ outputs are combined in a linear layer, which outputs the
prediction for the tweet to be classified.
Text model The text data of the tweet is fed into a pre-trained DistilBERT
model with a classification head. DistilBERT is a lighter and faster version of
the transformer-based model BERT [23]. Despite the parameter reduction, its
performance is comparable to BERT in general [23] and in the context of abusive
language detection [28]. In order to implement the model, we use the Transformers
library from Hugging Face2 and its implementation of DistilBERT [37]. As pre-
trained models, we use distilbert-base-uncased for the English datasets and
distilbert-base-german-cased for the German one. Before tokenizing the text
data, we remove username mentions from the tweets, but we keep the ”@” from
the mention3 . The purpose of this procedure is to avoid the classifier memorizing
the username and associating it with one of the classes. But the classifier should
recognize that the tweet addresses another user.
2
https://huggingface.co/transformers/
3
If a user is mentioned in a tweet, an ”@” symbol appears before the user name.6 Wich et al.
History model We use a bag-of-words model to model the user’s tweet history,
comprising the 500 most common terms from the dataset based on term frequency-
inverse document frequency (tf-idf). For each user, it is a 500-dimensional binary
vector that reflects which of the most common terms appear in the user’s tweet
history.
Network model In order to model the user’s social network, we apply the inductive
representation learning framework GraphSAGE [9]. The advantage of an inductive
learning framework is that it can be applied to previously unseen data, meaning
the model can generate an embedding for a new user in a network, which is a
desirable property for our use case. Our GraphSAGE model is trained on the
undirected network graph of the social relations. Furthermore, we assign to each
user/node a class derived from the labels of their tweets. The output of the model
is a 32-dimensional graph embedding for each user. The graphs are modeled as
follows:
– Davidson: An edge between two users exists if at least one follows the other.
A user is labeled as hater, if he or she has at least one hate tweet; as offensive,
if he or she has at least one offensive tweet, but no hate tweet; as neither, if
he or she has only neither tweets.
– Waseem: An edge between two users exists if at least one follows the other.
A user is labeled as racist, if he or she has at least one tweet labeled as racist;
same for sexist; as none, if he or she is neither racist nor sexist.
– Wich: An edge between two users exists if at least one has retweeted the
other. A user is labeled as offensive, if he or she has at least three offensive
tweets.
Users without network connections in their respective dataset, so-called
solitary users, do not receive a GraphSAGE embedding; their embedding vector
only contains zeros.
The output of the three models is concatenated to a 534 or 535 respectively
dimensional vector (DistilBERT: 2 or 3 dimensions depending on the output
speech classes; GraphSAGE: 32 dimensions; bag-of-words: 500 dimensions) and
fed into a hidden linear layer. This final layer with softmax activation reduces
the output to the number of classes according to the selected dataset.
Training Several challenges have to be faced when it comes to training the
model. In terms of sampling, we cannot randomly split the dataset: We have to
ensure that tweets of any user do not appear in the train and test set; otherwise,
we would have a data leakage. Therefore, sampling is done on the user level.
Users are categorized into groups based on their class and the existence of a
network. We gather six different categories for Waseem and Davidson and
four categories for Wich. The train, validation, and test set all contain users
from different classes by sampling these categories to prevent bias toward certain
user groups. Due to the different tweet counts per user, the train set size varies
between 60-70% depending on the dataset.Explainable multimodal Abusive Language Classifier 7
We under- and oversample the classes during training since all datasets are
unbalanced. Moreover, we have to train the three submodels separately because
the unsupervised training process of GraphSAGE cannot be combined with the
supervised training of DistilBERT. DistilBERT is fine-tuned for two epochs with
a batch size of 64 and an Adam optimizer (initial learning rate of 5 × 10⁻⁵ and
a weight decay of 0.01). We train our GraphSAGE model, consisting of three
hidden layers with 32 channels each, for 50 epochs with an Adam optimzer (initial
learning rate of 5 × 10⁻³ ). The bag-of-words model does not require training.
After training the submodels, we freeze them and train the hidden layer (10
epochs; Adam optimizer with an initial learning rate of 1 × 10⁻³ ).
4.2 Explainable AI Technique
We set model interpretability as a core objective of our work. To this end,
we produce Shapley-values-based explanations at different levels of granularity.
Shapley values are an established technique to estimate the contribution of input
features w.r.t. the model’s output [25, 13]. Their suitability for this task has been
proven both on a theoretical as well as on an empirical level [13].
As computing exact Shapley values is exponentially complex w.r.t. the input
size and hence not feasible, accurate approximations are fundamental for their
estimation [13]. As shown in Algorithm 1, we compute them by iteratively
averaging each feature’s marginal contribution to a specific output class. We
find that 15 iterations are sufficient for Shapley values to converge. A random
sampling of features was used for reasons of simplicity. Finally, we can assign
each feature a Shapley value, representing its relative impact score. A similar
approximation approach has been used in [26].
There are two different granularity levels in terms of features: For instance, we
can treat each model component (tweet, network, history) as a single feature and
derive impact scores (Shapley values) for these components. Alternatively, each
model component input or feature (e.g., each token of a tweet) can be treated
separately on a more fine-grained level. As Shapley values are additive, they can
be aggregated to represent component-level Shapley values. The way feature and
components are excluded in order to compute their respective Shapley value
changes based on these two levels listed in Table 2. Thus, our multimodal model
can be explained on a single instance, and the role played by each model can
always be retrieved.
Additionally, we partition the network graph into communities using the
Louvain algorithm to derive Shapley values for individual network connections
[1]. All user edges in that community with the target user are disabled to obtain
the impact of a specific community, resulting in a new GraphSAGE generated
user embedding as input for the multimodal model. The embedding vectors of
solitary users that only contain zeros result in Shapley values equal to zero for
the network component of all these users.8 Wich et al.
Result: Shapley value {φt }M M
t=1 for every feature {xt }t=1
Input : p sample probability, x instance, f model, I number of iterations
for i = 0, ..., I do
for t = 1, ..., M do
sample a Bernoulli vector P = {0, 1}M with probability p
pick S a subset of the features {xt }M t=1 \ {xt } according to P
build xS alteration of x with only features in S
f (xS∪{x } )−f (xS )
φt ← φt i−1 i
+ t
i
end
end
Algorithm 1: Shapley value approximation algorithm. In our experiments,
p = 0.7 and I = 15 were used as parameters.
Table 2. Masking strategies for SHAP on component and feature level
Text Network History
Component Masking BERT output Setting GraphSAGE Setting all vocabulary
wise with 0s embedding to 0 counts to 0
Disabling edges to user based
Feature Masking each token Setting each vocabulary
on community and generating
wise individually token count to 0 individually
new embedding
5 Results
In the first subsection, we deal with answering RQ1 based on the classification per-
formance of our architecture. The second subsection addresses the explainability
of the models and related findings to answer RQ2.
Table 3. Classification models’ performance by different architectures and datasets
Davidson Waseem Wich
Model P R F1 P R F1 P R F1
Text 75.3 77.1 76.1 77.5 84.1 80.3 89.8 91.7 90.7
Text + History 73.7 77.8 75.5 79.3 87.8 82.7 89.8 91.7 90.7
Text + Network 75.3 77.2 76.2 77.5 84.4 80.4 89.9 91.7 90.8
All 74.5 78.9 76.5 79.2 88.1 82.7 90.0 91.7 90.8
5.1 Classification Performance
Table 3 displays the different model architecture performance metrics for the
three datasets. We find that combining text, history, and network increases the
macro F1 score of Waseem by 2.4 pp and of Davidson by 0.4 pp. In the case of
Wich, we observe only a minor increase of the precision by 0.1 pp. We ascribe
these diverging increases to two aspects: Firstly, the network of Waseem is theExplainable multimodal Abusive Language Classifier 9
densest one of all three, followed by Davidson and Wich, as depicted in Table
1. Secondly, Wich’s text model has a high F1 score, meaning that this submodel
presumably drives the predictions of the multimodal model. Our impact analysis
using SHAP to identify each submodel’s relevance confirms this hypothesis, as
depicted in Figure 2. It shows that the network and history data are less relevant
for Wich’s multimodal model than for the other two models.
In order to answer RQ1, these results signify that leveraging a user’s previous
posts and their social network data does improve abusive language classification.
Additionally, the improvement of the F1 score is proportional to the network’s
density – the higher the density, the higher the improvement.
77% Tweet 77% Tweet
Vocabulary Vocabulary
Davidson 21% Network Davidson 19% Network
2% 4%
62% 79%
Waseem 35% Waseem 14%
3% 8%
95% 95%
Wich 4% Wich 4%
1% 1%
(a) Complete test set (b) Test data that contain network data
Fig. 2. Avg. impact of each classifier’s submodels on the respective test set based on
Shapley values
5.2 Explainability
In this subsection, we present the results of the XAI technique, SHAP, that we
applied to our multimodal model. Firstly, we further investigate the impact of
the network and history data added to the text model. Secondly, we show the
explanation of a single tweet.
Impact Analysis of the Submodels Figure 2 visualizes the impact of the
submodels on the multimodal model. We calculate the impact by aggregating
the Shapley values for each submodel based on the tweets in the test set. Figure
2a displays the impact on the complete test set of each dataset, while Figure 2b
shows the impact on test data that contains network data4 .
Our first observation is that all classifiers are mainly driven by the text model,
followed by the history and network model. Comparing Figure 2a and 2b, we see
that network data, if available, contributes to the predictions of Waseem’s and
Davidson’s multimodal models. If we compare the network model’s impact of
both datasets in the context of network density (Davidson: 5 × 10⁻⁴ ; Waseem:
3.4 × 10⁻³ ), we can conclude that the denser the network is, the more relevant it
is for the classification. These findings confirm our answer to RQ1.
In the case of Waseem, we observe a large contribution of the history model
(35%) for the complete test set. We can trace it back to four users that produced a
4
Network data is not avaiable for all users.10 Wich et al.
large portion of the dataset and mainly produced all abusive tweets. In general, the
number of tweets in the user’s history correlates positively with the Shapley value
for the history model, reflecting the impact of the history model on the prediction.
While the correlation within Wich’s dataset is only weak (rW ich = 0.172), we
observe a moderate correlation for the other two datasets (rDavidson = 0.500 and
rW aseem = 0.501).
Regarding Wich’s dataset, the Shapley values indicate that the text model
dominates (95%) the multimodal model’s prediction, while the other two (4%
and 1%) play only a minor role. There are two reasons for this: First, the tweets
are pseudo-labeled by a BERT model. Since we use a DistilBERT model similar
to BERT, we achieve an outstanding F1 score of the text model (90.7%). The
downside of such a good classification performance is that the multimodal model
relies mainly on the text model’s output. Therefore, the history and network
model are less relevant. Furthermore, the dataset’s network is characterized by
a low degree of interconnectivity compared to the networks of the other two
datasets (cf. Table 1).
We established that aggregating the Shapley values of the test set with respect
to RQ2 helps us better understand the relevance of each submodel. The insights
gained by the applied XAI technique also confirmed our answer to RQ1 that
user’s network and history data contribute to abusive language detection.
Explaining a Single Tweet Classification After investigating the model on
an aggregated level, we focus on explaining the prediction of a single tweet. To
do so, we select the following tweet from the Davidson dataset that is labeled
and correctly predicted as hateful by our multimodal model:
@user i can guarantee a few things: you’re white. you’ve never been
anywhere NEAR a real ghetto. you, or a relative is a pig. 100%
In the following, we demonstrate the explainable capabilities of our multimodal
model based on the selected tweet. Figure 3 plots the Shapley values of the
tweet’s tokens and the user’s history and network (last two rows). These Shapley
values indicate the relevance of the feature on the multimodal model’s prediction
as hateful. A positive value (red-colored) represents a contribution favoring
the classification as hateful, a negative value (blue-colored) that favors the
classification as non-hateful.
We see that the most relevant word for the classification as hateful is ”white”,
which should not be surprising because of the racist context. Furthermore, the
@-symbol (representing a user mention) and ”you(’)re” are relevant for the
classification model, indicating that directly addressing someone is recognized
as a sign of hate for the classifier. In contrast, the punctuation of the tweet
negatively influences the classification as hateful. A possible explanation is that
correct spelling and punctuation are often disregarded in the context of abusive
language. Beyond the textual perspective, we observe that the history and network
submodels favor the classification as hateful. These inputs are relevant for our
multimodal model to classify the tweet correctly. Considering Figure 4a (an3/23/2021 index.html
Explainable multimodal Abusive Language Classifier 11
History
Network
Fig. 3. Relevance of the different features in the form of Shapely values; positive, red
values represent favoring a classification as hateful; negative, blue ones the opposite;
Shapley values for history and network submodel are aggregated
alternative visualization of the Shapely values), we see that the text model
file:///C:/Users/Maximilian Wich/Box Sync/Promotion/06 Writing/09 Explainable Multi-path Classifier/Chart/index.html 1/1
slightly favors the classification as non-hateful, represented by the negative sum
of Shapley values. Due to the input from the other two submodel, however, the
multimodal model classifies the tweet correctly, making this an excellent example
of how abusive language detection can profit from additional data.
Figures 4b and 4c break down the contribution of the history and network
model, where Figure 4b is a waterfall chart displaying the most relevant terms
that the user used in their previous posts—less relevant terms are summarized in
the column named REST. As in the previous charts, red represents a positive
contribution to the classification as hateful and blue vice versa. The last column,
called OVERALL, is the sum of all terms’ Shapley values. In this case, the
previous tweets of the user contain words words that are primarily associated
with hateful tweets; consequently, the history model favors a classification as
hateful. Figure 4c shows the user’s ego network and its impact on the classification.
The nodes connected to the user represent communities identified by the Louvain
algorithm. The first number of a node’s label is an identifier; the second number
is the number of haters in the community; the third number is the community’s
total number of users. The color of the nodes and edges have the same meaning
as in the other visualizations. In our case, two connected communities contribute
to a hateful classification, while the left-pointing community counteracts this.
The presented explanations of the complete model and its submodels provide
meaningful and reasonable information to understand better how the model
decides to make predictions. These findings extend our answer to RQ2 from the
previous section. Our explainable model provides explanations on an aggregated
level and a single prediction level to make the classification more understandable.12 Wich et al.
(a) Text
(b) User’s history (c) User’s network (colored
nodes represent communi-
ties)
Fig. 4. Explanations for predictions of test, history, and network submodel in the form
of Shapely values (red, positive values favor a classification as hateful; blue, negative
values favor a classification as non-hateful)
6 Discussion
We demonstrated that leveraging a user’s history and ego network can improve
abusive language detection regarding RQ1, consistent with the findings from
other researchers [15, 22, 20]. Our multimodal approach is novel because we
combine text, users’ previous tweets, and their social relations in one model. The
additional data sources provide further indications for the classification model to
detect abusive language better. That can be helpful, especially when the classifier
struggles with a precise prediction, as in our example in Section 5.2. Other
examples are implicit language, irony, or sarcasm, which are hard to detect from
a textual perspective. The improvement, however, varies between the datasets.
We trace this back to the network density of the available data. Waseem has
the network with the highest density and exhibits the best improvement if we
integrate history and network data. In contrast, the classification model based
on Wich, the dataset with the least dense network, could be improved only
slightly. A further difficulty concerning Wich’s dataset is that the tweets are
pseudo-labeled with a BERT model, and our text submodel uses DistilBERT.
Hence, our text submodel performs so well that the multimodal model nearly
ignores the outputs of the history and network submodels. Therefore, it was
hard to identify any improvement. Relating to Davidson, we had the problem
of data degradation. Since the dataset does not contain any user or network
data, we used the Twitter API to obtain them. But not all tweets were still
available, causing us to use only 60% of the original dataset for our experiment.
We require more appropriate datasets to investigate the integration of additional
data sources in abusive language detection and refine this approach. For example,Explainable multimodal Abusive Language Classifier 13
Riberio et al. [22] have released a comprehensive dataset containing 4,972 labeled
users. Unfortunately, they have not published the tweets of the users. We are
aware that releasing a dataset containing social relations and text might violate
the users’ privacy. Therefore, we suggest anonymizing the data by replacing all
user names with anonymous identifiers.
We proved that our multimodal model combined with the SHAP framework
provides reasonable and meaningful explanations of its predictions associated
with RQ2. These explanations allow us to gain a better understanding with
respect of the models in two different ways: (1) the influence of the different
submodels on the final predictions on an aggregated level; (2) the relevance of
individual features (e.g., word, social relationship) for a single prediction. These
explainable capabilities of our multimodal model are a further novelty. To our
best knowledge, no one has developed such an explainable model for abusive
language detection.
Even though the SHAP explanations are only an approximation, they are
necessary for the reliable application of a hate speech detection model, as we
have developed. It should be humanly interpretable how each of the three models
influences predictions since we combine various data sources, which is especially
true when one data source, such as the social network, is not fully transparent for
the user. The reason for the missing transparency is that our network submodel
learns patterns from social relations, which are more challenging to understand
without any additional information than the ones from the text model. Therefore,
these explainable capabilities are indispensable for such a system to provide a
certain degree of transparency and build trustworthiness.
After focusing on the individual research questions, we have to add an ethical
consideration regarding our developed model for various reasons. One may criticize
that we integrate social network data, which is personal data, into our model
and that the benefit gained by it bears no relation to the invasion of the user’s
privacy. However, we argue against it based on the following reasons: (1) We
use social network data to train embeddings and identify patterns that do not
contain any personal data. (2) The user’s history and network are shown to
enhance the detection rate, even if the used datasets are not the most appropriate
ones for this experiment because of the limited density. Furthermore, detecting
abusive language can be challenging if the author uses irony, sarcasm, or implicit
wording. Therefore, context information (e.g., user’s history or network) should
be included because its benefit outweighs the damage caused by abusive language.
Another point of criticism could be the possible vulnerability to bias and
systematic discrimination of users. In general, DL models are vulnerable to bias
due to their black-box nature. In the case of a multimodal model, however, the
issue is more aggravated because one submodel can dominate the prediction
without any transparency for the user. For example, a model that classifies a
user’s tweet only because of their social relations discriminates the user with a
high probability. We address this challenge by adding explainable capabilities
with SHAP. Therefore, we claim that our multimodal model is less vulnerable to14 Wich et al.
bias than classical abusive language detection models applying DL techniques
without XAI integration.
7 Conclusion & Outlook
This paper investigated whether users’ previous posts and social network data
can be leveraged to achieve good, humanly interpretable classification results
in the context of abusive language. Concerning the classification performance
(RQ1), we showed that the additional data improves the performance depending
on the dataset and its network density. For Waseem, we increased the macro
F1 score by 2.4 pp, for Davidson by 0.4 pp, and Wich by 0.1 pp. We found
that the denser the network, the higher the gain. Nevertheless, the availability of
appropriate datasets is a remaining challenge.
The model’s interpretability (RQ2) demonstrated that our multimodal model
using the SHAP framework produces meaningful and understandable explanations
for its predictions. The explanations are provided both on a word level and
connections to social communities in the user’s ego network. The explanations
help better understand a single prediction and the complete model if relevance
scores are aggregated on a submodel level. Furthermore, explainability is a
necessary feature of such a multimodal model to prevent bias and discrimination.
Integrating a user’s previous posts and social network to enhance abusive
language detection produced promising results. Therefore, the research community
should continue exploring this approach because it might be a feasible way to
address the challenge of detecting implicit hate, irony, or sarcasm. Concrete
aspects that have to be addressed by future work are the following: (1) collecting
appropriate data (in terms of size and network density) to refine our approach,
(2) improving our model’s architecture.
Acknowledgments
We would like to thank Anika Apel and Mariam Khuchua for their contribution
to this project. The research has been partially funded by a scholarship from the
Hanns Seidel Foundation financed by the German Federal Ministry of Education
and Research.
References
1. Blondel, V.D., Guillaume, J.L., Lambiotte, R., Lefebvre, E.: Fast unfolding of
communities in large networks. Journal of Statistical Mechanics: Theory and
Experiment 2008(10), P10008 (Oct 2008)
2. Campbell, W., Baseman, E., Greenfield, K.: Content + context networks for user
classification in twitter. In: Frontiers of Network Analysis, NIPS Workshop, 9
December 2013 (2013)Explainable multimodal Abusive Language Classifier 15
3. Chatzakou, D., Kourtellis, N., Blackburn, J., De Cristofaro, E., Stringhini, G.,
Vakali, A.: Mean birds: Detecting aggression and bullying on twitter. In: WebSci.
pp. 13–22 (2017)
4. Davidson, T., Warmsley, D., Macy, M., Weber, I.: Automated hate speech detection
and the problem of offensive language. In: Proc. 11th ICWSM Conf. (2017)
5. Fehn Unsvåg, E., Gambäck, B.: The effects of user features on Twitter hate speech
detection. In: Proc. 2nd Workshop on Abusive Language Online (ALW2). pp. 75–85.
ACL (2018)
6. Founta, A.M., Chatzakou, D., Kourtellis, N., Blackburn, J., Vakali, A., Leontiadis,
I.: A unified deep learning architecture for abuse detection. In: WebSci. pp. 105–114.
ACM (2019)
7. Friedman, B., Nissenbaum, H.: Bias in computer systems. ACM Transactions on
Information Systems pp. 330–347 (1996)
8. Garland, J., Ghazi-Zahedi, K., Young, J.G., Hébert-Dufresne, L., Galesic, M.:
Countering hate on social media: Large scale classification of hate and counter
speech. In: Proc. 4th Workshop on Online Abuse and Harms. pp. 102–112 (2020)
9. Hamilton, W.L., Ying, Z., Leskovec, J.: Inductive representation learning on large
graphs. In: NIPS. pp. 1024–1034 (2017)
10. Hennig, M., Brandes, U., Pfeffer, J., Mergel, I.: Studying Social Networks. A Guide
to Empirical Research. Campus Verlag (2012)
11. Kreißel, P., Ebner, J., Urban, A., Guhl, J.: Hass auf Knopfdruck. Rechtsextreme
Trollfabriken und das Ökosystem koordinierter Hasskampagnen im Netz. Institute
for Strategic Dialogue (2018)
12. Li, S., Zaidi, N., Liu, Q., Li, G.: Neighbours and kinsmen: Hateful users detection
with graph neural network. In: Pacific-Asia Conference on Knowledge Discovery
and Data Mining. Springer (2021)
13. Lundberg, S.M., Lee, S.I.: A unified approach to interpreting model predictions. In:
NeurIPS (2017)
14. Mathew, B., Saha, P., Yimam, S.M., Biemann, C., Goyal, P., Mukherjee, A.:
Hatexplain: A benchmark dataset for explainable hate speech detection. arXiv
preprint arXiv:2012.10289 (2020)
15. Mishra, P., Del Tredici, M., Yannakoudakis, H., Shutova, E.: Author profiling for
abuse detection. In: COLING. pp. 1088–1098. ACL (2018)
16. Mishra, P., Yannakoudakis, H., Shutova, E.: Tackling online abuse: A survey of
automated abuse detection methods. arXiv preprint arXiv:1908.06024 (2019)
17. Molnar, C.: Interpretable Machine Learning (2019),
https://christophm.github.io/interpretable-ml-book/
18. Mosca, E., Wich, M., Groh, G.: Understanding and interpreting the impact of user
context in hate speech detection. In: Proc. 9th Int. Workshop on Natural Language
Processing for Social Media. pp. 91–102. ACL (2021)
19. Papegnies, E., Labatut, V., Dufour, R., Linares, G.: Graph-based features for
automatic online abuse detection. In: SLSP. pp. 70–81. Springer (2017)
20. Qian, J., ElSherief, M., Belding, E., Wang, W.Y.: Leveraging intra-user and inter-
user representation learning for automated hate speech detection. In: NAACL 2018
(Short Papers). pp. 118–123. ACL (2018)
21. Raisi, E., Huang, B.: Cyberbullying detection with weakly supervised machine
learning. pp. 409–416. ASONAM ’17, Association for Computing Machinery, New
York, NY, USA (2017)
22. Ribeiro, M., Calais, P., Santos, Y., Almeida, V., Meira Jr, W.: Characterizing and
detecting hateful users on twitter. In: Proc. Int. AAAI Conf. on Web and Social
Media. vol. 12 (2018)16 Wich et al.
23. Sanh, V., Debut, L., Chaumond, J., Wolf, T.: DistilBERT, a distilled version of
BERT: smaller, faster, cheaper and lighter. In: 2019 5th Workshop on Energy
Efficient Machine Learning and Cognitive Computing - NeurIPS 2019 (2019)
24. Schmidt, A., Wiegand, M.: A survey on hate speech detection using natural language
processing. In: Proc. 5th Int. Workshop on Natural Language Processing for Social
Media. pp. 1–10. ACL (2017)
25. Shapley, L.: Quota solutions of n-person games. Contributions to the Theory of
Games 2, 343–359 (1953)
26. Štrumbelj, E., Kononenko, I.: Explaining prediction models and individual pre-
dictions with feature contributions. Knowledge and information systems 41(3),
647–665 (2014)
27. Švec, A., Pikuliak, M., Šimko, M., Bieliková, M.: Improving moderation of online
discussions via interpretable neural models. In: Proc. 2nd Workshop on Abusive
Language Online (ALW2). pp. 60–65. ACL (2018)
28. Vidgen, B., Hale, S., Guest, E., Margetts, H., Broniatowski, D., Waseem, Z., Botelho,
A., Hall, M., Tromble, R.: Detecting East Asian prejudice on social media. In: Proc.
4th Workshop on Online Abuse and Harms. pp. 162–172. ACL (2020)
29. Vidgen, B., Harris, A., Nguyen, D., Tromble, R., Hale, S., Margetts, H.: Challenges
and frontiers in abusive content detection. In: Proc. 3rd Workshop on Abusive
Language Online. pp. 80–93. ACL (2019)
30. Vijayaraghavan, P., Larochelle, H., Roy, D.: Interpretable multi-modal hate speech
detection. In: Proc. Int. Conf. on Machine Learning AI for Social Good Workshop
(2019)
31. Wang, C.: Interpreting neural network hate speech classifiers. In: Proc. 2nd Work-
shop on Abusive Language Online (ALW2). pp. 86–92. ACL (2018)
32. Waseem, Z., Davidson, T., Warmsley, D., Weber, I.: Understanding abuse: A
typology of abusive language detection subtasks. In: Proc. 1st Workshop on Abusive
Language Online. pp. 78–84. ACL (2017)
33. Waseem, Z., Hovy, D.: Hateful symbols or hateful people? predictive features for
hate speech detection on Twitter. In: Proc. NAACL Student Research Workshop.
pp. 88–93. ACL (2016)
34. Wich, M., Bauer, J., Groh, G.: Impact of politically biased data on hate speech
classification. In: Proc. 4th Workshop on Online Abuse and Harms. pp. 54–64. ACL
(2020)
35. Wich, M., Breitinger, M., Strathern, W., Naimarevic, M., Groh, G., Pfeffer, J.: Are
your friends also haters? identification of hater networks on social media: Data
paper. In: Companion Proc. Web Conference 2021. ACM (2021)
36. Williams, M.L., Burnap, P., Javed, A., Liu, H., Ozalp, S.: Hate in the machine:
Anti-black and anti-muslim social media posts as predictors of offline racially and
religiously aggravated crime. The British Journal of Criminology pp. 93–117 (2020)
37. Wolf, T., Debut, L., Sanh, V., Chaumond, J., Delangue, C., Moi, A., Cistac, P.,
Rault, T., Louf, R., Funtowicz, M., Davison, J., Shleifer, S., von Platen, P., Ma,
C., Jernite, Y., Plu, J., Xu, C., Le Scao, T., Gugger, S., Drame, M., Lhoest, Q.,
Rush, A.: Transformers: State-of-the-art natural language processing. In: Proc.
2020 Conference on Empirical Methods in Natural Language Processing: System
Demonstrations. pp. 38–45. ACL (2020)
38. Xu, J., Lu, T.C., et al.: Automated classification of extremist twitter accounts using
content-based and network-based features. In: 2016 IEEE Int. Conf. on Big Data.
pp. 2545–2549. IEEE (2016)You can also read