Fifth Wall Acquisition Corp I
←
→
Page content transcription
If your browser does not render page correctly, please read the page content below

Fifth Wall Acquisition Corp I
Disclaimer
Important Information for Investors and Stockholders

This document relates to the proposed merger involving Fifth Wall Acquisition Corp. I (“FWAA”) and SmartRent.com, Inc. (“SmartRent”). FWAA intends to file a registration statement on Form S-4 with the Securities and Exchange Commission (“SEC”), which
will include a document that serves as a prospectus and proxy statement of FWAA, referred to as a proxy statement/prospectus, and each party will file other documents with the SEC regarding the proposed transaction. A definitive proxy
statement/prospectus will also be sent to the stockholders of FWAA, seeking any required stockholder approvals. Investors and security holders of FWAA and SmartRent are urged to carefully read the entire proxy statement/prospectus, when it becomes
available, and any other relevant documents filed with the SEC, as well as any amendments or supplements to these documents, because they will contain important information about the proposed transaction. The documents filed by FWAA with the SEC
may be obtained free of charge at the SEC’s website at www.sec.gov. Alternatively, these documents, when available, can be obtained free of charge from FWAA upon written request to Fifth Wall Acquisition Corp. I, 6060 Center Drive, 10th Floor, Los
Angeles, California 90045.

FWAA, SmartRent and certain of their respective directors and executive officers may be deemed to be participants in the solicitation of proxies in favor of the approval of the merger and related matters. Information regarding FWAA’s directors and executive
officers is contained in the section of FWAA’s Form S-1 titled “Management”, which was filed with the SEC on February 4, 2021. Additional information regarding the interests of those participants and other persons who may be deemed participants in the
transaction may be obtained by reading the proxy statement/prospectus and other relevant documents filed with the SEC when they become available. Free copies of these documents may be obtained as described in the preceding paragraph.

This document does not constitute a solicitation of a proxy, consent, or authorization with respect to any securities or in respect of the proposed transaction. This document also does not constitute an offer to sell or the solicitation of an offer to buy any
securities or a solicitation of any vote or approval, nor will there be any sale of any securities in any state or jurisdiction in which such offer, solicitation or sale would be unlawful prior to registration or qualification under the securities laws of such other
jurisdiction. No offering of securities will be made except by means of a prospectus meeting the requirements of Section 10 of the Securities Act of 1933, as amended, or an exemption therefrom.

Forward-Looking Statements

This document contains forward-looking statements within the meaning of the Private Securities Litigation Reform Act of 1995 including, but not limited to, FWAA’s and SmartRent’s expectations or predictions of future financial or business performance or
conditions, SmartRent’s product roadmap, including the expected timing of new product releases, SmartRent’s plans to expand its product availability globally, the expected composition of the management team and board of directors following the
transaction, the expected use of capital following the transaction, including SmartRent’s ability to accomplish the initiatives outlined above, the expected timing of the closing of the transaction and the expected cash balance of the combined company
following the closing. Any forward-looking statements herein are based solely on the expectations or predictions of FWAA or SmartRent and do not express the expectations, predictions or opinions of Fifth Wall in any way. Forward-looking statements are
inherently subject to risks, uncertainties, and assumptions. Generally, statements that are not historical facts, including statements concerning possible or assumed future actions, business strategies, events, or results of operations, are forward-looking
statements. These statements may be preceded by, followed by, or include the words “believes,” “estimates,” “expects,” “projects,” “forecasts,” “may,” “will,” “should,” “seeks,” “plans,” “scheduled,” “anticipates,” “intends” or “continue” or similar expressions.
Such forward-looking statements involve risks and uncertainties that may cause actual events, results or performance to differ materially from those indicated by such statements. Certain of these risks are identified and discussed in the section of FWAA’s
Form S-1 titled “Risk Factors,” which was filed with the SEC on February 4, 2021. These risk factors will be important to consider in determining future results and should be reviewed in their entirety. These forward-looking statements are based on FWAA’s or
SmartRent’s management’s current expectations and beliefs, as well as a number of assumptions concerning future events. However, there can be no assurance that the events, results, or trends identified in these forward-looking statements will occur or be
achieved. Forward-looking statements speak only as of the date they are made, and neither FWAA nor SmartRent is under any obligation and expressly disclaim any obligation, to update, alter or otherwise revise any forward-looking statement, whether as a
result of new information, future events, or otherwise, except as required by law. Readers should carefully review the statements set forth in the reports, which FWAA has filed or will file from time to time with the SEC.

In addition to factors previously disclosed in FWAA’s reports filed with the SEC, including FWAA’s most recent reports on Form 8-K and all attachments thereto, which are available, free of charge, at the SEC’s website at www.sec.gov, and those identified
elsewhere in this document, the following factors, among others, could cause actual results to differ materially from forward-looking statements or historical performance: risks and uncertainties related to the inability of the parties to successfully or timely
consummate the merger, including the risk that any required regulatory approvals or stockholder approvals of FWAA or SmartRent are not obtained, are delayed or are subject to unanticipated conditions that could adversely affect the combined company or
the expected benefits of the merger is not obtained, failure to realize the anticipated benefits of the merger, risks related to SmartRent’s ability to execute on its business strategy, attract and retain users, develop new offerings, enhance existing offerings,
compete effectively, and manage growth and costs, the duration and global impact of COVID-19, the possibility that FWAA or SmartRent may be adversely affected by other economic, business and/or competitive factors, the number of redemption requests
made by FWAA’s public stockholders, the ability of SmartRent and the combined company to leverage Fifth Wall’s limited partner and other commercial relationships to grow SmartRent’s customer base (which is not the subject of any legally binding
obligation on the part of Fifth Wall or any of its partners or representatives), the ability of SmartRent and the combined company to leverage its relationship with any other SmartRent investor (including investors in the proposed PIPE transaction) to grow
SmartRent’s customer base, the ability of the combined company to meet Nasdaq’s listing standards (or the standards of any other securities exchange on which securities of the public entity are listed) following the merger, the inability to complete the
private placement of common stock of FWAA to certain institutional accredited investors, the risk that the announcement and consummation of the transaction disrupts SmartRent’s current plans and operations, costs related to the transaction, changes in
applicable laws or regulations, the outcome of any legal proceedings that may be instituted against FWAA, SmartRent, or any of their respective directors or officers, following the announcement of the transaction, the ability of FWAA or the combined
company to issue equity or equity-linked securities in connection with the proposed merger or in the future, the failure to realize anticipated pro forma results and underlying assumptions, including with respect to estimated stockholder redemptions and
purchase price and other adjustments; and those factors discussed in documents of FWAA filed, or to be filed, with the SEC.

                                                                                                                                                                                                                                                                             2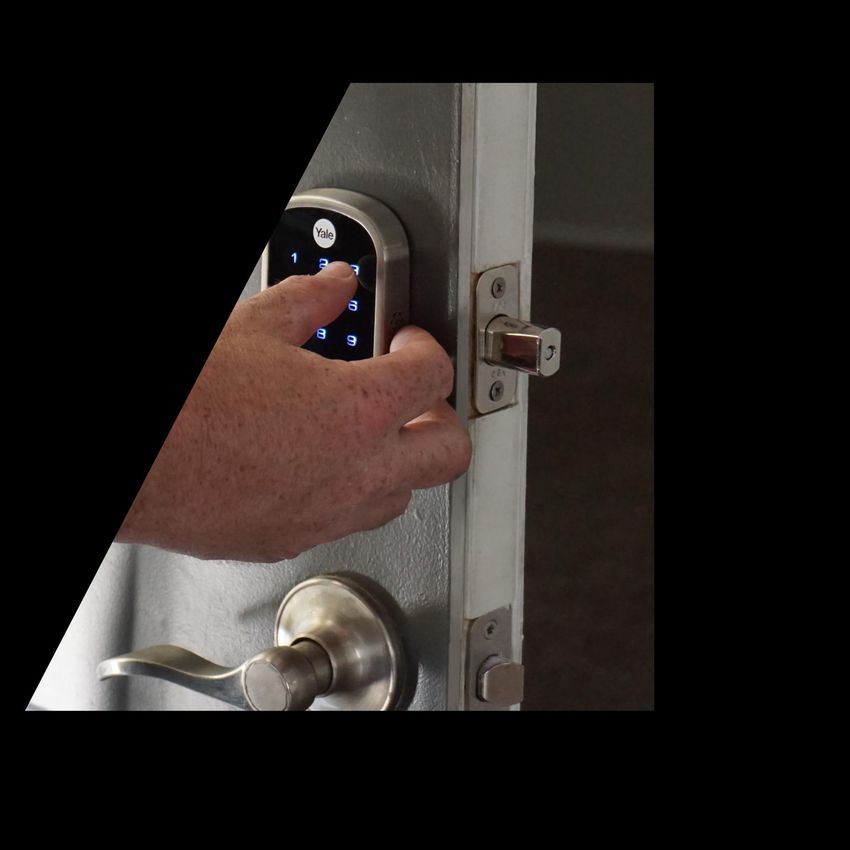
Disclaimer
Additional factors that could cause actual results to differ materially from those expressed or implied in forward-looking statements can be found in FWAA’s most recent reports on Form 8-K, which are available, free of charge, at the SEC’s website at
www.sec.gov, and will also be provided in FWAA’s proxy statement/prospectus, when available. Any financial projections in this document are forward-looking statements that are based on assumptions that are inherently subject to significant uncertainties
and contingencies, many of which are beyond FWAA’s and SmartRent’s control. While all projections are necessarily speculative, FWAA and SmartRent believe that the preparation of prospective financial information involves increasingly higher levels of
uncertainty the further out the projection extends from the date of preparation. The assumptions and estimates underlying the projected results are inherently uncertain and are subject to a wide variety of significant business, economic and competitive risks
and uncertainties that could cause actual results to differ materially from those contained in the projections. The inclusion of projections in this document should not be regarded as an indication that FWAA and SmartRent, or their representatives, considered
or consider the projections to be a reliable prediction of future events.

Annualized, pro forma, projected and estimated numbers (including projected revenue derived from committed units) are used for illustrative purposes only, are not forecasts, and may not reflect actual results. Presentation of historical 0% customer churn
(which occurs when an existing customer removes SmartRent installed units) is illustrative only, and is not intended to be predictive of future churn, particularly as business continues to grow. When used herein, the term “committed units” includes both (i)
units that are subject to binding purchase orders from customers and (ii) units that existing customers who are parties to a SmartRent master services agreement have informed SmartRent that they intend to order.

This document is not intended to be all-inclusive or to contain all the information that a person may desire in considering an investment in FWAA and is not intended to form the basis of an investment decision in FWAA. All subsequent written and oral
forward-looking statements concerning FWAA and SmartRent, the proposed transaction, or other matters and attributable to FWAA and SmartRent or any person acting on their behalf are expressly qualified in their entirety by the cautionary statements
above.

Important Information About Fifth Wall

In these materials (including any accompanying video or audio materials), references to “Fifth Wall” and “Fifth Wall Group” generally refer to Fifth Wall Asset Management, LLC, and Fifth Wall Ventures Management, LLC, collectively with their affiliates and
any investment funds, investment vehicles or accounts managed or advised by any of the foregoing (each such fund, vehicle or account, a “Fifth Wall Fund”). FWAA is sponsored by Fifth Wall Acquisition Sponsor, LLC (the “FWAA Sponsor”), which is an
affiliate of Fifth Wall. However, FWAA is an independent publicly-traded company, and not a member of Fifth Wall or the Fifth Wall Group. Fifth Wall has not and is not providing investment advice to any person in connection with the matters contemplated
herein, including FWAA, FWAA Sponsor or SmartRent. A fund managed by Fifth Wall currently holds a minority stake of less than 5% in SmartRent.
Except for certain limited obligations of the FWAA Sponsor related to the disposition of its founder shares in FWAA, Fifth Wall in not a party to the proposed transaction agreements between FWAA and SmartRent or related transactions. Neither Fifth Wall,
nor any of its partners, employees or other representatives will have at any time any legal obligation or commitment to any person (including SmartRent) to promote, advertise, market, or support the products, services, business or operations of SmartRent or
the combined company. Fifth Wall’s position following consummation of the proposed merger will be that of an investor in the combined company until such time as Fifth Wall may, subject to its contractual obligations, dispose of its shares in the combined
company.

This material is neither an offer to sell nor a solicitation of an offer to buy any security in any Fifth Wall Fund, and may not be used or relied upon in connection with any offer or solicitation. A private offering of interests in a Fifth Wall Fund may only be made
by such Fifth Wall Fund pursuant to the offering documents for such Fifth Wall Fund, which will contain additional information about the investment objectives, terms, and conditions of an investment in such Fifth Wall Fund and also contain tax information and
risk disclosures that are important to any investment decision regarding such Fifth Wall Fund. The information contained in this material is superseded by, and is qualified in its entirety by reference to, such offering documents. This communication is
intended only for persons resident in jurisdictions where the distribution or availability of this communication would not be contrary to applicable laws or regulations.

Past performance or activities are not necessarily indicative of future results, and there can be no assurance that any Fifth Wall Fund will achieve results comparable to those presented herein, or that any Fifth Wall Fund will be able to implement its
investment strategies or achieve its investment objectives. A Fifth Wall Fund's investment and applicable investment restrictions may differ from those historically employed by Fifth Wall, and economic conditions may differ materially from the conditions under
which any other investment fund, investment vehicle or account managed or advised by Fifth Wall has previously invested. The investments, transactions and operational activities of Fifth Wall contained in this material, if any, are shown for illustrative
purposes only of the types of investments, transactions and activities that have historically been undertaken by Fifth Wall, its affiliates and their respective officers, directors, partners, members, employees and/or advisors.

Use of Non-GAAP Financial Measures

This document may contain certain non-GAAP financial measures. SmartRent’s management and board of directors use certain non-GAAP measures to understand and evaluate SmartRent’s operating performance, to establish budgets, and to develop
operational goals for managing its business, and they believe these measures also provide meaningful supplemental information to investors and others in understanding and evaluating SmartRent’s operating results and enhancing the overall understanding
of its past performance and future prospects. These non-GAAP financial measures are not a substitute for GAAP measures and should be read in conjunction with SmartRent’s GAAP financial information.

                                                                                                                                                                                                                                                                              3
Fifth Wall is the preeminent PropTech investor
                Largest, most active PropTech VC who pioneered institutional PropTech investing

   1
                •
                •
                    $2.5B of AUM; over 5x larger than our closest competitor
                    Early, “kingmaker” investor in the most iconic, category-leading businesses in Proptech over last 5 years
                                                                                                                                     2016               $2.5B                      >5x
                •   Differentiated from more recreational / amateur corporate venture capital funds in real estate                    Year founded       Assets Under      Larger next largest
                •   Most sought-after VC for Proptech entrepreneurs because of brand, scale of distribution, and track record
                                                                                                                                                         Management             Proptech VC

   2
                Unmatched distribution to a global network of strategic real estate owners
                •   Global network of ~70 strategic real estate LP’s in every sector across 15 countries                                     70              2M                           9
                •   Has structured partnerships, contracts, distribution deals for our investments to act as ”kingmaker”
                                                                                                                                     Strategic Real   Multifamily units     Early investments
                •   Offers significantly more distribution to the real estate industry than any individual real estate firm
                                                                                                                                        Estate LPs                          that have become
                                                                                                                                                                                    “unicorns”
                Information advantage = unique ability to identify winners
   3            •
                •
                    Fifth Wall’s LP's help inform which technologies they prioritize and intend to adopt
                    As a result, Fifth Wall has become a "brand validator" for emerging PropTech companies to the VC                                   Track Record of Category-Leading Investments
                    community; investments signal real estate industry validation for our portfolio companies

                Studied the smart home space extensively and identified SmartRent as a clear leader
   4            •
                •
                    Fifth Wall conducted an RFP on smart home technology for one of our homebuilder Strategic LP's
                    Fifth Wall evaluated the entire landscape of companies and SmartRent stood out as a category leader
                •   Fifth Wall was attracted to management, strong reference customers, clear technological edge, and embedded growth
                •   SmartRent sought out Fifth Wall (re-opening the March 2020 Series C financing) because of Fifth Wall’s distribution potential
                    and the brand validation its investment offered

                Fifth Wall’s first SPAC is the perfect opportunity to invest in SmartRent’s future
    5           •    Fifth Wall will continue to work closely with management to drive growth
                •    Fifth Wall will help unlock access to the over 2M residential units that Fifth Wall’s growing base of strategic LPs own
                •    FWAA’s Sponsor has agreed to a long-term lockup on its Sponsor shares to promote alignment with SmartRent and its investors

                                                                                                                                                                          Acquisition Corp I

Source: Fifth Wall provided information
                                                                                                                                                                                                      4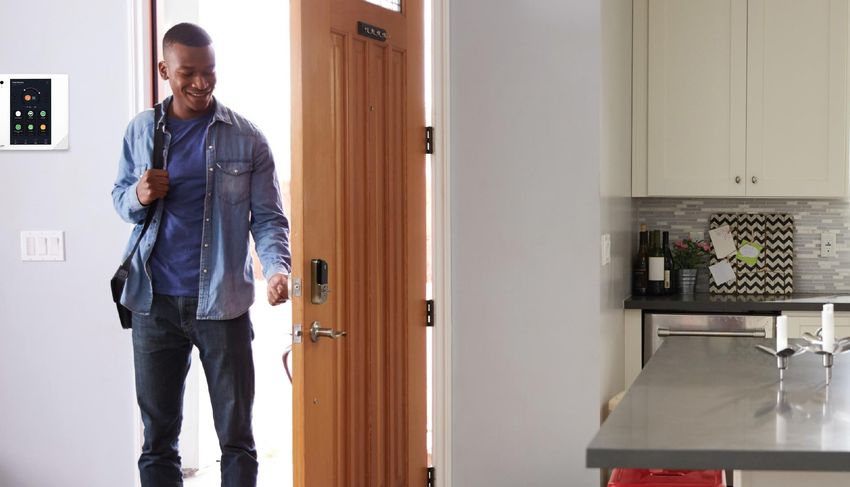
Combination with FWAA further cements
SmartRent as a category leader

Why we chose FWAA?                                                     Why we chose SmartRent?                      Strong alignment with new investors

    The PropTech validator                                                  Category leader                           Principals personally invested in deal

    Unparalleled access to potential customers                              Substantial synergies with LP network     FWAA’s shares locked up for up to three
                                                                                                                      years1
    Long-term investor                                                      Significant growth potential
                                                                                                                      100% primary proceeds to fuel growth;
    Access to proprietary M&A targets                                       Unlock Fifth Wall network effects         NO SECONDARY

    Existing SmartRent investor and strategic                               Continuation of our relationship          Warrantless structure minimizes dilution
    partner

Since its investment in March 2020, Fifth Wall has already facilitated 21 introductions
from across its LP and partner network, representing 1.4M potential units

1. Founder shares of FWAA’s sponsor are locked up for periods of up to three years
                                                                                                                                                                 5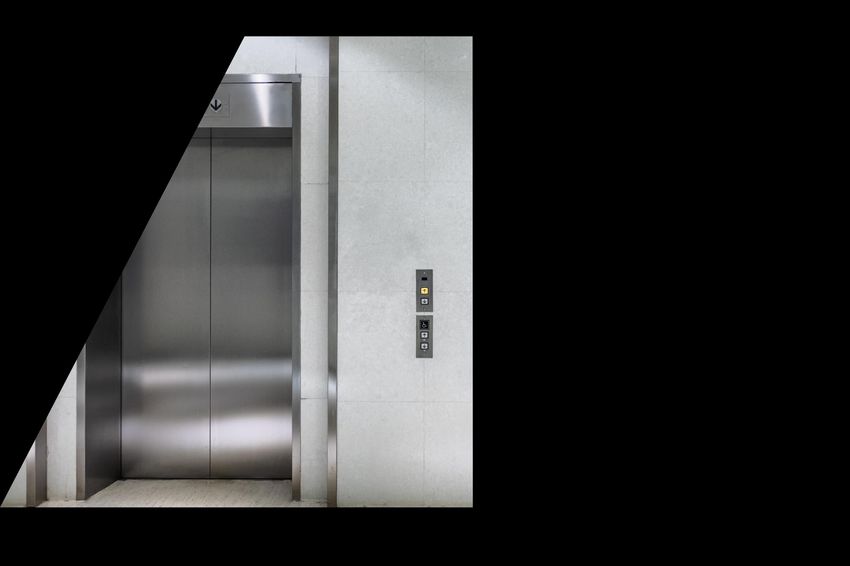
INVESTMENT HIGHLIGHTS

01

Key investment highlights

1   Leading solution provider for owners / operators & residents

2   SmartRent is a category leader

3   Highly visible pipeline of demand

4   Large addressable market

5   Significant growth opportunity

6   Experienced team with deep industry expertise

7   Attractive financial profile

Leading solution provider for owners / operators & residents

We are an enterprise software company,
providing fully-integrated solutions to the
real estate industry
We are hardware agnostic and deeply integrated into
most Property Management Systems

                                                               We have meaningful ongoing customer
                                                               relationships that drive multi-year recurring revenue
                                                                                                                       8
Leading solution provider for owners / operators & residents

Proven land-and-expand model that will
continue to fuel our growth
Every product can be an entry point with switching
costs exponentially increasing over time       Community
                                                                                                          WiFi
                                                               Building                                  (2020)                                    Smart
                                                         Access Control                                                                            Apartments
                                                                  (2020)                           Video                    Residential            (2017)
                                                                                                   Intercom                 WiFi
                                                                                                   (2021)                   (2021)
                                 Self-Guided                                                                                                                    Parking
                                       Tours                                                                                                                    Management
                                       (2019)                                                                                                                   (2021)

                              $13 - $34
                              / unit monthly opportunity

                             $1-10                                         $1-2       $1-2      $1-3          $2-5                        $7-12
                             WiFi                                          Video      Alloy     Alloy         Self-Guided                 Smart
                                                                           Intercom   Parking   Access        Tours                       Homes1
Note: Average recurring revenue per unit in a fully deployed community
1. Includes Hub recurring
                                                                                                                                                                             9
Leading solution provider for owners / operators & residents

SmartRent delivers undeniable
value to owners / operators
                                                                                                     50% 3
                                                                                                     Return on                 Year payback
                                                                                                     investment1               period1

                 20-30%                                                                                   $25-100/month
                                                                            Operating
                 Savings on utilities                                                                     Rent increase / unit
                                                                            Expenses
                 •    Maximize resident engagement                                                        •   Higher rent
                 •    Fully integrated ecosystem                                                          •   Increased resident retention
                 •    Improved building quality                                                           •   Accelerated leasing velocity
                 •    Increased asset values                                                              •   Ancillary monetization
                                                                                                              opportunities

                 70-90%                                        Asset
                                                               Protection
                                                                                        Revenue
                                                                                        Generation        20-50%
                 Decrease in water                                                                        Decrease in leasing costs
                 damage expense
                                                                                                          •   Re-leasing costs
                 •   Help owners / operators meet                                                         •   Resident onboarding /
                     decarbonization goals                                                                    Opportunity costs
                 •   2,564 water leaks prevented                                                          •   Customer servicing costs
                 •   Reduced insurance costs
                                                                            Cost                          •   Property Management Systems
                 •   366K+ MWH electricity saved                            Reduction                         redundancies

Source: Company estimates
1. Illustrative numbers; See case study on page 35
                                                                                                                                              10
Leading solution provider for owners / operators & residents
Powerful network effect is driving
demand for our solutions
Smart Home
Owners / Operators Device Companies
Need to meet residents’ growing demand for Continued product innovation to meet demand
digital amenities, while improving profitability
But these are point solutions that don’t offer
But no enterprise-level solution existed prior to SmartRent enterprise software solutions
Residents
Smart home technology has become a necessity
But few rental communities offer them
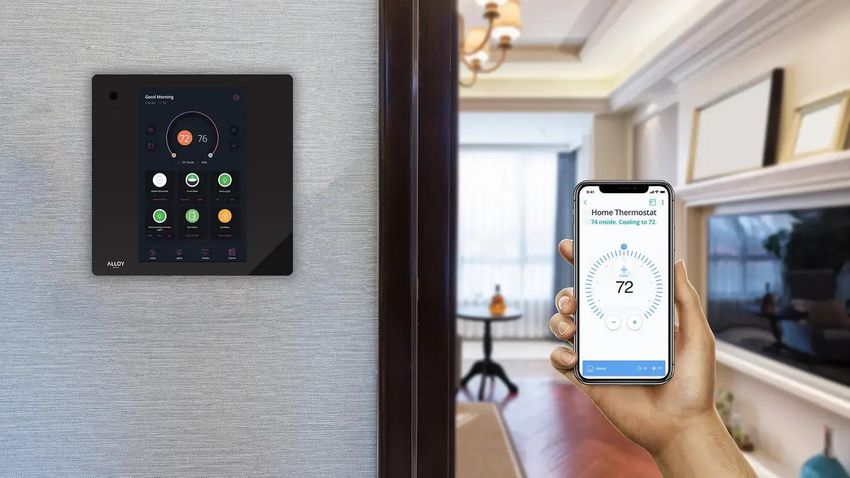
11Leading solution provider for owners / operators & residents
Re-defining the next generation
resident experience
A single user app brings the smart home
experience to rental communities
Remote Access Guest Access Building Access Climate Comfort Video
12SmartRent is a category leader
We built the right foundation for
our business
Industry-leading holistic solution Most owner / operator-friendly provider Ability to serve any building anywhere
In-house installation yields quality
100+
W2 employees in implementation,
Enterprise Hardware Resident Hardware Open Deeply installation, support & warehouse
software App agnostic architecture integrated
…Competitors mostly deliver a series of …Competitors include hardware companies …Competitors primarily focus on new
point solutions with closed architecture developments and use 3rd party installers
13SmartRent is a category leader
More units installed and states served than
all of our competitors combined
Leading presence in all major MSAs 0 units < 1,000 units 1,001 – 10,000 units +10,000 units
throughout the U.S.
More sectors than any other competitor
28M 15M 6M
Institutionally owned Single Family Homebuilders / iBuyers
multifamily US Units US Rental Residences annual U.S. homes sold1
1M+ 409 42 28
Devices Installed Cities States States with local
SmartRent teams
SmartRent Teams
Headquarters
Source: John Burns Real Estate Consulting, National Association of Realtors
Scottsdale, AZ
1. 5.3M existing homes sold in 2019 and 682K newly constructed homes sold in 2019 based on U.S. Census Bureau
14SmartRent is a category leader
The industry leaders
have chosen SmartRent… 2021 Rank Company Name Units Owned (K) SmartRent Client
Multifamily
15 of the top 20 multifamily owners
1 MAA 100
are SmartRent clients 2 Morgan Properties 91
3 Starwood Capital Group 89
4 AvalonBay Communities 80
5 Equity Residential 79
6 Greystar Real Estate Partners 75
7 Related Companies 73
1.3M 8
9
Edward Rose Building Enterprise
Monarch Investment & Management Group
67
63
Units owned 10 The Irvine Company 62
~3%
11 Cortland 62
12 Essex Property Trust 60
43M 13 Nuveen Real Estate 60
Units in the U.S.1
14 Hunt Companies 58
15 Weidner Apartment Homes 57
16 Camden Property Trust 57
17 Lincoln Property Company 53
18 The Michaels Organization 53
of addressable multifamily market Recognized thought leaders 19 UDR 52
represented by top 20 owners / for the rest of the residential 20 BH Equities 51
operators industry
…and the rest of the real estate industry is expected to follow
Source: NMHC, company filings
1. Assumes 28M rental apartment units and 15M single family rental residences in the U.S.
15Highly visible pipeline of demand
Close to full
portfolio roll-out
Case Study: 93%
Early Adopters
82%
1
$13B 33K 7th
Total market capitalization Apartments in 13 states Largest Multifamily REIT
Close to full
“And so when we think of SmartRent, using that as the example, over the last year, we put 30,000 Full portfolio rollout portfolio roll-out
units in, we were out in front of the market and what we've seen is that our residents have a December ‘18
smoother experience, our service team members are cutting less keys, and at the end of the day,
it really comes down to residents staying with us longer, team members wanting to have a more Full portfolio rollout
rewarding job and it's a holistic look at all of those things combined.”
September ‘18
Terry Considine – CEO
Q3 2019 Earnings Call
UDR pilot
Jul ‘18
Aimco pilot
May ‘18
$20B 51K 5th
Total market capitalization Apartments in 14 states Largest Multifamily REIT
“To date, we have completed 1,800 home installation with rent premiums..., although there are
clearly significant benefits to our controllable expenses as well. An additional $30 million
investment in other technologies for the overall operating platform will also occur over the next
Aimco1 UDR
three years.”
Jerry A. Davis - President and COO
Q4 2018 Earnings Call
Source: Company Data, Public Filings
1. AIR (Apartment Income REIT Corp.) was spun-off from AIMCO in December 2020. Metrics represent AIR and AIMCO combined
16Highly visible pipeline of demand
From existing customers alone, SmartRent sees an
opportunity to generate up to $1.5Bn in annual revenue
Number of Units
2.9M
unit opportunity from existing customers alone
$1.5B
annual revenue opportunity from existing customers 4
2M
2.9M $624M
Current booked revenue based on 534K booked units5
752K 0%
Customer churn since inception
176K
Installed
Units 1
Note: Preliminary estimates
Committed
Units 2
Remaining Client
Oportunity 3
Existing Customer
Base Total Oppportunity ~2%
combined market share (by unit count) of SmartRent’s largest
1. Total number of units installed to date as of 04/01/2021 15 customers
2. Committed units under existing customers’ Master Services Agreements for FY2021 to FY2023
3. Remaining units for existing customers, excluding committed and installed units
4. Estimated annual recurring revenue assuming full deployment across 2.9M units from existing customers and new products
5. Total contract value under committed units for FY2021 and FY2022. Consists of $334M hardware and installation revenue and $290M hosted service revenue, assuming average 5 year
contract.
17Large addressable market
Large addressable
market opportunity
We are targeting a substantially
larger market than our competitors
~$200B
Global
Expansion
~$80B
New Products /
Other Asset Classes 1
~$30B
Existing
Residential Stock 2
~$.03B
Annual
New Developments
Source: NAREIT, John Burns Real Estate Consulting, Statista, company assumptions
1. Assumes 43M multifamily and single family units, 15M of other rental units, commercial real estate opportunity
2. Assumes 43M multifamily and single family units and ~$700 annual revenue opportunity 18Large addressable market
Sector tailwinds are driving smart home
penetration in rental communities
The same dynamics will apply to other asset
classes and geographies
…and owners / operators risk
The rental industry is lagging… obsolescence if they do not evolve
U.S. Smart home penetration
Homes1 Rentals2
57%
40%
28%
+75% 20% 72%
1% of residents would pay more Millennials are willing to pay 72% of Millennial and 63% of
for a smart apartment3 20% more per month for Gen Z renters are ready to
smart home technology4 move within 1 year if their
2017 2021E 2025E 2021E needs aren’t met5
Source: News run
1. Statista as of November 2020
2. Estimated based on 400K units divided by 43M rental units in the U.S.
3. Entrata
4. Builder online
5. RemoteLock article 19Significant growth opportunity
Near-term product roadmap
Ongoing investment in technology for continued leadership
Leasing Resident Experience Home IoT Building IoT
Lease signing FUTURE Payments & wos FUTURE Video & security FUTURE Energy, water, air metering FUTURE
Online app FUTURE Marketplace IN PROGRESS Smart appliances IN PROGRESS Video intercom / mgmt. CURRENT
CRM FUTURE WiFi CURRENT Hubless IN PROGRESS Parking CURRENT
Self-Guided tour CURRENT Smart Home CURRENT Base IoT CURRENT Access control CURRENT
$14 - $47
/ unit monthly opportunity
$1-10 $1-2 $1-2 $1-3 $2-5 $7-12 $1-13
WiFi Video Alloy Alloy Self-Guided Smart New
Intercom Parking Access Tours Homes1 Products
Note: Average recurring revenue per unit in a fully deployed community
1. Includes Hub recurring
20Significant growth opportunity
Our solutions help owners / operators prepare
for the future
Building data Green
& analytics initiatives
Our software provides owners / operators with By deploying our solutions, owners / operators are
1 predictive maintenance tools 1 able to substantially reduce energy consumption
SmartRent tracks valuable asset and amenity SmartRent’s leak sensors prevent water damage
2 data that may be monetized in the future 2 across entire portfolios
We assist smart appliance companies integrate SmartRent helps owners / operators reduce carbon
3 with building software 3 emissions and solve peaker plants1 issues
1. Power plants that run only during peak demand for electricity
21Significant growth opportunity
SmartRent has a compelling M&A pipeline and a
proven ability to acquire and integrate companies
FWAA will supercharge SmartRent’s M&A pipeline
Largest and most active VC in real estate tech Case Study
• SmartRent acquired Zipato, a smart home
PropTech Universe: 8,300+ manufacturing company based in Croatia with
international operations, in February 2020
Fifth Wall’s CRM1 tracks more than 8,300 real estate technology companies,
including more than 600 growth and later stage companies
• Zipato is an existing supplier that was acquired to
vertically integrate part of SmartRent’s supply chain
Examples of M&A verticals • Acquisition paid for itself within twelve months due to
Home services SaaS gross margin savings upon successful integration
Further home technology sectors
Experienced enterprise sales and installation teams Having a public currency will
Hardware categorical expansion enhance SmartRent’s
International expansion opportunities attractiveness as an acquirer
1. Customer Relationship Management
22Significant growth opportunity
Illustrative financial impact of capital
raised
Sales, marketing & administrative 36%
For every
$100M Investment
1.4M Units
$220M Annual hosted service
revenue opportunity
Installation & services 64%
Other potential uses of proceeds
$900M
Hardware and installation
revenue opportunity
Research & Commercial real Bolt-on M&A International
Development estate expansion expansion
Source: Company Data
Note: The forecasted results of operations for the years 2021-2024 presented herein reflect the material positive impact of the proposed transaction and SmartRent’s planned uses of the anticipated post-closing cash on hand. The ability to advance these growth initiatives
in 2021 as a result of the transaction is projected to result in substantial revenue, gross profit and Adjusted EBITDA increases in 2022-2024 over the results SmartRent would have otherwise expected to achieve had the transaction not occurred and such additional cash not
been available for such uses; Projections contained herein are subject to numerous risks described in slides 38 and 39, and actual results may differ from projected results
23Experienced team with deep industry expertise
Experienced team with deep industry
expertise
Our team is why we win
Lucas Haldeman CJ Edmonds Demetrios Bernes Jonathan Wolter Heather Auer Mitch Karren
Chief Executive Officer Chief Revenue Officer Chief Operating Officer Chief Financial Officer Senior Vice President, Chief Product Officer
Human Resources
318 85 101 141 78 47
Employees Engineers Installation professionals Years in technology Years in real estate Years in finance
TEAM HIGHLIGHTS COMBINED EXPERIENCE AWARDS
24Attractive financial profile
Visible. Profitable. Repeatable.
1 Embedded pipeline expected to drive multi-year revenue visibility 80%
of ’21-’22 units are committed
2 Decreasing CAC1 and increasing ARPU2 expected to drive margin expansion 74%
2024E hosted service3 gross margin
3 Long-term contracts provide a large base of deferred revenues 633M
2024E cohort deferred revenue4
4 Sticky customer base 0%
Customer churn since inception
5 Clear path to corporate profitability 2022
EBITDA profitability (estimated)
1. Customer Acquisition Cost
2. Average Revenue Per User
3. Hosted services includes Hub and SaaS revenue
4. Represents Hub revenue that is amortized over 4 years, and Core SaaS revenue that is amortized over 5 years
25FINANCIAL OVERVIEW 02
Financial performance highlights
     Cumulative units (K)                                                                                                                       Total revenue ($M)

  % committed1                        85%                       75%                        26%                        4%
                                                                                                                                                                                                                                                                  $1,308
                                                                                                                     2,624

                                                                                                                                                                                                                                         $782
                                                                                           1,476
                                                                                                                                                                                                               $342
                                                                  701
                                        314                                                                                                                                          $119
              155                                                                                                                                           $53

             2020 2                   2021E                     2022E                     2023E                     2024E                                  2020 2                   2021E                     2022E                     2023E                      2024E

     Gross profit ($M)                                                                                                                            Adjusted EBITDA ($M)

  Margin:                               12%                      23%                       27%                       30%                        Margin:                                 -                       3%                        10%                       15%

                                                                                                                     $392
                                                                                                                                                                                                                                                                    $190

                                                                                           $208
                                                                                                                                                                                                                                          $78
                                                                  $80
                                        $15                                                                                                                                                                      $9

              ($3)                                                                                                                                                                  ($22)
                                                                                                                                                          ($28)
                     2
             2020                     2021E                     2022E                     2023E                     2024E                                  2020 2                   2021E                     2022E                      2023E                     2024E
Source: Company Data
Note: The forecasted results of operations for the years 2021-2024 presented herein reflect the material positive impact of the proposed transaction and SmartRent’s planned uses of the anticipated post-closing cash on hand. The ability to advance these growth initiatives in
2021 as a result of the transaction is projected to result in substantial revenue, gross profit and Adjusted EBITDA increases in 2022-2024 over the results SmartRent would have otherwise expected to achieve had the transaction not occurred and such additional cash not been
available for such uses; projections contained herein are subject to numerous risks described in slides 38 and 39, and actual results may differ from projected results
1. Percent of committed units pipeline for each year from current customers as of March 2021; MSAs signed with each of the customers accounted                                                                                                                                       27
2. All 2020 financial data in this presentation is unaudited
Attractive projected recurring revenue model
Key Highlights Revenue Build By Annual Cohort2 ($M)
$1,592
0% churn to date
5-7
year contract life
$1,004
633
397
$443
74% 75% 2024E hosted of customers prepay
$158
160
607
959
50 283
service1 gross margin software contract 108
2021E 2022E 2023E 2024E
Sales
multiplier 1.5x 1.6x 1.7x 1.7x
effect3
Recognized GAAP revenue Deferred revenue 4
Source: Company Data
Note: The forecasted results of operations for the years 2021-2024 presented herein reflect the material positive impact of the proposed transaction and SmartRent’s planned uses of the anticipated post-closing cash on hand. The ability to advance these growth initiatives in
2021 as a result of the transaction is projected to result in substantial revenue, gross profit and Adjusted EBITDA increases in 2022-2024 over the results SmartRent would have otherwise expected to achieve had the transaction not occurred and such additional cash not been
available for such uses; projections contained herein are subject to numerous risks described in slides 38 and 39, and actual results may differ from projected results
1. Hosted services includes Hub and SaaS revenue
2. Cohort analysis represents (i) recognized GAAP revenue derived from projected unit sales in each given year, plus (ii) the recurring revenue those unit sales are expected to generate in future years ("deferred revenue") through associated Hub and SaaS products. Deferred
Hub Revenue assumes a 4-year recognition period, and that the customer will not replace the Hub at the end of its lifetime. Deferred SaaS revenue is based on a 5-year customer lifetime for the core home automation product only. Assuming best-in-class SaaS churn rather
than a 5-year customer lifetime would further increase the amount of deferred revenue from each cohort. Figures also exclude sales from new product roadmap
3. Calculated as total revenue build divided by recognized GAAP revenue 28
4. Represents Hub revenue that is amortized over 4 years, and Core SaaS revenue that is amortized over 5 yearsTransaction summary
($ Millions, except per share values)
Key highlights Pro forma valuation calculation
Valuation Pro forma enterprise value of $1.66B
SmartRent illustrative share price $10.00
Capital Structure $513M pro forma cash held on balance sheet1
PIPE $155M of PIPE commitments Pro forma shares outstanding (M)5 217
Secondary No secondary proceeds Equity value $2,174
Warrants None (Less) cash (513)
Existing shareholders lock-up 6 months2
Enterprise value $1,660
FWAA lock-up period Up to 3 years3
Expected Completion 3Q2021 Sources
Cash held in trust $345
Pro forma ownership summary @ $10.00 per share4 Issuance of shares 1,577
Proceeds from PIPE 155
4.5% FWAA Sponsor Cash on SmartRent balance sheet 68
Total $2,144
7.1% PIPE Investors Uses
SmartRent equity holder stock consideration $1,577
15.9% Public Equity Holders Est. transaction fees & expenses6 50
Cash on SmartRent balance sheet 513
72.5% Debt paydown 5
SmartRent Equity
Note: Assumes no shareholder redemptions Total $2,144
1. Inclusive of PIPE proceeds and transaction expenses Holders
2. Substantially all of the stockholders expected to be in place by closing
3. Founder shares of FWAA’s sponsor are locked up for periods of up to three years
4. Shares subject to vesting are included in the ownership percentages presented
5. Total shares includes 157.7 million rollover equity shares, 34.5 million public shares, 15.5 million shares from PIPE, and 9.6 million FWAA sponsor shares; Assumes no shareholder redemption 29
6. Transaction expenses are estimatesOperating and valuation benchmarking
PropTech comps Smart home comps Integrated hardware and software comps
2022E Revenue Multiple
4.9x GAAP 15.5x
12.2x 13.3x
6.5x 6.5x 6.5x 8.0x 7.4x
3.9x Operational1
2
2020E - 2022E Revenue Growth3
154% 54% 74%
41%
31%
15% 11% 8% na
2
Source: Company estimates, company filings, market data as of 04/13/2021
1. The operational metrics present the economic effect of events that occur during the month and does not take into effect contract completion and deferral of revenues, and related cost of revenue (“COR”), pursuant to the GAAP revenue recognition standard. Although not a cash
flow statement, this concept illustrates a "cash" metric
2. Thoma Bravo announced its acquisition of RealPage on 12/21/20
3. Revenue growth calculated for companies with 2021E revenue higher than $50M 30APPENDIX 03
Detailed financials
GAAP and Operational metrics ($ Millions)
                                                                                                                                                                                            Projections
                                                                                                                 1
                                                                                                          2020                                      2021                                     2022                                      2023                                     2024

 Operational2
 Total revenues                                                                                           $69.1                                  $146.4                                   $427.7                                   $993.0                                 $1,628.3
  Cost of sales                                                                                           (62.4)                                 (121.0)                                  (302.7)                                  (668.2)                                (1,061.7)
 Gross profit                                                                                               $6.7                                   $25.3                                  $125.0                                   $324.8                                   $566.6

 Operational adjusted EBITDA3                                                                           ($14.1)                                  ($11.9)                                     $54.4                                  $195.2                                   $364.8

 GAAP
 Total revenues                                                                                           $53.0                                  $119.0                                   $342.3                                   $782.0                                 $1,308.1
  Cost of sales                                                                                          (55.8)                                  (104.1)                                  (262.8)                                  (574.1)                                 (916.1)
 Gross profit                                                                                            ($2.9)                                    $14.8                                    $79.5                                  $207.8                                   $392.0
  Total operating expense                                                                                (30.1)                                   (37.0)                                   (70.5)                                  (129.4)                                 (202.0)
 Net operating income                                                                                   ($32.9)                                  ($22.2)                                     $9.1                                    $78.4                                  $190.1
  Interest expense, net                                                                                    (0.6)                                    (0.3)                                    (0.2)                                      0.0                                     0.0
  Other income (expense)                                                                                   (2.2)                                    (1.6)                                    (1.6)                                    (1.5)                                   (1.5)
  Provision for income taxes                                                                                 0.0                                      0.0                                    (0.2)                                    (2.0)                                   (4.9)
 Net income (loss)                                                                                      ($35.7)                                  ($24.1)                                     $7.1                                    $74.8                                  $183.6

 Adjusted EBITDA3                                                                                       ($28.3)                                  ($22.4)                                      $8.9                                    $78.3                                  $190.2

 Revenue growth                                                                                                                                    125%                                     188%                                      128%                                       67%
 Gross profit margin                                                                                          nm                                    13%                                      23%                                       27%                                       30%
 Adjusted EBITDA margin                                                                                       nm                                     nm                                       3%                                       10%                                       15%
 Net income (loss) margin                                                                                     nm                                     nm                                       2%                                       10%                                       14%
Source: Company Data
Note: The forecasted results of operations for the years 2021-2024 presented herein reflect the material positive impact of the proposed transaction and SmartRent’s planned uses of the anticipated post-closing cash on hand. The ability to advance these growth initiatives in 2021
as a result of the transaction is projected to result in substantial revenue, gross profit and Adjusted EBITDA increases in 2022-2024 over the results SmartRent would have otherwise expected to achieve had the transaction not occurred and such additional cash not been
available for such uses; projections contained herein are subject to numerous risks described in slides 38 and 39, and actual results may differ from projected results
1. All 2020 financial data in this presentation is unaudited
2. The operational metrics present the economic effect of events that occur during the month and does not take into effect contract completion and deferral of revenues, and related cost of revenue (“COR”), pursuant to the GAAP revenue recognition standard. Although not a cash      32
flow statement, this concept illustrates a "cash" metric
3. Adjusted EBITDA equals net income (loss) with add backs for depreciation and amortization, stock-based compensation, net interest expense and other income (expense) excluding Zipato service fees
Detailed financials (cont’d)
GAAP and Operational metrics ($ Millions)
Projections
1
2020 2021 2022 2023 2024
Operational2
Hardware and installation
Revenues $46.4 $98.2 $274.5 $610.7 $987.4
Cost of sales 48.9 94.5 236.7 522.3 831.9
Gross Profit ($2.5) $3.7 $37.8 $88.4 $155.5
% gross profit margin nm 4% 14% 15% 16%
Hosted service
Revenues $22.6 $48.1 $153.1 $382.3 $640.8
Cost of sales 13.5 26.5 66.0 146.0 229.7
Gross Profit $9.1 $21.6 $87.1 $236.3 $411.1
% gross profit margin 40% 45% 57% 62% 64%
GAAP
Hardware and installation
Revenues $44.5 $94.9 $274.5 $610.7 $987.5
Cost of sales 50.5 92.2 236.7 522.3 832.0
Gross Profit ($6.0) $2.7 $37.8 $88.4 $155.5
% gross profit margin nm 3% 14% 14% 16%
Hosted service
Revenues $8.5 $24.1 $67.8 $171.2 $320.7
Cost of sales 5.4 12.0 26.1 51.8 84.2
Gross Profit $3.1 $12.1 $41.7 $119.4 $236.5
% gross profit margin 36% 50% 62% 70% 74%
Source: Company Data
Note: The forecasted results of operations for the years 2021-2024 presented herein reflect the material positive impact of the proposed transaction and SmartRent’s planned uses of the anticipated post-closing cash on hand. The ability to advance these growth initiatives in 2021
as a result of the transaction is projected to result in substantial revenue, gross profit and Adjusted EBITDA increases in 2022-2024 over the results SmartRent would have otherwise expected to achieve had the transaction not occurred and such additional cash not been
available for such uses; projections contained herein are subject to numerous risks described in slides 38 and 39, and actual results may differ from projected results
1. All 2020 financial data in this presentation is unaudited 33
2. The operational metrics present the economic effect of events that occur during the month and does not take into effect contract completion and deferral of revenues, and related cost of revenue (“COR”), pursuant to the GAAP revenue recognition standard. Although not a cash
flow statement, this concept illustrates a "cash" metricReconciliation of non-GAAP metrics
($ Millions)
Projections
1
2020 2021 2022 2023 2024
GAAP net income (loss) ($35.7) ($24.1) $7.1 $74.8 $183.6
Less: Other income (expense)2 1.0 0.0 0.0 0.0 0.0
Plus: Interest expense, net 0.6 0.3 0.2 0.0 0.0
Plus: Provision for income taxes 0.0 0.0 0.2 2.0 4.9
Plus: Share-based compensation 5.1 0.6 0.6 0.6 0.6
Plus: Depreciation and amortization 0.8 0.8 0.9 0.8 1.1
GAAP Adjusted EBITDA ($28.3) ($22.4) $8.9 $78.3 $190.2
Projections
2020 2021 2022 2023 2024
Operational net income (loss) ($21.4) ($13.6) $51.4 $188.8 $353.7
Less: Other income (expense)2 1.0 0.0 0.0 0.0 0.0
Plus: Interest expense, net 0.6 0.3 0.2 0.0 0.0
Plus: Provision for income taxes 0.0 0.0 1.4 5.0 9.4
Plus: Share-based compensation 5.1 0.6 0.6 0.6 0.6
Plus: Depreciation and amortization 0.7 0.8 0.9 0.8 1.1
Operational adjusted EBITDA ($14.1) ($11.9) $54.4 $195.2 $364.8
Source: Company Data
Note: The forecasted results of operations for the years 2021-2024 presented herein reflect the material positive impact of the proposed transaction and SmartRent’s planned uses of the anticipated post-closing cash on hand. The ability to advance these growth initiatives in 2021
as a result of the transaction is projected to result in substantial revenue, gross profit and Adjusted EBITDA increases in 2022-2024 over the results SmartRent would have otherwise expected to achieve had the transaction not occurred and such additional cash not been
available for such uses; projections contained herein are subject to numerous risks described in slides 38 and 39, and actual results may differ from projected results
1. All 2020 financial data in this presentation is unaudited
2. Excludes Zipato services fees
34Case study: Illustrative building economics and ROI
Per unit (annually)
50%
Traditional SmartRent
Rental Building Building
Owner / operator IRR
Revenue $18.0K $18.8K from deploying SmartRent3
OpEx ($8.4K) ($8.2K)
NOI $9.6K $10.6K 30% Projected cash
on cash return3
NOI Margin 53% 59%
Gross Value / Unit1 $192K $211K
Gross Value / Building2 $42.2M $46.5M
3-year Payback
period3
1. Based on a 5% cap rate
2. Based on assumed 220 units per building
3. Inclusive of SmartRent upfront charge and recurring fees
35SmartRent helps its clients decarbonize while
meaningfully reducing costs
2,564 Residential real estate
Water leaks prevented1
21% accounts for 21% of total U.S.
energy consumption4
366K+ MWH electricity saved2
4%
Reduction in U.S. energy
consumption if all rental buildings
Select Customers
had SmartRent3
50
Peaker plants avoided3
100%Peaker plants could be
S&P 500 | Total market cap: $27 billion
Earned 2020 “Green Star” for sustainability performance by
GRESB
S&P 500 | Total market cap: $20 billion
UDR named Smart Buildings Innovator 2020 by Logical
Buildings for 2nd year in a row
avoided if all rental buildings Essex has developed sixteen apartment communities that are
LEED Certified, including six Gold and eight Silver certifications 2020 Global Real Estate Sustainability Benchmark (“GRESB”)
had SmartRent4 score of 83, far exceeding the average of 70
1. Per company data
2. Based on 1M installed and committed units, assuming 2kwh per apartment / home saved per day during half a year; assumes 43M rental units in the U.S. for total reduction figure
3. Based on 1M installed and committed units, assuming for each 20,000 units or homes, a peaker plant can be avoided, resulting in a 5% decrease in peaker plants based on 1,000 peaker plants in the U.S.
4. Per U.S. Energy Information Administration, for 2019
36REIT Customers testimonials
“. . . We're about 27,000 units in. We do think [residents] value it. We think it is part
“This year, we intend to
of what's helped drive our outsized renewal growth, so far this year. But the
invest approximately
primary purpose of doing it is some of the expense reduction capabilities it gives us.”
$20 million on smart
home tech.”
- Jerry A Davis, President and COO
“. . . We put 30,000 units in, we were out in front of the market and what we've seen
“We don't implement technology is that our residents have a smoother experience, our service team members are
just for technology sake or some cutting less keys, and at the end of the day, it really comes down to residents
sort of whizz-bang. At the end of staying with us longer, team members wanting to have a more rewarding job
the day, we really and it's a holistic look at all of those things combined.”
have a couple of things.”
- Terry Considine, Chairman and COO
“Our tests on smart homes have
“…MAA methodically conducted A/B testing and discovered that incoming tenants
gone well. The technology was
were willing to pay a $25 monthly premium for smart-home enabled apartment
installed in 15 communities with
units.”
minimal disruption and it has
been well received by our
- Analyst note
residents.”
Source: Public filings
37Key risks
In this section, all references to the “Company,” “we,” “us” or “our” refer to the business of SmartRent. The risks presented below are certain of the general risks related to the business of the Company, and such list is not
exhaustive. You should carefully consider these risks and uncertainties, together with the information in the Company’s consolidated financial statements and related notes, and should carry out your own diligence and consult
with your own financial and legal advisors concerning the risks and suitability of an investment in this offering before making an investment decision. Risks relating to the business of the Company will be disclosed in future
documents filed or furnished by the Company and/or FWAA with SEC, including the documents filed or furnished in connection with the proposed transactions between the Company and FWAA. The risks presented in such
filings may differ significantly from, and be more extensive than, those presented below.
• We are an early-stage company with a history of losses. We have not been profitable historically and may not achieve or maintain profitability in the future.
• If the smart home technology industry does not grow as we expect, or if we cannot expand our platforms and solutions to meet the demands of this market, our revenue may decline, fail to grow or fail to grow at an
accelerated rate, and we may incur operating losses.
• Our limited operating history, recent growth and the quickly changing markets in which we operate make evaluating our current business and future prospects difficult, which may increase the risk of investing in our stock.
• The outbreak of the COVID-19 pandemic, and future resurgences or the development of variants thereof, could have an adverse effect on our business, results of operations, and financial condition.
• We collect, store, process, and use personal information of our customers and residents, which subjects us to legal obligations and laws and regulations related to security and privacy, and any actual or perceived failure
to meet those obligations could harm our business.
• If our security controls are breached or unauthorized or inadvertent access to customer or residential information or other data or to control or view systems are otherwise obtained, our products, software or services may
be perceived as insecure, our business may be harmed, and we may incur significant liabilities.
• We depend on a limited number of third-party suppliers and manufacturers and logistics partners for our products. A loss of any of our suppliers, manufacturers, and logistics partners could negatively affect our business.
• We have limited control over our suppliers, manufacturers, and logistics partners, which may subject us to significant risks, including the potential inability to produce or obtain quality products and services on a timely
basis or in sufficient quantity. If these third-party suppliers, manufacturers, and logistics partners experience any delay, disruption or quality control problems in their operations, including due to the COVID-19 pandemic,
we could lose market share and our results of operations may suffer.
• If our domestic or international supply chain or our fulfillment network for our products is ineffective or disrupted for any reason, including due to the COVID-19 pandemic, or if our operations are subject to trade policy
changes or additional tariffs, our results of operations could be adversely affected.
• Interruptions to, or other problems with, our website and interactive user interface, information technology systems, manufacturing processes or other operations could damage our reputation and brand and substantially
harm our business and results of operations.
• We may be unable to attract new customers and maintain customer satisfaction, which could have an adverse effect on our business and growth.
• If we are unable to accurately forecast customer demand for our products and services and adequately manage our inventory, our operating results could be adversely affected.
• If we are unable to develop new solutions, adapt to technological change, sell our software, services and products into new markets or further penetrate our existing markets, our revenue may not grow as expected.
• Our products and services may be affected from time to time by design and manufacturing defects that could subject us to personal injury, property damage, product liability, warranty and other claims, which would
adversely affect our business and result in harm to our reputation.
• We may expand through acquisitions of, or investments in, other companies, each of which may divert our management’s attention, result in additional dilution to our stockholders, increase expenses, disrupt our
operations and harm our results of operations.
38Key risks (cont’d)
• If we are unable to achieve or maintain profitability in the future, we may require additional capital to pursue our business objectives and to respond to business opportunities, challenges, or unforeseen circumstances. If
capital is not available to us, our business, results of operations, and financial condition may be adversely affected.
• Failure to adequately protect our intellectual property, technology, and confidential information could reduce our competitiveness and harm our business and operating results.
• Accusations of infringement of third-party intellectual property rights could materially and adversely affect our business.
• Some of our products and services contain open source software, which may pose particular risks to our proprietary software, technologies, products, and services in a manner that could harm our business.
• Failure of our global operations to comply with import and export, bribery and money laundering laws, regulations and controls, could have an adverse impact on our financial condition.
• Expanding our international operations subjects us to a variety of risks and uncertainties, including exposure to foreign currency exchange rate fluctuations, which could adversely affect our business and operating results.
• Insurance policies may not cover all of our operating risks and a casualty loss beyond the limits of our coverage could negatively impact our business.
• Potential customer turnover in the future, or costs we incur to retain and upsell our customers, could materially and adversely affect our financial performance.
• The markets in which we participate could become competitive as many companies, including large technology companies and managed service providers, may target the markets in which we do business. If we are
unable to compete effectively with these potential competitors and sustain pricing levels for our software, services, and products, our sales and profitability could be adversely affected.
• If we fail to continue to develop our brand or our reputation is harmed, our business may suffer.
• As a private company, we have not been required to document and test our internal controls over financial reporting nor has our management been required to certify the effectiveness of our internal controls and our
auditors have not been required to opine on the effectiveness of our internal control over financial reporting.
• The requirements of being a public company may strain our resources, divert management’s attention and affect our ability to attract and retain senior management and qualified board members.
• Our smart home technology is subject to varying state and local regulations, which may be updated from time to time.
• Downturns in general economic and market conditions and reductions in spending may reduce demand for our software, services, and products, which could harm our revenue, results of operations and cash flows.
• The loss of one or more key members of our management team or personnel, or our failure to attract, integrate and retain additional personnel in the future, could harm our business and negatively affect our ability to
successfully grow our business.
• Changes in effective tax rates, or adverse outcomes resulting from examination of our income or other tax returns, could adversely affect our results of operations and financial condition.
• From time to time, we may be subject to legal proceedings, regulatory disputes, and governmental inquiries that could cause us to incur significant expenses, divert our management’s attention, and materially harm our
business, financial condition, and operating results.
• Our business is subject to the risk of earthquakes, fire, power outages, floods, and other catastrophic events, and to interruption by manmade problems such as terrorism.
39You can also read