Hard wiring of normal tissue-specific chromosome-wide gene expression levels is an additional factor driving cancer type-specific aneuploidies
←
→
Page content transcription
If your browser does not render page correctly, please read the page content below
Patkar et al. Genome Medicine      (2021) 13:93
https://doi.org/10.1186/s13073-021-00905-y

 RESEARCH                                                                                                                                          Open Access

Hard wiring of normal tissue-specific
chromosome-wide gene expression levels
is an additional factor driving cancer type-
specific aneuploidies
Sushant Patkar1,2†, Kerstin Heselmeyer-Haddad3†, Noam Auslander2,4†, Daniela Hirsch3, Jordi Camps5,
Daniel Bronder3, Markus Brown3, Wei-Dong Chen3, Rachel Lokanga3, Darawalee Wangsa3, Danny Wangsa3,
Yue Hu3, Annette Lischka3,6, Rüdiger Braun3,6, Georg Emons3,7, B. Michael Ghadimi7, Jochen Gaedcke7,
Marian Grade7, Cristina Montagna8, Yuri Lazebnik9, Michael J. Difilippantonio10, Jens K. Habermann6, Gert Auer11,
Eytan Ruppin1† and Thomas Ried3*†

  Abstract
  Background: Many carcinomas have recurrent chromosomal aneuploidies specific to the tissue of tumor origin.
  The reason for this specificity is not completely understood.
  Methods: In this study, we looked at the frequency of chromosomal arm gains and losses in different cancer types
  from the The Cancer Genome Atlas (TCGA) and compared them to the mean gene expression of each chromosome
  arm in corresponding normal tissues of origin from the Genotype-Tissue Expression (GTEx) database, in addition to the
  distribution of tissue-specific oncogenes and tumor suppressors on different chromosome arms.
  Results: This analysis revealed a complex picture of factors driving tumor karyotype evolution in which some recurrent
  chromosomal copy number reflect the chromosome arm-wide gene expression levels of the their normal tissue of
  tumor origin.
  Conclusions: We conclude that the cancer type-specific distribution of chromosomal arm gains and losses is
  potentially “hardwiring” gene expression levels characteristic of the normal tissue of tumor origin, in addition
  to broadly modulating the expression of tissue-specific tumor driver genes.

Background                                                                            acquired genetic changes [1–5]. In fact, aneuploidy is
In solid tumors of epithelial origin, i.e., carcinomas, and in                        present in about 90% of solid tumors [6]. Remarkably, the
certain other solid tumors such as glioblastoma multi-                                distribution of ensuing genomic imbalances is cancer
forme and malignant melanoma, aneuploidies of specific                                type-specific [4, 7]. For instance, colorectal carcinomas re-
chromosomes define the landscape of somatically                                       currently gain chromosome arms 7, 8q, 13q, and 20q and
                                                                                      lose copies of 8p, 17p, and 18q [8]. In contrast, cervical
* Correspondence: riedt@mail.nih.gov                                                  carcinomas recurrently gain chromosome arms 1q and 3q.
Sushant Patkar, Kerstin Heselmeyer-Haddad, and Noam Auslander equally
                                                                                      In other words, a gain of 3q is not observed in colorectal
contributed as first authors.
Eytan Ruppin and Thomas Ried equally contributed as last authors.                     cancer, and cervical carcinomas do not have copy number
3
 Section of Cancer Genomics, Center for Cancer Research, National Cancer              gains of, e.g., chromosomes 7 or 13q [4, 5, 7]. Further-
Institute, NIH, Bethesda, MD 20892, USA
                                                                                      more, cancer type-specific chromosomal aneuploidies
Full list of author information is available at the end of the article

                                       © The Author(s). 2021 Open Access This article is licensed under a Creative Commons Attribution 4.0 International License,
                                       which permits use, sharing, adaptation, distribution and reproduction in any medium or format, as long as you give
                                       appropriate credit to the original author(s) and the source, provide a link to the Creative Commons licence, and indicate if
                                       changes were made. The images or other third party material in this article are included in the article's Creative Commons
                                       licence, unless indicated otherwise in a credit line to the material. If material is not included in the article's Creative Commons
                                       licence and your intended use is not permitted by statutory regulation or exceeds the permitted use, you will need to obtain
                                       permission directly from the copyright holder. To view a copy of this licence, visit http://creativecommons.org/licenses/by/4.0/.
                                       The Creative Commons Public Domain Dedication waiver (http://creativecommons.org/publicdomain/zero/1.0/) applies to the
                                       data made available in this article, unless otherwise stated in a credit line to the data.
Patkar et al. Genome Medicine (2021) 13:93 Page 2 of 16
emerge in dysplastic, i.e., not yet malignant, lesions, that stage data of tumor samples was made publicly available
are prone to progress to invasive disease [8–12]. Numer- from the TCGA Clinical Data Resource (TCGA-CDR)
ous cancer type-specific aneuploidies originate at early publicly available on the GDC website (https://gdc.
stages of tumorigenesis, yet are retained in late stage tu- cancer.gov/about-data/publications/pancanatlas) [23].
mors and in metastases, as reflected in the TCGA data- Throughout this study, we worked with pre-processed
base [9]. gene expression data that was quantified in Reads Per
The cancer type-specific distribution of genomic im- Kilobase of transcript, per Million mapped reads
balances was recently confirmed in two comprehensive (RPKM) by the authors of the respective consortiums
pan-cancer analyses of several thousand tumors [10, 11]. with no additional normalization. The RPKM values are
Although some intra-tissue differences were observed unlikely to be confounded by whole genome doubling
for certain tumor subtypes arising from the same tissue, events as they are already library size normalized,
different tumor types from the same tissue tended to through dividing by the total number of reads in a sam-
cluster together (e.g., low-grade gliomas cluster with ple. Furthermore, the GTEx samples were collected from
glioblastomas as do clear cell and papillary renal cell car- normal individuals, which lack any whole genome dupli-
cinomas). On one hand, it is possible that loss or gain of cation events. For analysis comparing tumor types to
particular chromosomes or their fragments during car- their normal tissue of origin, data from 25 tumor types
cinogenesis target the gain of specific oncogenes or the with publicly available gene expression data of their nor-
loss of tumor suppressors located on these chromo- mal tissue of origin from GTEx were considered. Like-
somes [6, 12, 13]. On the other hand, it is well known wise, for comparing normal tissue-specific methylation
that chromosome-wide alterations of gene expression and expression levels, only 11 tumor types which had
levels follow genomic copy number changes [14, 15], i.e., corresponding publicly available methylation data of
the transcripts of genes that are located on gained chro- their normal tissue of origin were considered. Additional
mosomes are more, and those on lost chromosomes are file 1: Table S1, systematically documents for each of the
less abundant. This correlation has been firmly estab- 33 tumor types in the TCGA whether there was an inde-
lished in primary human carcinomas, in derived cell pendent publicly available gene expression and methyla-
lines, and in experimental cancer models [14, 16–20]. tion dataset of the corresponding normal tissue of
Hence, the gain or loss of specific chromosomes can po- origin. Details of publicly available normal tissue methy-
tentially act as a mechanism to maintain tissue-specific lation datasets that we curated are described below.
gene dosage.
Given this background, we decided to explore how the
frequencies of chromosomal arm gains and losses in spe- Curation and pre-processing normal tissue-specific
cific cancer types correlate with (i) mean chromosome methylation datasets
arm gene expression levels of their normal tissue of ori- Processed methylation datasets of normal tissues were
gin and (ii) the chromosomal distribution of previously collected from the Gene Expression Omnibus (GEO)
identified or newly implicated tissue-specific driver database [24]. For consistency, we restricted our search
genes. Our exploratory analysis unearthed a complex to datasets where methylation was quantified using the
picture of factors shaping the evolution of tumor karyo- same platform (Illumina 450K). This resulted in the
types in which frequent chromosomal copy number identification of 18 tissue-specific methylation datasets,
changes can potentially “hardwire” chromosome-wide which were analyzed together (see Additional file 2:
gene expression levels of their normal tissue of origin in Table S2) [25–40]. These were datasets spanning differ-
addition to targeting tissue-specific driver genes. ent studies comparing methylation levels of organ tissues
between diseased and normal control individuals. We
Methods only selected methylation profiles of normal control in-
Tissue and tumor type inclusion dividuals for further analysis. Moreover, multiple data-
Chromosome arm-wide gain and loss data of each tumor sets containing samples coming from the same organ
type from the TCGA were obtained from a recent pan- tissue were merged to generate one methylation dataset
cancer study conducted by Taylor et al. [11], pre- per organ. The methylation data of each dataset was
processed cancer gene expression data of each tumor pre-processed in the following steps:
type from the TCGA was obtained from the xena
browser (https://tcga.xenahubs.net/) [21], and likewise of 1. Filtering out probes within 15 base pairs of single
the normal tissue of origin of each tumor type was ob- nucleotide polymorphisms [41].
tained from the GTEx (Genotype Tissue Expression) 2. Re-normalizing the beta values between type 1 and
project portal online (see GTEx Analysis Release V6p at type 2 probes using beta mixture quantile
https://www.gtexportal.org/home/datasets) [22]. Clinical normalization [42]. This minimizes biases that mayPatkar et al. Genome Medicine (2021) 13:93 Page 3 of 16
arise due to sensitivity differences between the two (~zero) score. However, the latter is negligible since
probe designs. chromosome arms that are frequently gained are rarely
lost in a specific tumor type and vice versa. This score is
Computation of chromosomal arm imbalance score in hence equivalent to the mean value of gains/loss inci-
cancerous tissues dences in set of tumor types considered and chromo-
We used the TCGA sample-wise chromosomal arm gain somal arm.
and loss calls provided in supplementary data of the
Taylor et al. [11] study, where the ploidy of each tumor Using permutation tests to evaluate correlations
sample was first determined via the ABSOLUTE algo- significance
rithm [43]. Then, independent chromosome arm copy In this study, we computed correlations across cancer/tis-
number alterations were distinguished from whole gen- sue types and across chromosomal arms. To evaluate
ome duplication events by comparing the absolute inte- whether the magnitude of correlations is significant com-
ger copy number of chromosomal arm regions to the pared to random, we employed a permutation test, to esti-
baseline tumor ploidy. Each segment was designated as mate a background null distribution of the number of
gained, deleted, or neutral compared to the ploidy of positive correlations. We therefore repeated 1000 itera-
each tumor sample. The scores of each arm are − 1 if tions of randomly shuffling the cancer/tissue pairing and
lost, + 1 if gained, 0 if non-aneuploid, and “NA” other- 1000 iterations of randomly shuffling the arm-level
wise. For sake of consistency, all “NA” entries were re- pairing. We compared the number of positive correlations
set to 0 (i.e., we considered those samples non- P, achieved with the true pairings to this background (Ni,
aneuploid for that arm). Sample-wise chromosome arm i = 1, 2, …, 1000), to compute a p value and accept or
gain and loss calls from the METABRIC breast cancer X
1000
dataset using ABSOLUTE were provided to us upon re- Ni > P
reject the null hypothesis, denoted as 1 1000 .
quest from Shukla et al. [44]. The discrete representation
In a similar manner, we tested whether mean arm-
was used because it is most fitting to describe arm-level
wide gene expression levels of each of the 39 chromo-
changes, which may be either gained (1) or lost (− 1) by
some arms in a sample are informative for predicting
definition, rather than continuous GISTIC data, which is
the sample’s tissue of origin, compared to the back-
better suited for studying targeted focal copy number
ground of any random aggregation of gene expression
alterations.
into 39 groups. Therefore, we designed a permutation
For each of the 39 chromosomal arms, we defined an
test with 1000 iterations. In each iteration, we quantified
arm imbalance score for a set of cancer types sharing
how accurately we can predict tissue of origin based on
the same tissue of origin (or a singular cancer type), by
randomly aggregating genes into 39 groups with similar
computing the difference between the frequency of gains
sizes as that of chromosomal arm assignment. We evalu-
and losses. Formally:
ated the number of times (out of 1000) in which the
Arm Imbalance
X Score Ai ; T j X multiclass prediction accuracies of the shuffled predictor
I sG ðAi Þ− I sL ðAi Þ (Ni,with randon aggregation of genes into 39 groups)
samples s in T j samples s in T j exceeded the original predictor (P, with the aggregation
¼ of genes to 39 groups by chromosomal arm), to derive
Number of samples in T j
X
1000
where Ai is chromosomal arm i (of 1 to 39 chromo- Ni > P
somal arms), Tj is the tissue of origin of all tumor types an empirical permutation p value, denoted as 1
1000 .
arising from tissue j, and the indicators IsG(Ai) and
IsL(Ai) are defined by: Quantile normalization of gene expression and
methylation values for cross tissue comparison and
1; if samples s has a gain of arm Ai
I sG ðAi Þ ¼ visualization
0 otherwise
To enable side-by-side comparison and visualization of
the arm imbalance scores with mean chromosomal arm
1; if samples s has a loss of arm Ai
I sL ðAi Þ ¼ mean gene expression levels in different normal tissues
0 otherwise
(and likewise in different cancers), the gene expression
Hence, arms that are more frequently gained are and arm-imbalance values need to be on the same scale.
assigned positive scores, while arms that are more fre- Hence, we additionally quantile-normalized the mean
quently lost are assigned negative scores. Arms that are gene expression levels using the chromosomal arm im-
neither gained nor lost and arms where the frequency of balance distribution as reference, to enable visualization
gains and losses is comparable are assigned neutral by generating similar expression distribution acrossPatkar et al. Genome Medicine (2021) 13:93 Page 4 of 16
different tissues. We applied the same approach to quan- 1. Chromosomal arm imbalance score computed
tile normalized chromosome arm-wide mean methyla- across all cancer types originating from the same
tion levels in normal tissues to visualize normal tissue
methylation against normal gene expression in each 2. Mean arm-wide normal gene expression across all
tissue. genes and all normal samples belonging to the same
tissue.
Obtaining chromosome-wide distribution of relevant 3. Mean arm-wide cancer gene expression across all
oncogenes and tumor suppressors in each cancer type genes and all samples originating from the same
We obtained a comprehensive list of known (or poten- tissue
tial) oncogenes and tumor-suppressors driving each can- 4. Arm level oncogene-tumor suppressor imbalance
cer type from supplementary data of a recent pan-cancer score across all cancer types originating from the
study conducted by Bailey et al. [13]. This list was ob- same tissue
tained from supervised machine learning predictions
based on features derived from mutation, copy number, Cophenetic distances between any two hierarchical
gene expression, and methylation changes observed in clusterings were calculated using “cophenetic” utility
genes across different cancer types. Given a cancer type, function available in R.
the oncogenes-tumor suppressor imbalance score for
each arm in a given cancer type (or collection of cancer Results
types) was formally defined as follows: Correlation between frequencies of cancer type-specific
Oncogene-tumor suppressor imbalance score = frac- aneuploidies and mean chromosome arm-wide gene
tion of driver genes on the arm that are oncogenes − the expression levels of their normal tissue of origin
fraction of driver genes on the arm that are tumor- Taylor and colleagues [11] comprehensively recorded for
suppressors. each tumor sample in the TCGA if a specific chromo-
some arm was gained or lost (while accounting for the
Normal and cancer tissue of origin classification and baseline tumor ploidy). We used this data to compute
clustering the mean chromosome arm imbalance score of each
We classified normal (and likewise, cancer) samples arm in a given cancer type (or collection of cancer types)
using the chromosomal-arm level expression of those emerging from the same tissue of origin. In short, this
samples. For each sample, we calculated the mean gene score measures the difference between the frequency of
expression level of the genes in each chromosomal arm. gains and losses of a specific chromosome arm (see the
This resulted in 39 unique features per sample (one per “Methods” section). As a first step, we validated previous
arm). We then performed K-Nearest-Neighbors (KNN observations by showing that the mean gene expression
based on Euclidean distances, with K = 5, the value for levels over all genes and all samples from the same
which the best performance was observed for cancer chromosome arms and cancer type included in the
type classification from K = 3, 5, 7) classification with a TCGA database, respectively, positively correlate with
Leave-One-Out cross validation (LOOCV), aiming to the corresponding arm imbalance scores (Fig. 1a, Add-
classify each sample based on the 39 arm level features itional file 3: Table S3, Additional file 4: Table S4). This
and calculate the resulting accuracy (percentage of cor- analysis confirmed that genomic copy number alter-
rectly classified samples in the LOOCV). An analogous ations in cancer genomes directly affect gene expression
approach was taken for classification of tissue of origin levels. We additionally computed chromosome arm im-
based on methylation data. Additionally, to rule out po- balance scores in an independent cohort of 1980 breast
tential confounding batch effects in gene expression data cancer patients (METABRIC) [44] with publicly available
and the leave one out cross-validation procedure used, copy number and gene expression data and found con-
we re-estimated overall KNN performance using 5-fold sistent trends (Additional file 5: Figure S1A and S1B).
cross validation (Additional file 13: Table S8). After having validated this correlation, we next com-
Visualization of the clusters of normal and cancer sam- puted the mean expression levels over all genes and all
ples was performed using Rtsne package and default samples from the same chromosome arm and normal
hyper-parameter settings [45]. For performing hierarch- tissue, respectively, from the GTEx database. These
ical clustering of different tissue types, each tissue type values were then correlated with the mean chromosome
is summarized as a vector of 39 features; one for each arm imbalance scores of respective cancer types emer-
arm. Four different hierarchical clustering analyses were ging from that tissue. Figure 1b plots a heatmap with
performed using “hclust” utility function available in R. rows indicating chromosome arms. The chromosome
For each hierarchical clustering, a different set of 39 fea- arm-wide mean expression levels in each normal tissue
tures was used. They are systematically listed: and corresponding arm imbalance scores in associatedPatkar et al. Genome Medicine (2021) 13:93 Page 5 of 16 Fig. 1 (See legend on next page.)
Patkar et al. Genome Medicine           (2021) 13:93                                                                                                    Page 6 of 16

 (See figure on previous page.)
 Fig. 1 Correlations of chromosome arm-wide gene expression levels and chromosome arm-wide aneuploidies. a Correlation plot of chromosome arm-wide
 gene expression levels in cancers and patterns of chromosome arm-wide gains and losses in cancers reported in the TCGA database. Bar plot represent the
 Spearman rank correlations for each cancer type independently. The height of the bar reflects the correlation coefficient, and the size of the circle the
 significance. Size of 2 indicates p value < 0.01, size of 1 indicates p value < 0.1, and size of 0 indicates p value < 1. b Correlation of chromosome arm-wide gene
 expression levels based on the GTEx database (left column) with chromosome arm-wide aneuploidies in associated cancer types based on data reported in the
 TCGA database (right column), respectively, for 19 tissue entities. The arm imbalance score is reflected in colors: red indicates more frequent gains compared to
 losses; blue indicates more frequent losses compared to gains. The hue of the colors indicates the frequency of copy number changes and the quantile
 normalized levels of mean chromosome arm-wide gene expression, respectively. Barplots shown beside each heatmap are the Spearman rank correlations
 (horizontal bars indicate comparisons for each arm independently; vertical bars indicate comparisons for each tissue independently). A size of 2 indicates p value
 < 0.01, a size of 1 indicates p value < 0.1, and size of 0 indicates p values < 1. TCGA study abbreviations: ACC, adrenocortical carcinoma; BLCA, bladder urothelial
 carcinoma; BRCA, breast invasive carcinoma; CESC, cervical squamous cell carcinoma and endocervical carcinoma; CHOL, cholangiocarcinoma; COAD, colon
 adenocarcinoma; DLBC, diffuse large B cell lymphoma; ESCA, esophageal carcinoma; GBM, glioblastoma multiforme; HNSC, head and neck squamous cell
 carcinoma; KICH, kidney chromophobe; KIRC, kidney renal clear cell carcinoma; KIRP, kidney renal papillary carcinoma; LAML, acute myeloid leukemia; LGG, low-
 grade glioma; LIHC, liver hepatocellular carcinoma; LUAD, lung adenocarcinoma; LUSC, lung squamous cell carcinoma; MESO, mesothelioma; OV, ovarian serous
 cystadenocarcinoma; PAAD, pancreatic adenocarcinoma; PCPG, pheochromocytoma and paraganglioma; PRAD, prostate adenocarcinoma; READ, rectum
 adenocarcinoma; SARC, sarcoma; SKCM, skin cutaneous melanoma; STAD, stomach adenocarcinoma; TGCT, testicular germ cell tumors; THCA, thyroid
 carcinoma; THYM, thymoma; UCEC, uterine endometrial carcinoma; UCS, uterine carcinosarcoma; UVM, uveal melanoma

cancer types are juxtaposed and quantile normalized to                               detailed overview of the correlation signals for each tis-
the same scale for visualization and comparison (Add-                                sue (across all arms) and each arm (across all tissues) is
itional file 6: Table S5, Additional file 7: Table S6, Add-                          provided in Additional file 9: Figure S2 and Additional
itional file 8: Table S7).                                                           file 10: Figure S3, respectively. Furthermore, we separ-
   In general, chromosome arms that are most frequently                              ately plotted the correlations between normal arm level
altered are either predominantly gained or lost, across                              expression, cancer arm level expression and the arm im-
all samples of a cancer type. That is, the gain and loss                             balance scores for 5 cancer normal tissue pairs (Add-
frequencies of a chromosome do not cancel each other                                 itional file 11: Figure S4, Additional file 5: Figure S1
out, resulting in either positive or negative arm imbal-                             panels C and D). We additionally repeated this analysis
ance scores across most cancer types. However, there                                 for early stage tumors from the TCGA database (defined
are some notable exceptions (see for example chromo-                                 as tumors with AJCC stage classification of 0 or 1). Al-
some 13q which has a positive arm imbalance score only                               though the number of tumors available for analysis was
in gastrointestinal tumors). Nevertheless, the frequencies                           further reduced, a similar trend of weak, but predomin-
of gains and losses vary by tissue of origin and result in                           antly positive correlations was observed (Additional file
varying arm imbalance scores across cancer types.                                    12: Figure S5).
Among the frequently altered chromosome arms, we see                                    If certain chromosome arm aneuploidies might “hard-
that chromosome arms 13q, 18q, 10q, and 2p have the                                  wire” the chromosome arm-wide gene expression levels
strongest correlations between their normal tissue-                                  specific to their normal tissues, one should be able to
specific mean expression levels and arm imbalance                                    classify the tissue of origin of normal and cancer tissue
scores, and these correlations are positive. When looking                            samples just based on the mean chromosome arm-wide
at each tissue individually (columns of Fig. 1b), we see                             gene expression levels of each of the 39 arms. To test
the strongest correlations between the normal                                        this hypothesis, we obtained the mean gene expression
chromosome-wide mean expression levels and arm im-                                   levels for each arm in each normal tissue sample in
balance scores for brain, colon, and kidney tissues, and                             GTEx (and likewise for each cancer sample in TCGA)
these correlations are also positive. Although the statis-                           resulting in 39 unique features. Then K-Nearest Neigh-
tical power to assess the significance of these individual                           bors (K-NN) multi-class classification was applied with
correlations is limited, we see that a majority of correla-                          leave-one-out cross validation (see the “Methods” sec-
tions (both at tissue and arm level) are positive. We eval-                          tion for more details). We find that mean chromosome
uated the overall probability of getting so many positive                            arm-wide gene expression can effectively classify the tis-
correlations (both at the arm and tissue level), using a                             sue of origin of both normal and cancer samples from
permutation test. To this end, we repeated 1000 times of                             GTEx and TCGA, respectively, and that the perform-
randomly shuffling the chromosomal arm assignments                                   ance is generally better for normal tissues (Fig. 2a, Add-
(rows of Fig. 1b) and another 1000 for the tissue assign-                            itional file 13: Table S8, Additional file 14: Table S9).
ments (columns of Fig. 1b). We found that similar or                                 The resulting accuracy was better for tissues with higher
higher correlations were found for the shuffled data in                              case numbers, as expected for KNN analyses. Further-
less than 5% of the cases, yielding a permutation p < 0.05                           more, these results could never be obtained when the
for both arm-wise and tissue-wise correlations. A more                               chromosome assignment of genes was randomly shuffled
Patkar et al. Genome Medicine         (2021) 13:93                                                                                              Page 7 of 16

 Fig. 2 Normal tissue and cancer type classification based on chromosome arm-wide gene expression levels. a K-Nearest-Neighbors (KNN) multi-class
 analysis: predictions made in a leave one out fashion (i.e., the accuracy). Height of bars indicates the fraction of correctly predicted cases. The numbers
 on top of each bar indicate the number of samples available for each class. b, c t-Distributed Stochastic Neighbor Embedding (t-SNE) dimensionality
 reduction analysis of chromosome arm-wide mean gene expression levels in normal tissues (b) and in cancers (c)

(by repeating 1000 shuffling of the chromosomal assign-                          because of the leave-one-out cross validation technique,
ments of genes, permutation test p value < 0.001). To                            we performed a fivefold cross validation analysis con-
rule out the possibility that the results are inflated                           firming our results (Additional file 15: Table S10). To
Patkar et al. Genome Medicine        (2021) 13:93   Page 8 of 16

 Fig. 3 (See legend on next page.)
Patkar et al. Genome Medicine            (2021) 13:93                                                                                                        Page 9 of 16

 (See figure on previous page.)
 Fig. 3 Distribution of cancer driver genes and chromosome arm-wide aneuploidies. For each set of cancer types with shared tissue of origin, we plot: a the
 fraction of driver genes on each arm that are considered to be tumor suppressors (left column) and the frequency of losses reported for the arm. The bluer the
 color, the higher the tumor suppressor burden (and likewise for the frequency of losses. b The fraction of driver genes on each arm that are considered to be
 oncogenes (left column) and the frequency of gains reported for the arm (right column). The redder the color, the higher the oncogenic burden (and likewise for
 frequency of gains). Barplots shown beside each heatmap are the Spearman rank correlations (horizontal bars indicate comparisons for each arm independently;
 vertical bars indicate comparisons for each tissue independently). The size of bubbles indicates the p value. A size of 2 indicates p value < 0.01, a size of 1 indicates
 p value < 0.1, and size of 0 indicates p values < 1. As seen at the tissue level, correlation between tumor suppressor burden and frequency of losses is almost
 always positive (empirical p value after randomly shuffling data < 0.05), whereas that is not the case for gains

 Fig. 4 Hierarchical cluster analysis of cancers and normal tissues. a Cancer chromosome arm-wide gains and losses, b cancer mean chromosome
 arm-wide gene expression, c mean chromosome arm-wide gene expression of normal tissues, and d chromosome arm-wide imbalance of tumor
 suppressor genes and oncogenes. Note that the clusters are similar in a–c, yet different in d
Patkar et al. Genome Medicine        (2021) 13:93   Page 10 of 16

 Fig. 5 (See legend on next page.)
Patkar et al. Genome Medicine (2021) 13:93 Page 11 of 16
(See figure on previous page.)
Fig. 5 Correlation of chromosome arm-wide methylation levels and chromosome arm-wide gene expression. a For each tissue with available
normal methylation data, we plot the mean arm-wide methylation levels of each arm (left column) and the mean arm-wide expression levels of
each arm (right column). The mean expression and methylation values are quantile normalized to the same scale (see the “Methods” section) for
comparison and visualization. For left column: the redder the color, the higher the arm-wide methylation level; the bluer the color, the lower the
arm-wide methylation level. For right column: the redder the color, the higher the arm-wide expression level; the bluer the color, the lower the
arm-wide expression levels. Bar plots besides the heatmap are Spearman rank correlations (horizontal bars indicate comparison for each arm
independently; vertical bars indicate comparison for each tissue independently). The size of bubbles indicates the p value. A size of 2 indicates p
value < 0.01, a size of 1 indicates p value < 0.1, and size of 0 indicates p values < 1. As seen at the tissue level, correlation between arm-wide
methylation levels and expression levels is consistently negative (empirical p value after random shuffling the data < 0.05). b Leave One Out
Cross-Validation Accuracy of predicting each tissue entity based on chromosome wide mean methylation levels of each sample. The height of
the bar indicates the accuracy quantified as fraction of samples correctly classified. The numbers on top of each bar indicate the number of
samples from a given tissue. c tSNE plot depicting the clustering of different tissue samples by chromosome arm-wide mean methylation levels
visualize these classifications, we used t-distributed Sto- chromosome arm-wide imbalance in the fraction of onco-
chastic Neighbor Embedding (t-SNE) dimensionality re- genes and tumor suppressor genes originating from each
duction of the 39-dimensional feature space. We found tissue (Fig. 4d). For ease of visualization, the tissues were
that samples from the same normal tissues cluster partitioned and colored by 4 distinct clusters obtained
closely in most cases (Fig. 2b), but to a lesser extent for from each hierarchical clustering separately. To further
cancer entities (Fig. 2c). The separate sub-clusters within systematically quantify the similarities between two clus-
each tissue correspond to the different anatomical re- terings, we computed the Spearman correlation between
gions of the tissues that were sampled from GTEx. cophenetic distances defined by each clustering. We found
Overall, these results suggest that certain chromosomal that the cophenetic distances among tissues based on
aneuploidies acquired by tumors might hardwire tissue- chromosomal arm imbalance scores (Fig. 4a) and mean
specific gene expression levels of their tissue of origin. chromosome arm-wide normal gene expression levels
(Fig. 4c) are highly similar (Spearman correlation r = 0.61,
Correlation between frequencies of cancer type-specific p value = 2.2E−16). Likewise, a strong Spearman correl-
aneuploidies and the tissue-specific oncogenes and ation (r = 0.52, p value = 2.997E−13) was obtained when
tumor suppressors that reside on the respective comparing cophenetic distances based on arm imbalance
chromosomes scores (Fig. 4a) and mean chromosome arm-wide cancer
Recent studies have looked at the connection between gene expression levels (Fig. 4b). However, the Spearman
specific chromosomal gains and losses and driver genes correlation between cophenetic distances of tissues based
located on these chromosomes for specific cancer types on arm imbalance scores (Fig. 4a) and distribution of
[12, 46]. Here, we revisited this connection. For each tis- tissue-specific oncogenes and tumor suppressor genes
sue analyzed in this study, the correlation between the fre- (Fig. 4d) is − 0.09, with a p value = 0.2067. While the list
quency of losses in associated cancer types and the of tissue-specific cancer driver genes is still incomplete,
fraction of drivers that are tumor suppressors is consist- these results suggest that copy number changes in resident
ently strong and positive (Fig. 3a, permutation test with driver genes may not be sufficient to explain the observed
1000 random shufflings of arms and tissue pairing of the tissue-specificity of chromosomal aneuploidies in cancers.
values in Fig. 3a, p value < 0.05; see the “Methods” section,
Additional file 16: Table S11, Additional file 17: Table Samples from the same normal tissue also cluster
S12, Additional file 18: Table S13, Additional file 19: Table together by their mean chromosome arm-wide
S14). The strongest of these correlations were observed methylation levels
for chromosome arms 17p, 17q, and 9p. The direction of A possible mechanism regulating chromosome-wide gene
correlation between gains of chromosome arms and the expression levels in normal tissues is DNA methylation.
location of tissue-specific oncogenes is, however, less clear Therefore, in a fashion similar to Fig. 1b, we explored
(Fig. 3b, permutation test p value after random shuffling> whether mean chromosome arm-wide methylation levels
0.05, Additional file 6: Table S5). To explore this further, correlate with the mean chromosome arm-wide gene ex-
we performed four hierarchical clustering analyses of tis- pression levels. The Gene Expression Omnibus (GEO)
sues based on (i) chromosomal arm imbalance scores in database provides genome-wide methylation levels for 11
associated cancer types (Fig. 4a), (ii) mean chromosome different tissue types, all obtained using the same Illumina
arm-wide gene expression levels in associated cancer types 450K platform (Additional file 2: Table S2). Based on
(Fig. 4b), (iii) mean chromosome arm-wide gene expres- these data, we analyzed chromosome arm-wide mean
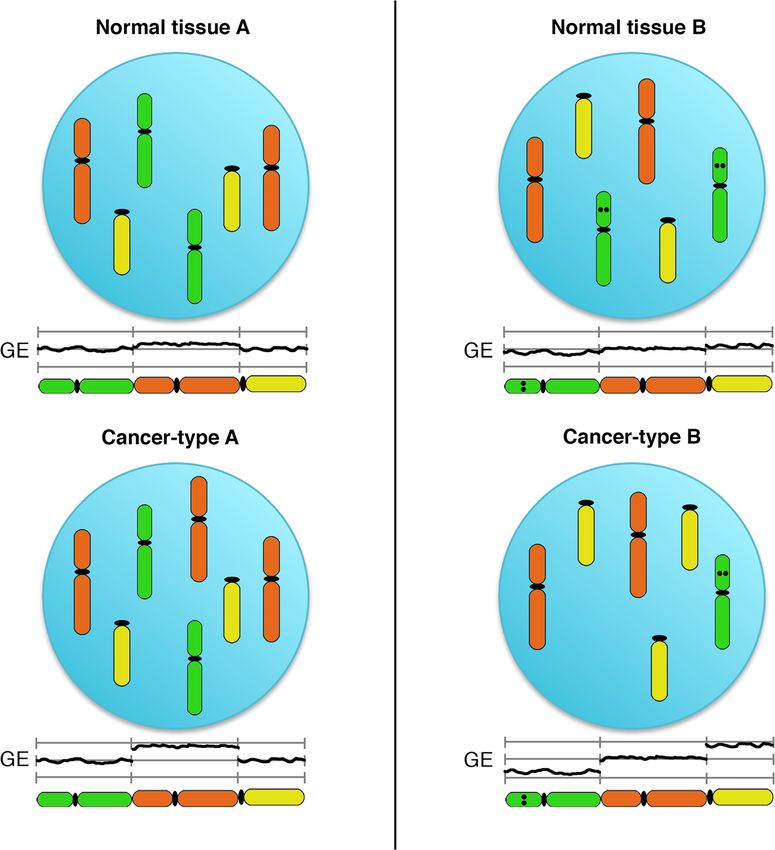
sion levels in normal tissues (Fig. 4c), and (iv) methylation patterns for 11 tissues from 765 samplesPatkar et al. Genome Medicine (2021) 13:93 Page 12 of 16 (Methods, Additional file 20: Table S15). For each tissue, chromosome arm-wide mean methylation levels. The we observed that differences in mean methylation levels clustering of samples by tissue is visualized using t-SNE across chromosome arms within a tissue are consistently dimensionality reduction. (Fig. 5b, c, Additional file 21: negatively correlated with corresponding mean arm-wide Table S16). Tissues with very few samples had poor classi- gene expression levels (permutation test with 1000 ran- fication accuracy as expected from KNN. These results dom shufflings of arms and tissue pairing of the values, p suggest that normal chromosome arm-wide methylation value < 0.05, see the “Methods” section) (Fig. 5a, Add- levels may play some part in regulating the transcriptional itional file 7: Table S6). However, for a single arm across output of each chromosome arm. tissues, the directionality of correlations is less consistent. This could potentially be due to the small number of tis- Discussion sues analyzed. Furthermore, an individual sample-level Chromosomal aneuploidies are a defining feature of tu- classification analysis using the KNN algorithm revealed mors of epithelial origin. These aneuploidies result in that one can predict (in leave one out cross-validation) the tumor type-specific genomic imbalances [1, 4–6, 10]. normal tissue of origin of individual samples just based on As of yet, there is no sufficient explanation for this Fig. 6 Schematic presentation of the results. Genes on the red chromosomes are expressed at slightly higher levels compared to other chromosomes in normal tissue A, whereas in normal tissue B, the yellow chromosomes shows increased tissue-specific expression and genes on the green chromosome are expressed at lower levels. This results in a subtle increase or decrease in chromosome arm-wide gene expression levels, respectively. The acquisition of chromosomal aneuploidies in the respective cancer types (gain of the red chromosome in cancer type A and the yellow chromosome in cancer type B, accompanied by the loss of the green chromosome in cancer type B) amplifies this effect and provides the genetic basis of “hard-wiring” tissue-specific chromosome arm-wide gene expression levels as the basis for clonal expansion. The dots on the green chromosome reflects the presence of a tumor suppressor gene
Patkar et al. Genome Medicine   (2021) 13:93                                                                               Page 13 of 16

specificity [6]. In this work, we systematically compared    Furthermore, we restricted ourselves to external data
the frequencies of chromosome arm gains and losses in        sources for normal tissue expression and methylation ra-
different cancer types to the mean chromosome arm-           ther than use adjacent normal tissue samples from the
wide gene expression levels in normal tissues of origin      TCGA. This was mainly due to incomplete availability of
and distribution of known or implicated tissue-specific      methylation and expression of normal adjacent to tumor
oncogenes/tumor suppressors across chromosome                samples for many cancer types and the presence of stro-
arms. Our analysis revealed a complex picture of fac-        mal and immune cell contamination in these tissues [55,
tors driving frequent chromosome arm copy number             56]. Secondly, identification of existing and potentially
changes in specific cancer types. Specifically, we notice    new cancer type-specific oncogenes and tumor suppres-
recurrent losses in chromosome arms in cancer types          sors was previously done by combining evidence from
where tissue-specific tumor suppressors reside, suggest-     multi-omic sources into one prediction score using su-
ing that these losses broadly target these driver genes.     pervised machine learning [13]. However, this list is still
However, the targets of recurrent tissue-specific            incomplete and the mechanism of action of many of
chromosomal gains are less clear. While it is possible       these genes in different cancer types is not completely
that these chromosomal gains are targeting yet               understood. Thirdly, since we were exploring correlation
unidentified oncogenes, our analysis of normal               patterns across different tissues and cancer types, it is
chromosome-wide gene expression and methylation              likely that more significant associations would be ob-
data suggests an alternative paradigm in which these al-     served in arms with specific, high-intensity trends of ei-
terations instead aim to hardwire gene expression levels     ther gain or loss compared to arms that are less
of normal tissue origin. This notion is further sup-         frequently altered.
ported by recent observations across multiple cancer
types where oncogenes were found to be preferentially        Conclusions
activated via extra-chromosomal DNA [47].                    In summary, our data analysis suggests that chromo-
  The functional implications of many genes that are         some aneuploidies could be potentially involved in the
affected by these alterations remain incompletely under-     maintenance of gene expression levels characteristic of
stood. We previously showed experimentally that the          the normal tissue of origin of cancers, in addition to tar-
gain of chromosome 13 in colorectal cancer activates         geting cancer type-specific driver genes (Fig. 6).
both Notch and Wnt signaling [48] and that the acquisi-
tion of extra copies of chromosome 7 in normal colon         Supplementary Information
cells results in upregulation of cancer-associated path-     The online version contains supplementary material available at https://doi.
ways [49], which could imply that tissue type-specific       org/10.1186/s13073-021-00905-y.

chromosome arm-wide gene expression levels promote
                                                              Additional file 1: Table S1. Mapping of cancer type barcodes from
cellular fitness. Of note, Sack et al. [50] have demon-       TCGA to normal tissue of tumor origin in external data sources.
strated that the inclusion of tissue-specific growth pro-     Additional file 2: Table S2. Manually curated DNA methylation
moting genes strengthens the correlation between              datasets of different non cancerous tissues.
chromosome arm loss/gain ratios and the proliferation-        Additional file 3: Table S3. Mean gene expression levels of each
driving capability of each chromosome arm in breast           chromosome arm in each cancer type (from TCGA).
and pancreatic cancers. Graham and colleagues reported        Additional file 4: Table S4. Chromosome arm imbalance score (i.e.,
                                                              frequency of gains - frequency of losses) of each chromosome arm in
a general role of copy number alterations and metabolic       each cancer type.
selection pressure [51]. Despite the ubiquitous presence      Additional file 5: Figure S1. Scatter plots correlating chromosome arm
of chromosomal aneuploidies in most solid tumors,             imbalance scores (X axes) with arm-wide expression levels in cancer
there are also several publications pointing to a reduc-      (upper row, Y axes) and normal tissue (lower row, Y-axes).
tion of cellular fitness as a consequence of general aneu-    Additional file 6: Table S5. Mean gene expression levels of each
                                                              chromosome arm in each normal tissue (from GTEx).
ploidy in model systems such as yeast, immortalized
                                                              Additional file 7: Table S6. Chromosome arm imbalance score (i.e.,
murine embryonic fibroblasts, and typically near-diploid      frequency of gains - frequency of losses) of each chromosome arm in
cancer cells engineered to harbor specific trisomies [52–     cancer types grouped by normal tissue of tumor origin.
54], so the functional implications of these events re-       Additional file 8: Table S7. Mean gene expression levels of each
mains an open challenging question.                           chromosome arm in cancer types grouped by normal tissue of tumor
                                                              origin (from TCGA).
  There are some limitations specific to the data analysis
                                                              Additional file 9: Figure S2. Scatter plots showing the relationship
conducted in this study. Firstly, our analyses comparing      between chromosome arm imbalance scores in cancer (Cancer_AN) and
cancer types to normal tissues were restricted to tissues     normal gene expression (Normal_GE) for each tissue/tumor type.
where data was measured in a homogeneous fashion on           Additional file 10: Figure S3. Scatter plots showing the relationship
the same platform and publicly available (i.e., GTEx for      between chromosome arm imbalance scores in cancer (Cancer_AN) and
                                                              normal gene expression (Normal_GE) for each chromosome arm.
gene expression and GEO for methylation).
Patkar et al. Genome Medicine (2021) 13:93 Page 14 of 16
Additional file 11: Figure S4. Scatter plots depicting correlation of S3 and S4 are available in Additional file 6: Table S5, Additional file 7: Table
chromosome arm-wide gene expression levels in normal tissues based S6, Additional file 8: Table S7. Clinical stage data for reproducing
on the GTEx database with chromosome arm wide aneuploidies and cor- Supplementary Figure S5 are publicly available from the TCGA Clinical Data
responding chromosome arm-wide cancer gene expression levels in as- Resource (TCGA-CDR) available at https://gdc.cancer.gov/about-data/
sociated cancer types of 4 tissues (Kidney, Brain, Cervix and Colon). publications/pancanatlas [23]. Source data for reproducing Fig. 2 are
available in Additional file 13: Table S8 and Additional file 14: Table S9.
Additional file 12: Figure S5. Correlation of chromosome arm-wide Source data for reproducing Fig. 3 are available in Additional file 16: Table
gene expression levels based on the GTEx database (left column) with S11, Additional file 17: Table S12, Additional file 18: Table S13, Additional file
chromosome arm wide aneuploidies in associated cancer types diag- 19: Table S14. Source data for reproducing Fig. 4 are available in Additional
nosed at early stages based on data reported in the TCGA (right column), file 6: Table S5, Additional file 7: Table S6, Additional file 8: Table S7,
respectively. Additional file 16: Table S11 and Additional file 18: Table S13. Source data for
Additional file 13: Table S8. Mean gene expression level (in RPKM) of reproducing Fig. 5 are available in Additional file 20: Table S15 and
each chromosome arm in each normal tissue sample (from GTEx). Additional file 21: Table S16.
Additional file 14: Table S9. Mean gene expression level (in RPKM) of
each chromosome arm in each cancer sample (from TCGA). Declarations
Additional file 15: Table S10. Five fold cross-validation accuracy of
KNN classifier based on 39 chromosome arm-wide expression features. Ethics approval and consent to participate
Not applicable.
Additional file 16: Table S11. Fraction of all cancer driver genes on
each chromosome arm that are considered as oncogenes in cancer types
from a given tissue of origin. Consent for publication
Not applicable.
Additional file 17: Table S12. Frequency of gains of each
chromosome arm in cancer types grouped by normal tissue of tumor
origin. Competing interests
Yuri Lazebnik is an employee of Lerna Consulting. The remaining authors
Additional file 18: Table S13. Fraction of all cancer driver genes on
declare that they have no competing interests.
each chromosome arm that are considered as tumor suppressors in
cancer types from a given tissue of origin.
Author details
Additional file 19: Table S14. Frequency of losses of each 1
Cancer Data Science Laboratory, Center for Cancer Research, National
chromosome arm in cancer types grouped by normal tissue of tumor Cancer Institute, NIH, Bethesda, MD 20892, USA. 2Department of Computer
origin. Science, University of Maryland, College Park, USA. 3Section of Cancer
Additional file 20: Table S15. Mean methylation levels of each Genomics, Center for Cancer Research, National Cancer Institute, NIH,
chromosome arm in each normal tissue. Bethesda, MD 20892, USA. 4National Center for Biotechnology Information,
NIH, Bethesda, MD 20892, USA. 5Gastrointestinal and Pancreatic Oncology
Additional file 21: Table S16. Mean methylation levels (beta values) of
Team, Institut D’Investigacions Biomèdiques August Pi i Sunyer, (IDIBAPS),
each chromosome arm in each normal tissue sample.
Hospital Clínic of Barcelona, CIBEREHD, 08036 Barcelona, Spain. 6Section for
Translational Surgical Oncology and Biobanking, Department of Surgery,
Acknowledgements University Medical Center Schleswig Holstein, Campus Lübeck, Lübeck,
This manuscript is dedicated to the late Angelika Amon, who contributed Germany. 7Department of General, Visceral and Pediatric Surgery, University
substantially to our understanding of aneuploidy in cancer. Medical Center, Göttingen, Germany. 8Department of Genetics and
The authors are indebted to Drs. Thomas Cremer, Marion Cremer, Reinhard Pathology, Albert Einstein College of Medicine, Bronx, NY, USA. 9Lerna
Ebner, Kenneth C. Carter, W. Michael Kuehl, Javed Khan, Alejandro Schäffer, Consulting, LLC, New Haven, CT 06511, USA. 10Division of Cancer Treatment
and E. Michael Gertz for valuable comments on the manuscript and to and Diagnosis, National Cancer Institute, NIH, Bethesda, MD 20892, USA.
11
Buddy Chen for editorial assistance. The results published here are in part Department of Oncology and Pathology, CancerCenter Karolinska,
based upon data generated by the TCGA Research Network (http:// Karolinska Institute and University Hospital, Stockholm, Sweden.
cancergenome.nih.gov/) and the Genotype-Tissue Expression (GTEx) Project
(https://www.gtexportal.org/home/). Received: 5 January 2021 Accepted: 6 May 2021
Authors’ contributions
Statistical analysis and methods development: SP, NA, YH, ER. Data generation References
as the foundation for the hypothesis: KHH, DH, JC, DB, MB, WDC, RL, DW, DW, 1. Knuutila S, Autio K, Aalto Y. Online access to CGH data of DNA sequence
AL, RB, GE, YL, BMG, JG, MG, CM, MJD, JKH, GA. Preparation of first manuscript copy number changes. Am J Pathol. 2000;157(2):689. https://doi.org/10.101
draft: SP, KHH, NA, ER, TR. Conception of hypothesis: TR. All authors read and 6/S0002-9440(10)64579-8.
approved the final manuscript. 2. Knutsen T, Gobu V, Knaus R, Padilla-Nash H, Augustus M, Strausberg RL,
et al. The interactive online SKY/M-FISH & CGH database and the Entrez
Funding cancer chromosomes search database: linkage of chromosomal aberrations
Funding was provided by the Intramural Research Program of the National with the genome sequence. Genes Chromosomes Cancer. 2005;44(1):52–64.
Cancer Institute/NIH. DH and RB were supported by the Deutsche Krebshilfe, https://doi.org/10.1002/gcc.20224.
GE through the Deutsche Forschungsgemeinschaft, SP and NA through the 3. Myllykangas S, Bohling T, Knuutila S. Specificity, selection and significance of
NCI/University of Maryland Graduate Partnership Program, and DB by a gene amplifications in cancer. Semin Cancer Biol. 2007;17(1):42–55. https://
Wellcome Trust/NIH PhD Studentship. Open Access funding provided by the doi.org/10.1016/j.semcancer.2006.10.005.
National Institutes of Health (NIH). 4. Heim S, Mitelman F. Cancer Cytogenetics. Hoboken: Wiley; 2009.
5. Ried T. Homage to Theodor Boveri (1862-1915): Boveri’s theory of cancer as
Availability of data and materials a disease of the chromosomes, and the landscape of genomic imbalances
All data generated or analyzed during this study are included in this in human carcinomas. Environ Mol Mutagen. 2009;50(8):593–601. https://doi.
published article and its supplementary information files. Source data for org/10.1002/em.20526.
reproducing Fig. 1 panel A, Supplementary Figure S1 panels A and C is 6. Ben-David U, Amon A. Context is everything: aneuploidy in cancer. Nat Rev
available in Additional file 3: Table S3 and Additional file 4: Table S4. Source Genet. 2020;21(1):44–62. https://doi.org/10.1038/s41576-019-0171-x.
data for reproducing Supplementary Figure S1 panels B and D (the 7. Ried T, Heselmeyer-Haddad K, Blegen H, Schrock E, Auer G. Genomic
METABRIC cohort) were made available to us upon request from Shukla et al. changes defining the genesis, progression, and malignancy potential in
[44]. Source data for reproducing Fig. 1 panel B, Supplementary Figures S2, solid human tumors: a phenotype/genotype correlation. GenesPatkar et al. Genome Medicine (2021) 13:93 Page 15 of 16
Chromosomes Cancer. 1999;25(3):195–204. https://doi.org/10.1002/(SICI)1 expression, microRNA levels and insulin secretion in human pancreatic
098-2264(199907)25:33.0.CO;2-8. islets. Genome Biol. 2014;15:522.
8. Ried T, Knutzen R, Steinbeck R, Blegen H, Schrock E, Heselmeyer K, et al. 29. Harris RA, Shah R, Hollister EB, Tronstad RR, Hovdenak N, Szigeti R, et al.
Comparative genomic hybridization reveals a specific pattern of Colonic mucosal epigenome and microbiome development in children and
chromosomal gains and losses during the genesis of colorectal tumors. adolescents. J Immunol Res. 2016;2016:9170162.
Genes Chromosomes Cancer. 1996;15(4):234–45. https://doi.org/10.1002/ 30. Horvath S, Erhart W, Brosch M, Ammerpohl O, Von Schönfels W, Ahrens M,
(SICI)1098-2264(199604)15:43.0.CO;2-2. et al. Obesity accelerates epigenetic aging of human liver. Proc Natl Acad
9. Priestley P, Baber J, Lolkema MP, Steeghs N, de Bruijn E, Shale C, et al. Pan- Sci U S A. 2014;111:15538–43.
cancer whole-genome analyses of metastatic solid tumours. Nature. 2019; 31. Huynh JL, Garg P, Thin TH, Yoo S, Dutta R, Trapp BD, et al. Epigenome-wide
575(7781):210–6. https://doi.org/10.1038/s41586-019-1689-y. differences in pathology-free regions of multiple sclerosis-affected brains.
10. Beroukhim R, Mermel CH, Porter D, Wei G, Raychaudhuri S, Donovan J, et al. Nat Neurosci. 2014;17:121–30.
The landscape of somatic copy-number alteration across human cancers. 32. Li X, Zhou F, Jiang C, Wang Y, Lu Y, Yang F, et al. Identification of a DNA
Nature. 2010;463(7283):899–905. https://doi.org/10.1038/nature08822. methylome profile of esophageal squamous cell carcinoma and potential
11. Taylor AM, Shih J, Ha G, Gao GF, Zhang X, Berger AC, et al. Genomic and plasma epigenetic biomarkers for early diagnosis. PLoS one. 2014;9:e103162.
functional approaches to understanding cancer aneuploidy. Cancer Cell. 33. Maekawa R, Sato S, Yamagata Y, Asada H, Tamura I, Lee L, et al. Genome-
2018;33(4):676–89 e673. https://doi.org/10.1016/j.ccell.2018.03.007. wide DNA methylation analysis reveals a potential mechanism for the
12. Davoli T, Xu AW, Mengwasser KE, Sack LM, Yoon JC, Park PJ, et al. pathogenesis and development of uterine leiomyomas. PLoS One. 2013;8:
Cumulative haploinsufficiency and triplosensitivity drive aneuploidy patterns e66632.
and shape the cancer genome. Cell. 2013;155(4):948–62. https://doi.org/10.1 34. Murphy TM, Crawford B, Dempster EL, Hannon E, Burrage J, Turecki G, et al.
016/j.cell.2013.10.011. Methylomic profiling of cortex samples from completed suicide cases
13. Bailey MH, Tokheim C, Porta-Pardo E, Sengupta S, Bertrand D, Weerasinghe implicates a role for PSORS1C3 in major depression and suicide. Transl
A, et al. Comprehensive characterization of cancer driver genes and Psychiatry. 2017;7:249–58.
mutations. Cell. 2018;174(4):1034–5. https://doi.org/10.1016/j.cell.2018.07.034. 35. Roos L, Sandling JK, Bell CG, Glass D, Mangino M, Spector TD, et al. Higher
14. Upender MB, Habermann JK, McShane LM, Korn EL, Barrett JC, nevus count exhibits a distinct DNA methylation signature in healthy
Difilippantonio MJ, et al. Chromosome transfer induced aneuploidy results human skin: implications for melanoma. J Invest Dermatol. 2017;137:910–20.
in complex dysregulation of the cellular transcriptome in immortalized and 36. Shi J, Marconett CN, Duan J, Hyland PL, Li P, Wang Z, et al. Characterizing
cancer cells. Cancer Res. 2004;64(19):6941–9. https://doi.org/10.1158/0008-54 the genetic basis of methylome diversity in histologically normal human
72.CAN-04-0474. lung tissue. Nat Commun. 2014;5:3365.
15. Ried T, Hu Y, Difilippantonio MJ, Ghadimi BM, Grade M, Camps J. The 37. Vandiver AR, Irizarry RA, Hansen KD, Garza LA, Runarsson A, Li X, et al. Age
consequences of chromosomal aneuploidy on the transcriptome of cancer and sun exposure-related widespread genomic blocks of hypomethylation
cells. Biochim Biophys Acta. 1819;2012:784–93. in nonmalignant skin. Genome Biol. 2015;16:80–95.
16. Wolf M, Mousses S, Hautaniemi S, Karhu R, Huusko P, Allinen M, et al. High- 38. Viana J, Hannon E, Dempster E, Pidsley R, Macdonald R, Knox O, et al.
resolution analysis of gene copy number alterations in human prostate Schizophrenia-associated methylomic variation: molecular signatures of
cancer using CGH on cDNA microarrays: impact of copy number on gene disease and polygenic risk burden across multiple brain regions. Hum Mol
expression. Neoplasia. 2004;6(3):240–7. https://doi.org/10.1593/neo.03439. Genet. 2017;26:210–25.
17. Tsafrir D, Bacolod M, Selvanayagam Z, Tsafrir I, Shia J, Zeng Z, et al. 39. Wockner LF, Noble EP, Lawford BR, Young RMD, Morris CP, Whitehall VLJ,
Relationship of gene expression and chromosomal abnormalities in et al. Genome-wide DNA methylation analysis of human brain tissue from
colorectal cancer. Cancer Res. 2006;66(4):2129–37. https://doi.org/10.1158/ schizophrenia patients. Transl Psychiatry. 2014;4:e339–47.
0008-5472.CAN-05-2569. 40. Yamaguchi K, Huang Z, Matsumura N, Mandai M, Okamoto T, Baba T, et al.
18. Stingele S, Stoehr G, Peplowska K, Cox J, Mann M, Storchova Z. Global Epigenetic determinants of ovarian clear cell carcinoma biology. Int J
analysis of genome, transcriptome and proteome reveals the response to Cancer. 2014;135:585–97.
aneuploidy in human cells. Mol Syst Biol. 2012;8(1):608. https://doi.org/10.1 41. Dmitrijeva M, Ossowski S, Serrano L, Schaefer MH. Tissue-specific DNA
038/msb.2012.40. methylation loss during ageing and carcinogenesis is linked to
19. Durrbaum M, Storchova Z. Effects of aneuploidy on gene expression: implications chromosome structure, replication timing and cell division rates. Nucleic
for cancer. FEBS J. 2016;283(5):791–802. https://doi.org/10.1111/febs.13591. Acids Res. 2018;46(14):7022–39. https://doi.org/10.1093/nar/gky498.
20. Ried T, Meijer GA, Harrison DJ, Grech G, Franch-Exposito S, Briffa R, et al. The 42. Teschendorff AE, Marabita F, Lechner M, Bartlett T, Tegner J, Gomez-Cabrero
landscape of genomic copy number alterations in colorectal cancer and D, et al. A beta-mixture quantile normalization method for correcting probe
their consequences on gene expression levels and disease outcome. Mol design bias in Illumina Infinium 450 k DNA methylation data. Bioinformatics.
Aspects Med. 2019;69:48–61. https://doi.org/10.1016/j.mam.2019.07.007. 2013;29(2):189–96. https://doi.org/10.1093/bioinformatics/bts680.
21. Goldman MJ, Craft B, Hastie M, Repečka K, McDade F, Kamath A, et al. 43. Carter SL, Cibulskis K, Helman E, McKenna A, Shen H, Zack T, et al. Absolute
Visualizing and interpreting cancer genomics data via the Xena platform. quantification of somatic DNA alterations in human cancer. Nat Biotechnol.
Nat Biotechnol. 2020;38:675–8. 2012;30(5):413–21. https://doi.org/10.1038/nbt.2203.
22. Project G. GTEx portal. In: GTEx Analysis Release V6p (dbGaP Accession 44. Shukla A, Nguyen THM, Moka SB, Ellis JJ, Grady JP, Oey H, et al.
phs000424.v6.p1); 2017. Chromosome arm aneuploidies shape tumour evolution and drug
23. Liu J, Lichtenberg T, Hoadley KA, Poisson LM, Lazar AJ, Cherniack AD, et al. response. Nat Commun. 2020;11(1):449. https://doi.org/10.1038/s41467-02
An integrated TCGA pan-cancer clinical data resource to drive high-quality 0-14286-0.
survival outcome analytics. Cell. 2018;173(2):400–16 e411. https://doi.org/1 45. van der Maaten LJP, Hinton G. Visualizing data using t-SNE. J Mach Learn
0.1016/j.cell.2018.02.052. Res. 2008;9:2579–605.
24. Clough E, Barrett T. The Gene Expression Omnibus database. Methods Mol 46. Watkins TBK, Lim EL, Petkovic M, Elizalde S, Birkbak NJ, Wilson GA, et al.
Biol. 2016;1418:93–110. Pervasive chromosomal instability and karyotype order in tumour evolution.
25. Bonder MJ, Kasela S, Kals M, Tamm R, Lokk K, Barragan I, et al. Genetic and Nature. 2020;587(7832):126–32. https://doi.org/10.1038/s41586-020-2698-6.
epigenetic regulation of gene expression in fetal and adult human livers. 47. Kim H, Nguyen NP, Turner K, Wu S, Gujar AD, Luebeck J, et al.
BMC Genomics. 2014;15:860–73. Extrachromosomal DNA is associated with oncogene amplification and
26. Charlton J, Williams RD, Weeks M, Sebire NJ, Popov S, Vujanic G, et al. poor outcome across multiple cancers. Nat Genet. 2020;52(9):891–7. https://
Methylome analysis identifies a Wilms tumor epigenetic biomarker doi.org/10.1038/s41588-020-0678-2.
detectable in blood. Genome Biol. 2014;15:434–42. 48. Camps J, Pitt JJ, Emons G, Hummon AB, Case CM, Grade M, et al. Genetic
27. Farkas SA, Milutin-Gašperov N, Grce M, Nilsson TK. Genome-wide DNA amplification of the NOTCH modulator LNX2 upregulates the WNT/beta-
methylation assay reveals novel candidate biomarker genes in cervical catenin pathway in colorectal cancer. Cancer Res. 2013;73(6):2003–13.
cancer. Epigenetics. 2013;8:1213–25. https://doi.org/10.1158/0008-5472.CAN-12-3159.
28. Hall E, Volkov P, Dayeh T, JLoS E, Salö S, Eliasson L, et al. Sex differences in 49. Braun R, Ronquist S, Wangsa D, Chen H, Anthuber L, Gemoll T, et al. Single
the genome-wide DNA methylation pattern and impact on gene chromosome aneuploidy induces genome-wide perturbation of nuclearYou can also read