High turnover rates indicated by changes in the fixed N forms and their stable isotopes in Antarctic landfast sea ice
←
→
Page content transcription
If your browser does not render page correctly, please read the page content below
High turnover rates indicated by changes in the fixed N
   forms and their stable isotopes in Antarctic landfast sea
                              ice
       François Fripiat, Daniel M. Sigman, Guillaume Massé, Jean-Louis Tison

     To cite this version:
    François Fripiat, Daniel M. Sigman, Guillaume Massé, Jean-Louis Tison. High turnover rates indicated
    by changes in the fixed N forms and their stable isotopes in Antarctic landfast sea ice. Journal of Geo-
    physical Research. Oceans, Wiley-Blackwell, 2015, 120 (4), pp.3079 - 3097. �10.1002/2014jc010583�.
    �hal-01496696�

                                  HAL Id: hal-01496696
                https://hal.archives-ouvertes.fr/hal-01496696
                                      Submitted on 5 Jan 2022

    HAL is a multi-disciplinary open access            L’archive ouverte pluridisciplinaire HAL, est
archive for the deposit and dissemination of sci- destinée au dépôt et à la diffusion de documents
entific research documents, whether they are pub- scientifiques de niveau recherche, publiés ou non,
lished or not. The documents may come from émanant des établissements d’enseignement et de
teaching and research institutions in France or recherche français ou étrangers, des laboratoires
abroad, or from public or private research centers. publics ou privés.
                                              Copyright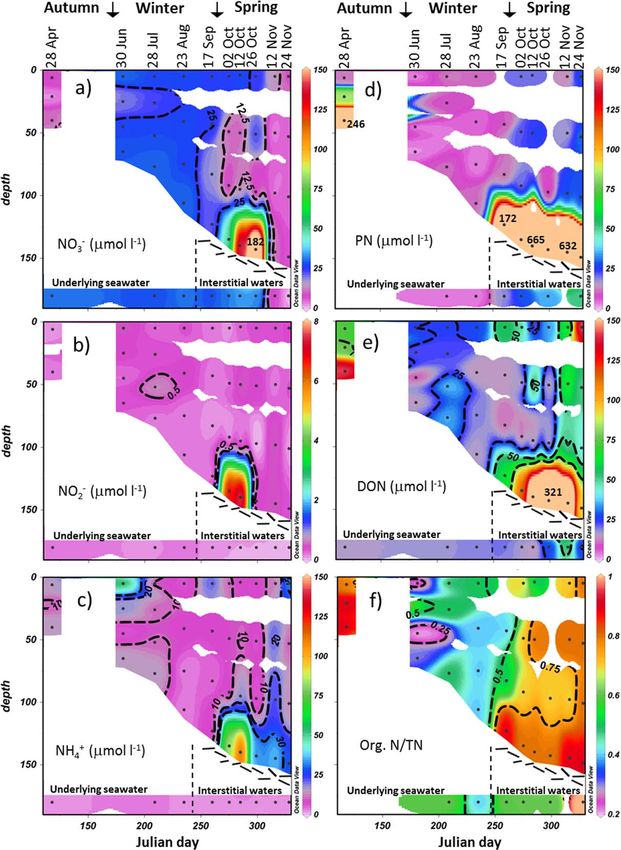
PUBLICATIONS
Journal of Geophysical Research: Oceans
RESEARCH ARTICLE                           High turnover rates indicated by changes in the fixed N forms
10.1002/2014JC010583
                                           and their stable isotopes in Antarctic landfast sea ice
Key Points:                                                                                         4,5, and Jean-Louis Tison1
                                           François Fripiat1,2,3, Daniel M. Sigman2, Guillaume Masse
 Spring accumulation of fixed
                                           1
  nitrogen above seawater values            Department of Earth and Environmental Sciences, Universit   e Libre de Bruxelles, Brussels, Belgium, 2Department of
 High turnover rates of fixed N pool,
                                           Geosciences, Princeton University, Princeton, New Jersey, USA, 3Now at Analytical, Environmental and Geo-Chemistry,
  including nitrate
 Light availability affects sea ice
                                           Earth Sciences Research Group, Vrije Universiteit Brussel, Brussels, Belgium, 4UMI3376 Takuvik—CNRS/Universit   e Laval,
  nitrate isotopes distribution            Quebec, Canada, 5Sorbonne Universit es, UPMC, Univ Paris 06, CNRS-IRD-MNHN, LOCEAN Laboratory, Paris, France

Supporting Information:
 Supporting Information S1
                                           Abstract We report concentration and nitrogen and oxygen isotopic measurements of nitrate, total dis-
 Supporting Information S2                solved nitrogen, and particulate nitrogen from Antarctic landfast sea ice, covering almost the complete sea-
 Table S1                                 sonal cycle of sea ice growth and decay (from April to November). When sea ice forms in autumn, ice algae
                                           growth depletes nitrate and accumulates organic N within the ice. Subsequent low biological activity in win-
Correspondence to:                         ter imposes minor variations in the partitioning of fixed N. In early spring, the coupling between nitrate
F. Fripiat,
ffripiat@ulb.ac.be
                                           assimilation and brine convection at the sea ice bottom traps a large amount of fixed N within sea ice, up to
                                           20 times higher than in the underlying seawater. At this time, remineralization and nitrification also acceler-
Citation:
                                           ate, yielding nitrate concentrations up to 5 times higher than in seawater. Nitrate d15N and d18O are both
Fripiat, F., D. M. Sigman, G. Mass
                                  e, and   elevated, indicating a near-balance between nitrification and nitrate assimilation. These findings require
J.-L. Tison (2015), High turnover rates    high microbially mediated turnover rates for the large fixed N pools, including nitrate. When sea ice warms
indicated by changes in the fixed N
forms and their stable isotopes in
                                           in the spring, ice algae grow through the full thickness of the ice. The warming stratifies the brine network,
Antarctic landfast sea ice, J. Geophys.    which limits the exchange with seawater, causing the once-elevated nitrate pool to be nearly completely
Res. Oceans, 120, 3079–3097,               depleted. The nitrate isotope data point to light limitation at the base of landfast ice as a central characteris-
doi:10.1002/2014JC010583.
                                           tic of the environment, affecting its N cycling (e.g., allowing for nitrification) and impacting algal physiology
                                           (e.g., as reflected in the N and O isotope effects of nitrate assimilation).
Received 18 NOV 2014
Accepted 23 MAR 2015
Accepted article online 31 MAR 2015
Published online 26 APR 2015
                                           1. Introduction
                                           Sea ice is permeated by a network of brine, inhabited by a sympagic (ice-related) community that is both
                                           taxonomically diverse and metabolically active [Thomas and Dieckmann, 2002; Deming, 2010]. These com-
                                           munities flourish within specific microhabitats created when sea ice forms and ages [Arrigo and Thomas,
                                           2004]. They play a significant but still poorly understood role in the biogeochemical dynamics of the polar
                                           oceans [Vancoppenolle et al., 2013], contributing to the primary production in ice-covered waters [Arrigo
                                           and Thomas, 2004], extending the productive season, and serving as the main food source for some high
                                           trophic level organisms [Flores et al., 2014, and references therein]. During sea ice growth and decay, sea ice
                                           continuously exchanges chemicals (e.g., nutrients and gases) both with the ocean and the atmosphere
                                           [Vancoppenolle et al., 2010; Lannuzel et al., 2011; Rysgaard et al., 2011; Fripiat et al., 2014]. Upon sea ice melt-
                                           ing, the release of stored biomass and nutrients has been suggested to seed and/or fertilize the ice edge
                                           bloom [Smith and Nelson, 1985; Lancelot et al., 2009; Galindo et al., 2014]. Still, little is known about the fate
                                           of sea ice-produced organic matter. It is uncertain whether this organic matter is preferentially respired
                                           within sea ice or in the surface waters after melting or is exported to the deep ocean or seafloor.
                                           Nitrogen (N) is required in large quantities by all organisms, and it is one of the most important nutrients
                                           for autotrophic growth. Several studies have reported evidence of an active microbial nitrogen cycle within
                                           sea ice: large variations in dissolved inorganic N concentration [Thomas et al., 2010]; rapid N assimilation (up
                                           to 80 mmol L21 h21) [Harrison et al., 1990]; high and variable concentrations of dissolved organic nitrogen
                                           (with estimated concentrations within the brine of up to 2.2 mmol L21) [Thomas et al., 2001]; rapid turnover
                                           of the protein pool (2.7 h) [Guglielmo et al., 2000]; large contributions of nitrification to nitrate assimilation
                                           (up to 70%) [Fripiat et al., 2014]; and denitrification in oxygen-depleted microhabitats [Rysgaard et al., 2008].
C 2015. American Geophysical Union.
V
                                           The timing and the contribution of these processes to the overall sea ice N cycle remain elusive. First, the
All Rights Reserved.                       sparseness of observations renders difficult any clear mechanistic understanding of the seasonality of the

FRIPIAT ET AL.                                             HIGH TURNOVER RATES OF SEA ICE FIXED N                                                                 3079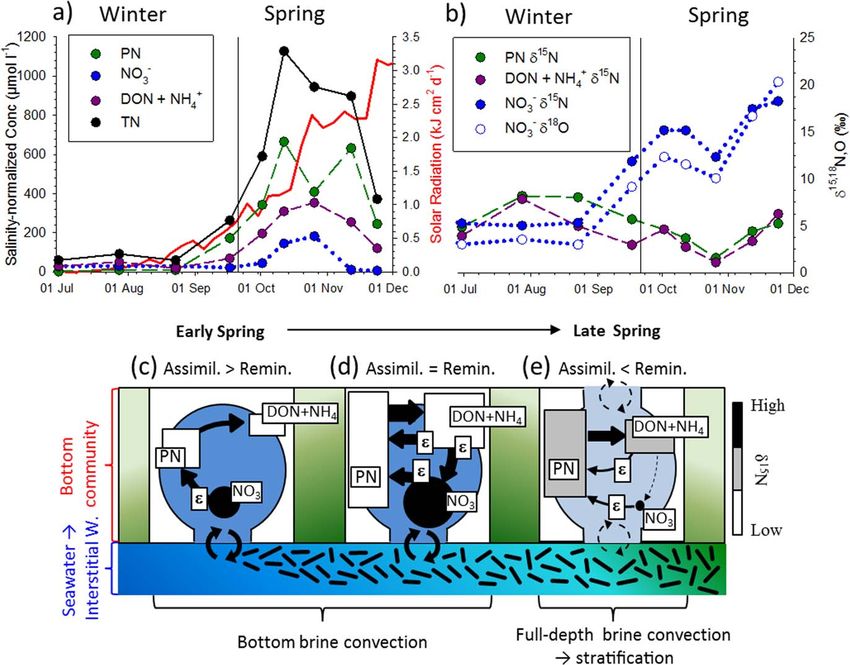
Journal of Geophysical Research: Oceans                                                      10.1002/2014JC010583

                     dominant processes. Second, there are inherent difficulties in manipulating sea ice microorganisms (e.g., in
                     incubations) or in measuring the rate of a targeted metabolism (e.g., N assimilation, nitrification) [Miller
                     et al., 2015]. Third, the patchiness of sea ice physical, chemical, and biological properties implies that it is dif-
                     ficult to compare several adjacent ice cores where parallel experiments are conducted [Eicken et al., 1991]. It
                     appears, therefore, crucial to develop new noninvasive tracers.
                     The variations in the nitrogen and oxygen isotopic composition of various fixed N forms can provide an
                     integrative picture of the N cycle, from which physical, chemical, and biochemical fluxes can be inferred
                     (d15N, in &, versus atmospheric N2; d18O, in &, versus Vienna Standard Mean Ocean Water) [DiFiore et al.,
                     2006, 2009; Sigman et al., 2005; Wankel et al., 2007; Granger et al., 2013]. Most of the N transformations
                     involve a measurable and often distinct isotopic discrimination of the N and O isotopes [Sigman et al.,
                     2009a]. The degree of fractionation is quantified as an isotope effect, which is a measure of the ratio of the
                     reaction rates at which the isotopes are converted from one form to another (i.e., e (&) 5 (14k/15k 2 1) *
                     1000 for N and (16k/18k 2 1) * 1000 for O; where nk is the rate coefficient for the nN or nO-containing reac-
                     tant) [Sigman et al., 2009a]. In spring Antarctic pack ice, Fripiat et al. [2014] investigated the N isotopes to
                     evaluate the overall seasonal N dynamics.
                     Antarctic landfast sea ice, fastened to the coastline, is one of the most productive environments on Earth
                     (with chl-a concentration up to >10,000 mg L21) [Arrigo et al., 1995]. Unlike Antarctic pack ice, in which bio-
                     mass is relatively evenly distributed through the full thickness of the ice [Meiners et al., 2012], biomass in
                     Antarctic landfast sea ice is mainly concentrated in the bottom 20 cm [Arrigo and Thomas, 2004]. This study
                     reports for the first time the concentrations and isotopic compositions of nitrate (NO2      3 ), total dissolved N
                     (TDN), and particulate N (PN) in Antarctic landfast sea ice (Terre Adelie, French Antarctic station ‘‘Dumont
                     d’Urville’’) from April to November, covering a nearly complete fall to spring progression. The data indicate:
                     (i) an autumnal bloom when sea ice forms, (ii) little biological activity in the wintertime, (iii) a highly produc-
                     tive early spring system in the bottom consolidated platelet Layer, nutrient input from seawater as well
                     rapid recycling among the different fixed N forms, including between nitrate and reduced N forms, (iv) and
                     net NO2 3 depletion throughout the entire ice thickness due to assimilation coincident with the stratification
                     of the brine network in later spring. The nitrate d15N and d18O throughout the spring and their depth struc-
                     ture during the later nitrate drawdown period suggest light limitation of nitrate assimilation near the base
                     of the ice.

                     2. Materials and Methods
                     2.1. Sample Collection
                     Landfast sea ice samples were collected at two stations, located close to the Dumont d’Urville French sta-
                     tion (Figure 1a): one in April 2011 enclosed in the ‘‘Geologie Archipelago’’ (66 40.159S; 140 00.143E) and
                     one from June to November 2011 west of the Geologie Archipelago (66 39.911S; 139 59.534E). Sea ice
                     appeared at the second station only in May 2011 and therefore cannot be sampled in April. The second sta-
                     tion was more representative of the East Antarctic landfast sea ice [Fraser et al., 2012].
                     Ice cores (n 5 10) were collected at regular time intervals (approximately 1 month from April to September
                     and 2 weeks from September to November) in a selected area (100 m 3 100 m). Cores were collected using
                     a 14 cm diameter stainless-steel corer and were processed the same day in the shore-based laboratory of
                     the Dumont d’Urville station. From each core, four ice slices (10 cm thick) were cut with a band saw and
                     melted directly at room temperature in the dark (one at the bottom, two in the middle, and one at the sur-
                     face). The samples were immediately filtered through precombusted Whatman GF/F filters. At each station,
                     about 0.75 L of seawater was sampled through the ice core hole with a prerinsed polypropylene syringe
                     and polycarbonate tube. An accumulation of ice platelet was observed inside the hole from September to
                     November. Such accumulation suggests that, from September to November, we sampled either (i) the inter-
                     stitial water from the loose platelet layer or (ii) a mixture of underlying seawater and interstitial water
                     [G€unther et al., 1999]. Water samples were also filtered through precombusted Whatman GF/F filters in the
                     shore-based lab. Filtered water samples were stored in 60 mL acid-washed, prerinsed polyethylene bottles
                     at 225 C. Filters were also stored at 225 C.
                     Despite the fact that we have paid attention to study a level ice floe with a homogeneous surface and sam-
                     ple small contiguous area, we must acknowledge that a time series such as this one may be affected by

FRIPIAT ET AL.                      HIGH TURNOVER RATES OF SEA ICE FIXED N                                                          3080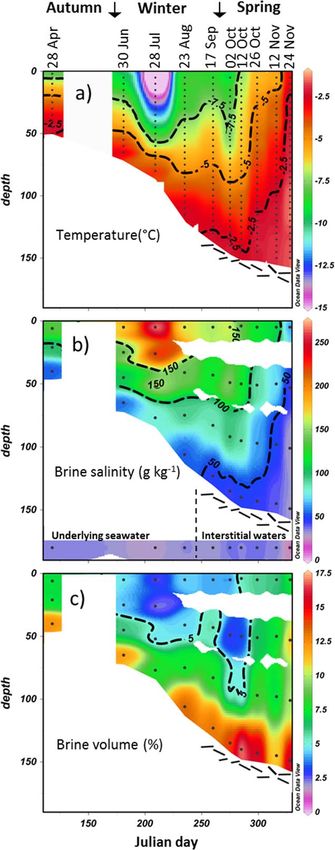
Journal of Geophysical Research: Oceans                                                                                       10.1002/2014JC010583

Figure 1. (a) Circumpolar view of the mean annual surface nitrate concentration, from the World Ocean Atlas climatology 2005 [Garcia et al., 2005], combined with the delineation (white
line) of September sea ice extent (with sea ice cover representing >50% of the specific area). Interpolation and sea ice extent is from Ocean Data View [Schlitzer, 2015]. The sea ice time
series station, in the vicinity of French station ‘‘Dumont d’Urville,’’ is represented with the colored circle, and its color corresponds with the seawater nitrate concentration reported in this
study. (b) Temporal evolution of the sea ice properties, with ice depth (cm; black circles), snow depth (cm; white circles), and ice textures. The first station enclosed in the ‘‘Geologie Archipel-
ago’’ was sampled only in April, when open-water conditions prevailed at the second station. From June to November, the second station west of the G           eologie Archipelago was sampled.

                                                 spatial variability that could not be completely assessed when we discuss the evolution of biogeochemical
                                                 processes [Tison et al., 2008]. Accordingly, we focus on the large variations in the concentrations and iso-
                                                 topes of fixed N, such as occur during the winter-spring transition and in the bloom at the bottom consoli-
                                                 dated platelet layer in October.

                                                 2.2. Nitrogen Analyses
                                                 The concentration of nitrate plus nitrite was measured by reduction to nitric oxide (NO) in a hot (95 C),
                                                 acidic vanadium (III) solution, followed by chemiluminescence detection of NO [Braman and Hendrix, 1989]
                                                 using a Teledyne 200E chemiluminescence NOx analyzer (Thousand Oaks, CA, USA). Nitrite concentration
                                                 was measured by reduction to NO in a hot (95 C) acidic iodine solution also followed by chemilumines-
                                                 cence detection [Garside, 1982]. From the measured concentrations of nitrate plus nitrite and nitrite only,
                                                 the concentration of nitrate only was calculated by subtraction. Ammonium concentration was measured
                                                 using the fluorometric method of Holmes et al. [1999].
                                                 Prior to nitrate isotope analysis, nitrite was removed with the sulfamic acid protocol of Granger and Sigman
                                                 [2009]. The d15N and d18O of nitrate were measured using the ‘‘denitrifier method’’ [Sigman et al., 2001; Cas-
                                                 ciotti et al., 2002]. Measurements were referenced to air N2 and VSMOW using the nitrate reference materi-
                                                 als IAEA-N3, with a d15N of 4.7& and a d18O of 25.6&, and USGS-34, with a d15N of 21.8& and a d18O of
                                                 227.9& [Bo     €hlke et al., 2003]. Twenty-five percent of our samples had a NO2 3 concentration lower than 3
                                                          21                                                21
                                                 mmol L (minimum NO2           3 concentration 5 0.37 lmol l ). For these samples, we applied the evaporative
                                                 technique described in Fripiat et al. [2014]. Replicate analyses (100% of the samples) indicate an average 1
                                                 sd reproducibility of 0.05& and 0.23& (n 5 57) for the nitrate d15N and d18O, respectively, including evapo-
                                                 rated samples.
                                                 The concentration and d15N of total dissolved nitrogen (TDN 5 NO2            2       1
                                                                                                                      3 1 NO2 1 NH4 1 DON) and a fraction
                                                 of filters dedicated to particulate nitrogen (PN; n 5 37) were determined using the coupled persulfate oxida-
                                                 tion/denitrifier method of Knapp et al. [2005], which involves the oxidation of reduced fixed N species to
                                                 nitrate, followed by the analysis of the concentration and d15N of the resultant nitrate using the chemilumi-
                                                 nescence and denitrifier methods described above. To correct for the blank associated with the persulfate
                                                 oxidizing reagent (POR), triplicates of different amounts (15 and 60 nmol N) of two L-glutamic acid refer-
                                                 ence materials (USGS-40, with a d15N of 24.5&, and USGS-41, with a d15N of 47.6&) [Qi et al., 2003] were

FRIPIAT ET AL.                                                      HIGH TURNOVER RATES OF SEA ICE FIXED N                                                                                    3081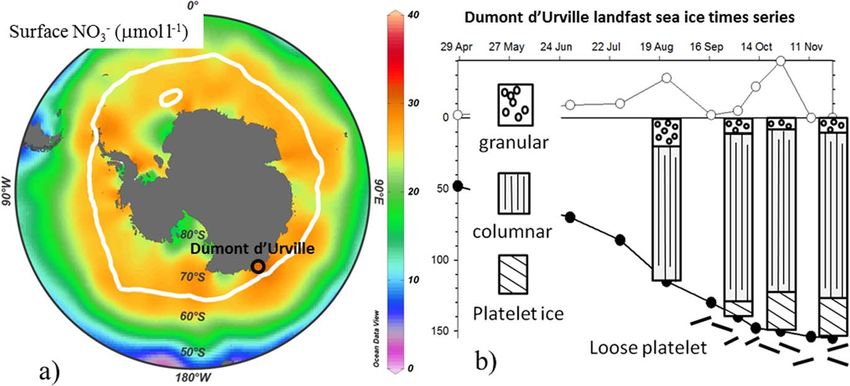
Journal of Geophysical Research: Oceans                                                  10.1002/2014JC010583

                     processed along with the samples. Replicate analyses (100% of the samples) indicate an average 1 sd repro-
                     ducibility of 0.09& and 0.22& (n 5 57 and 37) for TDN and PN d15N, respectively. For the samples with
                     large quantities of biomass (n 5 12), particulate nitrogen analyses were performed on a DeltaV IRMS
                     coupled to a Costech CHNSO Elemental Analyzer via a ConFlo IV interface. GF/F filters were packed into sil-
                     ver envelopes and flash combusted at 1400 C. Isotopic composition was calibrated using an in-house
                     standard (Aminocaproic acid, d15N 5 3.9 6 0.1&). Replicate analyses (100% of the samples) indicate an
                     average 1 sd reproducibility of 0.21& (n 5 12) for the PN d15N. By measuring NO2             15
                                                                                                       3 and TDN d N, we calcu-
                                15
                     late the d N of the remaining dissolved fixed nitrogen, which includes dissolved organic nitrogen (DON),
                                                         2                                  2                        2
                     ammonium (NH1                                                                            1
                                      4 ) and nitrite (NO2 ). The median contribution of NO2 to the DON 1 NH4 1 NO2 was 0.6%
                                                                                                          1
                     (with 3% being the highest observed); hereafter, this pool is referred to as DON 1 NH4 only.

                     3. Results
                     3.1. Physical Framework
                     Ice thickness increased during the sampling period (from 45 to 154 cm), with variable snow cover (0–40 cm;
                     Figure 1b). Ice texture was, from top to bottom: granular ice, columnar ice, and consolidated platelet ice
                     (Figure 1b). Consolidated platelet ice was observed from 2 October until the end of the experiment, with
                     the columnar/platelet boundary at 122 6 9 cm. An accumulation of loose ice platelets was observed at the
                     bottom of the ice floe in September, as commonly observed in this area (Figure 1b) [e.g., Riaux-Gobin et al.,
                     2005; Delille et al., 2007]. These platelet ice crystals are produced from super-cooled water, advected from
                     underneath the ice shelves, and progressively incorporated into the overlying sea ice cover by freezing in
                     the interstices to form the consolidated platelet layer [e.g., Dempsey and Langhorne, 2012].
                     Figure 2 shows the evolution of temperature, brine salinity, and brine volume fraction [following Cox and
                     Weeks, 1983]. Ice temperature decreased upward from the freezing temperature at the seawater interface
                     (Figure 2a). The temperature gradients were much steeper during the winter months, with near-surface
                     temperature reaching as low as 218.4 C. At the end of the experiment, the temperature profile was nearly
                     isothermal, reaching only as low as 23.2 C. Brine salinity, as derived from temperature profiles based on
                     the assumption of thermodynamic equilibrium [Cox and Weeks, 1983], decreased downward from as high
                     as 273 down to 30 g kg21, close to local seawater values of 33 g kg21 (Figure 2b). The difference between
                     the top and the bottom layers was greatly diminished in spring, decreasing downward from 63 to 30 g
                     kg21. Brine volumes ranged from 2.2 to 17.2%, with the lower volumes associated with the colder tempera-
                     tures of the winter months (Figure 2c). Except for the last three profiles (from 26 October to 24 November),
                     only the bottom ice layer had a brine volume fraction above 5% (Figure 2c), which is considered to be a per-
                     meability threshold for fluid transport through sea ice [e.g., Golden et al., 1998; Petrich et al., 2006]. Anoma-
                     lously low brine volumes in the bottom layer in 28 July and 12 November may have been due to some
                     brine loss on core sampling [Notz et al., 2005] or to small spatial variability in the desalination processes
                     across our sampling location.

                     3.2. Fixed N Partitioning, d15N and d18O
                     3.2.1. Underlying Seawater
                                                                                                                      2 15
                     The underlying seawater in the winter (from April to August) possessed NO2 3 concentration, NO3 d N and
                        2 18                          21
                     NO3 d O of 29.9 6 1.5 mmol L , 5.0 6 0.1&, and 2.4 6 0.3&, respectively (Figures 3 and 4), similar to
                     those previously encountered in the Polar Antarctic Zone winter mixed layer [DiFiore et al., 2009]. However,
                     unlike what is expected for the winter mixed layer, high concentrations and d15N were observed for
                                                     21
                     DON 1 NH1  4 (20.2 6 1.2 mmol L    and 10.0 6 1.5&) and PN (3.1 6 0.5 mmol L21 and 8.7 6 1.1&).
                     3.2.2. Loose Platelet Layer (i.e., Interstitial Waters)
                     From 17 September, an accumulation of loose platelet ice crystals occurred at the bottom of the ice (Figure
                     1b). From that time forward, instead of sampling underlying seawater, we sampled either (i) the interstitial
                     water from the loose platelet layer (ii) or a mixture of underlying seawater and interstitial water [G€   unther
                     et al., 1999]. In the following discussion, this is referred to as the interstitial water. From September to the
                                                                                           15           18
                     end of October, this interstitial water had NO2    3 concentration, d N, and d O similar to that of seawater
                                                          2                                        21
                     (Figures 3 and 4). In November, NO3 was depleted (down to 0.7 mmol L ), and, as expected from the pref-
                     erential assimilation of 14N- and 16O-bearing nitrate, NO2       15        18
                                                                                  3 d N and d O increased (up to 17.5 and 21.3&,
                     respectively). PN concentration steadily increased in the loose platelet layer from September to November

FRIPIAT ET AL.                     HIGH TURNOVER RATES OF SEA ICE FIXED N                                                       3082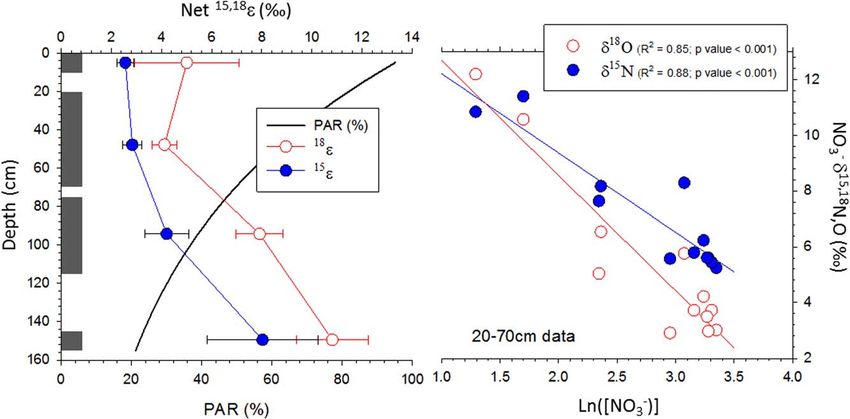
Journal of Geophysical Research: Oceans 10.1002/2014JC010583
(from 17.7 to 51.3 mmol L21; Figure
3d). This concentration should
probably be taken as an underesti-
mate since a significant fraction of
the PN was likely attached to the ice
platelets and therefore not sampled
[Dieckmann et al., 1992; G€
unther et al.,
1999]. PN d15N decreased signifi-
cantly (to 4.9 6 0.6&) concurrently
with the accumulation of platelet ice
(Figure 4d). At the same time, the
concentration of DON 1 NH1 4
increased (to 27.2 6 14 mmol L21) and
its d15N decreased (to 7.6 6 1.7&)
(Figures 3e and 4e).
3.2.3. Sea Ice
As with the salinity of sea ice brine, its
nutrient distribution changes due to
temperature-induced dilution or con-
centration during melting and freez-
ing processes within the sea ice. To
correct for these effects, all concen-
trations were normalized to the salin-
ity of underlying seawater (normalized
concentration 5 SI concentration * SW
salinity/SI salinity, where SI is sea ice
and SW is underlying seawater).
During the winter months (June–
August), salinity-normalized NO2 3
concentration in sea ice is not signifi-
cantly different from that of the
underlying seawater (26.8 6 3.1 mmol
L21 versus 29.9 6 1.5 mmol L21,
respectively; Figure 3a), with both
15 18
NO2 3 d N and d O slightly higher in
the sea ice (5.6 6 0.3& and
3.3 6 0.4&, respectively; Figures 4a
and 4b). Except in the bottom layers
in October, NO23 was depleted during
the spring months (September–
November; down to 3.6 mmol L21), as
usually observed in sea ice with the
accumulation of biomass and its asso-
ciated NO2 3 assimilation [e.g., Gleitz
et al., 1995]. Such depletion was
stronger and occurred earlier in the
internal parts of the ice floe. Associ-
2 15
ated with NO2 3 depletion, NO3 d N
18
Figure 2. (a) Ice temperature, (b) brine salinity, and (c) brine volume computed and d O became progressively
assuming brine thermodynamic equilibrium [Cox and Weeks, 1983]. In Figure 2b, higher (Figures 3a, 4a, and 4b). A
seawater and/or loose platelet interstitial water salinities are shown in the lower col- strong accumulation of NO2 3 was
ored band of the section. Dots indicate a sampling depth. Interpolation is from
Ocean Data View [Schlitzer, 2015]. The reader should be wary of extrapolated color observed at the bottom of the ice in
contours. October, with a salinity-normalized
FRIPIAT ET AL. HIGH TURNOVER RATES OF SEA ICE FIXED N 3083
Journal of Geophysical Research: Oceans                                                                                     10.1002/2014JC010583

Figure 3. Salinity-normalized concentration of (a) NO2         2         1
                                                     3 , (b) NO2 , (c) NH4 , (d) PN, (e) DON, and (f) the ratio of organic N versus total fixed N. Seawater and loose platelet interstitial water
                                                                                                                                                                  21
concentrations are shown in the lower colored band of the section. For the sake of clarity, only a subset of the NO2   3 , PN, and DON values above 150 mmol N L     (a, d, e) in the bottom
community in October are indicated with printed values. The readers can find these values in Figure 5a. Interpolation is from Ocean Data View [Schlitzer, 2015]. The reader should be
wary of extrapolated color contours.

FRIPIAT ET AL.                                                     HIGH TURNOVER RATES OF SEA ICE FIXED N                                                                                 3084
Journal of Geophysical Research: Oceans 10.1002/2014JC010583
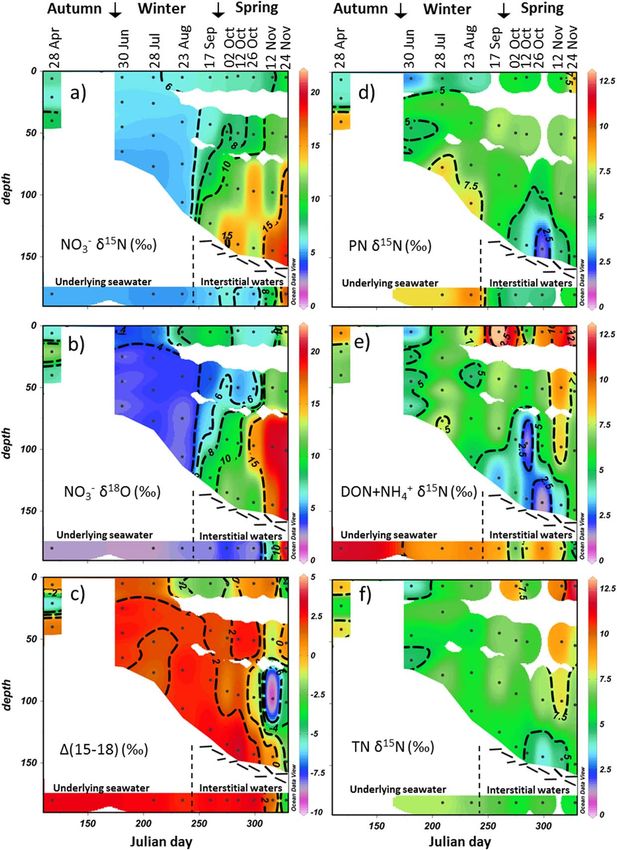
15 2 18 15 1 15 15
Figure 4. (a) NO2
3 d N, (b) NO3 d O, (c) D(15–18), (d) PN d N, (e) DON 1 NH4 d N, and (f) TN d N. Seawater and loose platelet interstitial water isotopic composition are shown in
the lower colored band of the section. Interpolation is from Ocean Data View [Schlitzer, 2015]. The reader should be wary of extrapolated color contours.
FRIPIAT ET AL. HIGH TURNOVER RATES OF SEA ICE FIXED N 3085Journal of Geophysical Research: Oceans 10.1002/2014JC010583
concentration of up to 182.3 mmol L21. This nitrate had high d15N and d18O (up to 15.2& and 12.3&,
respectively). Except at the bottom of the consolidated platelet layer in spring where an accumulation
21
occurred, salinity-normalized NO22 concentration remained low (usually below 0.5 mmol L ; Figure 3b),
2 2
with a median contribution to the NO3 1 NO2 pool of 1%.
During the winter months (June–August), salinity-normalized DON 1 NH1 4 concentration was slightly higher
in sea ice (34.7 6 18.4 mmol L21) than in the underlying seawater (20.2 6 1.2 mmol L21; Figure 3e), but not
significantly different. During this period, ammonium contributed more to the DON 1 NH1 4 pool (32 6 17%)
15
than in seawater (13 6 5%). DON 1 NH1 4 d N was lower (5.6 6 1.6&) than in seawater (10.0 6 1.5&; Figure
4e). In springtime, an accumulation of DON 1 NH1 4 was observed at all depths (Figure 3e), with higher nor-
21
malized DON 1 NH1 4 concentration in the bottom layer (up to 353.6 mmol L ), intermediate in the top layer
(up to 175.8 mmol L21), and lower in the intermediate layers (up to 85.6 mmol L21). Ammonium contributed
1 15
26 6 12% of the DON 1 NH1 4 pool, with no significant depth variation. DON 1 NH4 d N evolved differently
at different ice depths from winter to spring, increasing in the surface and internal layers (to 13.5& and
9.3&, respectively) and decreasing in the bottom layer (to 1.1&; Figure 4e). A large Adelie penguin popula-
tion in the Geologie Archipelago is the likely source of the high-d15N organic N and NH1 4 in the upper (and
possibly also intermediate) ice levels [Wada et al., 1981; Thomas, 1986]. Penguin activity and wind transport
of organic N from ornithogenic soils could deposit organic N on the top of sea ice, become processed into
DON 1 NH1 4 through bacterial activity (if the N was not already in this form), and exchanged with the inter-
nal layers upon the opening of the brine network in spring (Figure 2c). This high-d15N additional input was
also translated into the total fixed nitrogen d15N, showing a significant increase in the upper and intermedi-
ate ice levels in spring (Figure 4f). For the sake of brevity, the springtime DON 1 NH1 4 accumulation in the
surface and internal layers will not be discussed in detail below.
During the winter months, normalized PN concentration was higher in sea ice (6.6 6 4.0 mmol L21) than in
seawater (3.1 6 0.5 mmol L21; Figure 3d), but not significantly different. The concentrations of PN in both
the sea ice and the underlying seawater are significantly greater than is typically encountered in the open
Antarctic surface waters [Martiny et al., 2013] (again probably related to the ornithogenic effects; see below).
PN d15N during winter was lower (5.7 6 1.7&) than in underlying seawater (8.7 6 1.1&; Figure 4e) and was
15
indistinguishable from DON 1 NH1 4 d N. In the springtime, an accumulation of PN was observed, in agree-
2
ment with the concomitant NO3 depletion, with higher normalized PN concentration in the bottom layer
(up to 664.9 mmol L21) than in the intermediate and top layers (up to 29.9 mmol L21; Figure 3d). For both
the surface and internal layers, no significant difference from winter was observed for PN d15N (6.5 6 1.0&),
with the exception of the 24 November surface layer harboring a higher PN d15N of 8.5& (Figure 4d). As for
15
DON 1 NH1 4 , PN d N in the bottom layer decreased first (down to 1.6& on 26 October) and then increased
again (up to 5.2& on 24 November).
4. Discussion
Antarctic landfast sea ice is one of the most productive environments on Earth [Arrigo and Thomas, 2004].
Most of the biomass is concentrated in the bottom centimeters in spring (e.g., Figure 3d), providing a habitat
that is both stable and continuously supplied with seawater-borne nutrients [Vancoppenolle et al., 2013]. The
following discussion will begin with an identification of sources, as well as the modifications, of fixed N in the
brine inclusions in winter. Then, the N biogeochemical dynamics of the bottom sea ice algal bloom will be dis-
cussed, followed by the decline of the bloom in November. Our focus on the bottom ice community is moti-
vated by its dominance in terms of fixed N quantities (Figure 3) and by its importance for polar ocean
biogeochemistry on a broad scale, in part because of its exchanges with the underlying water. Moreover, as
described above, the upper surface of the ice is influenced by penguin-derived nitrogen, which is interesting
but of narrower import, and thus we do not pursue it further here. The middepths of the ice involve relatively
low concentrations of fixed N, such that the N cycle at these depths is significantly influenced by both shal-
lower and deeper ice processes; accordingly, while the internal ice was a major focus of our pack ice studies
[Fripiat et al., 2007, 2014], it is secondary to the ice base in our discussion of the landfast ice data below.
4.1. Sources and Modification of Sea Ice Fixed N in Winter
Sea ice forms from the freezing of seawater. The salt trapped within sea ice is efficiently excluded from the
ice crystals [Weeks and Ackley, 1986], remaining dissolved in liquid inclusions of saline brine [e.g.,
FRIPIAT ET AL. HIGH TURNOVER RATES OF SEA ICE FIXED N 3086Journal of Geophysical Research: Oceans 10.1002/2014JC010583
Vancoppenolle et al., 2010]. Seawater represents the main source of fixed N within sea ice. Assuming the
underlying seawater as representative of this source, we calculate the sea ice initial total N (TN 5 PN 1 TDN)
concentration and d15N to be 52.3 6 2.3 mmol L21 and 7.1 6 0.5&, respectively (Figure 4f for TN d15N). This
is significantly higher than estimated by Fripiat et al. [2014] for the pack ice in the polar Antarctic zone (35
mmol L21 and 4.9&, respectively). This difference is largely due to much higher DON 1 NH1 4 concentration
(20.2 6 1.2 mmol L21) and d15N (10.0 6 1.5&; Figures 3 and 4). As mentioned above, from the end of Octo-
ber to March, a large Adelie penguin population (more than 60,000 individuals) is observed at the Geologie
Archipelago [Thomas, 1986]. Large rookeries produce a substantial amount of organic matter, influencing
the biogeochemistry in the surrounding coastal waters [Delille, 1990] and elevating the d15N of the local N
cycle [Wada et al., 1981]. The proposed mechanism for such high d15N is that the soils microorganisms con-
vert organic nitrogen to ammonium(a), the partial volatization of which raises the residual N d15N [Wada
et al., 1981]. The remaining high d15N can be transferred to the surrounding waters, explaining the observed
15
high DON 1 NH1 4 concentration and d N in the local seawater (Figures 3 and 4).
In winter, only at the interface with the ocean, where sea ice is permeable, can fixed N be exchanged with
underlying seawater. At the surface and in the interior of the ice, the brine volume fraction is too low to
allow brine convection, despite the potential energy for convection from the high brine salinity (Figure 2)
[Griewank and Notz, 2013]. These brine structures are closed, with fixed N concentration mainly inherited
from the underlying seawater. During the winter months (June to August), salinity-normalized concentra-
tions of the different dissolved N forms were not different, although more variable, than in local seawater
(Figure 3). This lack of coherent change is explained by the low overall biological activity in the winter ice,
resulting from environmental conditions not favorable for biological growth: low light (down to 0.01 kJ
cm22 d21) [Delille et al., 2002], low temperature (down to 218.4 C), and high brine salinity (up to 273 g
kg21; Figure 2).
As an exception, high salinity-normalized NH1 4 concentration was observed at the surface of the ice in June
(Figure 3c). Measurements from the first station (sampled only in April when open-water conditions still pre-
vailed at the second station) provide evidence of a sea ice algal bloom in autumn: NO2 3 depletion in the ice,
and accumulation of PN, DON, and NH1 4 (Figure 3) [Gleitz et al., 1995]. Such algal blooms have been observed
previously in this area [Delille et al., 2002]. The NH1 4 accumulation in the surface layer in June likely repre-
sented the degradation product of such a bloom. The absence of a similar accumulation of ammonium in the
subsequent cores may also be due to small spatial scale variability in the autumn sea ice algal bloom.
15 18 15
Winter sea ice NO2 3 d N and d O were slightly higher than in seawater, and reduced N d N (DON, PN,
1
and NH4 ) was lower than in seawater (Figure 4). Such partitioning of N and O isotopes between the differ-
ent fixed N forms suggests that a modest amount of NO2 2
3 assimilation had occurred. When NO3 assimila-
14 16 2 15
tion proceeds, N and O isotopes are preferentially assimilated, increasing the residual NO3 d N and
d18O [Granger et al., 2004, 2010] and decreasing the organic N d15PN. The similarity between the
15
DON 1 NH1 4 and PN d N suggests that a significant fraction of this newly produced PN was converted into
DON 1 NH4 , with either DON release (PN ! DON) and/or ammonification (PN,DON ! NH1
1
4 ). Cell damage
and viral infection with the onset of the extreme winter conditions should, indeed, promote the release of
DON [G€ unther et al., 1999], and some heterotrophic bacterial activity has been observed in winter sea ice at
temperatures as low as 220 C [Junge et al., 2004]. Field and laboratory studies suggest that both bacteria
and zooplankton preferentially degrade low-d15N PN to ammonium, with a net isotope effect of 2–5&
[e.g., Checkley and Miller, 1989; Knapp et al., 2011; Mo €bius, 2013, and references therein]. Ammonification is
likely the main N isotope-discriminating step in this remineralization process, breaking a N-containing
bond. Little or no isotopic discrimination is expected with the production of DON, since this process only
occasionally involves the breaking of N-containing bonds and then only a small fraction of the total N-
containing bonds in the organic matter being processed [e.g., Knapp et al., 2011, and references therein].
Production of DON 1 NH1 1
4 without similar rates of assimilation or oxidation of the NH4 can thus explain the
15 1 1
d N similarity between DON 1 NH4 and PN. Both NH4 assimilation and oxidation fractionate the N iso-
topes [Casciotti et al., 2003; Vo et al., 2013], such that significant rates of the ammonium-consuming proc-
esses would elevate the d15N of DON 1 NH1 4 . The isotopic discrimination associated with the
15
ammonification of DON to NH1 1
4 will not affect the d N of the combined DON 1 NH4 pool. Ammonification
1 15 15
of PN to NH4 will increase PN d N, but the resulting high d N will be, then, transmitted to the DON upon
DON release from the PN, further dampening the isotopic difference between PN and DON 1 NH1 4.
FRIPIAT ET AL. HIGH TURNOVER RATES OF SEA ICE FIXED N 3087Journal of Geophysical Research: Oceans 10.1002/2014JC010583
4.2. Sea Ice Algal Bloom in the Bottom Platelet Layers
Platelet ice crystals are produced from supercooled water advected from underneath the ice shelves and
accumulated at the bottom of the ice, producing a loose platelet layer first observed in our sampling area in
September. Over time, the upper portion of this layer was incorporated into the overlying sea ice cover by
freezing of the interstices, producing a consolidated platelet layer of 20 cm thick in the sampling area
between September and November (Figure 1b) [e.g., Dempsey and Langhorne, 2012]. A large accumulation
of fixed N (up to 1127 mmol L21) was observed in the consolidated platelet layer in October, 30 times
higher than Antarctic seawater values, with salinity-normalized concentrations of PN up to 665 mmol L21,
DON up to 321 mmol L21, NO2 21 1
3 up to 182 mmol L , and NH4 up to 115 mmol L
21
(Figures 3 and 5a). In the
loose platelet layer below, biomass increased steadily from September to October but appeared to have only a
marginal impact on NO2 2
3 concentration until November when NO3 started to become depleted (Figure 3a;
horizontal colored band at bottom). This section is focused on the biogeochemical dynamics at the bottom
consolidated platelet layer only, being where most of the accumulation of fixed N was observed (Figure 3). It is
well known that platelet ice is the most porous of all sea ice types and harbors some of the highest concentra-
tions of sea ice algae (up to >10,000 mg Chl-a L21) [Arrigo et al., 1995, 2010]. High exchange rate with seawater
(high porosity) and preferential assimilation of N into biomass, trapped within the tortuosity of the brine net-
work, concentrates fixed N in sea ice (Figures 5a and 5c). Preferential assimilation of 14N into biomass, leaving
15
the residual NO2 3 pool enriched in N (Figure 5b), and exchange with seawater (brine convection and tidal
15
forcing) preferentially expels N out of the sea ice, progressively increasing the concentration of total fixed N
and decreasing its d15N [Fripiat et al., 2014], as is observed in the bottom consolidated platelet layer (Figure 4f).
The accumulation of NO2 3 in the bottom consolidated platelet layer, well above the concentration of under-
lying seawater, has been observed previously in some instances in productive sea ice [G€ unther et al., 1999;
Riaux-Gobin et al., 2000; Becquevort et al., 2009; Lannuzel et al., 2014]. To reach such concentrations, fixed N
must be trapped within sea ice. An initial coupling between brine convection and an excess in assimilation
over remineralization is able to build a large trapped pool of organic N (several hundred mmol L21; Figures
5a and 5c; presumably in September in this study). Over time, the progressive bacterial colonization, com-
bined with algal mortality, cell lysis and sloppy feeding, liberate organic matter and promote remineralization
[G€unther et al., 1999; Thomas and Dieckmann, 2002; Meiners et al., 2004; Deming, 2010], including nitrification
2
[Fripiat et al., 2014]. The resulting transformation of such high concentrations of organic N into NH1 4 , NO2 ,
2
and NO3 can explain the dissolved N concentrations well above seawater values (Figures 5a and 5d). At this
stage, remineralization could be in excess of N assimilation or a tight balance between remineralization and N
assimilation could be maintained for a given period of time (October in this study), as long as the environmen-
tal conditions are relatively stable. An imbalance toward more N assimilation than remineralization at this
stage is not possible, since it would deplete the NO2 3 pool. We believe that brine convection, resulting from a
vertical instability in the brine density distribution when ice is growing (Figure 1b), was still ongoing at the
bottom of the ice in October. Much higher dissolved inorganic fixed N concentration than that of seawater
could be maintained as long as remineralization was a dominant process, outpacing brine convection.
Unexpectedly, the nitrate accumulation in the bottom consolidated platelet layer in October occurred with
15
a high NO2 2
3 d N (12.3–15.2&; Figure 5b). Much greater NO3 production (remineralization 1 nitrification)
2 2 15
than consumption (NO3 assimilation) should set the NO3 d N to a value intermediate between newly pro-
15 2 15
duced NO2 3 d N (i.e., from nitrification) and seawater NO3 d N (5.1&) supplied through brine convection.
In the following, we use the current knowledge of N isotope systematic to constrain the relative rates of
NO2 3 production and consumption.
Field and laboratory studies suggest that both bacteria and zooplankton preferentially degrade low-d15N
PN to ammonium, with a net isotope effect of 2–5& [e.g., Knapp et al., 2011; Mo €bius, 2013, and reference
therein]. Ammonium oxidation (AmO, O for oxidation) by marine nitrifiers fractionates the N isotopes, with
an isotope effect between 12 and 19& [Casciotti et al., 2003]. In the production of regenerated nitrate (nitri-
fication), this fractionation is paired with the subsequent oxidation of nitrite (NiO, Ni for nitrite), which has
the rare characteristic of having an inverse isotope effect, with 15N-nitrite being preferentially oxidized
(213&) [Casciotti, 2009]. As described above, NO2 3 assimilation (NaU, U for the uptake and Na for nitrate)
typically has an isotope effect between 4 and 10& [DiFiore et al., 2010]. A large and variable isotope effect
has been estimated for NH1 4 assimilation (AmU), from 5 to 22& [Vo et al., 2013, and references therein].
Its magnitude is dependent on the external ammonia (NH3) concentration, which controls whether
FRIPIAT ET AL. HIGH TURNOVER RATES OF SEA ICE FIXED N 3088Journal of Geophysical Research: Oceans 10.1002/2014JC010583
Figure 5. Temporal evolution of salinity-normalized concentration (a) of the fixed N at the bottom of the consolidated ice, together with solar radiation (kJ cm22 d21; 5 day average),
and (b) associated d15N and d18O. (c–e) Conceptual scheme showing the spring nitrogen biogeochemical dynamics at the bottom consolidated platelet layer. The large circles in Figures
5c–5e illustrate brine inclusions with their relative blue scale proportional to salinity (lighter blue 5 less saline). The relative green scale is proportional to biomass, showing a peak in
mid-spring for the bottom consolidated platetet layer and an accumulation in late spring for the loose platelet layer below. The N pools are indicated within the brine inclusions, with
their grayscale shade increasing with their d15N and their shape indicating whether they are mobile (circle) or partly immobile (rectangle) [Thomas and Dieckmann, 2002; Meiners et al.,
2004; Deming, 2010; M€ uller et al., 2013]. The arrows linking the N pools reflect biological fluxes, with thicker arrows qualitatively indicating greater fluxes, and an ‘‘epsilon’’ label indicating
that the isotopic observations are particularly affected by isotope fractionation at the labeled step. The size of the pool symbol is proportional to the size (concentration) of the pool. The
N exchange with seawater (i.e., brine convection and tidal forcing), when combined with nitrate assimilation, caused fixed N to accumulate in the ice (c), from 60 to 1200 mmol L21.
With the development of an efficient microbial foodweb (bacterial colonization of the organic detritus trapped in the ice), including nitrifiers, the system quickly evolved from new to
nearly 100% regenerated production (d). In November, brine volume fraction increased, allowing brine convection through the full thickness of the ice (due to a brine density greater
than seawater). This process decreased brine salinity, resulting in vertical stratification within the brine network and, therefore, limiting exchange of fixed N with seawater, resulting in
net consumption of the nitrate pool and a likely decay of the sea ice algal bloom (e).
transport across the cell membrane is dominantly active or passive (i.e., diffusive). NH3 concentration is
dependent on the equilibrium constants, NH1 4 concentration, and pH [Bange, 2007]. Delille et al. [2007]
reported a pH range in the brine at Dumont d’Urville between 8.2 and 9.4. In October, brine NH1 4 concentra-
tion was up to 159 mmol L21 (brine concentration 5 bulk SI concentration/brine volume). Using a pKa of
10.0 for seawater at 0 C, the NH3 concentration should be above 0.8 lmol L21. At such concentrations, an
AmU isotope effect of 22& has been observed, instead of 5& for lower NH3 concentration [Vo et al.,
2013]. A low-amplitude isotope effect for nitrite assimilation (NiU) has been measured (less than 1&) [Waser
et al., 1998].
We simulate three scenarios for the bottom consolidated platelet layer in October (Figure 6). For all of them,
2
there is a balance between the production and consumption processes for both NH1 4 and NO2 . In case (a),
inorganic fixed N is produced by the remineralization of organic N and concomitant nitrification, with little
FRIPIAT ET AL. HIGH TURNOVER RATES OF SEA ICE FIXED N 3089Journal of Geophysical Research: Oceans 10.1002/2014JC010583
Figure 6. Three scenarios to explain the large accumulation of fixed N at the bottom consolidated platelet layer community in October. In
2 2
case (a), there is no significant N assimilation. In case (b), there is significant NH1 4 assimilation but no significant NO3 or NO2 assimilation.
2 2 2
In case (c), there is significant NH1 4 assimilation, no significant NO2 assimilation, and a balance between NO2 oxidation (NiO) and NO3
assimilation (NaU). The value or range of values for each isotope effect is taken from the literature [Waser et al., 1998; Casciotti et al., 2003;
Casciotti, 2009; Sigman et al., 2009a; DiFiore et al., 2010; Vo et al., 2013, and references therein]. The arrows among the N pools reflect bio-
logical fluxes, with thicker arrows qualitatively indicating greater fluxes. The x and y ratios are ratios of NH1 4 assimilation (AmU)/ammonifi-
cation (Amo) and NO2 1
2 assimilation (NiU)/NH4 oxidation (AmO), respectively. For every case, there is a balance between production and
2
consumption processes for both NH1 4 and NO2 . In cases (b) and (c), a balance also exists for PN 1 DON.
2 2
NH1 4 and NO3 assimilation (Figure 6a); this is a purely heterotrophic system. In alternative case (b), NO3 is
1 1
mainly accumulated but NH4 is actively assimilated, supporting regenerated NH4 -based primary production
(Figure 6b). In case (c), a balance between nitrate production and consumption processes is assumed (Figure
6c), such that the rate of nitrification equals that of NO2 2
3 assimilation. In all cases, we assume that NO2 is
2
mainly oxidized into NO3 instead of being assimilated. This is in agreement with the current data set in the
Southern Ocean [Olson, 1981], suggesting a median contribution of NO2 2
2 assimilation to the NO2 removal of
only 2%, with 35% being the highest observed. This is further supported by the small contribution of NO2 2 to
the inorganic fixed N pool (median contribution for the bottom consolidated platelet layer is 0.8%).
In the cases (a) and (b), organic N represents by far the dominant N form, imposing its isotopic composition,
inherited from previous organic N production, on its release of N. The d15N of ammonium and its products
(NO2 2
2 and NO3 ) will depend on the combination of isotope effects, the relative importance of which are
2
weighted by the relative contribution of their fluxes to NH1 4 and NO2 removal, as follows (where x and y
are AmU/Amo and NiU/AmO, respectively) [Fripiat et al., 2014]:
d15 NNH14 5d15 Norg:N 2eAmo 1x ðeAmU 2eAmO Þ1eAmO (1)
d15 NNO22 5d15 Norg:N 2eAmo 1x ðeAmU 2eAmO Þ1y ðeNiU 2eNiO Þ1eNiO (2)
d15 NNO23 5d15 Norg:N 2eAmo 1x ðeAmU 2eAmO Þ1y ðeNiU 2eNiO Þ (3)
15
In the alternative case (c) of a balance between nitrification and NO2
3 assimilation (Figure 6c), the d N of
the different fixed N species can be described as follows (equations (1) and (2) are still valid for NH1
4 and
NO2 2 ):
d15 NNO23 5d15 Norg:N 2eAmo 1x ðeAmU 2eAmO Þ1y ðeNiU 2eNiO Þ1eNaU (4)
FRIPIAT ET AL. HIGH TURNOVER RATES OF SEA ICE FIXED N 3090Journal of Geophysical Research: Oceans 10.1002/2014JC010583
d15 NPN 5x ðd15 NNH14 2eAmU Þ1y ð12xÞ ðd15 NNO22 2eNiU Þ
(5)
1ð12yÞ ð12xÞ ðd15 NNO23 2eNaU Þ1eAmo
It is generally assumed that, in a productive system, a larger fraction of the ammonium produced by ammo-
nification is assimilated rather than oxidized (i.e., the x ratio is greater than 0.5). The energy yield of ammo-
nium oxidation is low [Ward, 2007], and nitrifiers generally should not be able to out-compete sea ice algae
for the available stock of ammonium, the preferred inorganic nitrogen source for assimilation. In cases (b)
and (c) for which we assume autotrophic growth, the AmU/Amo ratio (x) is set greater than 0.5 [e.g., Olson,
1981; Bianchi et al., 1997], keeping NiU/AmO ratio (y) lower than 0.35 [Olson, 1981] (the maximum observed
in their Southern Ocean study).
In case (a), using all combinations of x and y ratios between 0 and 0.35, assuming organic N at 3& and the
15
range for the isotope effects given in Figure 6, the computed NO2 3 d N lies between 22.0 and 5.6& (equa-
tion (3)). This is well below the observations within the bottom consolidated platelet layer (Figure 5b), pre-
15
cluding this scenario. NO2 3 d N was more than 10& higher (12.3–15.2&), and also higher than seawater
2 15 15
NO3 d N (5.1&). This implies that there was significant N assimilation, increasing the residual NO2 3 d N,
14 15
by preferentially channeling N into biomass and N into inorganic N. In the case (b) of significant NH1 4
2 15
assimilation (x ratio higher than 0.5), but with insignificant NO2 3 assimilation, NO3 d N ranges from 216 to
15
12.5& (equation (3)), still below the observations (12.3–15.2&). NO2 3 d N is highly dependent of the iso-
1 14
tope effect for NH4 assimilation, preferentially channeling N into biomass (5–22&) [DiFiore et al., 2009; Vo
et al., 2013]. As described above, its magnitude is dependent on how NH1 4 /NH3 is exchanged in and out the
cells [Vo et al., 2013]. High measured/inferred NH1 4 /NH 3 concentrations should favor the upper range for the
isotope effect (22&), which results largely from high amplitude of the equilibrium isotope effect for the dis-
sociation of NH1 4 to NH3 [Vo et al., 2013]. With an isotope effect of 22& the lower limit of the computed
15
NO2 3 d N range is revised upward, from 21.1 to 12.5& (equation (3)), but still below the measured NO2 3
15
d N. In case (c), with NaU ranging between 5 and 10&, there is a fit between the computed range and the
observations, 211 to 22.6& (6–22.6& with the isotope effect for NH1 4 assimilation at 22&; equation (4))
and 12.3–15.2&, respectively. By taking the upper range of the field-based isotope effect for NO2 3 assimila-
tion (10&) [DiFiore et al., 2010], the computed range (11–22.6& with the isotope effect for NH1 4 assimilation
at 22&) fits best with the observations. Nitrogen appears, therefore, to be efficiently recycled through the
2
microbial foodweb, with regenerated N, both NH1 4 and NO3 , supporting primary production (Figure 5d).
2 15 15
Furthermore, brine convection will supply NO3 d N at 5.1& (i.e., underlying seawater). The NO2 3 d N of
the total input (brine convection 1 nitrification) should lie between newly produced (i.e., nitrification) and
15
seawater NO2 3 d N. Thus, if convection also supplied some nitrate, the argument for case (c) (i.e., substan-
2
tial NO3 assimilation) is even stronger.
18
This scenario (case (c)) is further supported by the NO2 3 d O in the bottom consolidated platelet layer in
October, which is observed to be higher (10.1–12.3&) than in the underlying seawater (2.4 6 0.3&; Fig-
ure 5b). Phytoplankton discriminate against 15N and 18O to a similar extent (15e 18e) [Granger et al.,
15 18
2004, 2010; Karsh et al., 2012]. As assimilation proceeds, the residual NO2 3 d N and d O should rise
nearly equally. In contrast, nitrification affects the nitrate N from O isotopes differently [Lehmann et al.,
2004; Sigman et al., 2005]. During NO2 3 assimilation and regeneration, the N isotopes are recycled
between the fixed N pools, while the O isotopes are removed in nitrate assimilation (since NO2 3 is
2
reduced to NH1 4 before assimilation) and then replaced in the nitrification process (NH 1
4 to NO 2 and
2 18
then NO2 3 ). A field estimate of newly produced NO 3 d O suggests a value close to the ambient H2O
d18O 1 1.1& [Sigman et al., 2009b]. Coculture experiments (combining NH1 4 oxidizing Bacteria, NH 1
4 oxi-
2 18
dizing Archea, and NO2 2 oxidizing Bacteria) give a range for the newly produced NO 3 d O between
21.5 and 1.3& relative to seawater H2O d18O [Buchwald et al., 2012]. Despite some uncertainty in the
d18O of newly nitrified nitrate, if the ambient NO2 3 pool was mainly recycled through nitrification, as sug-
18
gested from the much higher NO2 3 concentration than that of seawater, then the ambient NO2 3 d O
18
being produced should be relatively close to the H2O d O. Nitrate exchanges with the underlying sea-
18
water should set the NO2 3 d O between newly produced nitrate (21.5 to 1.3&) and seawater nitrate
18
(2.4&). Thus, the observed high NO2 3 d O (10.1–12.3& versus VSMOW) again suggests a balance
between NO3 production (i.e., nitrification; decreasing both d15N and d18O) and consumption (i.e., NO2
2
3
assimilation; increasing both d15N and d18O), as follows:
FRIPIAT ET AL. HIGH TURNOVER RATES OF SEA ICE FIXED N 3091Journal of Geophysical Research: Oceans 10.1002/2014JC010583
d18 ONO23 5d18 Onitrification 1eNaU (6)
Such a balance implies the full environmental expression of the isotope effect. In our calculations, we
assume that the d18O of newly produced NO2 18 18 18
3 (d Onitrification) equals the d O of ambient H2O d O (0&)
2 18
plus 1.1&. To produce the observed NO3 d O of 10.1–12.3&, the isotope effect associated with NO2 3
assimilation must be in the upper range of the field-based isotope effect (4–10&) [DiFiore et al., 2010], in
15
agreement with our NO2 3 d N computation described above (equation (5)).
DiFiore et al. [2010] observed a strong correlation between mixed layer depth and field-based isotope effect in
the Southern Ocean. Based on this result and previous work [e.g., Needoba and Harrison, 2004], the authors
suggested that the variation in eNaU is driven by the degree of light limitation. The isotope effect associated
with NO2 2 2
3 assimilation is thought to derive primarily from the rate-limiting NO3 reduction to NO2 , associated
with the enzyme nitrate reductase located in the cytoplasm [Granger et al., 2004, 2010; Karsh et al., 2012]. A
greater degree of nitrate efflux allows the intracellular fractionation to be more fully expressed at the orga-
nism scale [Needoba et al., 2004]. Needoba et al. [2004] suggested that, under light limitation, nitrate uptake is
increased relative to the nitrate reduction rate, leading to a larger internal nitrate pool and a much greater
fraction of imported nitrate effluxing back into the external medium, increasing the organism-level isotope
effect of assimilation. Taking into account the ice conditions in October (Figure 1b) and the light attenuation
coefficient for both snow and sea ice (6–80 m21 and 0.8–1.5 m21, respectively) [Nicolaus et al., 2010; Ja €rvinen
and Leppa €ranta, 2011], we calculate that the algae growing in the bottom of the ice received less than a few
percent of the surface solar irradiance. This low light level can explain, therefore, why our estimate for the iso-
tope effect (10&) is in the upper range of the field-based isotope effects.
To conclude, it seems that the commonly observed high primary production in sea ice returns mainly to the
dissolved inorganic pool, through remineralization and nitrification (Figure 5d). Together with the high fixed
N concentration (up to 20 times higher than in seawater), the balance between production and consump-
tion processes (i.e., nitrification NO2
3 assimilation) implies that the microbial foodweb is able to process a
large amount of fixed N at high rates. This is in agreement with Guglielmo et al. [2000], who found rapid
turnover rate of the large protein pool by bacterial enzymatic activity in sea ice, as well as with observations
of high fixed N assimilation rates [Harrison et al., 1990]. The high N and O isotope effects for nitrate assimila-
tion independently implied by both the d15N and the d18O of nitrate suggest that light limitation of algal
growth was important at the base of the ice over this early spring period.
4.3. Spring Evolution to Near-Complete NO2 3 Depletion
With increasing temperature and incoming solar radiation in spring (further increased by the removal of the
snow layer; Figure 1b), both primary production and porosity increased throughout the entire ice thickness
(Figure 2), allowing full-depth nitrate assimilation and brine convection (Figures 3) [Jardon et al., 2013; Grie-
wank and Notz, 2013]. Together with ice melting, these processes decrease brine salinity (Figure 2b), result-
ing in a transition to vertical density stratification within the brine network and limiting the subsequent
exchange of fixed N with underlying seawater [Tison et al., 2008]. Concomitant with this sequence of events,
21
NO2 3 was removed from the whole ice thickness, from 27 down to 4 mmol L , and PN accumulated at
21
the surface and interior of the ice, from 10 to 30 mmol L , approximately balancing the NO2 3 depletion
(Figure 3). In the bottom of the ice, this succession of events (from convection to stratification) likely pro-
moted the decline of the earlier spring algal bloom (Figure 5e), with a decrease in organic N concentration
(Figure 5a). We suggest that the large accumulation in NO2 1
3 , NH4 , and DON previously observed in October
in the bottom consolidated platelet layer was expelled out of sea ice through the full-depth brine convec-
tion and replaced by intruding seawater (Figure 3). An increase in light due to the removal of the snow layer
in November (Figure 1b) and the decrease in NH1 4 concentration may have promoted the relative decline of
the nitrifier community [e.g., Ward, 2007], preventing a new accumulation of nitrate comparable to that
observed in October.
In agreement with the preferential assimilation of 14N and 16O-nitrate, NO2 15 18
3 d N and d O increased along
2
with NO3 depletion (Figures 4a and 4b). In systems without nitrification or other inputs of nitrate during
the period of nitrate consumption, the slope given by the relationship between Ln(NO2 3 ) and both NO3
2
15 18 2
d N and d O provides estimates of the net N and O isotope effects associated with NO3 consumption
(i.e., assuming Rayleigh fractionation) [Sigman et al., 1999]. In order to estimate the net isotope effects as a
FRIPIAT ET AL. HIGH TURNOVER RATES OF SEA ICE FIXED N 3092You can also read


