Integration of spatial and single-cell transcriptomics localizes epithelial cell-immune cross-talk in kidney injury
←
→
Page content transcription
If your browser does not render page correctly, please read the page content below
Integration of spatial and single-cell transcriptomics localizes
epithelial cell–immune cross-talk in kidney injury
Ricardo Melo Ferreira, … , Tarek M. El-Achkar, Michael T. Eadon
JCI Insight. 2021;6(12):e147703. https://doi.org/10.1172/jci.insight.147703.

 Resource and Technical Advance      Nephrology

Single-cell sequencing studies have characterized the transcriptomic signature of cell types within the kidney. However,
the spatial distribution of acute kidney injury (AKI) is regional and affects cells heterogeneously. We first optimized
coordination of spatial transcriptomics and single-nuclear sequencing data sets, mapping 30 dominant cell types to a
human nephrectomy. The predicted cell-type spots corresponded with the underlying histopathology. To study the
implications of AKI on transcript expression, we then characterized the spatial transcriptomic signature of 2 murine AKI
models: ischemia/reperfusion injury (IRI) and cecal ligation puncture (CLP). Localized regions of reduced overall
expression were associated with injury pathways. Using single-cell sequencing, we deconvoluted the signature of each
spatial transcriptomic spot, identifying patterns of colocalization between immune and epithelial cells. Neutrophils
infiltrated the renal medulla in the ischemia model. Atf3 was identified as a chemotactic factor in S3 proximal tubules. In
the CLP model, infiltrating macrophages dominated the outer cortical signature, and Mdk was identified as a
corresponding chemotactic factor. The regional distribution of these immune cells was validated with multiplexed CO-
Detection by indEXing (CODEX) immunofluorescence. Spatial transcriptomic sequencing complemented single-cell
sequencing by uncovering mechanisms driving immune cell infiltration and detection of relevant cell subpopulations.

Find the latest version:
https://jci.me/147703/pdf
TECHNIC AL ADVANCE

                                         Integration of spatial and single-cell
                                         transcriptomics localizes epithelial cell–
                                         immune cross-talk in kidney injury
                                         Ricardo Melo Ferreira,1 Angela R. Sabo,1 Seth Winfree,1 Kimberly S. Collins,1 Danielle Janosevic,1
                                         Connor J. Gulbronson,1 Ying-Hua Cheng,1 Lauren Casbon,1 Daria Barwinska,1 Michael J. Ferkowicz,1
                                         Xiaoling Xuei,2 Chi Zhang,2 Kenneth W. Dunn,1 Katherine J. Kelly,1 Timothy A. Sutton,1 Takashi Hato,1
                                         Pierre C. Dagher,1 Tarek M. El-Achkar,1 and Michael T. Eadon1,2
                                         Department of Medicine and 2Department of Medical and Molecular Genetics, Indiana University School of Medicine,
                                         1

                                         Indianapolis, Indiana, USA.

                                                 Single-cell sequencing studies have characterized the transcriptomic signature of cell types within
                                                 the kidney. However, the spatial distribution of acute kidney injury (AKI) is regional and affects cells
                                                 heterogeneously. We first optimized coordination of spatial transcriptomics and single-nuclear
                                                 sequencing data sets, mapping 30 dominant cell types to a human nephrectomy. The predicted
                                                 cell-type spots corresponded with the underlying histopathology. To study the implications of AKI
                                                 on transcript expression, we then characterized the spatial transcriptomic signature of 2 murine
                                                 AKI models: ischemia/reperfusion injury (IRI) and cecal ligation puncture (CLP). Localized regions
                                                 of reduced overall expression were associated with injury pathways. Using single-cell sequencing,
                                                 we deconvoluted the signature of each spatial transcriptomic spot, identifying patterns of
                                                 colocalization between immune and epithelial cells. Neutrophils infiltrated the renal medulla in
                                                 the ischemia model. Atf3 was identified as a chemotactic factor in S3 proximal tubules. In the CLP
                                                 model, infiltrating macrophages dominated the outer cortical signature, and Mdk was identified as
                                                 a corresponding chemotactic factor. The regional distribution of these immune cells was validated
                                                 with multiplexed CO-Detection by indEXing (CODEX) immunofluorescence. Spatial transcriptomic
                                                 sequencing complemented single-cell sequencing by uncovering mechanisms driving immune cell
                                                 infiltration and detection of relevant cell subpopulations.

                                         Introduction
                                         Acute kidney injury (AKI) is a devastating disease with a negative effect on morbidity and mortality. Devel-
                                         oping therapeutic targets to treat AKI requires a better grasp of its molecular pathogenesis. Despite important
                                         advances in understanding this disease, the pathogenesis of AKI at the cellular and molecular levels remains
                                         incompletely understood. This is partially due to the diverse renal milieu of heterogeneous cell types (epitheli-
                                         al, endothelial, fibroblast, vascular smooth muscle, resident immune, and infiltrating immune cells) that inter-
Conflict of interest: The authors have   act with each other within a cosmos of unique microenvironments. Furthermore, AKI differentially affects
declared that no conflict of interest    the kidney’s diverse array of cells (1). Recently, single-cell and single-nuclear sequencing have proved major
exists.                                  breakthroughs in the creation of a molecular atlas of the kidney (2–5) by defining the transcriptomic signa-
                                         tures of specific cells within the kidney. However, spatial anchoring is essential to understanding the relation-
Copyright: © 2021, Ferreira et
al. This is an open access article       ship between cells and structures within specific renal microenvironments.
published under the terms of the              Single-cell and single-nuclear sequencing afford indirect spatial localization. In contrast, spatial transcrip-
Creative Commons Attribution 4.0         tomic platforms enable measurement of whole-transcriptome mRNA expression of thousands of genes super-
International License.                   imposed upon histological information from the same tissue section. Gene expression profiles are mapped
Submitted: January 20, 2021              back to their original location, enabling a direct link between histology and gene expression (6). Integration
Accepted: May 12, 2021                   of the single-cell sequencing with spatial transcriptomics improves power and enables in situ visualization of
Published: June 22, 2021                 signatures with mapping of a greater number of cell types than spatial transcriptomics alone (7). Together, the
                                         2 orthogonal data sets allow determination of where immune cells reside in proximity to other cells in disease
Reference information: JCI Insight.
2021;6(12):e147703.                      states and how regional injury influences the signature of epithelial cells.
https://doi.org/10.1172/jci.                  In the present study, we utilized single-nuclear and single-cell sequencing data sets to map cell types back
insight.147703.                          to spatial transcriptomic anchoring landmarks (spots) overlaid upon the human and murine kidney. We first

                                                                                                                                                            1
TECHNIC AL ADVANCE

                                  optimized the methodology in the human kidney. We then examined differentially expressed genes (DEGs)
                                  and pathways in murine ischemia/reperfusion injury (IRI) and cecal ligation puncture (CLP) models of AKI.
                                  We used the transcriptomic signatures derived from the 10× Genomics Visium spatial gene expression platform
                                  to colocalize immune cells with epithelial cells, defining the distribution of immune cell transcript expres-
                                  sion in these models. Key chemotactic factors expressed in epithelial cells were identified that contributed to
                                  immune cell infiltration and cross-talk in each injury model. Immune cell–type distributions were validated
                                  with spatially resolved multiplexed CO-Detection by indEXing (CODEX) immunofluorescence. Together, the
                                  complementary single-cell and spatial transcriptomic data sets are synergistic, enabling the development of a
                                  transcriptomic atlas of the kidney in health and disease, with direct correlation to histopathology. These tools
                                  will enhance the diagnostic capability of renal pathologists interpreting manifestations of AKI in kidney tissue.

                                  Results
                                  Unsupervised mapping and cell-type identification within the spatial transcriptomic map of the human kidney. We
                                  sought to map transcriptomic signatures directly upon a histological section from a human reference
                                  nephrectomy stained with H&E. The tissue was obtained from a 59-year-old woman with minimal glomeru-
                                  lar obsolescence and interstitial fibrosis (each affecting less than 10% of the glomeruli or renal parenchyma,
                                  respectively). No arteriolar hyalinosis was observed. An OCT compound–embedded tissue section under-
                                  went H&E staining and microscopy followed by permeabilization, RNA isolation, and sequencing with
                                  spatially localized barcodes to map back the transcriptomic signature directly upon the histological image.
                                       The result of the spatial transcriptomic mapping was a set of “spots” (55 μm in diameter), each with its
                                  own expression signature. These spots were overlaid upon the histological image of the kidney based on the
                                  localization barcodes (Figure 1, A and B) and clustered in an unsupervised fashion according to the gene
                                  expression of each spot. The identity of these clusters was established and named according to known kidney
                                  regions and cell types using differentially expressed marker genes and the underlying histology. Nine unsuper-
                                  vised clusters were generated by Space Ranger (Figure 1B), with expression signatures aligning with known
                                  marker genes of glomeruli and various tubular subsegments. These clusters were overlaid upon histological
                                  features, including glomeruli, tubules, vascular structures, and medullary rays, which were readily observed.
                                  On average, 10,270 counts were measured and 3205 genes were detected per spot. The average number of
                                  unique genes detected was 17,506 per cluster, with at least 16,000 detected in every cluster.
                                       Spots assigned to a given cluster consistently localized over the expected underlying histology. An example
                                  of cluster mapping and identification is provided in Figure 1, C–I. A subset of marker genes is provided in
                                  Figure 1J and the full set is in Supplemental Table 1; supplemental material available online with this article;
                                  https://doi.org/10.1172/jci.insight.147703DS1. A close-up of the H&E section is provided without (Figure
                                  1C) and with (Figure 1, D and E) unsupervised clusters overlaid. Glomeruli, small vessels, tubules, and a portion
                                  of the medullary rays can be visualized. Transcriptomic spots associated with glomerular genes (red) clearly
                                  overlie histologically identified glomeruli. The interstitial cluster, which includes expression of fibroblast, vascu-
                                  lar smooth muscle cell (VSMC), and endothelial cell marker genes, is seen located over vessels (pink). Although
                                  tubular morphology in OCT-embedded sections is imperfect, distinctions can still be observed. The spatial tran-
                                  scriptomic–defined proximal tubule (PT) clusters overlie eosinophilic tubules without visible lumens. This his-
                                  tological pattern corresponded with megalin (LRP2) expression (Figure 1F). Spots assigned to thick ascending
                                  limb (TAL) clusters were congregated over medullary rays and correlated with expression of the loop diuretic
                                  sensitive sodium-potassium 2-chloride transporter (SLC12A1, Figure 1G). Distal convoluted tubules (DCTs) and
                                  connecting tubules (CNTs) were characterized by eosinophilic tubules with open lumens. DCTs had high cor-
                                  responding expression of the thiazide-sensitive sodium-chloride transporter (SLC12A3, Figure 1H). Collecting
                                  ducts (CDs) were identified histologically with their characteristic nuclei in cuboidal cells and reduced eosino-
                                  philia. These tubules were overlaid by spots with high aquaporin-2 (AQP2) expression (Figure 1I).
                                       Since each spatial transcriptomic spot was 55 μm in diameter, roughly the size of a tubular cross-section,
                                  the spots can overlie multiple cell types. Two PT and 2 TAL clusters were obtained in the unsupervised
                                  mapping. One PT and 1 TAL cluster each had stronger enrichment of known marker genes and were labeled
                                  “pure.” The clusters with less enrichment of marker genes or signatures with elements of 2 or more cell types
                                  were labeled “mixed.” The mixed TAL signature was seen on the periphery of the medullary rays, and the
                                  pure cluster was more centrally located (Figure 1B).
                                       As stated, spots were classified into clusters based on the known gene expression markers of renal cell
                                  types (Figure 1J and Supplemental Table 1). The spots classified based on their gene expression signature

JCI Insight 2021;6(12):e147703 https://doi.org/10.1172/jci.insight.147703                                                                             2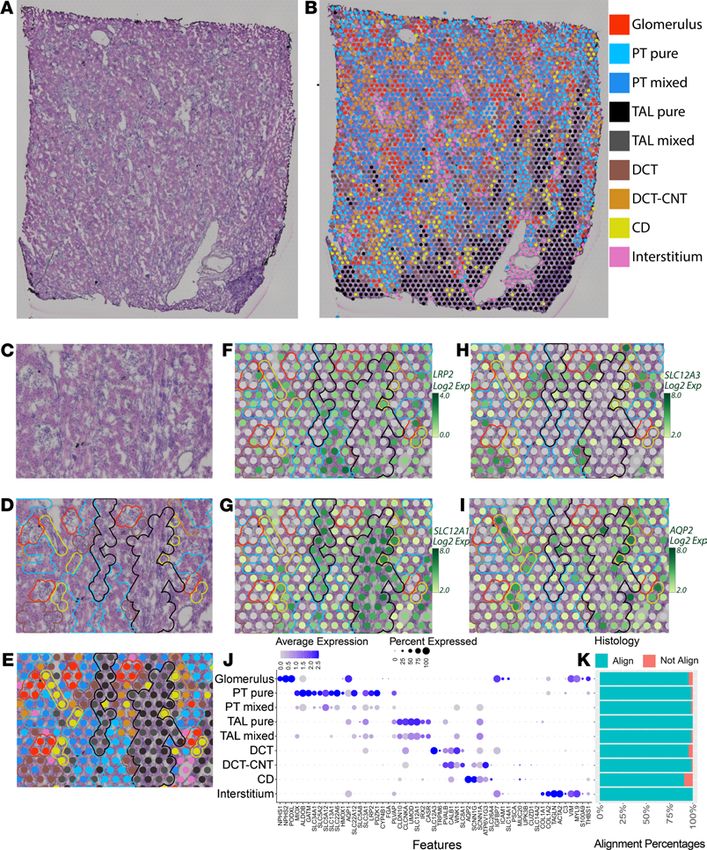
TECHNIC AL ADVANCE

                                  Figure 1. Spatial transcriptomics in a human nephrectomy sample. (A) H&E staining of the human reference nephrec-
                                  tomy. (B) The 9 unsupervised spatial transcriptomic (ST) clusters are overlaid upon the nephrectomy. Glomeruli can
                                  be seen scattered across the cortex in red. A medullary ray is seen in the right lower quadrant of the sample. Midsized
                                  vessels are often overlaid by pink interstitial cluster ST spots. Pure clusters are defined as those located mainly over the
                                  associated structure; mixed clusters often overlap with neighboring structures. (C) A high-magnification image showing
                                  histological structures in a reference nephrectomy. (D) Histological structures are highlighted in the nephrectomy. (E)
                                  Unsupervised clusters overlaid upon the nephrectomy. (F–I) Expression levels of LRP2, SLC12A1, SLC12A3, and AQP2 in
                                  the spots over the high magnification region with histological features highlighted. (J) Expression of markers used to
                                  classify unsupervised clusters. (K) In 5 random fields covering 40% of all spots, the histology underlying each spot was
                                  assessed and the percentage of concordance is provided. All clusters held greater than 90% concordance with their corre-
                                  sponding histology. n = 1 human nephrectomy. PT, proximal tubule; S1, S2, S3, segments of PT; TAL, thick ascending limb;
                                  DCT, distal convoluted tubule; CNT, connecting tubule; CD, collecting duct. Each spot is 55 μm in diameter.

                                  mapped to expected histological/renal structures consistently. We assessed the consistence of the assigned
                                  transcriptomic cluster to the underlying histology in 5 randomly selected fields (Figure 1K). The overall
                                  correlation between assigned clusters and histological structures was 97.6%. All clusters mapped to a corre-
                                  sponding histological structure at greater than 95% accuracy except the CD (90.7%), which had the fewest

JCI Insight 2021;6(12):e147703 https://doi.org/10.1172/jci.insight.147703                                                                                   3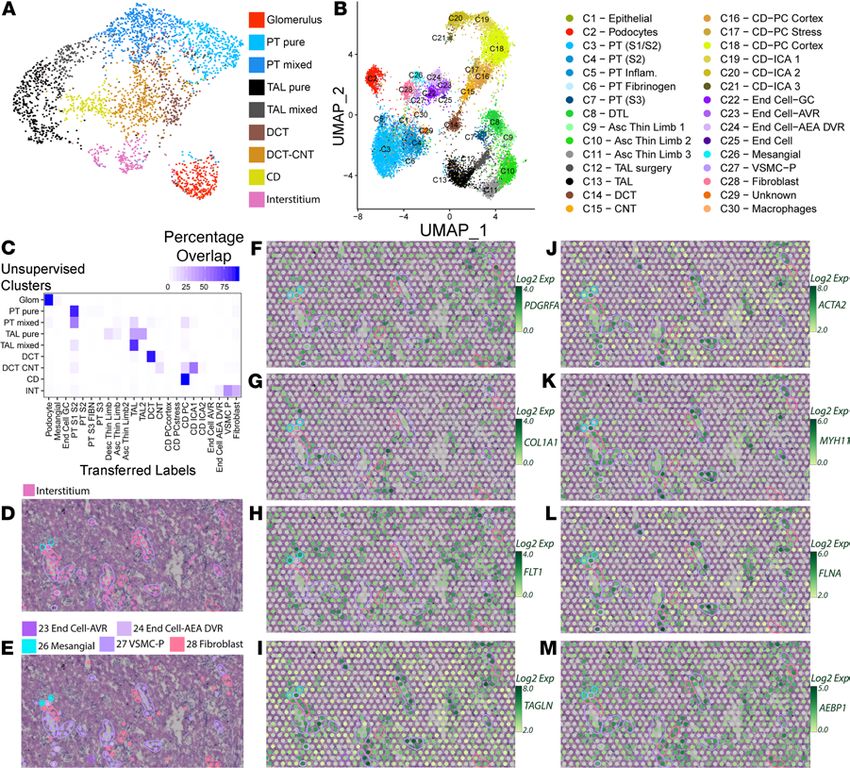
TECHNIC AL ADVANCE

Figure 2. Transfer of single-nuclei RNA sequencing clusters to the human spatial transcriptomic sample. (A) UMAP projection of spatial transcriptom-
ic (ST) data with 9 unsupervised clusters defined by Space Ranger. Spots assigned to the pure PT or thick ascending limb clusters were more frequently
located over their corresponding histology; mixed clusters often overlapped neighboring structures. (B) A UMAP projection of the single-nucleus RNA-Seq
data (GSE121862) depicts the 30 kidney cell clusters obtained from Pagoda. (C) The percentage of ST spots overlapping between unsupervised cluster spot
identities and supervised cluster identities defined by single-nuclei expression signatures. Strong correlation is seen between expected clusters. Each row
of the table adds to 100%. (D) A high-magnification image of the H&E-stained human reference nephrectomy with unsupervised interstitium cluster spots
overlaid. Histological structures are highlighted. (E) A high-magnification image of the H&E-stained reference nephrectomy with mapped single-nucleus
clusters associated with interstitium and histological structures highlighted. (F–M) Feature plots depict the expression levels of interstitial cell-type mark-
ers, such as PDGFRA, COL1A1, FLT1, TAGLN, ACTA2, MYH11, FLNA, and AEBP1, in the high-magnification region. Histological features highlighted. PT, proxi-
mal tubule; S1, S2, S3, segments of PT; TAL, thick ascending limb; DCT, distal convoluted tubule; CNT, connecting tubule; CD, collecting duct; DTL, descending
thin limb; Asc, ascending; PC, principal cells; IC, intercalated cells; End, endothelial; GC, glomerular capsule; AVR, ascending vasa recta; AEA, afferent and
efferent arterioles; DVR, descending vasa recta; VSMC-P, vascular smooth cells and pericytes. Each spot is 55 μm in diameter.

                                    overall spots in the specimen. The most frequent reason for discordance was the lack of significant tissue
                                    underlying a spot (e.g., a spot at the edge or within a large vessel).
                                        Mapping of single-nuclear sequencing clusters to human kidney tissue. A uniform manifold approximation and
                                    projection (UMAP) of the unsupervised clusters obtained through Space Ranger is provided in Figure 2A.
                                    To improve the specificity of spot mapping and identify less frequent cell types that may contribute to the
                                    signature of a spot, we reclustered a publicly available single-nuclear RNA sequencing (snRNA-Seq) data set
                                    from human kidney samples (Figure 2B and ref. 2). The full list of DEG markers of each single-cell RNA
                                    sequencing (scRNA-Seq) cluster is in Supplemental Table 2. Thirty cell-type clusters were identified. In a
                                    process similar to single-cell cluster integration (8), transfer scores were assigned to spatial transcriptomic
                                    spots for each of the 30 snRNA-Seq clusters based on anchoring of common neighbors. Each spot was then

JCI Insight 2021;6(12):e147703 https://doi.org/10.1172/jci.insight.147703                                                                                    4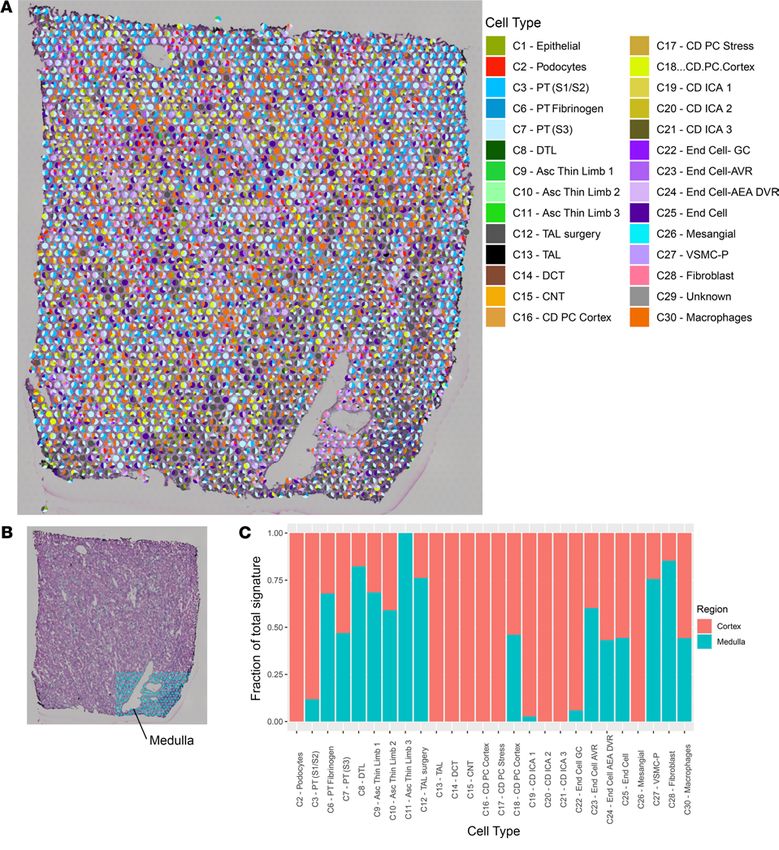
TECHNIC AL ADVANCE
labeled according to the snRNA-Seq cluster with the highest transfer score (Figure 2C). The percentage of
spots overlapping between the unsupervised spatial transcriptomic clusters and those relabeled according
to the snRNA-Seq transfer scores was assessed. A strong correlation was found between the unsupervised
spatial transcriptomic classified spots and the spots redefined with the expected snRNA-Seq transfer labels.
Several cell types that were not represented in the unsupervised spatial transcriptomic clusters had
spots assigned to them after snRNA-Seq relabeling. Since each spot covered multiple cells, the cell type
was assigned to the most dominant cell type in that 55 μm spot. For example, multiple cell types contribute
to the expression signature of the interstitium (9). The inclusion of snRNA-Seq data resolved the spots
localizing in the interstitium to a more specific set of cell types (Figure 2, D–M). This data set allowed
discrimination of spots assigned to fibroblasts, VSMCs, and some endothelium subtypes. Feature plots of
known markers for the interstitium are shown in Figure 2, F–M.
Cell-type deconvolution. Since each spot may overlie multiple cell types, we sought to determine the con-
tribution of each snRNA-Seq cluster to the expression signature of each spot in a neural network analysis
(Figure 3). As expected, the podocyte, mesangial cell, and endothelial cell clusters contributed the greatest
proportion of signature to spots overlying glomeruli. A portion of medulla was included in the right lower
portion of the nephrectomy sample. We quantitated the proportion of signature arising from each snR-
NA-Seq cluster in the medulla as compared with the remaining sample. Expression of genes defining the
descending thin limb, ascending thin limb, and thick ascending loop of Henle were enriched in the medul-
la. As expected, no expression of podocyte signature and minimal contribution from S1 and S2 PTs were
observed in the medulla. Two cortical CD clusters had been identified in the original snRNA-Seq data set
(C16 and C18); however, in the spatial transcriptomic data set, the signature of C18 was found in both the
cortex and medulla, while C16 mapped exclusively to the cortex.
Spatial transcriptomic cell-type localization in the murine kidney. AKI does not affect all regions of the kidney uni-
formly. The etiology of injury may differentially affect the spatial distribution of gene expression, especially in the
early course of disease. Therefore, we applied spatial transcriptomics on 2 common murine models of AKI (IRI
and CLP), and the mice were euthanized at 6 hours. The unsupervised spatial transcriptomic cluster mapping
is shown in Figure 4 for the sham, IRI, and CLP models. In matched cross-sections of the 3 models, minimal
histopathological injury was observed with H&E staining at the 6-hour time point (Figure 4A). At low-power
magnification, the IRI tissue area was larger (25.5 mm2) than the sham (16.9 mm2) and CLP (15.9 mm2) sections.
Figure 4B overlays each section with the clusters obtained from Space Ranger. Two clusters were only present
in the IRI model: the interstitium and urothelium clusters, the latter possibly because of the size of the papilla in
the section. The 3 models were merged and normalized to allow comparisons between models (Figure 4C). A
full set of DEGs between unsupervised spatial transcriptomic clusters is in Supplemental Table 3. Murine cells
and tubules are smaller than their human counterparts, so each 55 μm spot is labeled by its dominant contributor.
Fewer unsupervised clusters were identified in the mouse than the human. For example, the DCT, CNT, and CD
of the distal nephron all clustered together. Similarly, the PT S3 segment cluster localized to the outer stripe and
contained gene expression from the neighboring TAL. A subset of marker genes used to identify the clusters is
depicted in Figure 4D. A specific comparison of the PT cluster DEGs is in Supplemental Figure 1.
Regional expression differences and pathway enrichment in injury models. The expression of 2 common markers of
injury, kidney injury molecule-1 (Havcr1) and neutrophil gelatinase-associated lipocalin (Lcn2), were plotted in
each model (Supplemental Figure 2). The distribution of Havcr1 expression was localized to the outer stripe in
the IRI model and not upregulated in the CLP model. Lcn2 expression was diffusely upregulated in both models.
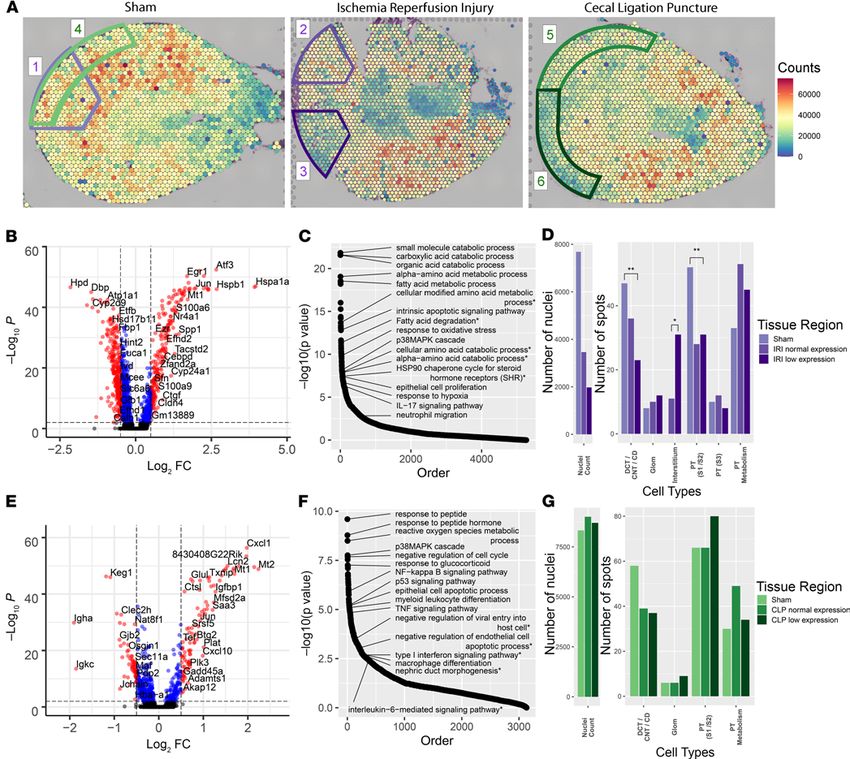
In the cortex of both models, we observed regional differences in the overall expression level of each
spot as measured in total read counts across all genes (Figure 5A). We selected circumscribed regions of the
IRI and CLP models that had areas of reduced expression when compared with the sham, despite minimal
histopathological evidence of injury. These regions of “low” expression in IRI and CLP were compared
with size-matched regions with relatively “preserved” expression. The low-expression regions were also
compared with identically sized regions in the sham.
The DEGs, across all spots regardless of cluster identity, were uncovered in the IRI low-expression
region and the equivalent sham region (Figure 5B). Despite the overall reduction in total read counts in
IRI, a number of genes were significantly upregulated in the low-expression region. The enriched pathways
based on the DEGs are presented in Figure 5C with a subset of pathways annotated. Several enriched path-
ways were identified related to metabolism of amino acids and fatty acids, possibly related to a metabolic
shift associated with hypoxia (10–14). Other pathways suggest prominent injury response mechanisms,
JCI Insight 2021;6(12):e147703 https://doi.org/10.1172/jci.insight.147703 5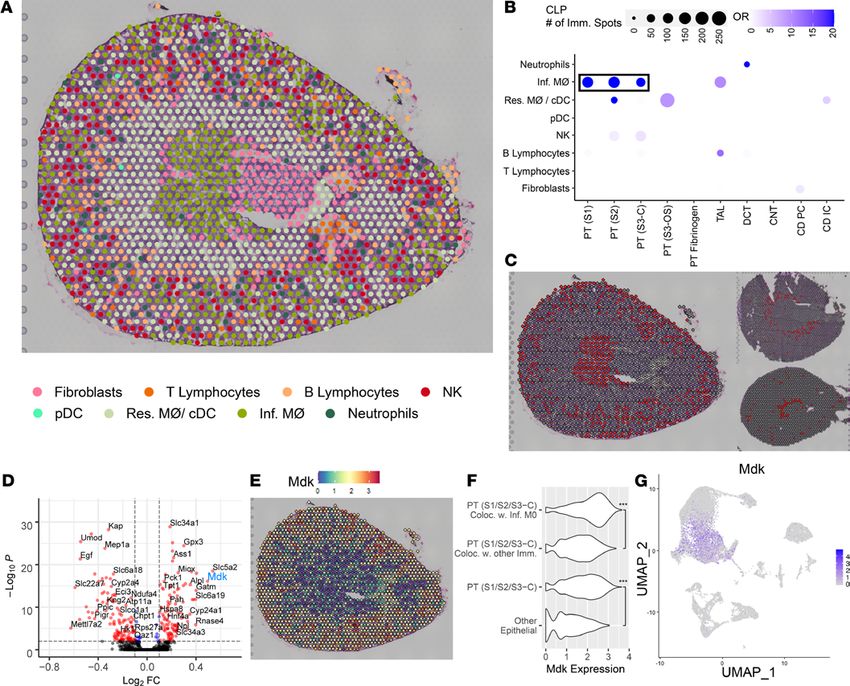
TECHNIC AL ADVANCE

Figure 3. Neural network analysis of human kidney. (A) Each pie chart represents the contribution of the cell types from the single-nuclei reference data
set to the transcriptomic signature of each spot in the human nephrectomy. Only cell types contributing to at least 10% of the spot signature are displayed.
(B) An inset depicts the medullary region highlighted in blue (manually annotated). The remaining nephrectomy was considered cortex. (C) Fraction of total
signature of each cell type present in the cortex and medulla, normalized to the total number of spots in the cortex and medulla. Each bar is calculated as
follows: the proportion of expression arising from each spot was summed for each cell type in both the cortex and medulla. Summed expression was first
normalized for (divided by) the number of spots in the cortex and medulla and then expressed as a ratio of expression arising from the cortex or medulla for
each cell type. PT, proximal tubule; S1, S2, S3, segments of PT; TAL, thick ascending limb; DCT, distal convoluted tubule; CNT, connecting tubule; CD, collect-
ing duct; DTL, descending thin limb; Asc, ascending; PC, principal cells; IC, intercalated cells; End, endothelial; GC, glomerular capsule; AVR, ascending vasa
recta; AEA afferent and efferent arterioles; DVR, descending vasa recta; VSMC-P, vascular smooth cells and pericytes. Each spot is 55 μm in diameter.

                                    such as apoptosis, oxidative stress, and the p38 MAPK cascade (15–17). IL-17 signaling and enrichment of
                                    neutrophil migration indicate a potential inflammatory response of neutrophils in the IRI model (18–20).
                                    The full pathway list is in Supplemental Table 4 and DEGs are in Supplemental Table 5.
                                        In a separate comparison, the IRI low- and preserved-expression regions were compared (Supplemental
                                    Tables 4 and 5). Similar DEGs and pathways were identified, albeit at lower levels of significance. The IRI

JCI Insight 2021;6(12):e147703 https://doi.org/10.1172/jci.insight.147703                                                                                         6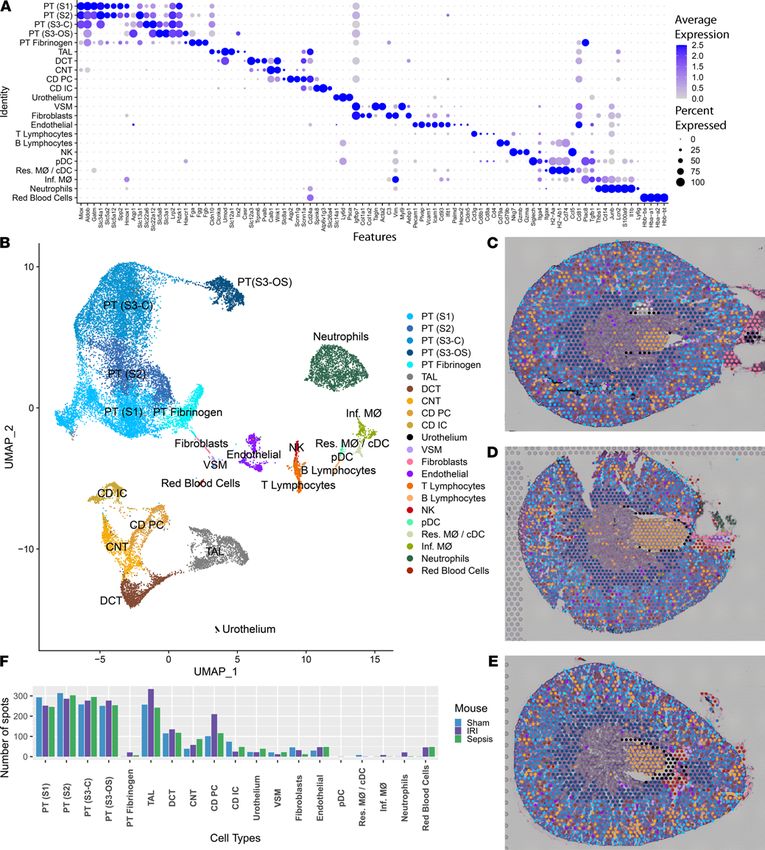
TECHNIC AL ADVANCE

JCI Insight 2021;6(12):e147703 https://doi.org/10.1172/jci.insight.147703                    7
TECHNIC AL ADVANCE

Figure 4. Spatial transcriptomics in murine kidney injury models. (A) H&E-stained sections of the 3 murine models: sham, ischemia/reperfusion injury
(IRI), and cecal ligation puncture (CLP), respectively. (B) Spatial transcriptomic spots are overlaid upon each murine kidney derived from unbiased cluster-
ing. (C) A UMAP of the spatial clusters after the data was merged, split by tissue of origin (sham on left, IRI in middle, and CLP on right). (D) Expression of
markers used to classify the spatial transcriptomic clusters. n = 1 murine sample per model. PT, proximal tubule; S1, S2, S3, segments of PT; Med, medul-
lary; TAL, thick ascending limb; DCT, distal convoluted tubule; CNT, connecting tubule; CD, collecting; Glom, glomerulus. Each spot is 55 μm in diameter.

                                    preserved-expression region fell along the spectrum of expression changes between the IRI low-expression
                                    region and the sham region. We assessed the total nuclei count and spot distribution in each of these select-
                                    ed regions (Figure 5D). The sham region had approximately twice the nuclei of the IRI normal region and
                                    4-fold more nuclei than the IRI low region. This finding is consistent with the overall changes in total region-
                                    al expression. We speculate that this relative loss of nuclei in the IRI regions was due to interstitial edema
                                    because widespread apoptosis is not expected 6 hours after IRI. Furthermore, the change in the distribution
                                    of spot identity is also supportive, wherein the IRI model had an increased number of spots assigned to the
                                    interstitial cluster compared with the sham region, which had no spots mapping to the interstitial cluster. A
                                    reduced number of epithelial cells in the spots of the injured tissue may account for this shift in distribution.
                                    Indeed, fewer spots were found to map to tubular clusters (DCT/CNT/CD and PT [S1/S2]) in the IRI model.
                                         An equivalent analysis was performed for the CLP model (Supplemental Tables 4 and 5). The DEGs
                                    and enriched pathways between the CLP low and sham regions were consistent with known changes in the
                                    CLP model, including p53 signaling, cell cycle arrest, apoptosis, TNF signaling, and macrophage differ-
                                    entiation (Figure 5, E and F). The preserved CLP region had muted expression differences and pathway
                                    enrichment, again falling along the differential expression spectrum between the CLP low and sham com-
                                    parison. In contrast to the IRI model, differences in the nuclei count and the spot cluster identity distri-
                                    bution were not found (Figure 5G). Together, the expression patterns, nuclei count, and similarity in spot
                                    identity distribution between regions in the CLP model suggest a very different injury pattern than IRI. As
                                    compared with IRI, CLP injury may lead to less space occupying interstitial edema.
                                         Mapping of single-cell sequencing clusters to murine kidney tissue. To improve resolution and cell-type specific-
                                    ity, murine scRNA-Seq data sets were clustered to build a common reference murine kidney cell atlas across
                                    models. To define cell types relevant to each model, kidneys from a sham and IRI mouse were disaggregated
                                    for scRNA-Seq. To obtain signatures of cell types relevant to the CLP model, publicly available scRNA-Seq
                                    data from an endotoxin LPS model (mouse euthanized 4 hours after endotoxin) and a corresponding sham
                                    animal were utilized (21). Although the models for the scRNA-Seq and spatial transcriptomic data sets
                                    were not identical, the scRNA-Seq data serve a broader purpose by allowing the identification of cell-type
                                    signatures within the spatial transcriptomic samples. Expected epithelial, infiltrating immune, and other cell
                                    types were identified based on their expression signature (Figure 6A and Supplemental Table 6). The com-
                                    mon scRNA-Seq clusters from the composite UMAP of all 4 animals (IRI and sham, LPS and sham) were
                                    then mapped upon the histological section of each model (Figure 6, B–E). Beyond the traditional epithelial
                                    cell types, we identified 2 clusters of injured PT cells highly expressing either Havcr1 or fibrinogen (Fga, Fgb,
                                    Fgg; ref. 22). The cluster expressing Havcr1, PT (S3-OS), expressed markers of the S3 PT, suggesting injury
                                    to the outer stripe region of the medulla. The PT fibrinogen cluster also had some expression of Havcr1, but
                                    was rich in Fga, Fgb, and Fgg and markers of the more cortical S1 and S2 PT markers. Both a cortical PT S3
                                    cluster (PT-S3-C) and a medullary PT S3 cluster (PT-S3-OS) were identified in the scRNA-Seq data set (21).
                                    The DEGs between these 2 clusters were compared (Supplemental Figure 1). Although a similar number of
                                    spatial transcriptomic spots mapped to each cluster, the density of PT-S3-OS was much greater in the outer
                                    stripe than the PT-S3-C in the cortex. The PT-S3-C appeared to reside near medullary rays, although the
                                    contribution of PT S2 to the PT-S3-C cluster cannot be excluded.
                                         We examined differential expression between the IRI and CLP models in a subset of epithelial cell clus-
                                    ters in the spatial transcriptomic data set (Supplemental Figure 3) and between the IRI and LPS scRNA-Seq
                                    data sets (Supplemental Figure 4). A high degree of overlap was found in each technology’s epithelial cell
                                    DEGs but not immune cell DEGs because of the paucity of spatial transcriptomic immune cell spots.
                                         Among the immune cell clusters mapped using the scRNA-Seq data set, we identified neutrophils, NK
                                    cells, B and T lymphocytes, plasmacytoid DCs (high in Siglech), and 2 infiltrating macrophage clusters, Ear2+
                                    (Ly6clo) and Chil3+ (Ly6chi; ref. 23). A single cluster was found to contain resident macrophages and classical
                                    DCs (high in H2-Aa, H2-Ab1), which could not be subclustered because of cell sample size. The resultant
                                    composite cluster set was used to transfer the scRNA-Seq cluster labels to the spatial transcriptomic spots.

JCI Insight 2021;6(12):e147703 https://doi.org/10.1172/jci.insight.147703                                                                                     8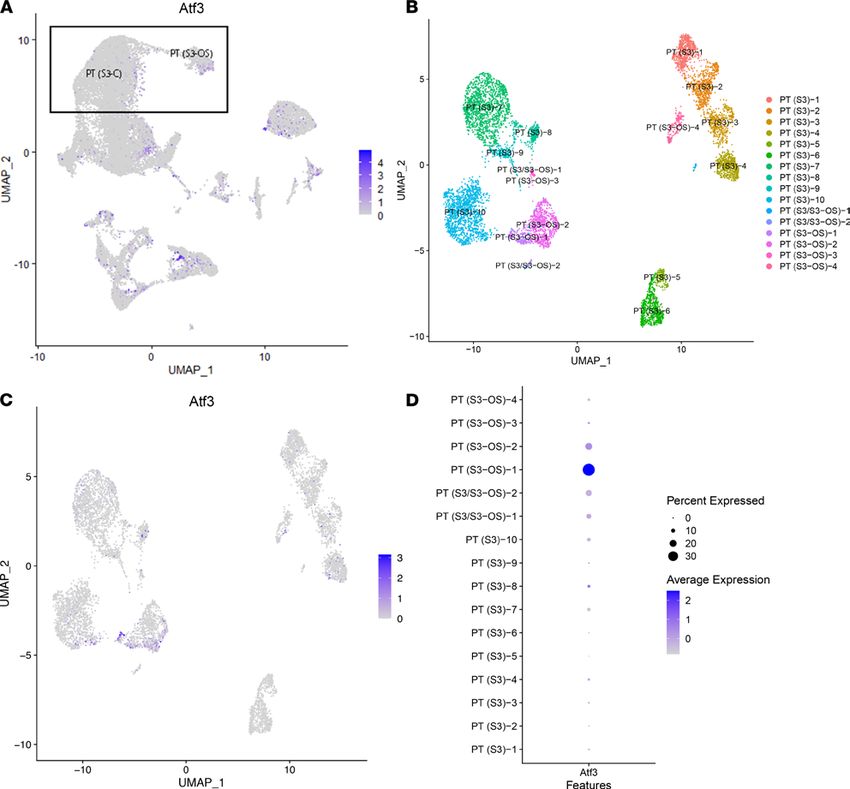
TECHNIC AL ADVANCE

Figure 5. Regional expression in murine kidney injury models. (A) Total expression in read counts was summed for each spatial transcriptomic (ST)
spot and the total expression level was overlaid upon each of the 3 murine model sections: sham (left), ischemia/reperfusion injury (IRI, middle), and
cecal ligation puncture (CLP, right). Regions of interest and comparator regions are highlighted. In the sham, areas are selected to serve as reference to
IRI (1, outlined in purple) and to CLP (4, outlined in green). In the IRI section, region 2 corresponds to the relatively “preserved” overall expression region
and region 3 corresponds to a region of low relative expression. In the CLP section, analogous regions of preserved expression (5) and low expression (6)
were selected. The regions were defined with similar areas within each comparison. (B) Volcano plot comparing the low-expression region in the IRI to the
equivalent region in the sham. Despite the overall reduced expression of the IRI region, many individual genes were upregulated in IRI (right). (C) Pathways
enriched for the differentially expressed genes (DEGs) between the low-expression region in IRI when compared with the sham. (D) Bar plots showing the
number of nuclei and number of spots of each cluster in the 3 purple comparison regions. The asterisks indicate the significance level (*P < 0.1, **P < 0.001
as calculated by Fisher’s exact test. (E) Volcano plot comparing the low-expression region in the CLP to the equivalent region in the sham with upregulated
genes in CLP on the right. (F) Pathways enriched for the DEGs between the low--expression region in CLP when compared with sham. (G) Bar plots showing
the number of nuclei and number of spots of each cluster in the 3 green comparison regions. Each spot is 55 μm in diameter.

                                         The number of spots assigned to each cell type is provided in Figure 6F. Although the single-cell data set
                                    yielded an abundant immune cell population, very few spatial transcriptomic spots were assigned to those
                                    cell types. This apparent discord may be related to the dominant transcriptomic signature originating from
                                    the more abundant epithelial cells. To understand the immune cell distribution, we first applied a SPOTlight
                                    neural network analysis to each model (Supplemental Figure 5). The resulting cell distribution qualitatively
                                    agreed with the results of Figure 7. However, immune cell populations were not sufficiently represented in

JCI Insight 2021;6(12):e147703 https://doi.org/10.1172/jci.insight.147703                                                                                    9
TECHNIC AL ADVANCE Figure 6. Single-cell murine data and cluster transfer to spatial transcriptomic samples. (A) Expression levels of markers used to define clusters in the single-cell data. The single-cell RNA sequencing data set consists of 4 murine samples: an ischemia/reperfusion injury (IRI) mouse with corresponding sham and an LPS endotoxin–administered mouse with its corresponding sham. (B) A UMAP displays the clusters obtained from the single-cell data. (C–E) Mapping of the single-cell clusters over the 3 murine spatial transcriptomic sections: sham, IRI, and cecal ligation puncture, respectively. (F) Quantitation of the number of spots mapped to each of the single-cell clusters. Raw spot counts are provided without further calculation. PT, proximal tubule; S1, S2, S3, segments of PT; S3-C, cortical section of S3; S3-OS, outer stripe section of S3; TAL, thick ascending limb; DCT, distal convoluted tubule; CNT, connect- ing tubule; CD, collecting duct; PC, principal cells; IC, intercalated cells; VSM, vascular smooth muscle; pDC, plasmacytoid DCs; cDC, conventional DCs; Res. MΦ, resident macrophages; Inf. MΦ, infiltrating macrophages. Each spot is 55 μm in diameter. JCI Insight 2021;6(12):e147703 https://doi.org/10.1172/jci.insight.147703 10
TECHNIC AL ADVANCE
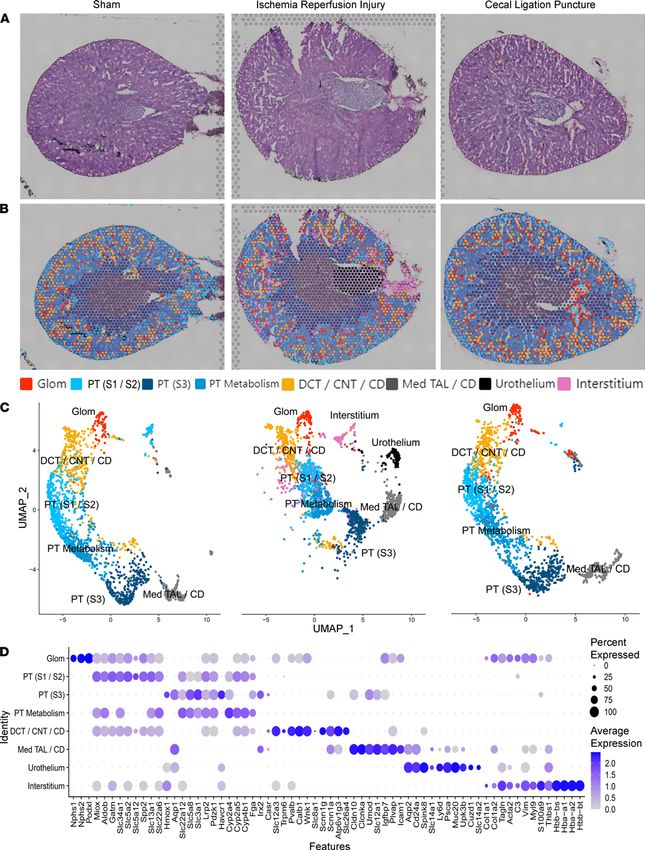
Figure 7. Colocalization of immune clusters in the ischemia/reperfusion injury model. (A and B) Selected single-cell immune clusters are overlaid upon
the spatial transcriptomic sections for the sham and ischemia/reperfusion injury (IRI) models, respectively. Each spot was labeled with the immune cell
with the highest corresponding transfer score. (C) The odds ratio of colocalization for each pair of immune and epithelial clusters in the IRI model when
compared with the sham. Only significant comparisons are included in the dot plot as calculated by a Fisher’s exact test. Neutrophils most frequently
colocalized with the PT (S3-OS) epithelial cluster. (D) Neutrophil plot in IRI (left), sham (top-right), and cecal ligation puncture (CLP, bottom-right). (E)
The differentially expressed genes (DEGs) between the PT (S3-OS) spots colocalizing with neutrophils (right) and the PT (S3-OS) spots colocalizing with
other immune clusters in IRI (left). (F) The gene expression of Atf3 localizes to the outer stripe in IRI. (G) Antibody immunofluorescence of ATF3 reveals
medullary outer stripe protein expression in the IRI model (n = 3). (H) The expression distribution of Atf3 in selected clusters (**P < 10–9, ***P < 10–15) as
calculated by a Fisher’s exact test. PT, proximal tubule; S1, S2, S3, segments of PT; S3-C, cortical section of S3; S3-OS, outer stripe section of S3; TAL, thick
ascending limb; DCT, distal convoluted tubule; CNT, connecting tubule; CD, collecting duct; PC, principal cells; IC, intercalated cells; pDC, plasmacytoid DCs;
cDC, conventional DCs; Res. MΦ, resident macrophages; Inf. MΦ, infiltrating macrophages. Each spot is 55 μm in diameter. Scale bar: 500 μm (G).
the neural network analysis. Thus, a transfer score system was adapted to understand the rank and relative
contribution of each scRNA-Seq cell type to the signature of a given spatial transcriptomic spot (Supplemen-
tal Table 7). After suppression of the epithelial and endothelial scRNA-Seq clusters, the immune cell and
fibroblast scRNA-Seq cluster labels were remapped over the histological images (Figures 7, 8, and 9).
JCI Insight 2021;6(12):e147703 https://doi.org/10.1172/jci.insight.147703 11TECHNIC AL ADVANCE
Figure 8. Identification of a proximal tubular single-cell subcluster expressing Atf3. (A) Feature plot of the single-cell data presenting the expression of
Atf3 with PT (S3-C) and PT (S3-OS) clusters highlighted. (B) A UMAP of the PT (S3-C) and PT (S3-OS) single-cell clusters, reclustered at increased resolu-
tion. (C) Feature plot of Atf3 with its expression in the single-cell subclusters shows Atf3 specifically in 1 outer stripe subcluster. (D) The expression of Atf3
in all subclusters. PT, proximal tubule; S1, S2, S3, segments of PT; S3-C, cortical section of S3; S3-OS, outer stripe section of S3.
Colocalization of immune and epithelial cell transcriptomic signatures in spots of the IRI model. Figure 7, A
and B presents the spatial distribution of immune cell and fibroblast clusters mapped onto the sham and
IRI models, respectively. A transfer score was quantitated for each scRNA-Seq cluster signature for every
spatial transcriptomic spot. Only the immune cell with the highest ranked transfer score is displayed. Fibro-
blasts were included in the analysis as a control, i.e., the immune cell transfer score had to at least exceed
that of a fibroblast to be mapped to the histological section. These new immune cell spot identities were
then compared with the original epithelial cell type spot identities mapped in Figure 6.
To evaluate the colocalization of immune and epithelial cells, an odds ratio of colocalization was cal-
culated across all spatial transcriptomic spots (Figure 8C and Supplemental Table 8) as compared with the
sham mouse. The strongest association was found between the PT S3 spots of the outer stripe (PT [S3-OS])
with the neutrophil and infiltrating macrophage signature. The remaining significant cluster pairs possessed
lower odds ratios or were indicative of resident macrophage colocalization. We elected to explore the rela-
tionship between the PT (S3-OS) and neutrophil migration.
JCI Insight 2021;6(12):e147703 https://doi.org/10.1172/jci.insight.147703 12TECHNIC AL ADVANCE
The neutrophil scRNA-Seq cluster mapped specifically to spatial transcriptomic spots of the outer
stripe of the medulla in the IRI model (Figure 7D). Such coclustering was not apparent in the sham and
CLP models. In the IRI model, we then queried DEGs between the PT (S3-OS) spots that colocalized
with neutrophils and the PT (S3-OS) spots that colocalized with any other immune cell type (Figure 7E
and Supplemental Table 9). Among the DEGs was Atf3 (activating transcription factor 3), a regulator of
neutrophil migration (24). The expression of Atf3 specifically colocalized to the outer stripe of the medulla
(Figure 7F). Atf3 protein expression similarly localized to the outer stripe (Figure 7G and Supplemental
Figure 6). The expression of Atf3 was higher in the PT (S3-OS) that colocalized with neutrophils versus
the PT (S3-OS) that did not colocalize; expression of Atf3 was also higher in the PT (S3-OS) than all other
epithelial cell types (Figure 7H).
Given that a subpopulation of PT S3 expressing Atf3 was detected, the expression of Atf3 was assessed
in the single-cell data (Figure 8A). The presence of a small, tightly grouped set of cells with high expres-
sion of Atf3 suggested the possibility of a meaningful subpopulation. We then reclustered the cortical and
outer-stripe clusters of PT S3 to better identify the subpopulation equivalent to the one detected in spatial
transcriptomics. Figure 8B shows the UMAP of the subclusters; Figure 8C shows the expression of Atf3
in those cells. Finally, Figure 8D shows we were able to identify a subpopulation of cells originating from
the outer stripe that highly expressed Atf3. Thus, the spatial transcriptomic data facilitated the discovery
of a potentially new cell type within the scRNA-Seq data set: a PT S3 cell that is signaling neutrophils.
As a control, we identified S100a6 as a significantly downregulated gene in the PT (S3-OS) cluster that
colocalized with neutrophils (Supplemental Figure 7). This gene was not highly expressed in the outer
stripe by spatial transcriptomics. In the scRNA-Seq data set, S100a6 was expressed across most immune
cell types, including neutrophils.
Colocalization of immune and epithelial cell transcriptomic signatures in spots of the CLP model. In a corre-
sponding analysis, we then investigated the transfer of the scRNA-Seq immune cell clusters over the CLP
section (Figure 9A). The odds ratio of colocalization (Figure 9B and Supplemental Table 8) indicates
macrophage signature colocalization throughout the cortical segments of PTs. Chil3+ and Ear2+ infiltrat-
ing macrophage clusters were merged to increase detection power. The spots containing a highest-ranking
macrophage transfer score (i.e., strongest macrophage expression signature components) are highlighted
in the 3 models (Figure 9C) and suggest that macrophage infiltration was most pronounced in the cortex
of the CLP mouse as compared with the sham or IRI model. DEGs were assessed between PT spots in the
CLP model that colocalized with infiltrating macrophage clusters versus PT spots that colocalized with
any other immune cell or fibroblasts (Figure 9D and Supplemental Table 9). Among the top DEGs asso-
ciated with macrophage colocalization was Midkine (Mdk), a gene encoding a growth factor associated
with macrophage recruitment (25), which was more highly expressed in the outer cortex of the CLP sec-
tion (Figure 9E). The expression of Mdk was higher in cortical PT spots that colocalized with infiltrating
macrophages compared with cortical PT spots that did not colocalize with macrophages and compared
with all other epithelial cell types (Figure 9F). In contrast to Atf3, the expression of Mdk in the scRNA-Seq
data set (Figure 9G) did not indicate a clear subpopulation of Mdk-expressing PT cells, but was instead
diffusely expressed across the PT. In addition to the colocalization of the macrophage signature with the
PT signature, a smaller but still significant association was observed between the NK cell signature and the
proximal tubular signature in the CLP model.
Visualization of immune cells by multiplexed immunofluorescence imaging of the murine injury models. To val-
idate the localization of immune cells in each model, we performed CODEX multiplexed immunofluores-
cence imaging on sections from the same animals (26). Figure 10 shows the immune cell distribution in
the sham, IRI, and CLP models. Supplemental Figure 8 presents the gating strategy employed in CODEX
interrogation. In comparison with the sham model, neutrophils (Ly6G+ and CD11bhi) were found to pre-
dominantly infiltrate the outer stripe of the IRI section (Figure 10D). The percentage of neutrophils and
infiltrating macrophages in each approximate region of the kidney (papilla, inner medulla, outer stripe
of the medulla, and cortex) was quantitated (Figure 10, D–F). In the IRI model, 52.2% of all infiltrating
neutrophils localized to the outer stripe. This finding is consistent with the localization of neutrophil cluster
spatial transcriptomic spots to the outer stripe (Supplemental Table 10).
In the CLP model, 80.2% of infiltrating macrophages (Ly6G– and CD11bhi) localized to the outer
cortex (Figure 10F). The infiltrating macrophage signature dominated and colocalized with PT epithe-
lial spots in the spatial transcriptomic analysis (Figure 9C), and the distribution of these macrophages
JCI Insight 2021;6(12):e147703 https://doi.org/10.1172/jci.insight.147703 13TECHNIC AL ADVANCE
Figure 9. Colocalization of immune clusters in the cecal ligation puncture model. (A) Selected single-cell immune clusters were transferred over the cecal
ligation puncture (CLP) spatial transcriptomic section. (B) The odds ratio of colocalization for each pair of immune and epithelial clusters in CLP when
compared with the sham. (C) Infiltrating macrophages localized to the outer cortex and inner medulla. Infiltrating macrophage localization is depicted in
the CLP (left), sham (top-right), and ischemia/reperfusion injury (bottom-right). (D) The differentially expressed genes (DEGs) between the PT (S1/S2/
S3-C) spots colocalizing with infiltrating macrophages (right) and the ones colocalizing with other immune clusters in CLP. (E) The gene expression of MdK
in CLP. (F) The expression distribution of Mdk in selected clusters (***P < 10–15) as calculated by a Fisher’s exact test. (G) The expression of Mdk in the sin-
gle-cell data. PT, proximal tubule; S1, S2, S3, segments of PT; S3-C, cortical section of S3; S3-OS, outer stripe section of S3; TAL, thick ascending limb; DCT,
distal convoluted tubule; CNT, connecting tubule; CD, collecting duct; PC, principal cells; IC, intercalated cells; pDC, plasmacytoid DCs; cDC, conventional
DCs; Res. MΦ, resident macrophages; Inf. MΦ, infiltrating macrophages. Each spot is 55 μm in diameter.
localized to the outer cortex of the kidney by immunofluorescence. However, no increase in macrophage
quantity was observed in the CLP model as compared with the sham model. We speculate that the acti-
vated macrophages in the CLP model contributed to the transcriptomic signature to a greater extent than
the macrophages in the sham model.
A second finding in the CLP model was the infiltration of NK cells in the cortex and outer stripe
of the kidney. Cells consistent with NK cells (CD45+, CD11b–, B220–, CD3–, CD4–, CD8–) localized to
these regions in the CODEX assay. Further, the NK cell infiltration aligned with spatial transcriptomic
colocalization of NK cells with PT S2 and PT S3 expression signatures in the CLP model (Figure 9B). In
summary, the spatial transcriptomic signatures uncovered in the IRI and CLP models were supported by
the immunofluorescence data.
JCI Insight 2021;6(12):e147703 https://doi.org/10.1172/jci.insight.147703 14TECHNIC AL ADVANCE
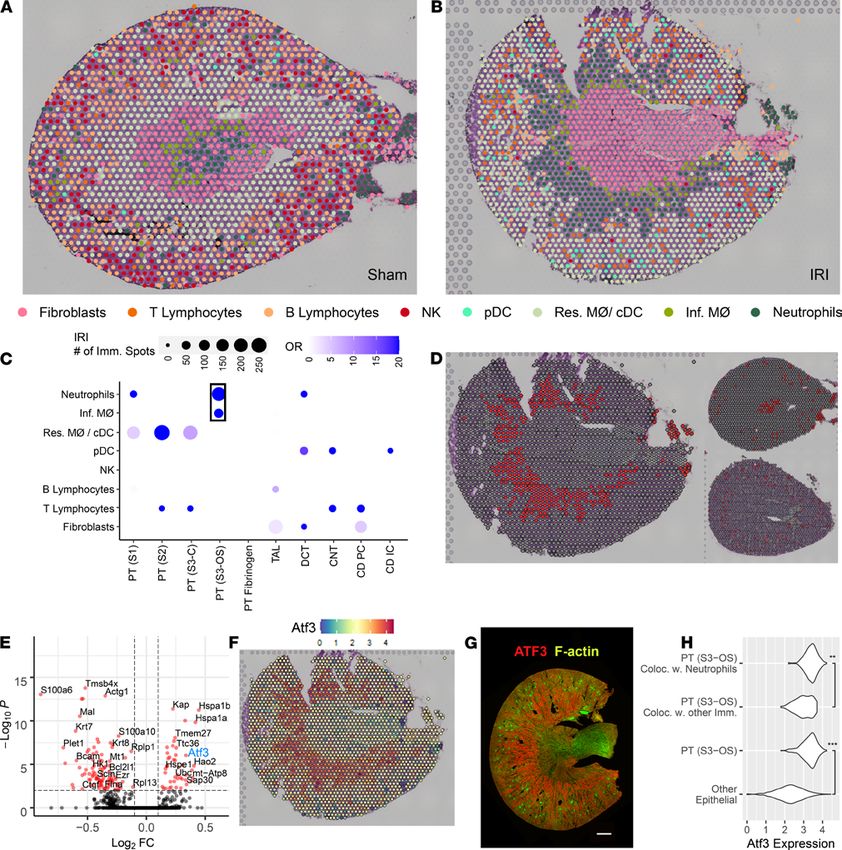
Figure 10. Multiplexed imaging of proteins in toto with CODEX validates the localization of immune cell clusters inferred by spatial transcriptomics. CODEX
imaging for kidney sections from sham, ischemia/reperfusion injury (IRI), and cecal ligation puncture (CLP) are shown in A, B, and C, respectively. In the left
column for all sections, spatial mapping of various immune cells (neutrophils, infiltrating and resident macrophages, B cells, CD4+ and CD8+ T cells, NK and IL
cells, and DCs) are displayed using colored overlays, and CD31 staining is included for context. The definition of each cell type based on the presence and absence
of markers is detailed in Supplemental Figure 8. The second column shows only CD31 and neutrophils (Neut, red), and the third column displays infiltrating mac-
rophages (Inf Mac, orange). (D–F) show the distribution of neutrophils and infiltrating macrophages in specific regions of the kidney for sham, IRI, and CLP. The
cortex, outer stripe of the medulla, inner medulla, and papilla regions were identified based on structural landmarks and annotated using region of interest (ROI)
tool in ImageJ. The corresponding spatial transcriptomic signature for neutrophils and infiltrating macrophages is shown on the right side for each specimen.
Discussion
In this work, we localized the transcriptomic signature of various immune cells to spatial transcriptomic
spots of known renal epithelial cells in 2 models of AKI. Signatures from immune and epithelial cells were
colocalized to identify possible chemotactic molecules of neutrophils and infiltrating macrophages in the
IRI and CLP models, respectively. The spatial transcriptomic analysis enhanced our understanding of the
single-cell data by detecting a subpopulation of injured PT cells with Atf3 expression, which may be respon-
sible for neutrophil chemotaxis. To accomplish this, we first optimized a workflow for the interrogation of
human and murine kidney tissue with spatial transcriptomics. The technology facilitated the identification
of key renal cell types and regions, including most epithelial, endothelial, and stromal cell types. The spec-
ificity of cell-type mapping was improved by concomitant snRNA-Seq or scRNA-Seq cluster analysis. The
technique appeared robust, revealing strong concordance (>97%) between the transcriptomic signature of
a given spot and its underlying histopathology. Supporting data were provided that AKI did not affect all
JCI Insight 2021;6(12):e147703 https://doi.org/10.1172/jci.insight.147703 15TECHNIC AL ADVANCE
regions of the kidney uniformly. The early effects of acute tubular necrosis in the IRI model led to regional
changes in the transcriptomic signature at the 6-hour time point.
Single-cell sequencing has rapidly enhanced our knowledge of the kidney’s expression signature and its cell
types (27), thereby helping to uncover the pathophysiology of a variety of conditions, including early diabetic
nephropathy (28), the composition of a Wilm’s tumor (29), and allograft rejection (5). Similar studies in the
mouse have facilitated query of murine disease state models (30) and the response to water deprivation (31).
In addition, scRNA-Seq and snRNA-Seq are foundational technologies for the generation of a kidney cell
atlas and detection of novel cell types in humans (2) and mice (4, 32, 33). scRNA-Seq has also aided in our
understanding of kidney organ development: studies performed in organoids have shown expression of disease
markers in early glomerular cells (34) and revealed that organoid expression patterns maintain strong agree-
ment with fetal kidney expression, including lineage differences and growth signatures (35, 36). Single-cell
analysis has also aided in understanding the development of fetal kidney (37–40) and myofibroblast origin (41).
In our study, we used the snRNA-Seq and scRNA-Seq data sets to effectively expand the breadth of cell
types mapped to kidney tissue by spatial transcriptomics. For example, the snRNA-Seq clustering in the
human kidney allowed us to differentiate interstitium spots into dominant signatures of endothelial cells,
fibroblasts, and VSMCs. In the mouse, we were able to detect multiple clusters not present in the unsuper-
vised spatial transcriptomic data set, particularly immune cells. Because there are often up to 10,000 single
nuclei or cells in a given sample, the scRNA-Seq and snRNA-Seq technologies have improved sample size
to detect less-represented cell types. Furthermore, the scRNA-Seq data is cell specific, rather than represen-
tative of a 55 μm spot with multiple underlying cells.
Multiple spatial transcriptomic platforms exist (42), including Slide-seq and the 10× Genomics Visium plat-
form (6). Spatial transcriptomics have been used to establish atlases in other organs, such as the mouse brain (6)
and human heart (43). In the context of disease, the spatial heterogeneity of prostate cancer (44) and melanoma
in lymph nodes (45) has been described, along with the progression of amyotrophic lateral sclerosis in mice (46).
The advantages of the 10× Genomics Visium platform used here include direct visualization of the underlying
histology along with a higher sensitivity for gene detection. Other in situ mRNA capturing technologies main-
tain a higher resolution but lower sensitivity for gene expression detection. These alternatives often require the
histology image from a sequential slice (47, 48) or capture smaller tissue areas (49). Other approaches to deter-
mining the spatial distribution of mRNA, such as in situ sequencing (50) or sequential in situ hybridization (51),
are expensive but important ways to visualize the transcriptomic signature with spatial resolution.
The main limitation of the 10× Genomics Visium spatial gene expression platform is its resolution with a
spot size of 55 μm, which will overlay multiple cells. For instance, Slide-seq has improved cellular resolution,
but has not been optimized for direct visualization on the same histopathology H&E-stained specimen (42). In
this work, we chose to examine the 10× Genomics Visium platform because it had the ability to create an atlas
of the kidney with direct mapping of expression onto the renal structures a pathologist would assess, thereby
being more readily translatable. We overcame the limitation in resolution by deconvoluting each spot with
neural network analyses and a transfer score system that ranks the contribution of each scRNA-Seq cluster cell
type to each transcriptomic spot signature. The limitations of this technology are further counterbalanced by
its deep signature (approximately 3,000 genes detected and 10,000 reads per spot with over 16,000 genes per
cluster) and the ability to directly visualize the signature over a histological image. Thus, this technique affords
more than simply identifying the proximity of localized scRNA-Seq cells; it can actually identify distinct molec-
ular signatures (as in the case of IRI) and correlate these with histology. We leveraged the advantages of the 10×
Genomics Visium platform to assess regional distribution of kidney injury expression changes in both murine
models. An additional limitation is that each capture area has about 5,000 spots; therefore, even if the sample
covers the capture area completely, the number of spots may not be enough to cluster and differentiate all cell
types. As stated above, we were able to effectively use scRNA-Seq to expand the breadth of cell types mapped.
In this work, we also employed techniques to deconvolute and colocalize transcriptomic signatures of mul-
tiple cell types within a single spot (52). A second approach was employed to detect immune cell localization
and uncover potential chemotactic signals. This second form of deconvolution has been used to classify second-
ary contributors to a spot’s expression signature, in a similar way to what has been done in the heart (53). The
immune cell population of the kidney has been extensively studied using scRNA-Seq in healthy subjects and in
the context of diabetic nephropathy and lupus nephritis (3, 54, 55). In our study, we united scRNA-Seq with
spatial transcriptomics to study the immune cell distribution in known murine models of AKI. Much is known
of the role of immune cells in these common models of AKI. It has been shown in IRI models that infiltration
JCI Insight 2021;6(12):e147703 https://doi.org/10.1172/jci.insight.147703 16TECHNIC AL ADVANCE
of neutrophils occurs in the outer stripe of the medulla (56, 57). Further, macrophage colocalization in the S1
segment of PTs has been found protective in sepsis models (58, 59). Thus, the localization of these immune cells
in the AKI models is not the novelty; instead, it is the capture of gene signatures underlying this colocalization.
We used 10× Genomics Visium to predict the spatial distribution of immune cell types in the kidney and identify
potential chemotactic factors associated with particular epithelial cells. The regional distribution of these cells
was validated with CODEX multiplexed immunofluorescence. By design, this work is descriptive. Future inves-
tigations are needed to understand the cause-and-effect relationship of these immune cell signals in the kidney.
Conclusions and future directions. In summary, we present the spatially mapped transcriptomic signature of
AKI in murine models and show how this methodology can be applied to human kidney tissue. In the future,
this technology may assist renal pathologists in their interpretation of kidney biopsy specimens. The ability to
link upregulation of a particular injury gene to a particular nephron structure is vitally important. This might
allow improved classification of human AKI. Future endeavors will seek to quantitatively define the contribu-
tion of each cell-type signature to each spot and to apply this methodology to diseased human kidney tissue.
Methods
Human tissue, data source, and snRNA sequencing. Publicly available snDrop-Seq RNA-Seq data were acquired
for 6 Kidney Precision Medicine Project (KPMP; https://www.kpmp.org/) samples and 9 additional sam-
ples from the Washington University Kidney Translational Research Center (Gene Expression Omnibus
[GEO], GSE121862). Sequencing data of nuclei for the samples were subjected to quality control metrics as
previously described (2). Using Seurat 3.1 and PAGODA2 (https://github.com/kharchenkolab/pagoda2/
commit/master; commit ID, e4bff4a), nuclei were reclustered and displayed as a UMAP. A single human
reference nephrectomy (female aged 59 without histological evidence of kidney disease) was acquired from
the Biopsy Biobank Cohort of Indiana (60).
Murine models. From age-matched 8- to 10-week-old 129/SvEv mice (Taconic Biosciences), tissues were
acquired from a sham mouse in which the abdomen was opened and sutured back and from mice that under-
went IRI or CLP. In the IRI model (61), both renal pedicles were exposed and clamped for 22 minutes or
30 minutes through a midline incision and then released. Spatial transcriptomics, histopathology, CODEX,
and immunofluorescence data were acquired from the 22-minute IRI model. scRNA-Seq data were acquired
from the 30-minute IRI model. In the CLP model (59), the cecum was ligated and punctured with a 25-gauge
needle. Kidneys were excised upon mouse euthanization 6 hours after each procedure and frozen in OCT
compound. The presence or absence of AKI was assessed on the H&E histology image and in a consecutive
periodic acid–Schiff-stained section. As expected, blood urea nitrogen and creatinine measurements were not
elevated in either the IRI and CLP models at the 6-hour time point.
Slide preparation and imaging. Slide preparation (CG000240_Demonstrated_Protocol_VisiumSpatialPro-
tocols_TissuePreparationGuide_Rev_A, 10× Genomics) and imaging were conducted according to Visium
spatial gene expression protocols (CG000241_VisiumImagingGuidelinesTN_Rev_A, 10× Genomics). Frozen
transverse 10 μm sections from the human nephrectomy or each murine model were placed within the etched
frames of the capture areas on the active surface of the Visium spatial slide. Tissue sections were fixed in metha-
nol and stained with H&E. Bright-field images of stained sections in the fiducial frames were collected as mosa-
ics of 10× fields using a Keyence BZ-X810 microscope equipped with a Nikon 10× CFI Plan Fluor objective.
mRNA extraction and sequencing. mRNA extraction, library preparation, and sequencing were conduct-
ed according to the Visium spatial protocols. Stained tissue sections were permeabilized for 12 minutes and
mRNA was released to bind oligonucleotides on the capture areas followed by reverse transcription, second
strand synthesis, denaturation, cDNA amplification, and SPRIselect cDNA cleanup (CG000239_Visium-
SpatialGeneExpression_UserGuide_RevD, 10× Genomics), and then the cDNA libraries were prepared and
sequenced on an Illumina NovaSeq 6000 with 28 bp + 120 bp paired-end sequencing mode.
Murine single-cell isolation, library preparation, and sequencing. Sham and IRI murine kidneys were transport-
ed on ice, minced, and dissociated using the Multi-Tissue Dissociation Kit 2 and a dissociator tube rotator
(GentleMACS, Miltenyi Biotec). Samples were prepared according to protocol with modifications: 10 mL of
RPMI 1640 (Corning) and 10% BSA (Sigma-Aldrich) were added to the mixture, then filtered, centrifuged
at 300g for 5 minutes, and the cell pellet was resuspended in 1 mL of lysis buffer (Sigma-Aldrich). Annexin
V dead cell removal was performed using magnetic bead separation after washing. The pellet was resus-
pended in RPMI 1640 and BSA 0.04%. A final concentration of 1 million cells/mL with over 80% viability
was achieved. In a single-cell master mix with lysis buffer and reverse transcription reagents, the sample was
JCI Insight 2021;6(12):e147703 https://doi.org/10.1172/jci.insight.147703 17You can also read