The Role of ATF3 in Neuronal Differentiation and Development of Neuronal Networks in Opossum Postnatal Cortical Cultures
←
→
Page content transcription
If your browser does not render page correctly, please read the page content below

International Journal of
               Molecular Sciences

Article
The Role of ATF3 in Neuronal Differentiation and Development
of Neuronal Networks in Opossum Postnatal Cortical Cultures
Antonela Petrović † , Jelena Ban               , Matea Ivaničić, Ivana Tomljanović and Miranda Mladinic *

                                          Laboratory for Molecular Neurobiology, Department of Biotechnology, University of Rijeka, 51000 Rijeka, Croatia;
                                          antonela.petrovic@biotech.uniri.hr (A.P.); jelena.ban@biotech.uniri.hr (J.B.); ivanicic.matea@gmail.com (M.I.);
                                          ivana.tomljanovic1@uniri.hr (I.T.)
                                          * Correspondence: mirandamp@uniri.hr
                                          † Current address: Department of Oncology, Children’s Research Center, University Children’s Hospital Zurich,
                                            8001 Zurich, Switzerland.

                                          Abstract: Activating transcription factor 3 (ATF3), a member of the ATF/cAMP response element-
                                          binding (CREB) family, is upregulated by various intracellular and extracellular signals such as
                                          injury and signals related to cell proliferation. ATF3 also belongs to the regeneration-associated
                                          genes (RAG) group of transcription factors. RAG and ATF/CREB transcription factors that play an
                                          important role in embryonic neuronal development and PNS regeneration may also be involved in
                                          postnatal neuronal differentiation and development, as well as in the regeneration of the injured CNS.
                                          Here we investigated the effect of ATF3 in differentiation, neural outgrowth, network formation, and
                                          regeneration after injury using postnatal dissociated cortical neurons derived from neonatal opossums
                                          (Monodelphis domestica). Our results show that RAG and ATF genes are differentially expressed in early
                                          differentiated neurons versus undifferentiated neurospheres and that many members of those families,
                                          ATF3 in particular, are upregulated in cortical cultures obtained from younger animals that have the
Citation: Petrović, A.; Ban, J.;         ability to fully functionally regenerate spinal cord after injury. In addition, we observed different
Ivaničić, M.; Tomljanović, I.;         intracellular localization of ATF3 that shifts from nuclear (in neuronal progenitors) to cytoplasmic
Mladinic, M. The Role of ATF3 in          (in more mature neurons) during neuronal differentiation. The ATF3 inhibition, pharmacological
Neuronal Differentiation and              or by specific antibody, reduced the neurite outgrowth and differentiation and caused increased
Development of Neuronal Networks
                                          cell death in early differentiating cortical neuronal cultures, suggesting the importance of ATF3 in
in Opossum Postnatal Cortical
                                          the CNS development of neonatal opossums. Finally, we investigated the regeneration capacity
Cultures. Int. J. Mol. Sci. 2022, 23,
                                          of primary cortical cultures after mechanical injury using the scratch assay. Remarkably, neonatal
4964. https://doi.org/10.3390/
ijms23094964
                                          opossum-derived cultures retain their capacity to regenerate for up to 1 month in vitro. Inhibition of
                                          ATF3 correlates with reduced neurite outgrowth and regeneration after injury. These results indicate
Academic Editor: Luca Bonfanti
                                          that ATF3, and possibly other members of RAG and ATF/CREB family of transcription factors, have
Received: 30 March 2022                   an important role both during cortical postnatal development and in response after injury.
Accepted: 26 April 2022
Published: 29 April 2022                  Keywords: opossums; neuronal differentiation; neuroregeneration; neurospheres

Publisher’s Note: MDPI stays neutral
with regard to jurisdictional claims in
published maps and institutional affil-
iations.
                                          1. Introduction
                                               The inability of the adult mammalian central nervous system (CNS) to regenerate
                                          after an injury is one of the major problems in the treatment of CNS injuries and neu-
                                          rodegenerative diseases. One possible strategy for successful CNS regeneration is to
Copyright: © 2022 by the authors.         recapitulate the events that normally occur during neuronal development since many
Licensee MDPI, Basel, Switzerland.        molecules involved in neuronal plasticity are thought to be crucial both for development
This article is an open access article    and regeneration [1,2]. For example, regeneration-associated genes (RAG) and activating
distributed under the terms and
                                          transcription factors (ATF)/cAMP response element-binding (CREB) transcription factors
conditions of the Creative Commons
                                          that play an important role in embryonic neuronal development and peripheral nervous
Attribution (CC BY) license (https://
                                          system (PNS) regeneration may be involved in postnatal development and regeneration of
creativecommons.org/licenses/by/
                                          injured adult CNS [2–5].
4.0/).

Int. J. Mol. Sci. 2022, 23, 4964. https://doi.org/10.3390/ijms23094964                                             https://www.mdpi.com/journal/ijms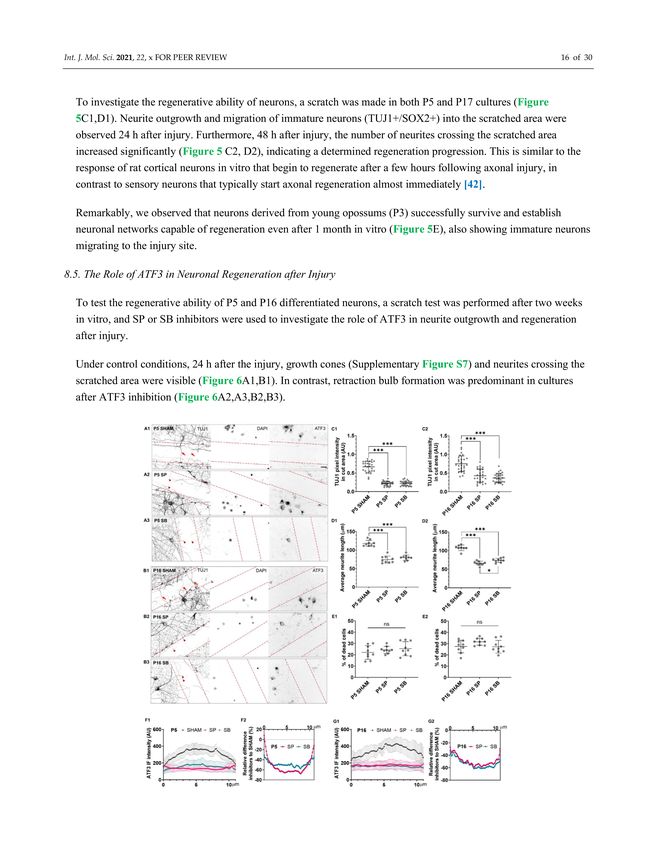
Int. J. Mol. Sci. 2022, 23, 4964                                                                                            2 of 22

                                         A common feature of ATF/CREB proteins is their role in cell adaptation and main-
                                   tenance of homeostasis [4,6–8]. For example, ATF3, a member of the ATF/CREB family,
                                   is an immediate early gene involved in the adaptive cellular response and is upregulated
                                   by various intracellular and extracellular signals such as injury and signals related to cell
                                   proliferation [6]. ATF3 is also a member of the RAG group of transcription factors [9]. The
                                   important role of RAG transcription factors in axonal neurite outgrowth and neuronal
                                   regeneration has been assessed and confirmed both in vitro and in vivo, in PNS and CNS
                                   neurons, either by pharmacological inhibition or genetic attenuation [5,10–13]. In addition
                                   to ATF3, in vivo axonal growth is also stimulated by other RAG transcription factors such
                                   as Smad1 [14], STAT3 [15,16], c-Jun [17], and ATF1/CREB [18].
                                         We have previously demonstrated the involvement of ATF3 in the control of ependy-
                                   mal stem cells activity in the rat neonatal spinal cord and shown that ATF3 can be considered
                                   a novel marker for spinal migratory or quiescent ependymal stem cells [19].
                                         Numerous in vitro models have been developed to study complex molecular mecha-
                                   nisms involved in CNS axon regeneration, demonstrating that many aspects of neuronal
                                   development are faithfully reproduced in vitro [20,21]. For example, comparative studies
                                   of the fetal brain and in vitro neurospheres have shown that in vitro neuronal progenitor
                                   cells act as their in vivo correspondents and that the proliferative capacity and potential for
                                   cell differentiation coincide with the cell fate and developmental stage of the tissue from
                                   which the cells are derived [22,23].
                                         Thus, we have recently established the primary neuronal and radial glial cell (RGC)
                                   cultures from neonatal opossums Monodelphis domestica, where RGC retain their neurogenic
                                   potential, confirming that neuronal differentiation occurs in vitro [24]. Opossums are
                                   born very immature, and postnatal day 0 (P0) neonates correspond to E12 rats, while P14
                                   opossums correspond to P0 mice or rats [25]. Opossums have a unique ability to fully
                                   regenerate the spinal cord after injury during the first two weeks of their postnatal life,
                                   after which that ability abruptly ceases. This unique regenerative ability makes opossums
                                   particularly suitable for studying key regulators of CNS regeneration [26,27]. Thus, primary
                                   cortical neurons from neonatal opossums offer a valuable in vitro model for studying the
                                   mechanisms underlying regeneration. To date, there are no data on the ability of the
                                   opossum to regenerate the brain after injury, and this research is the first attempt to
                                   establish an in vitro platform for opossum brain regeneration research.
                                         Here we compare the gene expression levels of ATF and RAG family members between
                                   opossum neuronal progenitor cells and differentiated neurons and investigate the role of
                                   ATF3 in neuronal survival and differentiation, as well as in neurite outgrowth, neuronal
                                   network formation, and CNS neuroregeneration.
                                         This is also the first report of long-term primary cortical cultures (>DIV14) from the
                                   postnatal mammalian CNS in which regenerative neurite outgrowth occurs after injury.
                                         Investigating changes in gene transcription in response to axonal transection in opos-
                                   sum cortical cells may provide new insights into molecular pathways essential for neuronal
                                   differentiation and regeneration.

                                   2. Materials and Methods
                                   Animals
                                        The colony of South American gray short-tailed opossum (Monodelphis domestica) is
                                   housed at the animal facility of the University of Trieste in accordance with the guidelines
                                   of the Italian Animal Welfare Act. Their use has been authorized by the Ethics Committee
                                   board, the Local Veterinary Service, and the National Ministry of Health (Permit Number:
                                   1FF80.N.9Q3) in accordance with European Union guidelines for animal care (d.1.116/92,
                                   86/609/C.E.). Animals are kept in standard laboratory cages with controlled temperature
                                   (27–28 ◦ C) and humidity (50–60%) with a 12/12 h light/dark cycle and ad libitum access
                                   to food and water. The experiments were carried out in accordance with the European
                                   Directive 2010/63/EU for animal experiments, and every effort was made to minimize the
                                   animal suffering and the number of animals used.
Int. J. Mol. Sci. 2022, 23, 4964                                                                                           3 of 22

                                   3. Primary Cortical Cultures
                                         Primary cortical cultures were prepared as described in the work of (24). Briefly,
                                   cells were isolated from the cortex of neonatal opossums of both sexes at postnatal days
                                   (P) 5–6 and 16–17. Dissection was performed in ice-cold oxygenated dissection solution
                                   (113 mM NaCl, 4.5 mM KCl, 1 mM MgCl2 × 6H2 O, 25 mM NaHCO3 , 1 mM NaH2 PO4 ,
                                   2 mM CaCl2 × 2H2 O, 11 mM glucose and 0.5% w/v penicillin/streptomycin/amphotericin
                                   B; all from Sigma-Aldrich, St. Louis, MO, USA), pH 7.4. The cortices were washed three
                                   times with sterile phosphate-buffered saline (PBS, 137 mM NaCl, 2.7 mM KCl, 10 mM
                                   Na2 HPO4 , 2 mM KH2 PO4 ; all from Sigma-Aldrich).
                                         Enzyme digestion was performed by incubation in trypsin (0.5% Trypsin-EDTA Solu-
                                   tion 10X, cat. no. sc-363354, Santa Cruz Biotechnology, SCBT, Dallas, TX, USA) at 32.5 ◦ C.
                                   P5–6 cortices were incubated in 0.5% trypsin in PBS for 10 min, while P16-17 cortices
                                   were incubated in 2.5% trypsin for 15 min. Cells were dissociated in a trituration solution
                                   containing 10 µg/mL DNAse I (Sigma-Aldrich), 1 mg/mL trypsin inhibitor (SCBT), and 1%
                                   bovine serum albumin (BSA, Pan-Biotech GmbH, Aidenbach, Germany) in HBSS solution,
                                   w/o Ca2+ and Mg2+ (Pan-Biotech). The supernatant containing the dissociated cells was
                                   collected and deposited on top of a 5% BSA cushion in HBSS in a 5 mL tube, centrifuged
                                   for 5 min at 100× g, and then resuspended in a plating medium consisting of Dulbecco’s
                                   Minimum Essential Medium (DMEM) with stable glutamine supplemented with 10% fetal
                                   bovine serum (FBS) and 1% penicillin/streptomycin (all from Pan-Biotech). Prior to plating,
                                   the cell suspension was preplated onto a plastic tissue culture Petri dish for 5 min.
                                         For RT q-PCR experiments, cells were plated in a T25 tissue culture flask in a plating
                                   medium at the density of 6 × 10⁵ cells. To grow the neurospheres in suspension, the cells
                                   were plated in a non-adherent T25 tissue culture flask in DMEM with stable glutamine
                                   supplemented with 10% FBS and 1% penicillin/streptomycin used for both plating and
                                   culturing. The next day, the cells were transferred to a new tissue culture flask to remove
                                   adherent cells. A quarter of the media was changed at DIV1 and DIV4. For neuronal culture,
                                   cells were plated in an adherent T25 tissue culture-treated flask coated with 50 µg/mL
                                   poly-L-ornithine. The next day, three-quarters of the plating media were removed, and
                                   a neuronal medium containing neurobasal medium supplemented with B27 (both from
                                   Thermo Fisher, Waltham, MA, USA), 1 mM L-glutamine and 1% penicillin/streptomycin
                                   (both from Pan-Biotech) was added. At DIV4, half of the medium was changed with fresh
                                   neuronal medium. Cells were maintained at 32 ◦ C, 5% CO2 , and 95% relative humidity.

                                   3.1. Neuroregeneration Scratch Assay
                                          For scratch assay and immunocytochemistry experiments, cells were plated on 12 mm
                                   diameter glass coverslips precoated with 50 µg/mL poly-L-ornithine and 2 µg/mL laminin
                                   (all from Sigma-Aldrich) at a density of 0.5 × 10⁵ cells per well in a 24-well plate. The next
                                   day, two-thirds of the medium was changed with neuronal medium. Half of the medium
                                   was replaced with fresh neuronal medium once a week. At DIV10, DIV14 or MIV1, a
                                   scratch was made in the middle of the coverslip severing the differentiated neurons with
                                   fine-tipped tweezers thick 0.1 mm, resulting in a scratch approximately 100 µm wide. The
                                   neurons were immediately imaged with a Zeiss inverted microscope. Cells were fixed and
                                   immunostained 24 or 48 h after scratching.

                                   3.2. Drug Protocols
                                        JNK/c-Jun inhibitor SP600125 and MAPK/p38 inhibitor SB203580 (both from SCBT,
                                   cat.no. sc-200635 and sc-3533, respectively) were introduced into neuronal culture with or
                                   without injury, at different DIV (as explained in the Section 8), at a final concentration of
                                   50 and 1 µM, respectively, in PBS and were incubated for 24 h.

                                   3.3. Quantitative RT-qPCR
                                        RNA from primary cortical neurons and neurospheres was isolated using a Monarch
                                   Total RNA Miniprep kit (New England Biolabs (NEB), Ipswich, MA, USA) according to
Int. J. Mol. Sci. 2022, 23, 4964                                                                                            4 of 22

                                   the manufacturer’s instructions. DNAse I (NEB) was added to the RNA isolation column
                                   to eliminate genomic DNA. RNA concentration and purity were analyzed on a Biodrop
                                   Duo spectrophotometer (Harvard Bioscience, Holliston, MA, USA), and the quality was
                                   then analyzed on a 2% agarose gel (Sigma-Aldrich). To assess the purity of the samples,
                                   the absorbance ratio values at 260 nm and 280 nm (A260/A280) and at 260 nm and 230 nm
                                   (A260/A230) were considered and taken as good (indicating the high purity of RNA) when
                                   the A260/A280 was about 2.2 and the A260/A230 ranged from 1.8 to 2.2.
                                          The QuantiTect RT kit (Qiagen, Hilden, Germany) was used to transcribe RNA into
                                   cDNA. A total of 1 µg of total RNA was transcribed into cDNA in a 20 µL reaction buffer.
                                   For a single RT-qPCR reaction, 5 µL of cDNA (diluted 10× in dH2 O) was used as a
                                   starting material.
                                          The RT-qPCR reaction was performed with Luna Universal qPCR Master Mix (NEB)
                                   based on SYBR Green I dye using LightCycler 480 (Roche Holding AG, Basel, Switzerland).
                                   The RT-qPCR program consisted of preincubation for 10 min at 95 ◦ C, 50 cycles of DNA
                                   amplification with the following steps: 10 s at 95 ◦ C, 10 s at 55 ◦ C, and 20 s at 72 ◦ C, and
                                   final melting and cooling. Glyceraldehyde-3-phosphate dehydrogenase (GAPDH) was
                                   used as a reference gene. The cycle threshold (Ct) of the GAPDH gene ranged from 14
                                   to 16 cycles. The cut-off value for Ct was 35. Non-template controls were performed for
                                   each primer pair used in the RT-qPCR reaction. The relative mRNA expression levels of all
                                   genes of interest (GOI) were normalized to the level of the reference gene (GAPDH) and
                                   calculated by the equation 2ˆ (Ct value for GAPDH—Ct value for GOI). All samples were
                                   made in technical duplicate and biological triplicate.
                                          The primers for genes of interest were designed using the Primer3Plus (https://
                                   primer3plus.com/, accessed on 1 April 2020) web interface [28], and transcripts for the
                                   opossum were downloaded from the Ensembl database (https://www.ensembl.org, ac-
                                   cessed on 1 April 2020). The sequence specificity of designed primers was confirmed
                                   using the NCBI Nucleotide BLAST tool (https://blast.ncbi.nlm.nih.gov/Blast.cgi, accessed
                                   on 1 April 2020). The synthesis service of selected primers was performed by Macrogen
                                   (Macrogen Europe, Amsterdam, Netherlands). The initial PCR amplification products were
                                   run on a 2% agarose gel to verify that the primer pairs multiplied a single product of the
                                   predicted size. The change in gene expression of interest is expressed as a “fold change”
                                   (2 (-∆∆Ct)). The mRNA level in the control sample was designated as 1. Scatter plots of
                                   relative mRNA expression normalized to the mRNA level of the GAPDH reference gene
                                   (∆Ct) with statistical tests performed and p-values are shown in Supplementary Figure S1.
                                          The primers used were: cJUN forward 50 -CAAGTGCCGGAAAAGGAAGC-30 , reverse
                                   5 -CGCTGTTCACGTGGTTCATG-30 ; STAT3 forward 50 -TGCAGCATTAAGAGGATCCCG-
                                     0

                                   30 , reverse 50 -GAAGCATCACAATTGGCCCG-30 ; SMAD1 forward 50 -TTCCAGATGCCAGC
                                   GGATAC-30 , reverse 50 -AACTGCCTGCACATCTCCTC-30 ; ATF1 forward 50 -TCAGAGACA
                                   GCACCACAACC-30 , reverse 50 -AATCCCCCGAGCTTTCTGTG-30 ; ATF2 forward 50 -ACAC
                                   CTACACCAACACGATTCT-30 , reverse 50 -TGATGGGTGTTGCAAGAGGG-30 ; ATF3 for-
                                   ward 50 -AGTTTGCCCCTGAAGAGGATG-30 , reverse 50 -CCAACTTTTCTGATTCCTTCTGC-
                                   30 ; ATF4 forward 50 -ACAGACTTTGGCAAGGAGGATG-30 , reverse 50 -ATCACAAGAGCCT
                                   TCCAACG-30 ; ATF6 forward 50 -ACCAGCATCAGGAATTCAGGG-30 , reverse 50 -AATAGCA
                                   GGTGATCCCGTCG-30 ; ATF7IP forward 50 -GAGTTGAGAACCAGACCAGCA-30 , reverse
                                   50 -ACACCTCCTGAATCACTGCC-30 ; GAPDH forward 50 -ATGCCCCAATGTTCGTGATG-
                                   30 , reverse 50 -GTCATGAGTCCTTCCACAATGC-30 .

                                   4. Immunofluorescence Staining
                                         Cells were fixed for 20 min at room temperature (RT, 20–22 ◦ C) with 4% paraformalde-
                                   hyde (PFA) pH 6.9 containing 200 mM sucrose (all from Sigma-Aldrich) in PBS. After
                                   fixation, cells were washed with PBS, saturated with 0.1 M glycine, permeabilized with
                                   0.1% Triton X-100 (all from Sigma-Aldrich) in PBS, and finally washed with PBS, each step
                                   for 5 min. Cells were then incubated with 0.5% BSA (Pan-Biotech) in PBS blocking solution
                                   for 30 min.
Int. J. Mol. Sci. 2022, 23, 4964                                                                                        5 of 22

                                          Incubation with primary antibodies was performed in a humid chamber for 2 h, fol-
                                   lowed by 2 washing steps (5 min each) in PBS. The primary antibodies were following:
                                   ATF3 (Abcam, ab216569, 1:50, Uniprot Align immunogen identity: 92.3%; antibody vali-
                                   dation shown in Supplementary Figure S2), SOX2 (Abcam, ab79351, RRID: AB_10710406,
                                   1:200, 91.7%), β-tubulin III (TUJ1; Biolegend, 801201, RRID: AB_2313773, 1:200, 99.8%).
                                   Additional information on primary antibodies can be found in Supplementary Table S1.
                                          Cells were incubated with secondary antibodies containing a 300 nM nuclear stain
                                   40 , 6-diamidino-2-phenylindole (DAPI, Thermo Fisher Scientific, Waltham, MA, USA) in
                                   PBS. The incubation time was 1 h in a dark, humid chamber. The secondary antibodies
                                   were following: goat anti-mouse Alexa Fluor® 488 (Thermo Fisher Scientific, A32723, RRID:
                                   AB_2633275, 1:400), goat anti-rabbit Alexa Fluor® 555 (Thermo Fisher Scientific, A32732,
                                   RRID: AB_2633281, 1:400), goat anti-rabbit Alexa Fluor® 647 (Abcam, ab150083, RRID:
                                   AB_2714032, 1:300), goat anti-mouse IgG1 Alexa Fluor® 488 (Thermo Fisher Scientific,
                                   A-21121, RRID: AB_2535764, 1:300) and goat anti-mouse IgG2a Alexa Fluor® 555 (Thermo
                                   Fisher Scientific, A-21137, RRID: AB_2535776, 1:300).
                                          Next, the coverslips were washed twice with PBS, once in dH2 O, mounted on a glass
                                   slide with a mounting medium (Vectashield, Vector Laboratories, Burlingame, CA, USA),
                                   and sealed with nail polish. All incubations were performed at RT.

                                   5. Imaging
                                        Samples were analyzed using an Olympus IX83 inverted fluorescent microscope
                                   (Olympus, Tokyo, Japan) equipped with differential interference contrast (DIC) and fluores-
                                   cence optics (mirror units: U-FUNA: EX360-370, DM410, EM420-460, U-FBW: EX460-495,
                                   DM505, EM510IF, and U-FGW: EX530-550, DM570, EM575IF, all from Olympus and Cy5:
                                   EX620/60, DM660, EM700/75, Chroma, Bellows Falls, VT, USA).
                                        Fluorescence images were acquired with Hamamatsu Orca R2 CCD camera (Hama-
                                   matsu Photonics, Hamamatsu, Japan) and CellSens software (Olympus, Japan), with slice
                                   spacing of 1.27 µm for 20× objective (0.5 NA) and 0.29 µm for 40× oil immersion objective
                                   (1.4 NA). For each image, an average intensity projection was used. CellSens and ImageJ
                                   (http://rsbweb.nih.gov/ij, accessed on 1 April 2020) (NIH, Bethesda, Maryland, USA)
                                   were used for image processing and analysis.
                                        ImageJ SNT plugin was used to measure the average neurite length. ImageJ was
                                   used to quantify immunofluorescence signals (gray level value expressed in arbitrary units,
                                   AU) by measuring the average TUJ1 pixel intensity in the 100 × 100 µm region of interest
                                   (ROI). The average background pixel value was measured for each image and subtracted.
                                   TUJ1 gray values are quantified in the scratch area and normalized with TUJ1 averaged
                                   gray values of intact neuronal networks. CellSens software was used for line scan analysis
                                   of the nuclear ATF3 immunofluorescent signal. To obtain a line plot, an analysis was
                                   performed on the average intensity projection of the Z-stack. Neuronal culture samples
                                   were immunoprocessed in parallel under identical conditions and imaged using the same
                                   exposure settings.
                                        Cell survival was assessed by comparing the number of DAPI-positive intact and
                                   pyknotic nuclei between control conditions (SHAM) and MAPK inhibitors or antibody-
                                   treated cultures.

                                   6. Electrophoresis and Immunoblotting
                                        To detach the neurons from the substrate, cells were washed with PBS and incubated
                                   with 0.5% trypsin for 5 min at 32 ◦ C. DMEM supplemented with 10% FBS was added to
                                   inactivate trypsin. The cells were collected in pre-cooled 15 mL tubes and centrifuged at
                                   300× g for 5 min at 4 ◦ C. The supernatant was removed, and the pellet was briefly washed
                                   with ice-cold PBS.
                                        Cytoplasmic and nuclear fractions were isolated according to the Nuclear Extract Kit
                                   Assay Protocol (Abcam, Cambridge, UK). First, 250 µL of ice-cold complete hypotonic
                                   buffer (1×) was added, and the cells were incubated on ice for 15 min. Then 50 µL of
Int. J. Mol. Sci. 2022, 23, 4964                                                                                         6 of 22

                                   10% NP-40 assay reagent was added to each sample and mixed gently by pipetting. The
                                   samples were centrifuged at 14,000× g for 30 s at +4 ◦ C in a tabletop microcentrifuge. The
                                   supernatant with the cytosolic fraction was transferred to a new 1.5 mL tube. The pellet was
                                   resuspended in 50 µL ice-cold complete nuclear extraction buffer, and tubes were vortexed
                                   vigorously for 30 s and then gently rocked at +4 ◦ C for 15 min and repeated once more. The
                                   samples were centrifuged at 14,000× g for 10 min at 4 ◦ C, and the supernatant with the
                                   nuclear fraction was set aside.
                                        Protein lysates were mixed with 4× Laemmli buffer (50 mM Tris pH 6.8, 10% glycerol,
                                   2% SDS, DTT, and 0.04% bromophenol blue, all from Sigma-Aldrich) to a final volume of
                                   25 µL and denatured on a thermoblock for 5 min at 95 ◦ C.
                                        Electrophoresis was performed at 90 V for a 4% stacking gel, followed by 150 V
                                   for a 12% sodium dodecyl sulfate (SDS) polyacrylamide separation gel. Proteins were
                                   transferred to a nitrocellulose membrane (GE Healthcare, Chicago, IL, USA) for 1 h at
                                   100 V. Membranes were blocked in a 5% solution of bovine serum albumin (BSA, Pan-
                                   Biotech GmbH, Aidenbach, Germany) in TBS-T (0.1% Tween 20 in Tris-buffered saline,
                                   pH 7.4, all from Sigma-Aldrich), one hour on a shaker at RT. After blocking, the membranes
                                   were incubated with the primary ATF-3 antibody solution in 3% BSA in TBS-T (SCBT,
                                   sc-188, RRID: AB_2258513, 1:100; antibody validation shown in Supplementary Figure S2)
                                   overnight on a shaker at +4 ◦ C.
                                        The next day, the membranes were washed 3× for 5 min in TBS-T and then incubated
                                   in the secondary antibody solution for 1 h at RT on a shaker. The secondary antibodies were
                                   horseradish peroxidase (HRP)-linked goat anti-rabbit (7074, RRID:AB_2099233, 1:2000) and
                                   goat anti-mouse (7076, RRID: AB_330924, 1:2000; both from Cell Signaling Technology, CST,
                                   Danvers, MA, USA) and were diluted in 1% BSA in TBS-T. After incubation, the membranes
                                   were washed 3× for 5 min in TBS-T. After washing, the chemiluminescent reagent Liteablot
                                   Turbo (Euroclone Diagnostica, Milan, Italy) was applied to the membrane and incubated
                                   for 1 min at RT. Results were acquired using the ChemiDoc MP Imaging System (Bio-Rad,
                                   Hercules, CA, USA).
                                        GAPDH (Proteintech, HRP-60004, AB_2737588, Rosemont, IL, USA) was used as
                                   the loading control for the protein levels in the cytoplasmic fractions, and Histone H4
                                   (CST, 2935, RRID: AB_1147658) was used as the loading control for the protein levels in the
                                   nuclear fractions. Both loading controls were prepared in 3% milk powder in TBS-T at a
                                   dilution of 1:5000.

                                   7. Data Analysis
                                        Statistical analysis was performed using GraphPad Prism 8.4 (GraphPad Software Inc.,
                                   San Diego, CA, USA). D’Agostino–Pearson or Shapiro–Wilk normality test was used to
                                   calculate how far the values differ from the values expected with a Gaussian distribution.
                                   The normality test was chosen depending on the number of values tested. The Brown-
                                   Forsythe test was used to test the assumption that all data are sampled from populations
                                   with the same standard deviations.
                                        Three or more data groups were compared using one-way ANOVA, based on the
                                   assumption that the populations are Gaussian and that the variances are equal. Following
                                   the one-way ANOVA parametric test, the post-hoc Holm-Šídák test was used for multiple
                                   comparisons between the two data groups. Data groups with different variances that failed
                                   a normality test were compared using the Kruskal–Wallis test. Following Kruskal–Wallis
                                   nonparametric test, post-hoc Dunn’s multiple comparisons test was used. Data groups
                                   with equal variances assumed to be sampled from a Gaussian distribution were compared
                                   using the Welch ANOVA and post-hoc Dunnett’s T3 multiple comparisons test (for n < 50).
                                   The p-value was adjusted for multiple comparisons.
                                        An unpaired t-test was used when comparing two normally distributed data groups.
                                   The t-test assumes that the two samples come from populations that have identical standard
                                   deviations was tested using the F test. In case of unequal variances, Welch’s t-test was
                                   used. The accepted level of significance was p < 0.05. p < 0.001 Very significant ***, 0.001
Int. J. Mol. Sci. 2022, 23, 4964                                                                                                        7 of 22

                                   to 0.01 Very significant **, 0.01 to 0.05 Significant *, ≥0.05 Not significant. The decimal
                                   format used to report p-values was according to the recommended NEJM (New England
                                   Journal of Medicine) style (https://www.graphpad.com/guides/prism/latest/statistics/
                                   stat_decimal_formatting_of_p_values.htm, accessed on 20 January 2021; https://www.
                                   graphpad.com/guides/prism/latest/statistics/extremely_significant_results.htm, accessed
                                   on 20 January 2021).

                                   8. Results
                                   8.1. The Significant Difference in RAG and ATF Gene Expression in Opossum’s Cortical
                                   Differentiated Neurons versus Neurospheres
                                         We investigated the expression of RAG and ATF/CREB genes by RT-qPCR in pri-
                                   mary cortical cultures obtained from P5-6 and P16-17 opossums because these particu-
                                   lar age groups differ substantially in their neuroregenerative capacity after spinal cord
                                   injury [26,29–32]. Primary cultures were prepared using different culture conditions to
                                   obtain differentiated neurons or undifferentiated neurospheres (see Materials and Methods
                                   and [24]). Neurospheres mainly consist of Paired Box Gene 2 (PAX2; [33]) and SRY-Box Tran-
                                   scription Factor 2 (SOX2; [34])-positive neuronal progenitors (Supplementary Figure S3A,B; [24]).
                                         As shown in Figure 1, after 1 week in culture, significantly different RAG and ATF
                                   gene expressions were detected when comparing neurospheres and neurons, regardless
                                   of whether the cultures were prepared from younger (P5-6) or older animals (P16-17). We
                                   observed significantly higher expression of RAGs: c-Jun, STAT3, and SMAD1 (Figure 1A–C),
                                   and ATFs: ATF1, ATF2, ATF3, ATF4, and ATF6 (Figure 1D–H) in neurospheres compared
                                   to neurons. The highest difference was observed for ATF3 (Figure 1F), with a more than
                                   eight-fold higher expression in neurospheres compared to differentiated neurons.

                                   Figure 1. Difference in RAG and ATF gene expression in neurons versus neurospheres. Difference
                                   in gene expression between P6 and P17 neurons (NEU) and neurospheres (NSF) was measured by
                                   RT-qPCR, normalized to GAPDH mRNA levels, and shown as fold difference compared to P5–6
                                   neurons mRNA levels. mRNA was obtained from cortical neurons, and neurospheres at DIV7
                                   derived from opossums P5-6 and P16-17 from at least three independent experiments. Regeneration-
                                   associated genes (A–C), activating transcription factors (D–I). The accepted level of significance was
                                   p < 0.05. p < 0.001 very significant ***, 0.001–0.01 very significant **, 0.01–0.05 significant *, ≥0.05 not
                                   significant (ns). For statistical significance and tests performed, see Supplementary Figure S1.
Int. J. Mol. Sci. 2022, 23, 4964 8 of 22
Interestingly, we observed significantly higher levels of SMAD1, ATF1, ATF2, and
ATF3 expression (Figure 1C–F) in P6 neurons compared to P17 neurons. Similarly, P6
neurospheres had higher levels of c-Jun, STAT3, ATF2, ATF3, and ATF6 (Figure 1A,B,E,F,H)
compared to P17 neurospheres. Finally, no significant difference in ATF7 mRNA levels was
found in any comparison (Figure 1I).
8.2. ATF3 Cytoplasmic Translocation Occurs during Neuronal Differentiation
We investigated cellular localization of the ATF3 in opossum cortical undifferentiated
neurospheres (Figure 2A) and in neurospheres induced to differentiate for 4 days. Figure 2B
shows the transition from neuronal progenitors (Figure 2A) to a differentiated neuronal phe-
Int. J. Mol. Sci. 2021, 22, x FOR PEER REVIEW 9 of 23
notype, as indicated by the β-tubulin III-positivity [35,36] and extensive neurite outgrowth.
Figure 2. Cellular
Figure 2.localization of ATF3
Cellular localization in undifferentiated
of ATF3 in undifferentiated and differentiated
and differentiated neuro-
neurospheres. (A,B)
Immunostaining of
spheres. (A,B) Immunostaining primary cortical
of primary cortical neurospheres
neurospheresobtained
obtainedfrom fromP5‐6 P5-6opossum
opossum cortex: (A)
undifferentiated neurospheres were cultured in proliferating medium (DMEM/10% FBS) on poly‐
cortex: (A) undifferentiated neurospheres were cultured in proliferating medium (DMEM/10% FBS)
L‐ornithine and fixed at DIV2. (B) To induce differentiation, neurospheres cultured in proliferating
on poly-L-ornithine and fixed at DIV2. (B) To induce differentiation, neurospheres cultured in pro-
medium in suspension at DIV3 were transferred on a laminin‐coated coverslip, and the medium
liferating medium wasinswitched
suspension at DIV3
to neuronal were transferred
medium for the next 4on a laminin-coated
days. Cells were fixedcoverslip,
at DIV7, and and the
immunostained
medium was switched
for ATF3 to neuronal mediumcytoskeletal
(green), neuronal for the next 4 days.
marker Cells were
β‐tubulin fixed at
III (TUJ1, DIV7,
red), andand
cellim-
nuclei were
munostained for counterstained with DAPIcytoskeletal
ATF3 (green), neuronal (blue). (C,D)marker
Line scan analysisIII
β-tubulin of (TUJ1,
primaryred),
neuronal progenitors
and cell nuclei (C) and
neurons (D). Yellow arrows indicate examples of line scan analysis performed on a Z‐stack average
were counterstained with DAPI (blue). (C,D) Line scan analysis of primary neuronal progenitors
intensity projection to obtain the plots in which ATF3 (green) and DAPI (blue) are shown in the
(C) and neurons cytoplasm
(D). Yellow andarrows
nucleusindicate
(nuclearexamples
region isofindicated
line scanbyanalysis performed
the vertical on aplot
lines). Line Z-stack
is the average
average intensityline
projection
intensitytoofobtain the plotsselected
five randomly in which ATF3
cells. Data(green) and DAPI
are shown as mean (blue)
± SD.are shown
Scale bar isin20 μm. (E)
the cytoplasm and Western
nucleus blot analysis
(nuclear of ATF3
region levels in the
is indicated by thenucleus (N) lines).
vertical and cytoplasm
Line plot(C). Theaverage
is the loading controls
line intensity of were GAPDH forselected
five randomly the cytoplasmic
cells. Datafractions and Histone
are shown H4 for
as mean ± the
SD.nuclear fractions.
Scale bar is 20 µm.
(E) Western blot analysis of ATF3 levels in the nucleus (N) and cytoplasm (C). The loading controls
A strong ATF3 fluorescence signal was detected in both primary cultures; however,
were GAPDH for the cytoplasmic fractions and Histone H4 for the nuclear fractions.
the staining pattern was different: in neuronal progenitors, staining was nuclear (Figure
2A), while
A strong ATF3 in differentiated
fluorescence signal was neurons,
detectedstaining
in both was predominantly
primary cultures;cytoplasmic,
however, the with a low
signal in the nucleus (Figure 2B), which was confirmed by the line scan analysis of ATF3
staining pattern was different: in neuronal progenitors, staining was nuclear (Figure 2A),
fluorescence intensity (Figure 2C,D). Substantially higher ATF3 expression in neuronal
while in differentiated neurons, staining was predominantly cytoplasmic, with a low
progenitors is consistent with the ATF3 levels measured by RT‐qPCR (Figure 1F).
signal in the nucleus (Figure 2B), which was confirmed by the line scan analysis of ATF3
We also performed Western blot analysis using nuclear and cytoplasmic fractions
fluorescence intensity (Figure 2C,D). Substantially higher ATF3 expression in neuronal
from neurospheres and neurons (Figure 2E). We detected a 20 kDa ATF3 isoform
progenitors is consistent
abundant in with
the the ATF3
nuclear levels of
fraction measured by RT-qPCR
neurospheres, which was (Figure 1F). in the neuronal
not present
We also performed Western
nuclear fraction. blot analysis using nuclear and cytoplasmic fractions from
neurospheres and neurons (Figure 2E). We detected a 20 kDa ATF3 isoform abundant in the
nuclear fraction8.3.
of Role
neurospheres, which Outgrowth
of ATF3 in Neurite was not present
and Cellin the neuronal nuclear fraction.
Survival
Previous studies demonstrated that the JNK [37–39] and the p38 [40] signaling
pathways are involved in the induction of ATF3 transcription.
Therefore, to investigate whether ATF3 regulates neurite outgrowth, neuronal
network formation, or cell survival, we pharmacologically inhibited ATF3 in P5 and P17
primary cortical neuronal cultures with MAPK inhibitors: JNK/c‐Jun inhibitor SP600125
(SP) or p38‐MAPK inhibitor SB203580 (SB).
Inhibitors were added either at DIV1 (Figure 3) when cultures were mainly
composed of immature neurons, positive for TUJ1, SOX2, and brain lipid‐binding proteinInt. J. Mol. Sci. 2022, 23, 4964 9 of 22
8.3. Role of ATF3 in Neurite Outgrowth and Cell Survival
Previous studies demonstrated that the JNK [37–39] and the p38 [40] signaling path-
ways are involved in the induction of ATF3 transcription.
Therefore, to investigate whether ATF3 regulates neurite outgrowth, neuronal network
formation, or cell survival, we pharmacologically inhibited ATF3 in P5 and P17 primary
cortical neuronal cultures with MAPK inhibitors: JNK/c-Jun inhibitor SP600125 (SP) or
p38-MAPK inhibitor SB203580 (SB).
Inhibitors were added either at DIV1 (Figure 3) when cultures were mainly composed
of immature neurons, positive for TUJ1, SOX2, and brain lipid-binding protein (BLBP;
Supplementary Figure S4; [41]), or at DIV4 where neuronal networks were prominent (Figure 4).
Figure 3. Reticence of neuronal differentiation by ATF3 inhibition. Primary neuronal cultures derived
from the P5 (A1–A3) and P17 (B1–B3) cortex of M. domestica were treated at DIV1 with the MAPK
inhibitors, JNK/c-Jun inhibitor SP600125 (SP), or the p38 inhibitor SB203580 (SB) for 24 h. The cells
were fixed and stained at DIV7. Neurons were stained for TUJ1 (left panel), and their nuclei were
counterstained with DAPI (right panel). For better visualization of neurites, images are shown in
the grayscale. Scale bar is 20 µm. (C1) The scatter plot shows the average neurite length for P5
cortical neurons for the experimental conditions shown from (A1–A3). Data are shown as a scatter
plot with mean ± SD. The total number of neurites analyzed P5 SHAM 369; SP 272; SB 346. One-way
ANOVA followed by Holm-Šídák multiple comparisons test. P5 SHAM vs. P5 SP p < 0.001 ***;
P5 SHAM vs. P5 SB p < 0.001 ***. (C2) The scatter plot shows the average neurite length for P17
cortical neurons for the experimental conditions shown from B1-B3. Data are shown as a scatter plot
with mean ± SD. The total number of neurites analyzed P17 SHAM 385; SP 181; SB 394. One-way
ANOVA followed by Holm-Šídák multiple comparisons test. P17 SHAM vs. P17 SP p < 0.001 ***;
P17 SHAM vs. P17 SB p < 0.001 ***. (D1) The scatter plot shows the percentage of dead cells with
mean ± SD for the experimental conditions shown from (A1–A3): The total number of cells analyzed,
respectively: 897, 468, 497. One-way ANOVA followed by Holm-Šídák multiple comparisons test.
P5 SHAM vs. P5 SP p < 0.001 ***; P5 SHAM vs. P5 SB p < 0.001 ***. (D2) The scatter plot shows the
percentage of dead cells with mean ± SD for the experimental conditions shown from (B1–B3): The
total number of cells analyzed, respectively: 437, 164, 185. One-way ANOVA followed by Holm-Šídák
multiple comparisons test. P17 SHAM vs. P17 SP p < 0.001 ***; P17 SHAM vs. P17 SB p < 0.001 ***.
For each condition, images of at least three random fields per sample from 3 culture preparations
were analyzed.Int. J. Mol. Sci. 2022, 23, 4964 10 of 22
Figure 4. The effect of ATF3 inhibitors on intact neuronal networks. The primary neuronal cultures
derived from the P5 (A1–A3) and P17 (B1–B3) cortex of M. domestica were treated at DIV4 with
the MAPK inhibitors, JNK/c-Jun inhibitor SP600125 (SP), or the p38 inhibitor SB203580 (SB) for
24 h. The cells were fixed and stained at DIV5. Neurons were stained for β-tubulin III (TUJ1, left
panel) and ATF3 (right panel). Red arrowheads indicate ATF3 cytoplasmic aggregates. Nuclei were
counterstained with DAPI (middle panel). For a clearer visualization, the images are shown in
the grayscale. Scale bar is 50 µm. (C1) The scatter plot shows the average neurite length of P5
cortical neurons for the experimental conditions shown from (A1–A3). Data are shown as mean ± SD.
The total number of neurites analyzed P5 SHAM 184; SP 154; SB 216. One-way ANOVA followed
by Holm-Šídák multiple comparisons test. P5 SHAM vs. P5 SP p = 0.13 ns; P5 SHAM vs. P5 SB
p = 0.29 ns. (C2) The scatter plot shows the average neurite length of P17 cortical neurons for the
experimental conditions shown from (B1–B3). Data are shown as mean ± SD. The total number
of neurites analyzed P17 SHAM 215; SP 223; SB 209. One-way ANOVA followed by Holm-Šídák
multiple comparisons test. P17 SHAM vs. P17 SP p = 0.82 ns; P17 SHAM vs. P17 SB p = 0.82 ns.
(D1) The scatter plot shows the percentage of dead cells with mean ± SD. The total number of
cells analyzed: P5 SHAM 675; SP 533; SB 543. One-way ANOVA followed by Holm-Šídák multiple
comparisons test. P5 SHAM vs. P5 SP p = 0.77 ns; P5 SHAM vs. P5 SB p = 0.91 ns. (D2) The scatter
plot shows the percentage of dead cells with mean ± SD. Number of cells analyzed: P17 SHAM 960;
SP 738; SB 840. One-way ANOVA followed by Holm-Šídák multiple comparisons test. P17 SHAM
vs. P17 SP p = 0.36 ns; P17 SHAM vs. P17 SB p = 0.36 ns. For each condition, images of at least three
random fields per sample from 3 culture preparations were analyzed. (E1) Line scan analysis of P5
primary neurons for conditions shown from (A1–A3) and (E2) P17 primary neurons for conditions
shown from (B1–B3). Data are shown as an average ± SD. The graph represents the average ATF3
immunofluorescence intensity measured in 10–16 randomly selected neurons for each condition
(nucleus is within the vertical lines on the plot).Int. J. Mol. Sci. 2022, 23, 4964 11 of 22
In both P5 and P17 neuronal cultures, SP (Figure 3A2,B2) and SB inhibitor (Figure 3A3,B3),
applied at DIV1, prevented the neurite outgrowth and elongation and neuronal network
formation. As a result, significantly shorter neurites were present in both P5 (Figure 3C1)
and P17 neuronal cultures (Figure 3C2). The average neurite length of 100 µm in control
conditions was shortened to only 35 µm after administration of SP inhibitor or to only
about 40 µm after administration of SB inhibitor.
Moreover, both inhibitors adversely affected cell viability. The SP inhibitor caused a
25% increase in cell death in P5 (Figure 3D1) and a 30% increase in P17 cultures (Figure 3D2),
while the SB inhibitor caused a 23.5% increase in cell death in P5 (Figure 3D1) and 17.5% in
P17 cultures (Figure 3D2), compared to control conditions.
When applied at DIV4, thus when cultures consist of differentiated neurons forming
dense networks, neither of the two inhibitors affected the length of neurites in P5 or P17
cultures (Figure 4C1,C2), nor there was a significant increase in cell death (Figure 4D1,D2).
However, the perinuclear aggregation of ATF3 was observed in the cytoplasm of neurons
after administration of inhibitors, and the fluorescence intensity of ATF3 in neuronal nuclei
decreased by more than 50% after administration of SP or SB inhibitors (Figure 4E1,E2 and
Supplementary Figure S5A1–A6).
8.4. Development of the Neuroregeneration Scratch Test to Measure Neurite Outgrowth after
Mechanical Injury in Neonatal Opossum Cortical Cultures
Previous studies demonstrated different abilities of the P5 and P17 opossum’s spinal
cords maintained in vitro to regenerate after injury [26,30]. Here, we tested the regenerative
capacity of P5 and P17 opossum primary cortical neurons using a scratch test [21] that
allows relatively easy and rapid measurement of neurite outgrowth after mechanical injury.
To confirm the complete removal of cell bodies and neurites from the scratched area, we
imaged live cells immediately after scratch (Figure 5A) and immunostained them for
TUJ1 (Figure 5B).
Figure 5. Cortical neuronal regeneration after injury in vitro. (A,B) Representative images of primary
neuronal cultures immediately after a scratch. DIV9 live neurons from the P5 opossum cortex were
imaged with phase contrast (A) and DIV9 neurons from the P17 opossum cortex fixed and stained forInt. J. Mol. Sci. 2022, 23, 4964 12 of 22
TUJ1 (red) and DAPI nuclear stain (blue) (B). (C1,C2) P5 and (D1,D2) P17 primary cortical neuronal
cultures of M. domestica were cultured in neuronal medium, and the scratch was made at DIV10.
Cells were fixed 24 h after cut (C1,D1) and 48 h after scratch (C2,D2) and immunostained for TUJ1
(red), SOX2 (green), and nuclei were counterstained with DAPI (blue). Notice new neurites crossing
the scratched area. The scratch area is defined by the yellow dashed lines. Green circles indicate
TUJ1+/SOX2+ immature neurons that have migrated to the scratch area. (E1–E3) P3 opossum cortical
primary neuronal culture cultured for 1 month in vitro (MIV1). Scratch was made on MIV1, and cells
were fixed 24 h later and immunostained for TUJ1 (red), SOX2 (green), and DAPI nuclear stain (blue).
Note a substantial number of regenerating neurites crossing the scratch area. Green circles indicate
TUJ1+/SOX2+ immature neurons that have migrated to the scratch area. Scale bar is 50 µm.
To investigate the regenerative ability of neurons, a scratch was made in both P5 and
P17 cultures (Figure 5C1,D1). Neurite outgrowth and migration of immature neurons
(TUJ1+/SOX2+) into the scratched area were observed 24 h after injury. Furthermore,
48 h after injury, the number of neurites crossing the scratched area increased significantly
(Figure 5C2,D2), indicating a determined regeneration progression. This is similar to the
response of rat cortical neurons in vitro that begin to regenerate after a few hours following
axonal injury, in contrast to sensory neurons that typically start axonal regeneration almost
immediately [42].
Remarkably, we observed that neurons derived from young opossums (P3) success-
fully survive and establish neuronal networks capable of regeneration even after 1 month
in vitro (Figure 5E), also showing immature neurons migrating to the injury site.
8.5. The Role of ATF3 in Neuronal Regeneration after Injury
To test the regenerative ability of P5 and P16 differentiated neurons, a scratch test was
performed after two weeks in vitro, and SP or SB inhibitors were used to investigate the
role of ATF3 in neurite outgrowth and regeneration after injury.
Under control conditions, 24 h after the injury, growth cones (Supplementary Figure S7)
and neurites crossing the scratched area were visible (Figure 6A1,B1). In contrast, retraction
bulb formation was predominant in cultures after ATF3 inhibition (Figure 6A2,A3,B2,B3).
Figure 6. Reduction in neurite outgrowth by ATF3 inhibitors. Regrowth of TUJ1-positive neurites
after scratch, with or without the presence of MAPK inhibitors SP600125 (SP, 50 µM) and SB203580Int. J. Mol. Sci. 2022, 23, 4964 13 of 22
(SB, 1 µM). (A1–A3) P5 and (B1–B3) P16 primary cortical neuronal cultures of M. domestica were
cultured for 2 weeks, and the scratch was made at DIV14. Inhibitors were added immediately over
the next 24 h, and cells were fixed at DIV15 and immunostained for TUJ1 (left panels) and ATF3
(right panels). Nuclei were counterstained with DAPI (middle panels). The scratch area is defined
by red dashed lines. On the left panels, red arrows indicate neurites crossing the area of the scratch,
and red arrowheads indicate the bulb formation after the scratch. For a clearer visualization, the
images are shown in grayscale. Scale bar is 20 µm, 40× magnification. (C1) The scatter plot shows P5
average TUJ1 pixel intensity for the experimental conditions shown from (A1–A3). Data are shown
as mean ± SD. For each condition, 3 ROIs of 3 random fields per sample from 3 culture preparations
were analyzed. Brown-Forsythe ANOVA followed by Dunnett’s T3 multiple comparisons test. P5
SHAM vs. P5 SP p < 0.001 ***; P5 SHAM vs. P5 SB p < 0.001 ***. (C2) The scatter plot shows P16
average TUJ1 pixel intensity for the experimental conditions shown from B1-B3. Data are shown as
mean ± SD. For each condition, 3 ROIs of 3 random fields per sample from 3 culture preparations
were analyzed. Brown-Forsythe ANOVA followed by Dunnett’s T3 multiple comparisons test. P16
SHAM vs. P16 SP p 115 µm, while
inhibitor-treated neurons had significantly shorter neurites, 75 µm and 79 µm, respectively
(Figure 6D1).
In the P16 neuronal cultures, the TUJ1 pixel density in the scratched area decreased
almost two-fold, from 0.75 to 0.4 AU, similarly after SP or SB application (Figure 6C2).
Additionally, in P16 control cultures, the average neurite length was >105 µm, compared to
SP- or SB-treated cultures, where the length significantly decreased to 66 µm and 74 µm,
respectively (Figure 6D2). Thus, the inhibitors had a similar effect on injured neurons
derived from P5 or P16 opossums, with a similar decrease in neurite density and length
(Figure 6C1,C2,D1,D2). No significant increase in cell death was observed in P5 or P16
cultures following SP or SB inhibitor application after injury. The average cell death was
25–30% (Figure 6E1,E2). The fluorescence intensity of ATF3 in neuronal nuclei decreased by
more than 50% (Figure 6F1–G2; Supplementary Figure S5B1–B6) after the administration
of inhibitors.Int. J. Mol. Sci. 2022, 23, 4964 14 of 22
Next, we tested the effect of the prolonged ATF3 inhibition on neurite outgrowth and
regeneration of opossum cortical neurons in vitro. Therefore, when the SP inhibitor was
administered 24 h before the cut (Figure 7A2,B2), the TUJ1 pixel density decreased almost
two-fold: in P5 cultures from 0.68 to 0.31 AU (Figure 7C) and in P16 cultures from 0.63 to
0.35 AU (Figure 7D), compared to control conditions.
Figure 7. Prolonged effect of ATF3 inhibition on neurite outgrowth. (A1–A4) Cortical neurons
derived from P5 opossum. (A1,A3) represent control neuronal cultures treated with PBS only. At
DIV10, neurons were first treated with SP inhibitor for 24 h, followed by scratch and washout for the
next 24 h (A2), or incubated with SP immediately after scratch over the next 24 h and followed by
24 h washout (A4). (B1–B4) Cortical neurons derived from P16 opossum. (B1,B3) represent control
neuronal cultures treated with PBS only. At DIV10, neurons were first treated with SP inhibitor for
24 h, followed by scratch and washout for the next 24 h (B2), or incubated with SP immediately after
scratch over the next 24 h and followed by 24 h washout (B4). Neurons were fixed and immunostained
for TUJ1. The scratch area is defined by the red dashed lines. Scale bar is 50 µm. (C) The scatter plot
shows P5 average TUJ1 pixel intensity. Data are shown as mean ± SD. For each condition, 2 ROIs of
3 random fields per sample from 3 culture preparations were analyzed. Welch’s t-test, SHAM CUT
24H vs. SP + CUT 24H p < 0.001 ***. Unpaired t-test, SHAM CUT 48H vs. CUT 48H + SP p < 0.001 ***.
(D) The scatter plot shows P16 average TUJ1 pixel intensity. Data are shown as mean ± SD. For
each condition, 2 ROIs of 3 random fields per sample from 3 culture preparations were analyzed.
Unpaired t-test, SHAM CUT 24H vs. SP + CUT 24H p < 0.001 ***. Unpaired t-test, SHAM CUT
48H vs. CUT 48H + SP p < 0.001 ***. (E) Schematic representation of the time course of SP inhibitor
application. (1) represents the application of SP for experimental conditions (A2,B2). (2) represents
the application of SP inhibitor for experimental conditions (A4,B4).
To test whether neurons would recover and regenerate after inhibitor removal
(Figure 7A4,B4), the SP inhibitor was administered immediately after the cut for the next
24 h, followed by a 24 h washout (Figure 7E). The TUJ1 pixel density decreased almostInt. J. Mol. Sci. 2022, 23, 4964 15 of 22
two-fold: in P5 cultures from 0.75 to 0.48 AU (Figure 7C) and in P16 cultures from 0.67 to
0.31 AU (Figure 7D).
The growth of new neurites was visibly reduced after treatment with the SP inhibitor,
whether the inhibitor was administered before or after injury, indicating a prolonged effect
of ATF3 inhibition on neurite outgrowth and neuronal regeneration (Figure 7A1,A3,B1,B3).
Finally, to verify if the effect of the JNK/c-Jun and p38-MAPK inhibitors on neuronal
growth and regeneration after injury was, in fact, associated with ATF3 and not with other
potential molecular factors, we blocked ATF3 using its specific antibody (Figure 8).
Figure 8. Inhibition of neuroregeneration by ATF3 antibody. (A1,B1) represents a control neuronal
culture treated with PBS only. ATF3 antibody was added to P5 (A2) and P16 (B2) opossum cortical
neurons in cell culture medium at DIV9 immediately after scratch. Neurons were fixed 24 h later
and immunostained for TUJ1 (left panels). Nuclei were counterstained for DAPI (right panels). The
scratch area is defined by the red dashed lines. Scale bar is 50 µm. (C) Scatter plot represents P5 and
P16 average TUJ1 pixel intensities. Data are shown as mean ± SD. For each condition, 2 ROIs of
3 random fields per sample from 3 culture preparations were analyzed. Welch’s t-test, P5 Ab- vs. P5
Ab+ p < 0.001 ***. Unpaired t-test, P16 Ab- vs. P16 Ab+ p < 0.001 ***. (D) Scatter plot represents P5
and P16 average neurite length of TUJ1-positive neurons. Data are shown as mean ± SD. Number of
neurites analyzed: P5 Ab- 270; P5 Ab+ 230; P16 Ab- 245; P16 Ab+ 214. Unpaired t-test P5 Ab- vs. P5
Ab+ p < 0.001 ***. Unpaired t-test, P16 Ab- vs. P16 Ab+ p < 0.001 ***. (E) Scatter plot represents the
percentage of dead cells for P5 and P16 cortical cultures. Data are shown as mean ± SD. Number of
cells analyzed: P5 Ab- 608; P5 Ab+ 784; P16 Ab- 516; P16 Ab+ 433. Welch’s t test P5 Ab- vs. P5 Ab+
p = 0.002 **. Welch’s t test, P16 Ab- vs. P16 Ab+ p < 0.001 ***. Images of 3 random fields were analyzed
per sample from 3 culture preparations. The accepted level of significance was p < 0.05. p < 0.001
very significant ***, 0.001–0.01 very significant **, 0.01–0.05 significant *, ≥0.05 not significant (ns).
Thus, the ATF3 antibody was applied to P5 and P16 neuronal cultures immediately
after the scratch for the next 24 h, after which the neurite length, TUJ1 pixel density, and
cell death were quantified. In the P5 cultures, the average TUJ1 pixel density decreased
from 0.65 ± 0.15 to 0.25 ± 0.08 AU, (Figure 8C), and similarly in P16 cultures decreased
from 0.65 ± 0.12 to 0.37 ± 0.09 AU (Figure 8C). The average neurite length in P5 cultures
decreased from 100 to 70 µm (Figure 8D), while in P16 cultures decreased from 97 to 72 µm
(Figure 8D) compared to the control condition.
Importantly, the percentage of dead cells was significantly higher after administration
of ATF3 antibody in both P5 (10% increase) and P16 cultures (25% increase) compared to
control conditions (Figure 8E).
Thus, the administration of ATF3 antibody immediately after injury in the opossum
neuronal cultures significantly reduced the average length and density of growing neurites
in the scratch area, with a significant increase in cell death.Int. J. Mol. Sci. 2022, 23, 4964 16 of 22
9. Discussion
9.1. The Different Expression and Localization of ATF3 in Neural Progenitor Cells versus Opossum
Cortical Neurons
ATF3, which we previously found to be important in the control of activity and mi-
gration of endogenous spinal stem cells [19], was now investigated as a possible regulator
of neuronal differentiation, network formation, and regeneration of primary cortical neu-
rons derived from postnatal opossums, that we have established recently [24]. These
primary cultures showed remarkably similar time course of in vitro network formation
and maturation when compared to the well-established cortical or hippocampal rodent
cultures [43–46], such as the formation of neuronal growth cones at DIV1, formation of
axons and MAP2-positive dendrites from DIV2-3 onwards, followed by the expression of
synaptic markers such as synapsin (Supplementary Figure S6) during the first two weeks
of the in vitro maturation. Moreover, the nearly pure neuronal cultures obtained using
P5-6 opossums (that corresponds to late rodent embryos) and the enrichment in glial cells
in cultures prepared from P16-17 cortex (similar to rodent neonates) correlates well with
cultures derived from mice or rat brain of equivalent age [25,47].
Thus, primary cultures of cortical neurons and neurospheres were prepared from
opossums at different postnatal ages with different spinal cord regeneration potential, and
the difference in RAG and ATF gene expression was investigated. We found significantly
higher levels of RAG and ATF members in neuronal progenitors compared to neurons.
Likewise, the cultures derived from younger (P6) opossums had higher expression of RAG
and ATF/CREB genes when compared to P17 cortical cultures, suggesting their importance
in the CNS development of neonatal opossums. Among those, the increase in ATF3
mRNA was the strongest and clearest. Moreover, we detected the different localization
of the ATF3 in neuronal progenitors (nuclear) and differentiated neurons (predominantly
cytoplasmic), suggesting that the ATF3 translocation occurs during neuronal differentiation.
This correlates with the previously demonstrated nuclear translocation of ATF3 in active
migrating ependymal cells in rat spinal cord, as opposed to cytoplasmic ATF3 localization
in quiescent ependymal cells [19].
Furthermore, we detected the 20 kDa ATF3 isoform abundant in the nucleus of neu-
ronal progenitors, which was not detected in the nucleus of differentiated neurons, indicat-
ing the existence and different subcellular localization of ATF3 isoforms in neuroprogenitors
and neurons. There are five alternatively spliced isoforms of ATF3 known in humans: ATF3
full-length, ATF3-∆zip, ATF3-∆zip2 (ATF3∆zip2a and ATF3∆zip2b), ATF3-∆zip2c, ATF3-
∆zip3, and ATF3b, while only two predicted opossum ATF3 transcript variants are currently
available in the Ensembl database: full 20 kDa and short 14 kDa. The alternatively spliced
14 kDa ATF3 isoform is thought to correspond to human ATF3 ∆Zip, since it does not
contain a leucine zipper domain or bind DNA, and it separates inhibitory cofactors from
the promoter initiating transcription, unlike the full ATF3 isoform [48].
The diverse roles of ATF3 in different tissues can also be explained by the posttrans-
lational modifications that the protein undergoes [49]. Consistent with this idea, the
detected ATF3 bands around 30 and 35 kDa (Figure 2E) are most likely sumoylated ATF3
full-length isoforms because the sumoylation is the most common ATF3 posttranslational
modification [49].
9.2. The Role of ATF3 in Neurite Outgrowth, Neuronal Differentiation, and Network Formation
during Postnatal Development
To demonstrate the role of ATF3 in neuronal differentiation, neurons were incubated
with JNK/c-Jun (SP) or MAPK/p38 (SB) inhibitors. Both inhibitors prevented the neurite
outgrowth and the neuronal network formation when applied during the initial stages of
neuronal growth (i.e., DIV1), indicating a key role of ATF3 in neuronal differentiation and
development. Other studies supporting this hypothesis showed that SP reversibly blocks
the development of neuronal polarity and axon formation [50] and that JNK1-deficient
embryonic stem cells do not differentiate into neurons [37]. It is interesting that if SP and SBYou can also read