Impact of the variability in vertical separation between biomass burning aerosols and marine stratocumulus on cloud microphysical properties over ...
←
→
Page content transcription
If your browser does not render page correctly, please read the page content below

Atmos. Chem. Phys., 21, 4615–4635, 2021
https://doi.org/10.5194/acp-21-4615-2021
© Author(s) 2021. This work is distributed under
the Creative Commons Attribution 4.0 License.

Impact of the variability in vertical separation between biomass
burning aerosols and marine stratocumulus on cloud microphysical
properties over the Southeast Atlantic
Siddhant Gupta1,2 , Greg M. McFarquhar1,2 , Joseph R. O’Brien3 , David J. Delene3 , Michael R. Poellot3 ,
Amie Dobracki4 , James R. Podolske5 , Jens Redemann2 , Samuel E. LeBlanc5,6 , Michal Segal-Rozenhaimer5,6,7 , and
Kristina Pistone5,6
1 Cooperative Institute for Mesoscale Meteorological Studies, University of Oklahoma, Norman, OK, USA
2 Schoolof Meteorology, University of Oklahoma, Norman, OK, USA
3 Department of Atmospheric Sciences, University of North Dakota, Grand Forks, ND, USA
4 Department of Atmospheric Sciences, Rosenstiel School of Marine and Atmospheric Science,

University of Miami, Miami, FL, USA
5 NASA Ames Research Center, Moffett Field, CA, USA
6 Bay Area Environmental Research Institute, Moffett Field, CA, USA
7 Department of Geophysics and Planetary Sciences, Porter School of Environmental and Earth Sciences,

Tel Aviv University, Tel Aviv, Israel

Correspondence: Siddhant Gupta (sid@ou.edu)

Received: 5 October 2020 – Discussion started: 27 October 2020
Revised: 12 February 2021 – Accepted: 16 February 2021 – Published: 25 March 2021

Abstract. Marine stratocumulus cloud properties over the        mixing of warm, dry free-tropospheric air into the clouds,
Southeast Atlantic Ocean are impacted by contact between        the median Nc and LWC for contact profiles decreased with
above-cloud biomass burning aerosols and cloud tops. Dif-       height by 21 and 9 % in the top 20 % of the cloud layer. The
ferent vertical separations (0 to 2000 m) between the aerosol   impact of droplet evaporation was stronger during separated
layer and cloud tops were observed on six research flights in   profiles as a greater decrease in humidity (and negative buoy-
September 2016 during the NASA ObseRvations of Aerosols         ancy) across cloud tops led to greater decreases in median Nc
above CLouds and their intEractionS (ORACLES) field cam-        (30 %) and LWC (16 %) near cloud tops.
paign. There were 30 contact profiles, where an aerosol            Below-cloud Na was sampled during 61 profiles, and
layer with aerosol concentration (Na ) > 500 cm−3 was within    most contact profiles (20 out of 28) were within high-Na
100 m of cloud tops, and 41 separated profiles, where the       (> 350 cm−3 ) boundary layers, while most separated pro-
aerosol layer with Na > 500 cm−3 was located more than          files (22 out of 33) were within low-Na (< 350 cm−3 ) bound-
100 m above cloud tops. For contact profiles, the average       ary layers. Although the differences in below-cloud Na
cloud droplet concentration (Nc ) in the cloud layer was up     were statistically insignificant, contact profiles within low-
to 68 cm−3 higher, the effective radius (Re ) up to 1.3 µm      Na boundary layers had up to 34.9 cm−3 higher Nc com-
lower, and the liquid water content (LWC) within 0.01 g m−3     pared to separated profiles. This is consistent with a weaker
compared to separated profiles. Free-tropospheric humidity      impact of droplet evaporation in the presence of biomass
was higher in the presence of biomass burning aerosols,         burning aerosols within 100 m above cloud tops. For con-
and contact profiles had a smaller decrease in humidity         tact profiles within high-Na boundary layers, the presence
(and positive buoyancy) across cloud tops with higher me-       of biomass burning aerosols led to higher below-cloud Na
dian above-cloud Na (895 cm−3 ) compared to separated pro-      (up to 70.5 cm−3 ) and additional droplet nucleation above
files (30 cm−3 ). Due to droplet evaporation from entrainment   the cloud base along with weaker droplet evaporation. Con-

Published by Copernicus Publications on behalf of the European Geosciences Union.
4616                                           S. Gupta et al.: Cloud microphysical properties over the Southeast Atlantic

sequently, the contact profiles in high-Na boundary layers       contribute to the total aerosol radiative forcing, which is “the
had up to 88.4 cm−3 higher Nc compared to separated pro-         dominant contributor to overall net Industrial Era forcing un-
files. These results motivate investigations of aerosol–cloud–   certainty” (Myhre et al., 2013).
precipitation interactions over the Southeast Atlantic since        The impact of the indirect effect can depend on above-
the changes in Nc and Re induced by the presence of above-       cloud thermodynamic parameters such as humidity, buoy-
cloud biomass burning aerosols are likely to impact precipi-     ancy, and inversion strength. Depending on the free-
tation rates, liquid water path, and cloud fraction, and modu-   tropospheric humidity, dry-air entrainment can decrease the
late closed-to-open-cell transitions.                            LWC in clouds with higher Nc due to the indirect effect
                                                                 (Ackerman et al., 2004; Coakley and Walsh, 2002). En-
                                                                 hanced dry-air entrainment can weaken the increase in cloud
                                                                 optical thickness associated with smaller droplets (Small
1   Introduction                                                 et al., 2009; Rosenfeld et al., 2014). A weak inversion
                                                                 can lead to increased cloud-top entrainment and initiate a
Clouds cover about two-thirds of the Earth’s surface (Stuben-    stratocumulus-to-cumulus transition by deepening and de-
rauch et al., 2013) and exert a global net cloud radiative ef-   coupling the boundary layer, and cutting off the surface mois-
fect (CRE) of about – 17.1 W m−2 on Earth’s energy budget        ture source (Wood, 2012). Evaporative cooling from mixing
(Loeb et al., 2009). In comparison, the estimated radiative      cloudy air with the warm and dry free-tropospheric air en-
forcing from 1750 to 2011 due to well-mixed greenhouse           training into clouds leads to cloud-top instability, which is
gases is +2.83 W m−2 (Myhre et al., 2013). The net CRE in-       the dominant source of turbulence in stratocumulus (Mel-
cludes reflection of shortwave solar radiation to space, which   lado, 2017).
cools the Earth, and the absorption (emission) of longwave          One of the largest stratocumulus cloud decks on Earth
radiation, which warms (cools) the Earth. Marine stratocu-       exists off the coast of Namibia over the Southeast Atlantic
mulus is a common cloud type that is observed over oceans        Ocean with a cloud fraction of over 60 % between July
off western continental coasts where sea-surface tempera-        and October (Devasthale and Thomas, 2011; Zuidema et al.,
tures are low and the boundary layer is capped by a strong       2016). Biomass burning aerosols (BBAs) that originate from
inversion (Klein and Hartmann, 1993). From 35◦ S to 35◦ N,       fires in southern Africa (van der Werf et al., 2010) are
stratocumulus clouds have a shortwave-plus-longwave top-         transported over the stratocumulus by the southern branch
of-the-atmosphere CRE between −150 and −200 W m−2                of the African easterly jet and overlay the clouds (Adebiyi
with a 10 to 20 % contribution to the net CRE (Oreopoulos        and Zuidema, 2016). The aerosol layer over time descends
and Rossow, 2011). General circulation models have large         and mixes with clouds, affecting cloud microphysical prop-
uncertainties and inter-model spread in estimates of the net     erties and their satellite retrievals (Haywood et al., 2004;
CRE (Boucher et al., 2013). This is partly due to strong un-     Costantino and Breon, 2010). Rajapakshe et al. (2017) found
derestimation of the subtropical marine stratocumulus cloud      the aerosol layer was located within 360 m above the cloud
cover and the associated CRE (Wang and Su, 2013).                layer for about 60 % of the Cloud-Aerosol Transport System
   The radiative impact of stratocumulus depends on many         (CATS) lidar nighttime scenes over the Southeast Atlantic.
factors, including the horizontal and vertical distribution of   Observations from the NASA ObseRvations of Aerosols
cloud droplets, their size distribution, and their number con-   above CLouds and their intEractionS (ORACLES) field cam-
centration. Stratocumulus properties depend on the number,       paign found the vertical gap between the aerosol layer and
size, composition, and vertical distribution of aerosols, and    cloud tops changed with longitude, having a maximum sepa-
meteorological parameters such as boundary layer height, air     ration near 7◦ E, and had a wide range of values (0 to 2000 m)
mass history, and cloud-top instability, all of which can mod-   with near-zero gap for 48 % of the scenes (LeBlanc et al.,
ulate the aerosol loading and influence aerosol–cloud inter-     2020). The Southeast Atlantic thus serves as a natural labo-
actions. Increases in aerosols acting as cloud condensation      ratory to examine the effects of varying vertical profiles of
nuclei can increase cloud droplet concentration (Nc ) and de-    above-cloud aerosols on cloud microphysics due to instances
crease effective radius (Re ), which increases the cloud opti-   of both separation and contact between the BBA layer and
cal thickness and shortwave reflectance under conditions of      the stratocumulus.
constant liquid water content (LWC) (Twomey, 1974, 1977).           BBAs over the Southeast Atlantic have 500 nm single-
Cloud adjustments in response to this aerosol indirect effect    scattering albedo ranging between 0.83 and 0.89 (Pistone
can modulate LWC. For example, precipitation suppression         et al., 2019), which indicates a significant absorbing compo-
in clouds with smaller droplets increases LWC and cloud          nent to the BBA layer. The warming associated with short-
lifetime, which increases the CRE (Albrecht, 1989). The in-      wave absorption by BBAs over the Southeast Atlantic can
direct effect and rapid adjustments in clouds contribute to      be amplified by the evaporation of cloud droplets, the semi-
the effective radiative forcing due to aerosol–cloud interac-    direct effect (Hansen et al., 1997; Ackerman et al., 2000).
tions (Boucher et al., 2013). Estimates of the effective ra-     Aerosols above a reflective cloud layer absorb more solar ra-
diative forcing (−1.2 to 0.0 W m−2 ) have uncertainties that     diation than aerosols below or within cloud, which affects

Atmos. Chem. Phys., 21, 4615–4635, 2021                                            https://doi.org/10.5194/acp-21-4615-2021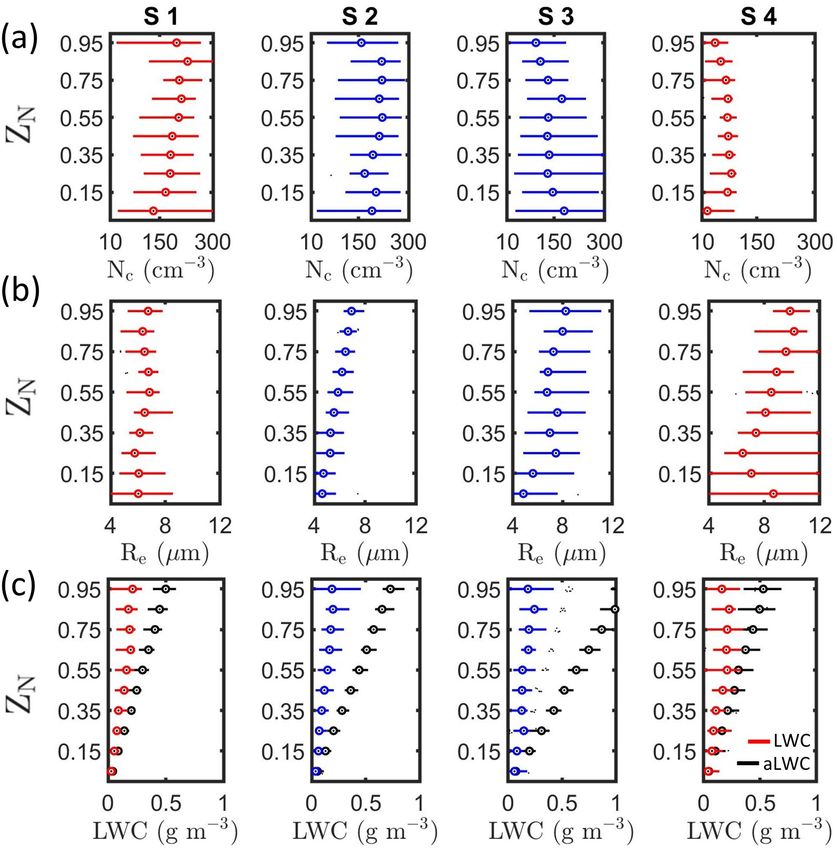
S. Gupta et al.: Cloud microphysical properties over the Southeast Atlantic                                              4617

cloud formation (Haywood and Shine, 1997) and the region’s       logical conditions (Table 1), among other instrumentation.
aerosol direct radiative effect (Keil and Haywood, 2003;         The Passive Cavity Aerosol Spectrometer Probe (PCASP)
Cochrane et al., 2019). Shortwave absorption by above-cloud      measured aerosol from approximately 0.1 to 3.0 µm using
aerosols can increase the buoyancy above cloud tops, in-         three voltage amplifiers: high-, middle-, and low-gain stages
hibit cloud-top entrainment, and increase liquid water path      (Cai et al., 2013). Laboratory sampling of ammonium sul-
(Wilcox, 2010). Large-eddy simulations indicate that the lo-     fate particles conducted after the IOP with the PCASP and
cation of the aerosol layer impacts both the magnitude and       a scanning mobility particle size spectrometer (SMPS) ad-
sign of the semi-direct forcing (Johnson et al., 2004; Mc-       justed the PCASP concentration within each amplification
Farquhar and Wang, 2006). For example, aerosols above the        stage to match the measured SMPS concentration. Thereby,
boundary layer lead to a stronger inversion and decrease en-     a low bias within the middle- and high-gain stages was cor-
trainment. Additionally, aerosols within the boundary layer      rected to calculate the total aerosol concentration (Na ).
cause cloud evaporation and boundary layer decoupling.              A high-resolution time-of-flight aerosol mass spectrome-
   The treatment of aerosol effects results in inter-model       ter (HR-ToF-AMS, or AMS) is used to derive the aerosol
differences in climate simulations, along with biases in         mass (Ma ) and chemistry, including organic aerosols (OAs)
satellite retrievals of clouds and aerosols (Haywood et al.,     (Table 1). A time- and composition-dependent collection
2004; Brioude et al., 2009; Chand et al., 2009; Coddington       efficiency (CE) was applied to AMS data. The molar ra-
et al., 2010; Painemal and Zuidema, 2011). Many large-scale      tio of ammonium to sulfate (NH4 / (2 × SO4 )) was calcu-
models do not adequately consider cloud microphysical re-        lated to assess the acidity of liquid aerosol, which is col-
sponses to the vertical separation of aerosols when evaluating   lected more efficiently compared to neutralized aerosol.
aerosol–cloud interactions (Hill et al., 2008). The ORACLES      Thus, CE was determined as the maximum between 0.5 and
field campaign provides a unique dataset of in situ observa-     (1 − NH4 / (2 × SO4 )), with a value of 0.5 serving as the
tions of cloud and aerosol properties over the Southeast At-     lower limit, consistent with estimates from most previous
lantic (Redemann et al., 2021). The impact of above-cloud        field campaigns (Middlebrook et al., 2012). A Single Parti-
BBAs on stratocumulus properties is quantified by compar-        cle Soot Photometer (SP2) measured refractory black carbon
ing in situ cloud measurements from instances with layer         (rBC) concentration, and a CO/CO2 /H2 O gas analyzer mea-
separation to instances of contact between the aerosol layer     sured carbon monoxide (CO) concentration. The Spectrom-
and the clouds.                                                  eter for Sky-Scanning, Sun-Tracking Atmospheric Research
   The remainder of the paper is organized as follows. The       (4STAR) was used to measure column aerosol optical depth
instrumentation used in the analysis is described in Sect. 2     (AOD) and retrieve trace gas concentrations above the air-
along with the procedures for processing the data. A case        craft (Dunagan et al., 2013; LeBlanc et al., 2020).
study of the 6 September 2016 research flight is presented in       The suite of in situ cloud probes included the Cloud and
Sect. 3. The meteorological and aerosol conditions present       Aerosol Spectrometer (CAS) on the Cloud, Aerosol, and
are examined, and profiles of Nc , Re , and LWC are com-         Precipitation Spectrometer (CAPS); Cloud Droplet Probe
pared for four sawtooth maneuvers flown at locations where       (CDP); Phase Doppler Interferometer; Two-Dimensional
clouds were in contact with and separated from above-cloud       Stereo Probe (2D-S); Cloud Imaging Probe (CIP) on the
BBAs. In Sect. 4, measurements from six research flights         CAPS; High Volume Precipitation Sampler (HVPS-3); and
are analyzed to investigate buoyancy associated with cloud-      the CAPS and King hot wires. These instruments sampled the
top evaporative cooling, and profiles of Nc , Re , and LWC       droplet number distribution function (n(D)) for droplets with
are compared for boundary layers with similar and varying        diameters ranging from 0.5 to 19 200 µm. The CAPS and
aerosol loading. Finally, the conclusions and their impact       King hot wires measured the bulk LWC. Baumgardner et al.
on the understanding of aerosol–cloud interactions are dis-      (2017) discuss the general operating characteristics and mea-
cussed in Sect. 5.                                               surement uncertainties of the in situ cloud probes, and Mc-
                                                                 Farquhar et al. (2017) summarize data processing algorithms.
                                                                 Therefore, only aspects of instrument performance unique to
2   Instrumentation                                              ORACLES 2016 are summarized herein. The in situ probes
                                                                 used here (CAS, 2D-S, HVPS-3, and PCASP) were cali-
This study presents in situ measurements of cloud and            brated by the manufacturers prior to and shortly after the de-
aerosol properties acquired during the first intensive obser-    ployment. During the deployment, performance checks ac-
vation period (IOP) of ORACLES based at Walvis Bay,              cording to the instrument manuals were completed to deter-
Namibia (23◦ S, 14.6◦ E). The NASA P-3B aircraft con-            mine any change in instrument performance. This included
ducted research flights west of Africa over the Southeast At-    monitoring the CAS and 2D-S voltages and temperatures
lantic Ocean between 1◦ W to 15◦ E and 5◦ S to 25◦ S from        during flights and passing calibration particles through the
27 August to 27 September 2016. The aircraft typically flew      CAS sample volume to determine any change in the relation-
50 m to 7 km above the ocean surface and was equipped with       ship between particle size and peak signal voltage.
in situ probes for sampling aerosols, clouds, and meteoro-

https://doi.org/10.5194/acp-21-4615-2021                                         Atmos. Chem. Phys., 21, 4615–4635, 2021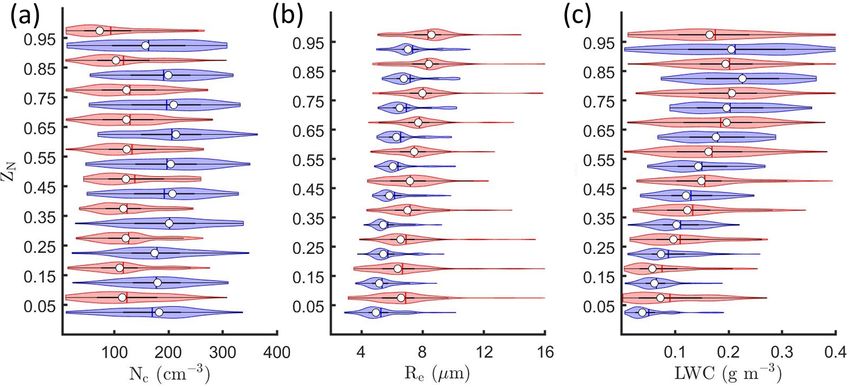
4618                                                S. Gupta et al.: Cloud microphysical properties over the Southeast Atlantic

Table 1. The main parameter used, sampling frequency, and measurement range for in situ instruments installed on the P-3 research aircraft
and used within this study.

  Instrument                         Parameter used            Sampling       Measurement range              Reference
                                                               frequency
  Rosemount 102                      Temperature               1 Hz           Nominally −50 to 50 ◦ C        Rosemount, Incorporated
  Rosemount MADT 2014                Pressure                  1 Hz           Nominally 30–1300 mb           Rosemount, Incorporated
  EdgeTech 137 chilled-mirror        Dew point temperature     1 Hz           Nominally −40 to 60 ◦ C        EdgeTech Instruments
  hygrometer
  Global Positioning System          Latitude, longitude,      1 Hz           −90 to 90◦
                                     altitude                                 −180 to 180◦
  CO/CO2 Analyzer                    CO, H2 O (v)              1 Hz           5 to 50 000 ppb,               Los Gatos Research
                                                                              100 ppm to 100 % humidity
  CAS                                Droplet n(D)              10 Hz          0.5–50 µm                      Baumgardner et al. (2001)
  2D-S                               Droplet images,                          Nominally 10–1280 µm           Lawson et al. (2006)
                                     asynchronous n(D)
  HVPS-3                             Droplet images,                          Nominally 150–19 200 µm        Lawson et al. (1998)
                                     asynchronous n(D)
  King hot wire                      Bulk LWC                  25 Hz          0.05–3 g m−3                   King et al. (1978)
  PCASP                              Aerosol n(D)              10 Hz          0.1–3 µm                       Strapp et al. (1992)
  SP2                                Aerosol absorption        1 Hz           55–524 nm                      Stephens et al. (2003)
  HR-ToF-AMS                         Aerosol mass              0.2 Hz         50–700 nm                      Drewnick et al. (2005)

   CDP data were unusable for the entire 2016 IOP due to                2D-S and HVPS-3 data were processed using the University
an optical misalignment issue. Data from the components of              of Illinois/Oklahoma Optical Array Probe Processing Soft-
CAPS (CAS, CIP, and CAPS hot wire) were not available                   ware (McFarquhar et al., 2018). Droplets measured by the
before 6 September 2016 because of improper seating of the              2D-S and HVPS-3 having aspect ratios greater than 4 or
analog-to-digital interface board, which resulted in no mea-            area ratios less than 0.5 were rejected as artifacts because
surements of droplets less than 50 µm in diameter prior to              this study focuses on warm clouds with liquid drops sampled
this flight. The optical lenses were cleaned with isopropyl be-         above 0 ◦ C. Droplets with inter-arrival times less than 6 µs,
fore each flight, which was especially important during OR-             indicative of intermittently stuck diodes or drizzle breakup,
ACLES since the aircraft frequently flew through aerosol lay-           were removed (Field et al., 2006). Out-of-focus hollow par-
ers that deposited soot on optical lenses of the cloud probes.          ticles were reconstructed following Korolev (2007).
Stuck bits (photodiodes continuously occluded due to soot                  The droplet size distributions from the CAS and 2D-
deposition) on the optical array probes (2D-S and HVPS-3)               S were merged at 50 µm in diameter to create a com-
were masked during each flight to reduce the presence of ar-            bined 1 Hz size distribution, which was used to calculate
tifacts in particle images. The 2D-S vertical channel consis-           Nc , Re , and LWC. While the HVPS-3 sampled droplets
tently had photodiode voltages below 1.0 V due to soot de-              larger than 1280 µm in diameter, only three such 1 s sam-
position on the inside of the receive-side mirror. Therefore,           ples, with N < 0.005 L−1 , were sampled during the cloud
only data from the horizontal channel are used.                         profiles from the IOP. A threshold of Nc > 10 cm−3 and
   The aircraft’s true air speed (TAS) was about 15 % higher            bulk LWC > 0.05 g m−3 for 1 Hz measurements was used
than the TAS measured by a Pitot tube alongside the CIP.                to define cloud samples (cf. Lance et al., 2010; Bretherton
Previous work has shown uncertainties with using the Pitot              et al., 2010). The cloud threshold eliminated the inclusion
tube TAS to represent airflow near the probes (Lance et al.,            of optically thinner clouds that a lower LWC threshold of
2010; Johnson et al., 2012). Therefore, CAPS, 2D-S, and                 0.01 g m−3 would have included (e.g., Heymsfield and Mc-
HVPS-3 probes used the aircraft’s TAS, in the absence of                Farquhar, 2001). Water vapor mixing ratio (q) was deter-
reliable TAS measured at these probes’ locations. CAPS and              mined using a chilled-mirror hygrometer as well as the Los
PCASP data were processed using the Airborne Data Pro-                  Gatos Research CO/CO2 /H2 O gas analyzer. The hygrometer
cessing and Analysis processing package (Delene, 2011).                 suffered from cold soaking during descents from higher ele-

Atmos. Chem. Phys., 21, 4615–4635, 2021                                                   https://doi.org/10.5194/acp-21-4615-2021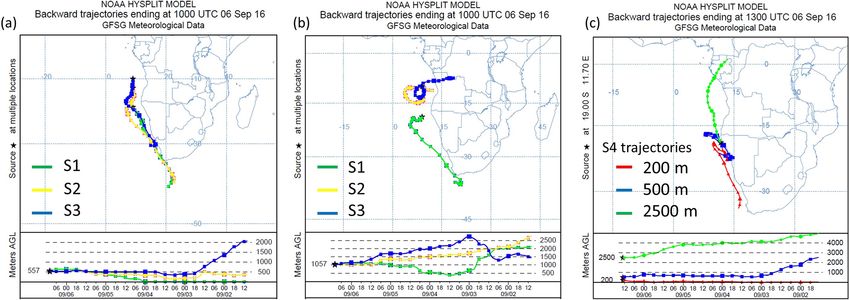
S. Gupta et al.: Cloud microphysical properties over the Southeast Atlantic 4619
four individual cloud profiles (P1–P4). Each sawtooth ma-
neuver consisted of four to six individual profiles (Table 2),
which were numbered sequentially (S1-1, S1-2, etc.). South-
southeasterly winds (5–8 m s−1 ) were observed at the surface
and at 925 mb (Fig. 2a and b). This wind field was asso-
ciated with a surface low-pressure system east of the study
region centered around 17◦ S, 13◦ E, which resulted in ad-
vection of low clouds toward the northwest. Open and closed
cells of marine stratocumulus persisted along with pockets
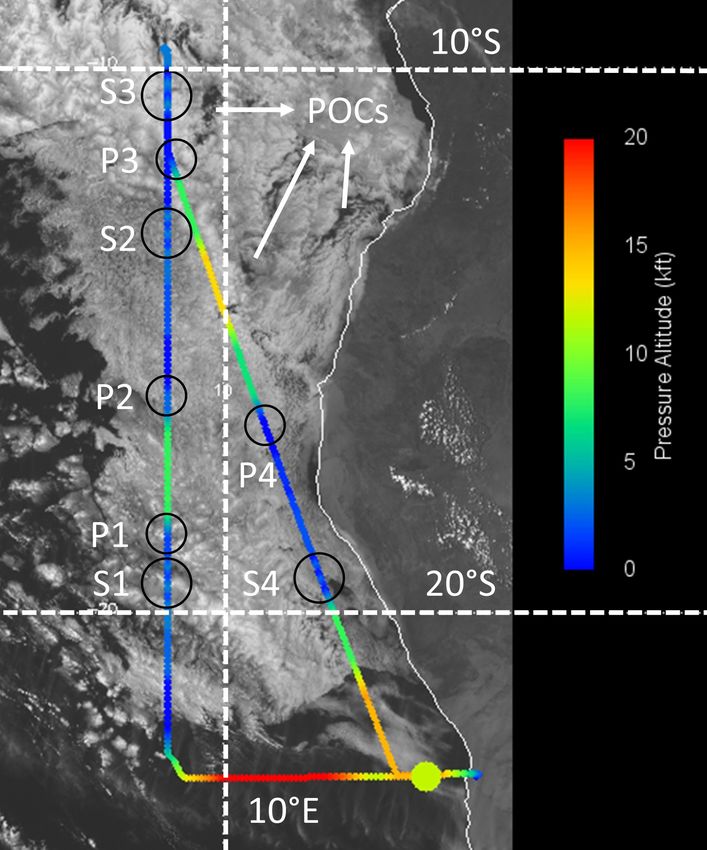
of open cells (POCs) (Fig. 1). S1, S2, and S3 were flown
along 9◦ E in closed cells of marine stratocumulus. S4 was
flown closer to the coast in a shallow boundary layer with
thin closed-cell stratocumulus (Fig. 1) later in the day com-
pared to S1–S3 (Fig. 3). Ambient temperature sampled by the
aircraft sensor was 3 to 6 ◦ C higher during S2 and S3 com-
pared to S1 because the 500 mb geopotential height and rel-
ative humidity (RH) were higher toward the north (Fig. 2b).
Cloud-top height (ZT ) is identified as the highest altitude sat-
isfying the criteria used to define cloud (Nc > 10 cm−3 and
bulk LWC > 0.05 g m−3 ). S1, S2, and S3 had higher ZT com-
pared to S4 (Fig. 3) due to the advection of cold, dry conti-
nental air from the southeast and low RH (< 70 %) where S4
was flown, which resulted in cloud thinning and a shallower
boundary layer (Fig. 2b and c).
The aircraft intermittently entered and exited cumulus
Figure 1. Visible image from the Spinning Enhanced Visible and clouds below the stratocumulus layer during 33 of the
Infrared Imager at 14:00 UTC on 6 September 2016 (PRF5), over-
71 cloud profiles flown during the IOP (Table 2), which
laid by the PRF5 flight track and colored by flight altitude. Circles
indicate sawtooth maneuver (S) and individual cloud profile (P)
resulted in fluctuating values of Nc and Re , with bulk
locations (https://bocachica.arc.nasa.gov/ORACLES/, last access: LWC < 0.05 g m−3 . For example, during S1-3, Nc varied
22 March 2021). between 10 and 240 cm−3 , and Re varied between 3 and
12 µm up to 130 m below where the stratocumulus base
was identified with bulk LWC > 0.05 g m−3 . Images from
vation and measured lower q near cloud tops during descents a forward-facing camera on the aircraft contrast a bound-
compared to ascents into cloud. Measurements of q from the ary layer with multiple cloud layers (Fig. 4a; image taken at
gas analyzer had to be masked for near- and in-cloud sam- 08:53 UTC) during S1-3 and a shallow, well-mixed bound-
ples during both ascents and descents due to residual water ary layer capped by stratocumulus (Fig. 4b; image taken at
in the inlet. Therefore, only hygrometer data collected during 13:16 UTC) during S4-1. It is likely the stratocumulus layer
ascents are used for the analyses involving q. was decoupled from the surface where S1-3 was flown be-
cause the boundary layer was deepened by the entrainment of
free-tropospheric air. Subsequently, the sub-cloud layer was
3 Observations on 6 September 2016 well-mixed with the surface and topped by shallow cumu-
lus similar to observations by Wood (2012). The cloud base
3.1 Flight track and meteorological conditions height (ZB ) for the 33 profiles was determined as the low-
est altitude with Nc > 10 cm−3 and bulk LWC > 0.05 g m−3
ORACLES research flight tracks included in situ cloud sam- above which a continuous cloud layer was sampled. S4 had
pling during individual ascents or descents through cloud or lower ZB (195–249 m) compared to S1 (676–691 m), S2
during a series of ascents and descents through cloud along a (534–598 m), and S3 (501–775 m) (Fig. 3).
constant heading (sawtooth maneuvers). A case study of the
fifth P-3 research flight (PRF5) flown on 6 September 2016 3.2 Above- and below-cloud aerosol composition
was used to examine aerosol and cloud properties sampled
under conditions of both contact and separation between the For each sawtooth maneuver, the above- and below-cloud
aerosol layer and cloud tops. PRF5 was selected because it air mass source region was identified using 5 d back tra-
had the highest cloud profiling time among the six PRFs with jectories computed using the NOAA Hybrid Single-Particle
at least eight cloud profiles (Table 2). Four sawtooth maneu- Lagrangian Integrated Trajectory model (Stein et al., 2015)
vers (S1–S4) were flown during PRF5 (Fig. 1) along with applied to the National Centers for Environmental Predic-
https://doi.org/10.5194/acp-21-4615-2021 Atmos. Chem. Phys., 21, 4615–4635, 2021
4620                                               S. Gupta et al.: Cloud microphysical properties over the Southeast Atlantic

Table 2. List of research flights analyzed with the number of cloud profiles flown and total time spent profiling clouds during each flight.
The number of profiles during sawtooth maneuvers are reported within parentheses. The number of profiles and the corresponding sampling
time are reported for contact and separated profiles during each flight.

                          Flight             Sawtooth +             Cloud time        Contact        Separated
                                             individual profiles                      profiles       profiles
                          PRF5: 6 Sep        4 (4, 5, 4, 6) + 5     1327 s            13 (857 s)     11 (470 s)
                          PRF7: 10 Sep       1 (2) + 7              461 s             0 (0 s)        9 (461 s)
                          PRF8: 12 Sep       1 (6) + 2              504 s             1 (32 s)       7 (472 s)
                          PRF9: 14 Sep       0 (0) + 8              574 s             0 (0 s)        8 (574 s)
                          PRF11: 20 Sep      1 (7) + 6              669 s             13 (669 s)     0 (0 s)
                          PRF13: 25 Sep      2 (2, 3) + 4           511 s             3 (148 s)      6 (363 s)
                          Total              9 (39) + 32            1 h 7 min 26 s    30 (1706 s)    41 (2340 s)

Figure 2. Zero-hour European Centre for Medium-Range Weather Forecasts reanalysis at 12:00 UTC on 6 September 2016 for (a) mean sea
level pressure, 500 mb geopotential height, and surface wind; (b) 925 mb relative humidity, geopotential height, and wind; and (c) boundary
layer height and 900 mb wind (https://bocachica.arc.nasa.gov/ORACLES/, last access: 22 March 2021).

tion Global Data Assimilation System model (Fig. 5). The                bustion, this suggests the continental above-cloud air mass
concentrations listed in Table 3 indicate measurements up               had greater exposure to biomass burning products compared
to 100 m above and below the clouds averaged across the                 to the air masses from the southeast. S2 and S3 also had
cloud profiles for each sawtooth maneuver. The variability in           higher below-cloud rBC and CO compared to S1 and S4 (Ta-
above-cloud Ma and Na for S1–S4 was driven by the above-                ble 3), which suggests the BBAs with high Na within 100 m
cloud air mass source region. The above-cloud air mass sam-             above clouds could be mixing into the cloud layer and pol-
pled near S1 and S4 originated from the boundary layer from             luting the boundary layer. This is also likely to be associ-
the southeast, and the above-cloud air mass sampled near S2             ated with the history of entrainment mixing of polluted free-
and S3 descended from higher altitudes over the African con-            tropospheric air into the boundary layer prior to these obser-
tinent (Fig. 5b and c). The above-cloud OA Ma and Na for S2             vations (Diamond et al., 2018).
and S3 were over 5 times higher than the corresponding val-
ues for S1 and S4 (Table 3). The below-cloud air mass sam-              3.3    Cloud profile classification
pled during S1–S4 was advected from the boundary layer
from the southeast (Fig. 5a and c). During S1 and S4, the               Every sawtooth maneuver was preceded by a 5–10 min
above- and below-cloud rBC and CO concentrations were                   constant-altitude flight leg about 100 m above the cloud
similar (Table 3) since the above-cloud air mass also orig-             layer to retrieve the above-cloud AOD using 4STAR. Av-
inated from the southeast (Fig. 5b and c). During S2 and                erage above-cloud AOD at 550 nm within 50 km of the
S3, the continental above-cloud air mass had much higher                sampling locations for S1–S4 ranged between 0.33 and
rBC and CO (over 500 cm−3 and 190 ppb) compared to the                  0.49, indicating a BBA layer was located at some altitude
below-cloud air mass from the southeast (below 150 cm−3                 above the clouds sampled during S1–S4. During S1, above-
and 120 ppb). Since OA, rBC, and CO are indicators of com-              cloud Na < 500 cm−3 was sampled up to 200 m above cloud

Atmos. Chem. Phys., 21, 4615–4635, 2021                                                    https://doi.org/10.5194/acp-21-4615-2021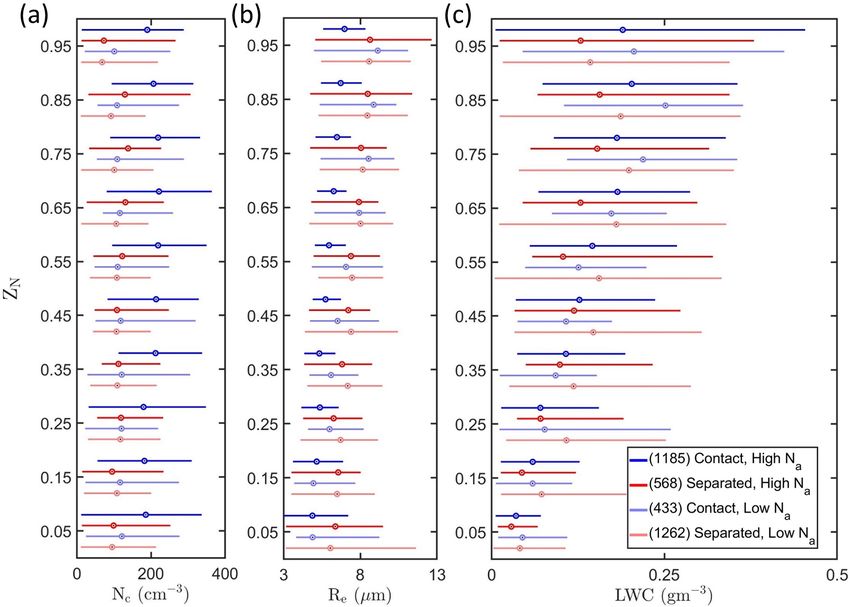
S. Gupta et al.: Cloud microphysical properties over the Southeast Atlantic                                                            4621

Figure 3. P-3 aircraft altitude as a function of time, colored by PCASP accumulation mode (0.1 < D < 3 µm) Na for four sawtooth maneuvers
flown on 6 September 2016. In-cloud Na are masked due to potential for droplet shattering on the PCASP probe inlet.

                                                                       Table 3. The total (OA + SO2+            +        −
                                                                                                       4 + NH4 + NO3 ) and OA Ma ,
                                                                       PCASP Na , and rBC and CO concentrations sampled up to 100 m
                                                                       below cloud base and 100 m above cloud top during four sawtooth
                                                                       maneuvers (S1–S4) flown on 6 September 2016. These values cor-
                                                                       respond to averages across the individual profiles flown during S1–
                                                                       S4. AOD was sampled during constant altitude flight legs and cor-
                                                                       responds to the atmospheric column above the aircraft.

                                                                         Parameter             Location       S1       S2       S3      S4
                                                                         Total Ma (µg m−3 )    Above cloud     3.4   22.9     21.7      0.8
                                                                                               Below cloud     4.5      5.9      5.7    1.4
                                                                         OA Ma (µg m−3 )       Above cloud     2.0   16.9     13.2      0.4
                                                                                               Below cloud     1.9      3.5      3.4    1.0
                                                                         PCASP Na (cm−3 )      Above cloud    241    1515     1334       16
                                                                                               Below cloud    354      327      390      72
                                                                         rBC (cm−3 )           Above cloud      66    516       700      10
                                                                                               Below cloud     72      111      130     NA
                                                                         CO (ppb)              Above cloud     95      196      230      96
                                                                                               Below cloud     93      103      117      88
                                                                         AOD                   Above cloud   0.33     0.37     0.49    0.39
Figure 4. Snapshots of the boundary layer sampled below (a) S1         NA: not available.
showing shallow cumulus and stratocumulus layers with varying
bases, and (b) S4 showing stratocumulus clouds with a uniform base
(NSRC/NASA Airborne Science Program).
                                                                       was located within 100 m above cloud tops, and the BBA
                                                                       layer was likely in contact with the cloud tops. Therefore,
tops (Fig. 3), which indicates the BBA layer was sepa-                 cloud profiles flown during S2 and S3 were classified as
rated from cloud tops. During S4, the level of above-cloud             contact profiles. In a previous study, a significantly higher
Na > 500 cm−3 was identified over 200 m above cloud tops,              threshold (PCASP Na = 1000 cm−3 ) was used to identify the
indicating a similar separation. Therefore, cloud profiles             BBA layer above stratocumulus clouds off the coast of Cal-
flown during S1 and S4 were classified as separated profiles.          ifornia (Mardi et al., 2018). The sensitivity of the threshold
During S2 and S3, the level of above-cloud Na > 500 cm−3               chosen in this study is examined in Appendix A, and using a

https://doi.org/10.5194/acp-21-4615-2021                                                    Atmos. Chem. Phys., 21, 4615–4635, 2021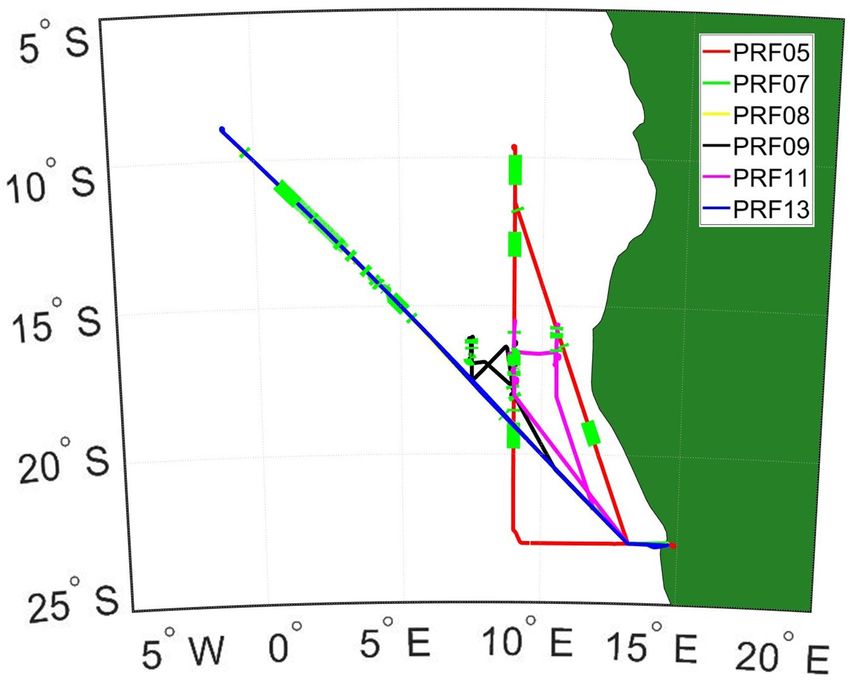
4622                                              S. Gupta et al.: Cloud microphysical properties over the Southeast Atlantic

Figure 5. Five-day back trajectories from the Hybrid Single-Particle Lagrangian Integrated Trajectory model for sawtooth maneuvers flown
on 6 September 2016 (a) ending at 10:00 UTC for S1–S3 at 500 m a.m.s.l.; (b) ending at 10:00 UTC for S1–S3 at 1000 m a.m.s.l.; and
(c) ending at 13:00 UTC for S4 at 200, 500, and 2500 m a.m.s.l.

                                                                      top). Measurements from the four sawtooth maneuvers were
                                                                      compared following McFarquhar et al. (2007) and divided
                                                                      into 10 ZN bins, where each bin represented 10 % of the
                                                                      cloud layer (Fig. 6). For example, the bin with 0 < ZN < 0.1
                                                                      (represented by the midpoint, ZN = 0.05) included data col-
                                                                      lected over the bottom 10 % of the cloud layer. For sepa-
                                                                      rated profiles, droplet nucleation occurred near cloud base
                                                                      with the median Nc increasing up to ZN = 0.25 (S1: 132 to
                                                                      179 cm−3 ; S4: 23 to 85 cm−3 ). The impact of droplet nu-
                                                                      cleation decreased above cloud base (ZN = 0.25 to 0.75),
                                                                      and median Nc increased by up to 30 cm−3 for S1 and de-
                                                                      creased by up to 15 cm−3 for S4 (Fig. 6a). Condensational
                                                                      growth occurred over these levels as the median Re increased
                                                                      with ZN (Fig. 6b). The median Nc decreased near cloud
                                                                      top (ZN = 0.75 to 0.95) due to droplet evaporation resulting
                                                                      from cloud-top entrainment mixing between cloudy and non-
                                                                      cloudy air. Contact profiles (S2 and S3) had higher median
                                                                      Nc at cloud base compared to separated profiles, which de-
                                                                      creased with height up to ZN = 0.25 (S2: 190 to 169 cm−3 ,
                                                                      S3: 180 to 131 cm−3 ). The median Nc for S2 and S3 in-
                                                                      creased by up to 43 cm−3 over ZN = 0.25 to 0.75 and de-
Figure 6. Vertical profiles of (a) Nc , (b) Re , and (c) LWC and      creased near cloud top due to droplet evaporation. S4 had the
aLWC as a function of ZN for the four sawtooth maneuvers. Maneu-      lowest Nc at cloud base because the below-cloud Ma and Na
vers with contact (separation) between the biomass burning aerosol    for S4 were over a factor of 3 lower than the corresponding
layer and cloud tops shown in blue (red).                             values for S1–S3 (Table 3).
                                                                         Consistent with condensational growth and collision–
                                                                      coalescence, median Re increased with ZN from cloud base
threshold of 1000 cm−3 would have no significant impact on
                                                                      to top, from 6.0 to 6.7 µm, 4.6 to 6.9 µm, 4.9 to 8.3 µm, and
the results presented in this study.
                                                                      8.7 to 9.9 µm for S1–S4, respectively (Fig. 6b). S1 and S4
3.4    Vertical profiles of Nc , Re , and LWC                         had higher median Re at cloud base due to higher drizzle
                                                                      (droplets with diameters larger than 50 µm) concentrations
Since ZB and cloud thickness (H ) varied between profiles,            (41 and 31 L−1 ) compared to S2 and S3 (14 and 18 L−1 ).
Nc , Re , and LWC were examined as a function of nor-                 For S4, drizzle concentration decreased from ZN = 0.05 to
malized height above cloud base (ZN ), where ZN = (Z −                0.25, which led to the decrease in median Re over these
ZB )/(ZT − ZB ) and varied from 0 (cloud base) to 1 (cloud            heights. The median LWC increased with height up to at least

Atmos. Chem. Phys., 21, 4615–4635, 2021                                                  https://doi.org/10.5194/acp-21-4615-2021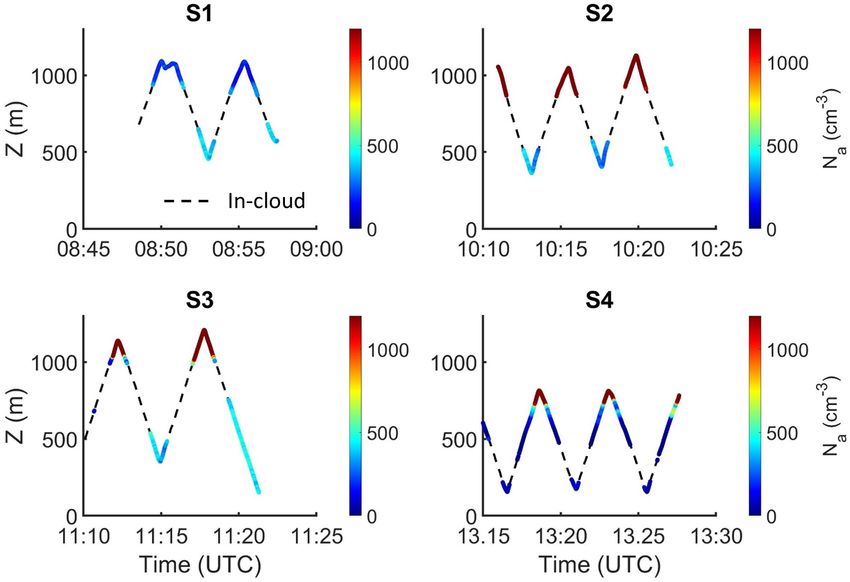
S. Gupta et al.: Cloud microphysical properties over the Southeast Atlantic                                                      4623

                                                                        to 0.75. Between the separated profiles, S1 had significantly
                                                                        higher Nc (differences of 108 to 126 cm−3 ), which could be
                                                                        attributed to significantly higher above-cloud Na and greater
                                                                        entrainment mixing during S1 compared to S4. However,
                                                                        these differences could also be due to the meteorological dif-
                                                                        ferences at their sampling locations (lower boundary layer
                                                                        height, RH, and 500 mb geopotential height for S4 along with
                                                                        a smaller decrease in T and qT across cloud tops) or the sig-
                                                                        nificantly higher below-cloud Na for S1 compared to S4.
                                                                           Contact profiles had significantly higher Nc (differences of
                                                                        45 to 61 cm−3 ) and lower Re (differences of 1.4 to 2.0 µm)
                                                                        compared to separated profiles. Contact profiles also had sig-
                                                                        nificantly higher above-cloud Na and greater entrainment
Figure 7. Vertical profiles of (a) T and (b) qT as a function of dis-   mixing in the cloud layer (lower LWC / aLWC). These mi-
tance from cloud top. Each line corresponds to an individual ascent     crophysical changes would also impact cloud reflectance
through cloud during a sawtooth. The profiles flown during S2 and       (Twomey, 1991) as seen by the significantly higher cloud
S3 (S1 and S4) had contact (separation) between the above-cloud         optical thickness (τ ) of contact profiles compared to sepa-
biomass burning aerosol layer and cloud tops.                           rated profiles (differences of 2.5 to 8.2). The increase in τ
                                                                        and the cloud reflectance provides observational evidence of
                                                                        the aerosol indirect effect over the Southeast Atlantic due to
ZN = 0.75 and decreased near cloud tops due to droplet evap-            contact between above-cloud BBAs and the stratocumulus
oration (Fig. 6c). The LWC for each sawtooth maneuver was               clouds.
lower than the adiabatic LWC (aLWC) due to cloud-top en-                   However, contact profiles also had significantly higher
trainment mixing, and the ratio of LWC to aLWC was used                 below-cloud Na (differences of 145 to 190 cm−3 ), which
to quantify the degree of mixing. Lower LWC / aLWC (av-                 contribute to the higher Nc relative to separated profiles.
eraged over the cloud layer) for S2 and S3 (0.37 and 0.41)              Therefore, a statistical analysis was conducted with a larger
compared to S1 and S4 (0.51 and 0.55) indicated that con-               number of profiles in an attempt to attribute these differ-
tact profiles had greater mixing between cloudy and non-                ences in Nc and Re to the vertical distance between the
cloudy air in the cloud layer, on average. The boundary layer           above-cloud BBA layer and cloud tops. Building on this case
was capped by an inversion with warmer, drier air above                 study, 71 cloud profiles flown on six flights between 6 and
the clouds. During S1–S4, the temperature increased above               25 September 2016 were examined, and the impact of above-
cloud top by 10.3, 9.3, 8.9, and 1.5 ◦ C, and the total water           cloud BBAs on the free-tropospheric humidity and buoyancy
mixing ratio decreased by 6.2, 5.4, 2.3, and 0.4 g kg−1 , re-           across cloud tops was explored. Sixty-one contact and sep-
spectively (Fig. 7). The decreases in Nc and LWC near stra-             arated profiles were further classified as low-Na or high-Na
tocumulus tops have been attributed to cloud-top entrainment            profiles based on the below-cloud Na . This was done to quan-
of the overlying warm and sub-saturated air (Wood, 2012).               tify the differences in Nc and Re between contact and sep-
Droplet evaporation due to the entrainment mixing resulted              arated profiles within boundary layers with similar below-
in decreases of 14, 28, 12, and 26 % in the median Nc near              cloud Na .
cloud tops during S1–S4, respectively.

3.5   Evidence of the aerosol indirect effect                           4     Statistical analysis

Nc and Re were compared between sawtooth maneuvers, and                 4.1    Meteorological conditions and above-cloud aerosols
the differences reported hereafter refer to 95 % confidence
intervals for the difference in the variable means (based on            Six flights (including PRF5) are included in the statistical
a two-sample t test, p < 0.02). Between the contact pro-                analysis. On 10, 12, and 25 September, the P-3 took off from
files, S2 had significantly higher Nc (differences of 37 to             Walvis Bay, Namibia (23◦ S, 14.6◦ E), and flew northwest
56 cm−3 ) compared to S3. This was despite having statisti-             from 23◦ S, 13.5◦ E toward 10◦ S, 0◦ E, returning along the
cally insignificant differences in below-cloud Na , a greater           same track (Fig. 8). Different tracks were followed on 6, 14,
fractional decrease in median Nc near cloud top compared to             and 20 September, which included meridional legs along 9,
S3, and greater entrainment mixing (lower LWC / aLWC). S2               7.5 and 9◦ E, and 9 and 10.5◦ E, respectively. Meteorological
had significantly higher above-cloud Na compared to S3 and              conditions on 10, 12, and 14 September were similar to the
the mixing of above-cloud air with high Na likely resulted              conditions described for the case study. South-southeasterly
in droplet nucleation above cloud base, where the median                surface winds were associated with a surface low-pressure
Nc for S2 increased from 169 to 220 cm−3 over ZN = 0.25                 system over Africa. The surface wind speeds varied between

https://doi.org/10.5194/acp-21-4615-2021                                                  Atmos. Chem. Phys., 21, 4615–4635, 2021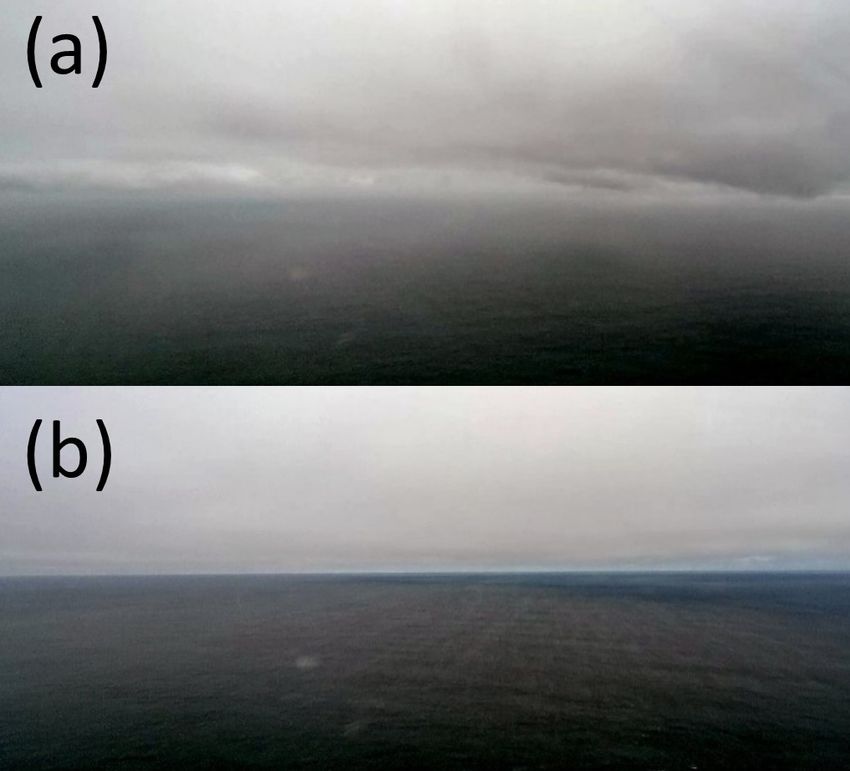
4624                                               S. Gupta et al.: Cloud microphysical properties over the Southeast Atlantic

Table 4. The range of time, latitude, longitude, above-cloud AOD, and cloud-top height (ZT ) for cloud profiles flown during the six flights.
The lowest altitude where above-cloud Na > 500 cm−3 occurred during the flight (Z500 ) is in the far-right column.

                    Date       Time (UTC)      Latitude (◦ S)   Longitude (◦ E)        AOD          ZT (m)     Z500 (m)
                    6 Sep     08:46–12:35         10.2–19.7            9.0–11.9    0.27–0.49     359–1002           680
                    10 Sep    09:09–12:36         14.1–18.7             4.0–8.6    0.21–0.29     990–1201          1800
                    12 Sep    11:16–12:26          9.7–12.9            −0.3–3.0    0.25–0.29    1146–1226          1200
                    14 Sep    09:36–14:16         16.4–18.1             7.5–9.0    0.31–0.32      635–824          2350
                    20 Sep    08:44–13:11         15.7–17.3            8.9–10.5    0.42–0.56      432–636           600
                    25 Sep    10:59–13:51         10.9–14.3             0.8–4.3    0.27–0.38     729–1124          1170

                                                                         Figure 9. Cloud base and top heights for contact (blue) and sepa-
                                                                         rated (red) profiles flown during the six PRFs.

                                                                         AOD > 0.27, and each profile (except from a sawtooth near
Figure 8. Flight tracks from PRFs 5, 7, 8, 9, 11, and 12 flown on        11◦ S, 1◦ E) was classified as a contact profile.
6, 10, 12, 14, 20, and 25 September 2016 with green segments in-
dicating location of cloud profiles (flight tracks from PRFs 7 and 8     4.2   Nc , Re , and LWC for contact and separated profiles
coincide with PRF13 and hence are not visible).
                                                                         Since clouds sampled on different flight days had variable
                                                                         ZB and ZT (Fig. 9), vertical profiles of Nc , Re , and LWC
5 and 10 m s−1 depending on the pressure gradient between                from the contact and separated profiles were compared as a
the continental low and a surface high toward the southwest.             function of ZN . The frequency distributions of Nc , Re , and
A region of 925 mb RH < 60 % persisted along the coast due               LWC as a function of ZN are examined in Fig. 10 using vio-
to dry-air advection from Africa. A different meteorologi-               lin plots (Hintze and Nelson, 1998; Wang et al., 2020), where
cal setup on 20 September had westerly surface winds and                 the width of the shaded area represents the proportion of data
easterly winds at 925 mb. The aerosol plume was sampled                  there. The average Nc for contact profiles was significantly
immediately above the boundary layer (600 m) as warm sur-                higher than the average Nc for separated profiles (differences
face air was overlaid by drier, polluted air from the conti-             of 60 to 68 cm−3 ). During separated profiles, the median Nc
nent. The continental surface low was located farther south              had little variability up to ZN = 0.75 (114 to 122 cm−3 ) and
on 25 September compared to other flight days with the re-               decreased thereafter with ZN to 73 cm−3 due to droplet evap-
gion of low 925 mb RH to the south of the flight track. The              oration (Fig. 10a). During contact profiles, the median Nc
study region had RH > 60 % with south-southeasterly sur-                 decreased slightly up to ZN = 0.25 (183 to 174 cm−3 ), in-
face winds and southerly 925 mb winds. The BBA layer with                creased to 214 cm−3 at ZN = 0.75, and decreased near cloud
above-cloud Na > 500 cm−3 was sampled during each flight                 top to 157 cm−3 due to droplet evaporation. Contact profiles
with variability in its vertical location (Table 4). Only sepa-          had significantly lower Re than the separated profiles (differ-
rated profiles were flown on 10 and 14 September (Table 2),              ences of 1.1 to 1.3 µm), and the median Re increased with
when the BBA layer and cloud tops were separated by over                 ZN from 4.9 to 7.0 µm for contact and from 6.6 to 8.6 µm
600 and 1500 m, respectively (Table 4). On 12 September,                 for separated profiles (Fig. 10b). The differences in Re were
profile 1 (P1) had Na > 500 cm−3 within 75 above cloud tops              likely due to the significantly lower drizzle concentrations for
and was classified as a contact profile, while P2 and S1 were            contact profiles (differences of 5 to 20 L−1 ).
classified as separated profiles. On 20 September, each pro-                The average LWC for contact and separated profiles were
file had above-cloud AOD > 0.4 and was classified as a con-              within 0.01 g m−3 , and the median LWC increased with ZN
tact profile. On 25 September, the profiles had above-cloud              to 0.23 g m−3 at ZN = 0.85 for contact and 0.21 g m−3 at

Atmos. Chem. Phys., 21, 4615–4635, 2021                                                     https://doi.org/10.5194/acp-21-4615-2021
S. Gupta et al.: Cloud microphysical properties over the Southeast Atlantic 4625
Figure 10. Kernel density estimates (indicated by the width of shaded area) and boxplots showing the 25th (Q1), 50th (white point), and
75th (Q3) percentile for (a) Nc , (b) Re , and (c) LWC as a function of ZN for contact (blue) and separated (red) profiles.
ZN = 0.75 for separated profiles (Fig. 10c). Contact pro- buoyancy with atmospheric stability. The critical condition
files had lower LWC / aLWC in the cloud layer (0.45) com- for cloud-top stability is given by Kuo and Schubert (1988)
pared to separated profiles (0.57), which suggests there was as
greater entrainment mixing during contact profiles, on av-
Lv
erage. However, droplet evaporation near cloud top had a 1θe > k 1qT , (1)
stronger impact on separated profiles as the median LWC de- Cp
creased to 0.16 g m−3 for separated and 0.20 g m−3 for con- where k is the CTEI parameter, θe is the equivalent poten-
tact profiles (Fig. 10c). Separated profiles had a greater de- tial temperature, Lv is the latent heat of vaporization, and
crease in LWC / aLWC near cloud top (0.41 to 0.26) com- Cp is the specific heat capacity of air at constant pressure.
pared to contact profiles (0.38 to 0.30) and greater fractional The 1 operator represents gradients across the cloud top,
decreases in median Nc and LWC (40 and 16 %) compared to defined here as the difference between θe (or qT ) measured
contact profiles (25 and 9 %). The stronger impact of droplet 100 m above cloud top and the vertical average of θe (or qT )
evaporation during separated profiles contributed to the dif- over the top 100 m of the profile. Following Eq. (13) from
ferences between Nc for contact and separated profiles. Kuo and Schubert (1988), k > 0.23 indicates negative buoy-
ancy across cloud tops. Water vapor mixing ratio measured
4.3 Cloud-top evaporative cooling by the chilled-mirror hygrometer was used to calculate θe and
qT . Since lower 1qT was sampled during descents into cloud
Buoyancy and humidity across cloud tops were determined due to condensation on the hygrometer, k values for descents
to explore the cloud-top entrainment mechanisms resulting were determined to be measurement artifacts and not usable
in the differential impact of droplet evaporation for these here.
profiles. Cloud-top instability is the dominant source of tur- All separated profiles (except PRF5 S1-3 and S4-1, S4-
bulence in stratocumulus, with evaporative cooling being 3, and S4-5) laid within the region of cloud-top instability
a key driver of instability (Mellado, 2017). Recent studies (k > 0.23) on a 1θe –1qT plane (Fig. 11) and showed neg-
have shown there is strong correlation between above-cloud ative buoyancy across cloud tops. During PRF5 S1-3, low
AOD and water vapor within air masses originating from 1θe was sampled due to higher above-cloud humidity associ-
the African continent (Deaconu et al., 2019; Pistone et al., ated with the presence of Na > 100 cm−3 within 50 m above
2021). Longwave cooling by water vapor within the BBA cloud tops. During PRF5 S4, a weak cloud-top inversion led
layer leads to decreased cloud-top cooling, and cloud-top dy- to positive 1θe and 1qT < −2 g kg−1 (Fig. 7). For the re-
namics are influenced by distinct radiative contributions from maining separated profiles, negative buoyancy across cloud
water vapor and absorbing aerosols. Evaporative cooling in a tops led to forced descent of dry free-tropospheric air into the
mixture of dry and cloudy air near cloud top generates neg- clouds. Since the free-tropospheric air was warmer and drier
atively buoyant air mixtures, which further enhances mix- than the cloudy air, droplet evaporation led to the decreases
ing and leads to an entrainment feedback called cloud top in median Nc and LWC near cloud top. The positive evapo-
entrainment instability, or CTEI (Kuo and Schubert, 1988). rative cooling feedback and greater 1qT compared to con-
Under such conditions, negative buoyancy leads to an unsta- tact profiles (Fig. 11) explain the stronger impact of droplet
ble feedback, unlike the conventional association of negative evaporation on median Nc and LWC for separated profiles.
https://doi.org/10.5194/acp-21-4615-2021 Atmos. Chem. Phys., 21, 4615–4635, 20214626 S. Gupta et al.: Cloud microphysical properties over the Southeast Atlantic
is consistent with BBAs immediately above cloud tops en-
training into the cloud layer and polluting the boundary layer.
This is consistent with higher above-cloud CO (240 ppb)
sampled for contact profiles with below-cloud CO > 100 ppb
compared to above-cloud CO (104 ppb) for profiles with
below-cloud CO < 100 ppb. The correlations between above-
and below-cloud aerosols could be partly due to the his-
tory of entrainment mixing between free-tropospheric and
boundary layer air masses (Diamond et al., 2018). To in-
vestigate the contribution of below-cloud Na relative to the
impact of above-cloud BBAs on cloud properties, 28 con-
tact and 33 separated profiles were classified into four new
regimes defined as follows: contact high Na (C-H), separated
high Na (S-H), contact low Na (C-L), and separated low Na
(S-L), where high- and low-Na boundary layers were sepa-
Figure 11. Difference between equivalent potential temperature
rated using a threshold concentration of 350 cm−3 . Cloud mi-
(θe ) and total water mixing ratio (qT ) measured within cloud and
crophysical properties and above- and below-cloud Na were
100 m above cloud top for contact (blue) and separated (red) pro-
files (only ascents through cloud shown). compared between 20 C-H and 11 S-H profiles and between
8 C-L and 22 S-L profiles (Table 5) to compare contact and
separated profiles with minor differences in below-cloud Na .
While evaporative cooling triggered the CTEI feedback, the Within low-Na boundary layers, C-L and S-L profiles
clouds persisted, consistent with cloud-top radiative cooling had insignificant differences in below-cloud Na despite sig-
or surface evaporation leading to boundary layer moistening nificantly higher above-cloud Na for C-L profiles (differ-
(Lock, 2009; Mellado, 2017). ences of 592 to 669 cm−3 ), higher Nc (differences of 22.8
All contact profiles (except PRF13 S1-3) laid within the to 34.9 cm−3 ), and lower Re (differences of 0.5 to 1.0 µm)
region of cloud-top stability and showed positive buoy- compared to S-L profiles. Within high-Na boundary layers,
ancy across cloud tops. Entrainment mixing for these pro- C-H profiles had significantly higher below-cloud Na com-
files likely occurred when the clouds penetrated the inver- pared to S-H profiles (differences of 39.1 to 70.5 cm−3 ), but
sion. This is consistent with significantly higher average H the differences were much smaller than those in the above-
(267 m) for contact profiles compared to separated profiles cloud Na (differences of 738 to 884 cm−3 ). Further, the C-H
(213 m). Braun et al. (2018) found a negative correlation be- profiles had significantly higher Nc (differences of 75.5 to
tween H and adiabaticity (ratio of the measured and the adi- 88.5 cm−3 ) and lower Re (differences of 1.1 to 1.3 µm) than
abatic liquid water path), which is consistent with contact the S-H profiles. Previous studies have argued the changes in
profiles having lower LWC / aLWC and higher H compared Nc due to the impact of BBAs are more strongly correlated
to separated profiles. In the presence of above-cloud BBAs, with below-cloud Na compared to above-cloud Na (Diamond
the above-cloud air was more humid, and the above-cloud Na et al., 2018; Mardi et al., 2019). However, these results sug-
was significantly higher compared to separated profiles (dif- gest that, although the differences in Nc were lower than the
ferences of 768 to 831 cm−3 ). Contact profiles had greater differences in above-cloud Na , significant changes in Nc and
entrainment mixing compared to separated profiles, and the Re were associated with contact with above-cloud BBAs, and
median Nc increased with height over ZN = 0.25 to 0.75. It these changes were independent of the below-cloud aerosol
is likely the entrainment of BBAs into clouds resulted in ad- loading.
ditional droplet nucleation over these ZN levels. Therefore, Vertical profiles of Nc , Re , and LWC are examined
weaker droplet evaporation near cloud top and additional (Fig. 12) to further investigate the microphysical changes due
droplet nucleation above cloud base in the presence of above- to contact with above-cloud BBAs. Within low-Na bound-
cloud BBAs likely contributed to the differences between Nc ary layers, there were minor deviations in Nc with ZN up to
for contact and separated profiles. ZN = 0.75 (Fig. 12a). Over the top 20 % of the cloud layer,
S-L profiles had a decrease in median Nc (32 cm−3 ), with a
4.4 Nc , Re , and LWC in boundary layers with similar smaller change for C-L profiles (8 cm−3 ) over the same lev-
Na els. There was also a weaker decrease in water vapor mix-
ing ratio across cloud tops for contact profiles. Thus, cloud-
Contact profiles had significantly higher below-cloud Na top entrainment of more humid air likely occurred for the
(differences of 93 to 115 cm−3 ) and below-cloud CO (dif- C-L profiles. This is consistent with higher median Re and
ferences of 13 to 16 ppb) in addition to higher above-cloud LWC over ZN = 0.75 to 0.95 for C-L profiles compared to S-
Na (differences of 768 to 831 cm−3 ) compared to separated L profiles despite having lower Re and LWC closer to cloud
profiles. Enhanced aerosol loading within the boundary layer base (Fig. 12b and c). Thus, the microphysical differences
Atmos. Chem. Phys., 21, 4615–4635, 2021 https://doi.org/10.5194/acp-21-4615-2021S. Gupta et al.: Cloud microphysical properties over the Southeast Atlantic 4627
Table 5. Aerosol and cloud properties were averaged across all contact and separated profiles flown in low-Na and-high Na boundary layers.
These averages were compared between contact and separated profiles. The values listed below represent the 95 % confidence intervals (from
a two-sample t test) when the differences were statistically significant. Positive values indicate the average for contact profiles was higher,
and “insignificant” denotes the differences were statistically insignificant.
Maximum below-cloud Na Below-cloud Na Above-cloud Na Nc Re LWC
(cm−3 ) (cm−3 ) (cm−3 ) (cm−3 ) (µm) (g m−3 )
Low Na (< 300 cm−3 ) −1.3– −26.5 498.0–565.5 Insignificant −0.1– −0.6 Insignificant
High Na (> 300 cm−3 ) 48.3–78.2 746.7–884.3 80.8–92.8 −1.1– −1.3 0.0–0.02
Low Na (< 350 cm−3 ) Insignificant 592.7–669.4 22.8–34.9 −0.3– −0.9 Insignificant
High Na (> 350 cm−3 ) 39.1–70.5 737.8–884.4 75.5–88.4 −1.2– −1.6 0.0–0.02
Figure 12. Boxplots representing vertical profiles of (a) Nc , (b) Re , and (c) LWC as a function of ZN for contact (blue) and separated (red)
profiles within boundary layers with high Na (> 350 cm−3 ) (darker) or low Na (< 350 cm−3 ) (lighter). The number of 1 Hz measurements
within each regime is listed within parentheses.
between contact and separated profiles within low-Na bound- there was a stronger decrease in Nc near cloud top for S-H
ary layers (where most separated profiles were sampled) are profiles (Nc decreased by 66 cm−3 ) compared to C-H pro-
consistent with the processes of cloud-top entrainment and files (Nc decreased by 29 cm−3 ) likely due to cloud-top en-
droplet evaporation. trainment. It is difficult to separate the impact of changes in
The differences between below-cloud Na for C-H profiles droplet nucleation on differences in Nc between C-H and S-
and that for S-H profiles (39.1 to 70.5 cm−3 ) were lower than H profiles from the impact of changes in droplet evaporation
the corresponding differences in Nc (75.5 to 88.4 cm−3 ). C- due to cloud-top entrainment. Therefore, it is speculated the
H profiles had significantly higher Nc and lower Re com- microphysical changes within high-Na boundary layers were
pared to S-H profiles throughout the cloud layer (Fig. 12a likely driven by the combination of higher below-cloud Na ,
and b). There was a significant increase in median Nc for C- potential droplet nucleation above cloud base, and weaker
H profiles over ZN = 0.25 to 0.75, which was accompanied droplet evaporation near cloud tops in the presence of above-
by higher median LWC for C-H profiles in the top half of cloud BBAs. The sensitivity of these results to using different
the cloud layer. This is consistent with additional droplet nu- thresholds to locate BBAs (other than 500 cm−3 ), to define
cleation above cloud base during C-H profiles. Additionally, “separation” between the aerosol and cloud layers (other than
https://doi.org/10.5194/acp-21-4615-2021 Atmos. Chem. Phys., 21, 4615–4635, 20214628 S. Gupta et al.: Cloud microphysical properties over the Southeast Atlantic
100 m), and to define a “high-Na boundary layer” (other than of the underlying cloud layer (Cochrane et al., 2019). Re-
350 cm−3 ) is discussed in Appendix A but does not affect the search is ongoing to quantify precipitation susceptibility as
qualitative findings. a function of the vertical displacement of above-cloud ab-
sorbing aerosols from cloud tops. A larger dataset including
additional ORACLES observations from August 2017 and
5 Discussion October 2018 will allow evaluation of cloud and precipitation
retrievals (Dzambo et al., 2019; Painemal et al., 2020) and in-
The presence of water vapor and absorbing aerosols within vestigations of aerosol–cloud–precipitation interactions over
the BBA layer can have distinct impacts on cloud-top cool- a broader range of environmental conditions. Better under-
ing and cloud-top dynamics (Deaconu et al., 2019; Herbert standing of these processes will help reduce uncertainties
et al., 2020; Kuo and Schubert, 1988). In the presence of in the estimates of cloud radiative effects due to changes in
above-cloud BBAs during ORACLES, the above-cloud air cloud cover and cloud reflectance (Albrecht, 1989; Twomey,
was more humid than in its absence, and cloud-top entrain- 1974, 1991).
ment of free-tropospheric air with a higher water vapor mix-
ing ratio likely contributed to the microphysical differences
between contact and separated profiles, consistent with previ- 6 Conclusions
ous observations (Ackerman et al., 2004). Further, C-H pro-
files had significantly lower drizzle concentration compared This study provides observational evidence of the aerosol in-
to S-H profiles (differences of 4 to 21 L−1 ), but C-L and S-L direct effect on marine stratocumulus cloud properties due
profiles had similar drizzle concentrations (61 and 62 L−1 ). to contact between above-cloud biomass burning aerosols
Research is ongoing to examine the changes in cloud and and stratocumulus cloud tops over the Southeast Atlantic
precipitation properties in different aerosol regimes since Ocean. Biomass burning aerosols overlay marine stratocu-
precipitation suppression could also impact below-cloud Na mulus clouds there with variability in the vertical separa-
through reduced aerosol scavenging by drizzle (Pennypacker tion (0 to 2000 m) between the aerosol layer and cloud tops.
et al., 2020). In situ measurements of cloud and aerosol properties from
Within polluted boundary layers, the below-cloud Na was six research flights during the NASA ORACLES field cam-
larger for instances of contact between above-cloud BBAs paign in September 2016 are presented. These observations
and cloud tops. It is speculated the increase in below-cloud suggest the presence of biomass burning aerosols immedi-
Na alone would be insufficient to cause the microphysical ately above cloud tops was associated with changes in ver-
differences between contact and separated profiles, and this tical profiles of Nc , Re , and LWC due to cloud-top entrain-
is particularly true for polluted boundary layers. The Nc ment and increases in the free-tropospheric temperature and
also depends on other factors, including updraft strength and humidity. Meteorological conditions and the vertical profiles
aerosol composition and hygroscopicity (Fuchs et al., 2018; of Nc , Re , LWC, and above- and below-cloud Na are exam-
Kacarab et al., 2020; Mardi et al., 2019). High-resolution ined for a case study of 6 September 2016. Thinner clouds
modeling studies with bin-resolved microphysics are needed with lower cloud base and top heights were sampled closer to
to examine cloud-top entrainment processes and investi- the coast due to lower relative humidity and boundary layer
gate the relative impact of semidirect and indirect effects height compared to clouds sampled along 9◦ E. For 33 cloud
of BBAs on marine stratocumulus over the Southeast At- profiles, cloud-top entrainment deepened the boundary layer,
lantic. Additionally, aerosol–cloud–precipitation interactions decoupled the stratocumulus layer from the surface, and re-
must be examined under different aerosol and meteorologi- sulted in cumulus formation below the stratocumulus. The
cal regimes to investigate the buffering effects of local mete- vertical profiles of cloud (Nc , Re , and LWC) and thermody-
orology and thermodynamic profiles associated with the ab- namic (qT and T ) properties sampled on 6 September 2016
sorbing aerosols (Deaconu et al., 2019; Diamond et al., 2018; were consistent with observations of stratocumulus-topped
Fuchs et al., 2018; Herbert et al., 2020; Sakaeda et al., 2011; boundary layers capped by an inversion with warm, dry free-
Stevens and Feingold, 2009). tropospheric air above the clouds (Wood, 2012).
The changes in Nc , Re , and drizzle concentration pre- Above-cloud air masses originating from Africa were
sented here could lead to aerosol-induced precipitation sup- composed of biomass burning products (OA, rBC, and CO)
pression and impact stratocumulus-to-cumulus transitions with higher Na compared to above-cloud air masses origi-
over the Southeast Atlantic (Yamaguchi et al., 2015; Zhou nating from the boundary layer over the Southeast Atlantic
et al., 2017). Subsequently, changes in precipitation rate Ocean. Thirty contact profiles were flown, where the level
could affect the balance between aerosol scavenging and en- of Na > 500 cm−3 was within 100 m above cloud tops, and
trainment and modulate the reversible open–closed-cell tran- 41 separated profiles were flown, where Na > 500 cm−3 was
sitions (Abel et al., 2020; Feingold et al., 2015). These pro- sampled at least 100 m above cloud tops. For contact profiles,
cesses would affect the cloud radiative forcing and the di- the average Nc in the cloud layer was up to 68 cm−3 higher,
rect aerosol radiative forcing, which depends on the albedo the average Re was up to 1.3 µm lower, and the average LWC
Atmos. Chem. Phys., 21, 4615–4635, 2021 https://doi.org/10.5194/acp-21-4615-2021You can also read