Impact of urban imperviousness on boundary layer meteorology and air chemistry on a regional scale - Schweizerbart science publishers
←
→
Page content transcription
If your browser does not render page correctly, please read the page content below
B      Meteorol. Z. (Contrib. Atm. Sci.), Vol. 30, No. 4, 349–367 (published online June 28, 2021)
       © 2021 The authors
                                                                                                              Atmospheric Chemistry

Impact of urban imperviousness on boundary layer
meteorology and air chemistry on a regional scale
Joachim Fallmann1,2,3∗ , Marc Barra3 , Vinod Kumar4 and Holger Tost3
1
  South German Climate Office, Institute of Meteorology and Climate Research, Karlsruhe Institute of Technology,
Germany
2
  Institute of Meteorology and Climate Research – Tropospheric Research, Karlsruhe Institute of Technology,
Germany
3
  Institute of Atmospheric Physics, Johannes Gutenberg University Mainz, Germany
4
  Max Planck Institute for Chemistry, Mainz, Germany
(Manuscript received February 1, 2021; in revised form April 20, 2021; accepted April 21, 2021)

             Abstract
             It has been long understood that land cover change from natural to impervious modifies the surface energy
             balance and hence the dynamical properties of the overlying atmosphere. The urban heat island is manifested
             in the formation of an urban boundary layer with distinct thermodynamic features that in turn govern
             transport processes of air pollutants. While many studies already demonstrated the benefits of urban canopy
             models (UCM) for atmospheric modelling, work on the impact on urban air chemistry is scarce. This study
             uses the state-of-the-art coupled chemistry-climate modelling system MECO(n) to assess the impact of the
             COSMO UCM TERRA_URB on the dynamics and gas phase chemistry in the boundary layer of the urban
             agglomeration Rhine-Main in Germany. Comparing the model results to ground observations and satellite
             and ground based remote sensing data, we found that the UCM experiment reduces the bias in temperature
             at the surface and throughout the boundary layer. This is true for ground level NO2 and ozone distribution
             as well. The application of MECO(n) for urban planning purposes is discussed by designing case studies
             representing two projected scenarios in future urban planning – densification of central urban areas and urban
             sprawl. Averaged over the core urban region and 10-days during a heat wave period in July 2018, model
             results indicate a warming of 0.7 K in surface temperature and 0.2 K in air temperature per 10 % increase
             in impervious surface area fraction. Within this period, a 50 % total increase of imperviousness accounts for
             a 3 K and 1 K spatially averaged warming respectively. This change in thermodynamic features results in a
             decrease of surface NO2 concentration by 10–20 % through increased turbulent mixing in areas with highest
             impervious fraction and highest emissions. In the evening and nighttime however, increased densification in
             the urban centre results in amplified canyon blocking, which in turn results in average increase in near surface
             NO2 concentrations of about 10 %, compared to the status quo. This work intends to analyse regional scale
             features of surface-atmosphere interactions in an urban boundary layer and can be seen as preparatory work
             for higher resolution street scale models.
             Keywords: Urban air quality, urban planning, boundary layer, heat wave, regional scale, urban canopy
             parametrization

1 Introduction                                                                (Mueller and Seneviratne, 2012), regionally (Benis-
                                                                              ton et al., 2007; Georgescu et al., 2013; Jones et al.,
Urbanization involves the transfer from natural land into                     2015; Fallmann et al., 2017) and locally (Schau-Nop-
impervious surface, which is manifested by a loss of                          pel et al., 2020), particularly urban dwellers residing
vegetation cover, and natural soil functions. Between                         in large metropolitan areas will be facing increased
2012–2017 global urban impervious cover increased                             danger by intensifying heat waves. Climate change in
from 24.3 % to 25.9 % (Nowak and Greenfield, 2020).                           cities is aggravated by specific urban effects e.g. by heat
In Europe, on average 1.414 % of the total land area was                      trapping caused by the building morphology (Hayhoe
sealed in 2006, while this increased to 1.481 % in 2015.                      et al., 2010; McCarthy et al., 2010; Carvalho et al.,
Sealed area in Germany has been increased from 4.18 %                         2017; Sharma et al., 2019; Schau-Noppel et al., 2020).
in 2006 to 4.31 % in 2015 (UmweltBundesamt, 2019).                            Analysing projections of different development plans
With climate extremes such as hot days or tropical                            for urban areas in North-West Germany, (Strohbach
nights most likely to increase in the future, globally                        et al., 2019) found, that an increase of impervious sur-
                                                                              face area by 55 % would account for an increase of 19 %
                                                                              in surface runoff and a decrease of evaporation of 1 %.
∗ Corresponding author: Joachim Fallmann, Karlsruher Institut für Technolo-
                                                                              In their study, they further stated, that a population in-
gie (KIT), Institut für Meteorologie und Klimaforschung, Postfach 3640,
                                                                              crease in that area by 7 % from 1980 to 2015 resulted
76021 Karlsruhe, Germany, e-mail: joachim.fallmann@kit.edu

                                                                                                                          © 2021 The authors
DOI 10.1127/metz/2021/1075                                    Gebrüder Borntraeger Science Publishers, Stuttgart, www.borntraeger-cramer.com
350               J. Fallmann et al.: Urbanization impact on urban heat and air quality           Meteorol. Z. (Contrib. Atm. Sci.)
                                                                                                                          30, 2021

in an increase of impervious surface area by 34 % in                ring to the maximum value of an urban grid cell with
the same period. The 3-dimensional nature of the ur-                100 × 100 m extracted from downscaled regional cli-
ban canopy involves an increase of the total surface area           mate simulations (Schau-Noppel et al., 2020).
that is sealed and leads to trapping of heat within street              July 2018 serves as reference case for model
canyons. Natural ventilation is hampered and heating                simulations in this work as it represents a particu-
further accelerated. That aspect is amplified during calm           lar dry and hot period. With regard to air qual-
and stationary meteorological conditions, predominately             ity, the critical annual mean value of NO2 , which
found during heat wave periods which are projected to               is relevant for human health (larger than 40 µgm−3
increase in the future (McCarthy et al., 2010; Trimmel              on yearly average) is exceeded at urban measure-
et al., 2021).                                                      ment locations within the study area (Ludwigshafen-
    Assessing the living quality of urban areas however             Heinigstraße: 41 µgm−3 , Mainz-Parcusstraße: 48 µgm−3 ,
involves, next to social, political and economic factors            Koblenz-Hohenfelder Str.: 40 µgm−3 ). During the case
the quality of urban air (Hewitt et al., 2020). Road                study period July, the monthly mean concentrations
transport is one of Europe’s main sources of air pol-               accounted for 40 µgm−3 , 48 µgm−3 and 42 µgm−3 re-
lution (Gonzales-Ortiz, 2019). Hence, NO2 remains                   spectively (Landesamt fuer Umwelt Rheinland
one of the most severe pollutants in European urban ar-             Pfalz, 2018). While µgm−3 is the European standard,
eas (Lorente et al., 2019), causing danger to human                 for model evaluation and experiments, all concentra-
health directly (Achakulwisut et al., 2019) or via sec-             tions will be expressed in parts per billion (bbb), using a
ondary production of ozone, particulates or acid rain               conversion factor 1 ppb = 1.88 µg m−3 (DEFRA, 2005).
(Kelly, 2019). Left alone emission control itself, the              Two scenarios of expected urban developments are ex-
residence time of pollutants within an urban entity is              ecuted, using the state-of-the-art coupled chemistry-
governed by its morphology. (Xie et al., 2005). Build-              climate modelling system MECO(n) (Kerkweg and
ings act as roughness elements, absorbing momentum                  Jöckel, 2011; Hofmann et al., 2012; Kerkweg and
and reduce the turbulent intensity of the airflow. In the           Jöckel, 2012; Mertens et al., 2016) at high reso-
distinct urban roughness sub-layer, atmospheric turbu-              lution, coupled to the COSMO-CLM urban canopy
lence breaks down and the effective transport velocity              parametrization (Wouters et al., 2016b). The latter is an
scale is reduced. Hence, the transport and vertical dilu-           urban upgrade of the standard soil module of COSMO-
tion of pollutants emitted at the surface is hampered and           CLM TERRA (Grasselt et al., 2008) originally used
resistance time inside the canyon is increased.                     in MECO(n). Mesoscale meteorology has been evalu-
    The impact of urban boundary layer dynamics on air              ated for MECO(n) by (Hofmann et al., 2012), while
pollution levels however is further controlled by ther-             (Mertens et al., 2016), provided a chemical evalu-
mally driven flows arising from changes in the sur-                 ation for ozone on a European domain. COSMO-
face properties, e.g. when heat mitigation strategies al-           CLM/TERRA_URB is already evaluated for other cities
ter surface sensible heat fluxes (Makar et al., 2006;               (e.g. Berlin (Trusilova et al., 2016)) but to the authors
El-Ghazouani et al., 2019). As such, surface cooling,               knowledge it has not been applied to regional or ur-
e.g. by using reflective coatings or green infrastructure           ban air quality investigations. Due to its low computa-
can have adverse effects on air quality through alteration          tional extra cost, following results from Trusilova et al.
of lower atmosphere dynamics, including reduced ver-                (2016) TERRA_URB is recommended for simulating
tical mixing and a lower boundary layer depth (Fall-                surface to boundary interactions on a regional scale.
mann et al., 2017; Sharma et al., 2019). In turn, desta-                The manuscript is structured as followed. First, the
bilization of urban air over intense urban heat islands             model setup is explained based on the selection of the
lead to local formation of convective boundary layers               case study period, model domain and configuration of
which can result in a near surface reduction of the total           the dynamical setup and chemical mechanisms used.
mass of air pollutants (Leukauf et al., 2016).                      A detailed evaluation of MECO(n) with regard to me-
    With increasing population, the compact city ap-                teorology and air quality for both surface and bound-
proach has gained global impact in order to allow for               ary layer follows. In the next chapter, two urban plan-
sustainable urban growth. Positively that strategy coun-            ning scenarios are compared in terms of temperature and
teracts negative effects arising from extensive land con-           NO2 concentration followed by a discussion. Address-
sumption by urban sprawl. On the negative side, denser              ing model results, the suitability of the term urban heat
and compact city structures provide a threat to natural             island for assessing heat mitigation strategies in urban
urban spaces (Haaland and van den Bosch, 2015).                     areas is analysed referring to (Martilli et al., 2020) in
This study intends to contrast both scenarios, urban                the appendix.
compaction and urban sprawl based on their impact on
urban heat and air pollution during heat wave conditions
for the densely populated central European metropoli-               2 Model and methods
tan area Rhine-Main. Recent studies indicate that the               2.1 Study area and meteorological conditions
number of hot days (with daily maximum air tempera-
ture exceeding 30 °C) is projected to increase from 21              During stationary weather conditions, with weak syn-
(1971–2000) to 27 (2031–2060) in that area – refer-                 optic forcing, urban heat islands are most pronounced,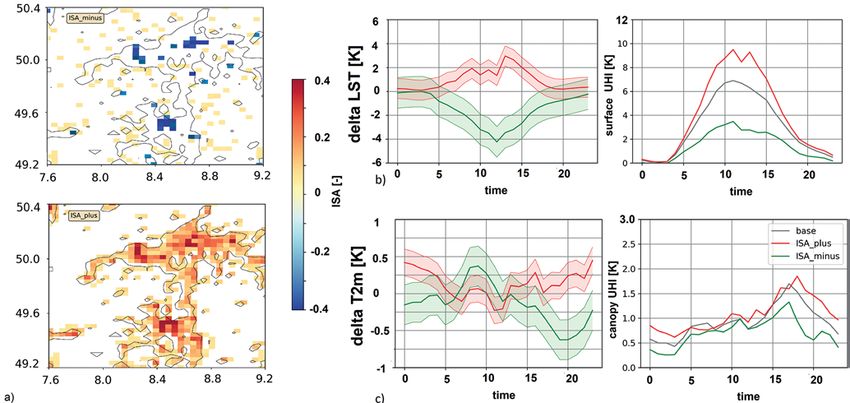
Meteorol. Z. (Contrib. Atm. Sci.)               J. Fallmann et al.: Urbanization impact on urban heat and air quality             351
30, 2021

Figure 1: Time series of 2 m temperature observed in the urban cen-
tre (U) and the urban background (BG). Threshold for hot days (HD)
and tropical nights (TN) are marked in black and grey dotted.

especially at night. In these conditions, differences in
imperviousness lead to small differences of the en-
ergy balance, modifying the thermodynamic structure
of the urban boundary layer. The Frankfurt Rhine-Main
metropolitan area (abbreviated FRM) approximately
covers an area of about 14800 km2 and shares a popula-
tion of about 5.2 million people. The main urban centres
that are in the focus of this study are the capital cities
of Rhineland-Palatinate (Mainz) and of Hessian (Wies-
                                                                      Figure 2: CM_3 domain (3 km) embedded in extracted area of the
baden), the city of Frankfurt in the East and the urban
                                                                      CM_40 domain (40 km) showing ISA (impervious surface area).
agglomeration Mannheim, Heidelberg, Ludwigshafen to                   Coloured boxes indicate areas relevant for text and Figure A.1 in
the South. According to Corine land use classification                the appendix.
2018 (Buettner, 2004) the percentage of areas classi-
fied as either continuous, discontinuous urban fabric or
industrial and commercial account for 70 %, averaged
over the municipal areas of the above-mentioned places.               2.2 Model setup
With annual exceeding air quality standards of NO2 , this
area suffers from high air pollution and climate change               For this study we applied the MECO(n) (MESSy-
additionally aggravates the well-being of urban dwellers              fied ECHAM and COSMO models nested n times)
(Schau-Noppel et al., 2020).                                          model system (Kerkweg and Jöckel, 2012a; Jöckel
    In the first half of July 2018, dry and continen-                 et al., 2016; Mertens et al., 2016). MECO(n) per-
tal air masses reached the FRM-area from Eastern Eu-                  forms a one-way (the coarse domain provides bound-
rope and favoured the onset of a stable high-pressure                 ary conditions to next smaller) online coupling (every
system. In the second half of that month, the synop-                  time step of the coarser/driving model instance) be-
tic patterns changed to advection of humid and warm                   tween the global earth system model EMAC (Jöckel
air masses from the South-West reaching the continent.                et al., 2010) and the non-hydrostatic regional cli-
The monthly mean precipitation of 35 l/m2 measured for                mate model COSMO-CLM/MESSy (Kerkweg and
Rhineland-Palatinate was 50 % lower than the climato-                 Jöckel, 2012a). COSMO-CLM itself is coupled on-
logical mean for July. Referring to long term measure-                line to the next smaller COSMO instance. COSMO-
ments of the German Weather Service, with 21 °C, the                  CLM (COSMO model in Climate Mode version 5.0)
mean July temperature in Rhineland Palatinate was well                is the community model of the German regional cli-
above the climatological mean (1961–1990) of 17 °C                    mate research community jointly further developed by
(https://www.ipa.uni-mainz.de/juli-2018/). For the rea-               the CLM-Community (COSMO-CLM, Rockel et al.,
son of representativeness, this value is calculated from a            2008)
background station and therefore masks temperature ex-                    A detailed explanation and schematic overview of the
tremes emerging in urban areas. With regard to observa-               MECO(n) system is provided by Kerkweg and Jöckel
tions in the city centre of Mainz, monthly mean air tem-              (2012a) and Kerkweg and Jöckel (2012b). Here, we
perature amounts to 24.6 °C. Regarding observations in                apply the model in a MECO(2) configuration, consisting
the urban background (located west to the campus of the               of one global EMAC instance and two high-resolution
University Mainz (Fig. 1)) only 4 days in July 2018 are               COSMO instances CM_40 (40 km) and CM_3 (3 km).
not to be counted as summer days, with T max > 25 °C.                 The EMAC instance is used as the driving model, i.e.
That sums up to 27 summer days and 11 hot days                        generating initial and boundary conditions, for CM_40,
(T max > 30 °C). No precipitation was recorded until mid              which is the driving model for CM_3 respectively. The
of July. 21 hot days have been recorded at an urban mea-              domains are depicted in Fig. 2. The (one-way) online
surement station Mainz.                                               coupling between instances is performed at every step of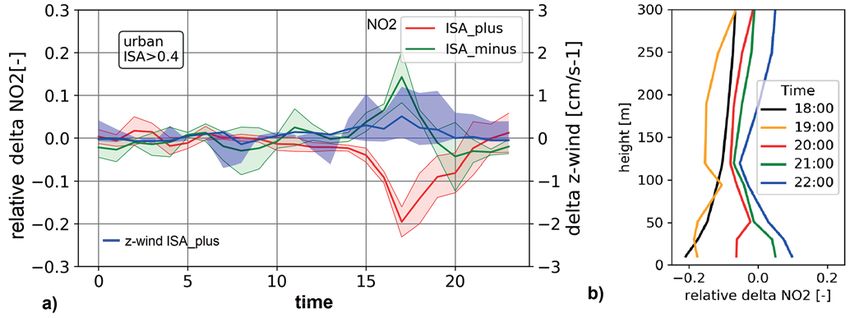
352                 J. Fallmann et al.: Urbanization impact on urban heat and air quality          Meteorol. Z. (Contrib. Atm. Sci.)
                                                                                                                           30, 2021

Table 1: Configuration of the Base models within the MESSy system. For EMAC and both MECO instances CM_40 and CM_3 use the
same MESSy configuration.

 Submodules     EMAC        CM_40      CM_3      Description                                    Reference
 AEROPT         x                               Aerosol optical Properties                      (Dietmüller et al., 2016)
 AIRSEA         x           x          x        Air sea exchange                                (Pozzer et al., 2006)
 CLOUD          x                               Cloud processes                                 (Roeckner et al., 2006)
 CLOUDOPT       x                               Cloud optical properties                        Dietmüller et al. (2016)
 CONVECT        x           x                   Convection parameterisation                     (Tost et al., 2006)
 CVTRANS        x           x                   Convective tracer transport                     (Tost et al., 2010)
 DDEP           x           x          x        Dry deposition processes                        (Kerkweg and Jöckel, 2012a)
 E5VDIFF        x                               ECHAM vertical Diffusion
 EC2COSMO       x                               ECHAM5 fields for COSMO coupling                (Kerkweg and Jöckel, 2012a,b)
 GMXE           x           x          x        Aerosol Thermodynamics and Microphysics         (Pringle et al., 2010)
 JVAL           x           x          x        Photolysis rates of chemical tracers            (Landgraf and Crutzen, 1998)
 LNOX           x                               Lightning NOx production                        (Jöckel et al., 2006)
 MECCA          x           x          x        Gas-phase chemistry                             (Pozzer et al., 2006;
                                                                                                Sander et al., 2011)
 MMD            x           x          x         Coupling and multi model driver                Kerkweg and Jöckel (2012b);
                                                                                                Kerkweg et al. (2018)
 MSBM           x           x          x        Stratospheric multi-phase chemistry             Jöckel et al. (2010)
 OFFEMIS        x           x          x        Offline emissions of trace gases and aerosols   Kerkweg and Jöckel (2012a)
 ONEMIS         x           x          x        Online calculated emissions                     Kerkweg and Jöckel (2012a)
 ORBIT          x           x          x        Earth Orbit Calculations                        (Dietmüller et al., 2016)
 OROGW          x                               Orographic gravity wave drag                    (Roeckner et al., 2006)
 QBO            x                               Assimilation of QBO zonal wind observations
 RAD            x                               Radiative transfer calculations                 Dietmüller (2016)
 SCAV           x           x          x        Scavenging and wet deposition of aerosols and   Tost et al. (2006a)
                                                gas phase tracers
 SEDI           x           x          x        Sedimentation of aerosols                       (Jöckel et al., 2006)
 SURFACE        x                               Surface properties                              Jöckel et al. (2016)
 TREXP          x                               Tracer release experiment                       Jöckel et al. (2010)
 TROPOP         x           x          x        Diagnostic calculation of troposphere height    (Jöckel et al., 2006)

the driving model. Consequently, a high temporal reso-                processes in the EMAC instance is based on the RC1-
lution of boundary conditions for the COSMO/MESSy                     aero-06 configuration of (Jöckel et al., 2016). For the
instances is achieved. Coupling intervals of 12 minutes               CM_3 instance, the deep convection parameterisation
for CM_40 and 4 min for CM_3, are useful to investigate               is disabled, assuming the grid spacing of about 3 km
short term changes, e.g. of short lived chemical tracers,             is fine enough to resolve convection related processes
in the MECO domains as it provides a consistent set of                reasonably well.
boundary conditions.                                                      Anthropogenic emissions are prescribed by monthly
    The EMAC instance is configured to have a truncated               mean values. For EMAC and CM_40 we apply the
T106 horizontal resolution resulting in a gaussian grid               50 km MACCity emissions (Lamarque et al., 2010)
spacing of about 1.125°. The vertical discretisation con-             from the RCP8.5 scenario for the year 2010. For
sists of 31 pressure hybrid levels in the ECMWF config-               the CM_3 domain 7 × 7 km TNO-MACCIII emissions
uration.                                                              (Kuenen et al., 2014) for the year 2011–2014 are used.
    The CM_40 domain consists of a 138 × 128 grid with                In order to account for temporal characteristics of emis-
a horizontal grid spacing of 0.44° and a vertical reso-               sions, time profiles are applied using MACC-II hourly
lution of 50 pressure levels up to 20 hPa. The vertical               emission factors for traffic emissions in the CM_3 do-
resolution increases with height with 13 levels from the              main.
ground up to 1000 m, with level mid-points being [10 m,                   The selected gas phase mechanism, mim1-CCMI-
30 m, 51 m, 94 m, 119 m, 189 m, 249 m, 318 m, 407 m,                  base2, considers the basic reaction cycles of ozone,
517 m, 652 m, 801 m, 965 m] and 10 m being the lowest                 methane and odd nitrogen as well as alkanes and alkenes
level. The CM_3 domain consists of 200 × 200 grid cells               up to C4. For the chemistry of isoprene the Mainz
with a spacing of 0.03° and the same vertical resolution              Isoprene Mechanism (MIM1) (Pöschl et al., 2000) is
of 50 pressure hybrid levels.                                         added. For a comprehensive description of the mecha-
    The MESSy configuration of the different instances                nism we refer to (Jöckel et al., 2006) and its electronic
is presented in Table 1. The selection of submodules and              supplement.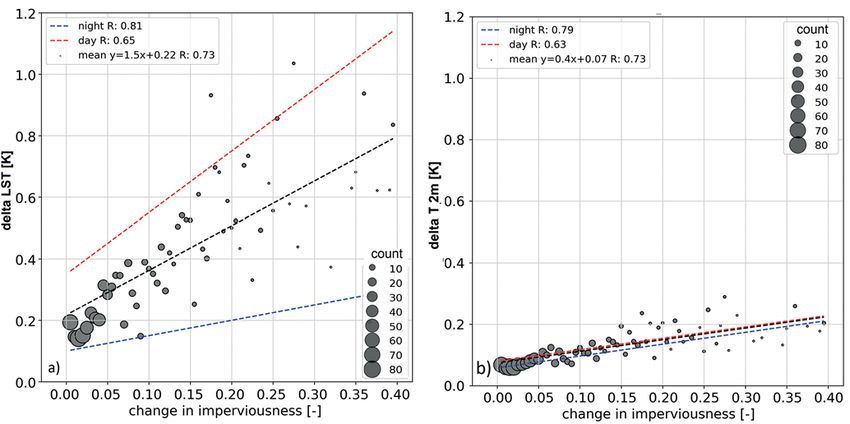
Meteorol. Z. (Contrib. Atm. Sci.)         J. Fallmann et al.: Urbanization impact on urban heat and air quality               353
30, 2021

2.3 Functionality and configuration of                         Table 2: Overview of the experiments/scenarios performed in this
    TERRA_URB                                                  analysis.

The urban canopy parametrization within MECO(n)                 Experiment     Model     Comment
is achieved via the urban-canopy land-surface scheme            BASE           CM_3      Reference Simulation with the full
TERRA_URB (Schulz et al., 2016; Wouters et al.,                                          TERRA_URB parameterisation
2016b) which basically includes urban physics in the            NO_URB                   without special URB parametrisation,
COSMO(-CLM) model (Steppeler et al., 2003; Roeck-                                        only TERRA
ner et al., 2006) by modifying the surface module               ISA_plus                 increased ISA in urban areas representing
TERRA-ML (Schulz et al., 2016; Schulz and Vogel,                                         a densification of urban areas
2020) and the corresponding land atmosphere interac-            ISA_minus                decreased ISA in city centers and
tions. TERRA_URB consists of the bulk representation                                     increased ISA in the surroundings
of the urban canopy (Demuzere et al., 2008; De Rid-
der et al., 2012). The original version of CCLM in             ric with z0 and z0 h being the aerodynamic and thermal
MECO(n) has a standard representation of urban land            roughness lengths. This ‘Bluff-body’ thermal roughness
by modifying soil and vegetation parameters in the Soil-       length parameterisation follows the approaches given in
Vegetation-Atmosphere Transfer model TERRA (Doms,              Brutsaert (1982), Kanda et al. (2007) and Demuzere
2011). It does however not resolve specific urban fea-         et al. (2008). A new bare soil evaporation resistance for-
tures, such as shadowing effects or thermal and radia-         mulation (Schulz et al., 2015) is included next to the
tive properties of building materials and street canyons.      vegetation skin temperature parametrization of Schulz
While sub-grid scale surface heterogeneity was orig-           et al. (2015) and Viterbo and Beljaars (1995). In our
inally ignored in TERRA_ML, a poor man’s tile ap-              study we take parameters for albedo, emissivity, heat ca-
proach is applied within TERRA_URB, allowing urban             pacity and heat conductivity and aerodynamic roughness
and natural tiles to co-exist within one grid cell. Total      length following Wouters et al. (2015b) and Wouters
grid-cell fluxes from the surface into the boundary layer      et al. (2016a). Other than in NO_URB, evaporation
thus represent an average from urban and natural land          from urban surfaces is taken into account and impervi-
according to their respective fraction. The percentage         ous water storage is based on a density distribution of
of impervious surface area in one grid cell is calculated      water puddles (Wouters et al., 2015a). TERRA_URB
from a 10 data-set for Europe (Maucha et al., 2010).         has already been tested both offline and online for
The variation of natural land in the remaining natural         many cities around the world (Wouters et al., 2015b;
tiles is controlled over the variables PLCMN (minimum          Wouters et al., 2016b; Demuzere et al., 2017) includ-
plant cover) and PLCMX (maximum plant cover).                  ing Toulouse, Basel, Singapore, Vienna, Turin, and ur-
    The urban morphology is defined via building area          ban areas in Belgium.
fraction (BF), mean building height (H) and height-
to-width ratio (H/W). The latter is used to calculate          2.4 Experiments and simulations
the sky view factor. The urban scheme hence provides
corrections of the surface parameters within TERRA             By switching on the option lterra=.True., various urban
and integrates road, roof and wall surfaces into a             specific parametrizations are considered and activated
2D horizontal surface for which radiative and thermody-        in TERRA-ML, modifying (near-) surface temperature
namic properties are adapted according to the 3D struc-        values, surface variables and heat fluxes. Consequently,
ture of the urban canopy. This is done through the             the UCM reduces the grid cell latent heat flux and in-
semi-empirical urban canopy dependency parametrisa-            creases the sensible part with respect to its impervious
tion SURY (Wouters et al., 2016a), while the three-            fraction, which is particularly true at nighttime (com-
dimensional urban canopy information is translated via         pare Fig. 5). Assessing the impact of TERRA_URB on
bulk parameters following Wouters et al. (2016a) and           MECO(n)-output variables, an urban setup (BASE) can
Trusilova et al. (2016). Default central Europe specific       be compared to a non-urban configuration (NO_URB)
urban canopy parameters are defined as input for SURY          with lterra=.False. By modifying various surface pa-
according to Loridan and Grimmond (2012) and given             rameters within SURY, sensitivity tests can be per-
as output to TERRA_URB (Table A.1).                            formed representing dedicated urban planning scenar-
    The surface layer transfer coefficients for momen-         ios. In this study, the experiments ISA_plus (densifi-
tum and heat are determined in a non-iterative way             cation) and ISA_minus (urban sprawl), which are both
(Wouters et al., 2012). Urban land cover has a spe-            variations of BASE, are compared. More details are
cific thermal inertia (Demuzere et al., 2008), rough-          given in Chapter 3.4. Table 2 presents an overview of
ness length, albedo and emissivity (Sarkar and Ridder,         the performed simulations
2011; Wouters et al., 2013; Demuzere et al., 2017)
and accounts for surface layer stability and the rough-        3 Results and discussion
ness sub-layer. Besides that, it considers a non-iterative
surface layer flux kB−1 = ln(z0 /z0 h ) parametrization        In order to assess the functionality and evaluate the
in the surface-layer transfer scheme for the urban fab-        added value of the urban canopy model TERRA_URB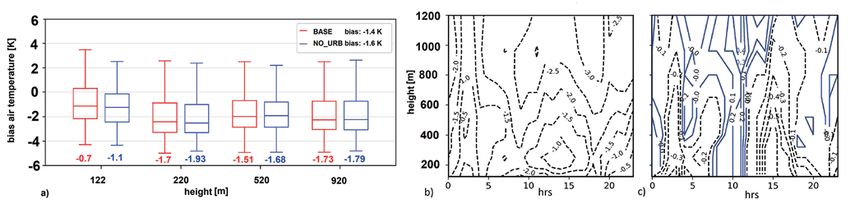
354                 J. Fallmann et al.: Urbanization impact on urban heat and air quality                   Meteorol. Z. (Contrib. Atm. Sci.)
                                                                                                                                    30, 2021

Table 3: Evaluation for station Mainz-Mombach (OBS) for grid cell value (marked black in Fig. 3b) of the simulation including
TERRA_URB (BASE) and TERRA_URB switched off (NO_URB) showing absolute values and biases averaged over the model period
July 1–10 2018. Bold values indicate the lowest bias of the respective setup BASE or NO_URB.

                        2m                  10 m              10 m wind          2 m relative       surface ozone           surface Nox
                    temperature          windspeed          diection [deg]      humidity [%]            [ppb]                  [ppb]
                       [°C]                [ms−2 ]
                    day     night     day       night      day      night       day         night    day       night      day        night
BASE               23.80    17.10     2.94      2.08       181       134       43.60        61.02   51.20      38.60      7.18       10.57
NO_URB             22.90    16.50     2.98      2.11       183       126       47.69        64.58   50.40      36.80      8.00       11.10
OBS                25.05    17.69     2.05      1.20       200       200       39.21        56.31   46.97      41.81      8.71       10.11
BASE_bias          −1.25    −0.59     0.89      0.87       −24       −66       4.39          4.70    4.23      −3.21     −1.53        0.46
NO_URB_bias        −2.15    −1.19     0.93      0.90       −22       −74       8.49          8.27    3.43      −5.01     −0.91        0.99

Figure 3: Land surface temperature (LST) retrieved from MODIS TERRA for 1 July 2018 21:15 UTC (a) and equivalent model time step
for BASE (b) and NO_URB (c). Note the red and black boxes in (b) indicating the locations of measurement stations for further analysis.

for meteorological and air chemical simulations with                  time, we expect the coupled simulation BASE improv-
MECO(n), we compare surface, air temperature and                      ing the representation of the surface urban heat island
NO2 observations, with air temperature being analysed                 compared to the uncoupled NO_URB run.
over the boundary layer as well. Other variables such as
wind speed, wind direction, relative humidity and ozone               3.2 Evaluation of temperature and NO2
are analysed statistically (Table 3).
                                                                      Urban background stations for 6 selected medium sized
                                                                      urban areas inside CM_3 (green circles in Fig. 2)
3.1 Evaluation of surface temperature                                 have been compared for 2 m air temperature (Fig. 4a).
                                                                      Further statistics have been calculated with regard to
The land surface temperature (LST) product from                       wind speed, wind direction, relative humidity, ozone
MODIS-TERRA is retrieved from the catalogue of satel-                 and nitrogen oxides (Table 3) at the urban background
lite products (earthexplorer.gov) and resampled to the                measurement location Mainz-Mombach (blue box in
model resolution of 3 km (Fig. 3a). Being 95 % cloud                  Fig. 3b).
free, we select 1 July 2018 21:15 UTC and extracted the                  The model in general underestimates 2 m air temper-
region around the Rhine-Main metropolitan area (con-                  ature, with the mean bias averaged over 10 days and
tour in Fig. 3). White areas in Fig. 3a display cloud                 6 urban (Table A.2) background stations with 0.8 K for
pixels. According to observation, the maximum differ-                 BASE and with 1.6 K for NO_URB respectively. Due
ence between the temperature of an urban (inside con-                 to slight shifts in timing, some values in the box plot
tours) and a rural grid cell (outside contours) amounts               (Fig. 4a) reach −4/+4 K but can be seen as outliers. Al-
to 7.7 K. The contour line encloses an area with an im-               though the night-time mean bias for NO2 is slightly in-
pervious fraction higher than 30 %. The mean urban land               creased for BASE compared to NO_URB (see also Ta-
surface temperature (LST_U) inside that line accounts                 ble 3), the 95 percentiles of NO2 concentration (dots in
for 292.4 K. Maximum recorded temperature amounts                     Fig. 4b) are more correctly represented at least for some
to 293.3 K respectively. In comparison, model output                  areas by the simulation including TERRA_URB. For the
from the BASE run underestimates maximum LST_U                        single station Mainz-Mombach, the relative bias in peak
by 0.5 K and mean LST_U by 0.4 K (Fig. 3b). With                      concentration is decreased from 0.25 (NO_URB) to 0.18
1.5 K and 1.3 K, the underestimation however is signif-               (BASE).
icantly increased when switching off the urban canopy                    Analysing four meteorological variables, i.e., 2 m air
model in NO_URB (Fig. 3c). For this specific date and                 temperature, 10 m wind speed, wind direction and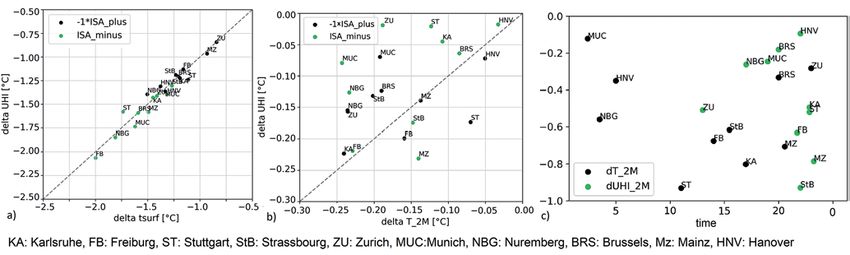
Meteorol. Z. (Contrib. Atm. Sci.)               J. Fallmann et al.: Urbanization impact on urban heat and air quality             355
30, 2021

Figure 4: Hourly 2 m air temperature for 1–10 July 2018 for 6 selected urban background stations (Table A.2) (a) and hourly surface NO2
concentration with dots representing 95 interval of maximum concentrations (b) comparing the BASE (red) and the NO_URB experiment
(blue).

Figure 5: Mean diurnal cycle averaged over the model period 1–10 July 2018 for station Mainz-Mombach and respective grid cell (marked
black in Fig. 3b) for 2 m temperature [°C] (a) and NO2 [ppb] (b), with red color being BASE and blue color NO_URB. Dashed black lines
represent observations at Mainz-Mombach. Error bars and grey shading show hourly standard deviation over 10 days for OBS and model
respectively. Diurnal mean sensible (solid) and latent (dashed) heat flux [W/m2 ] shown in (c).

2 m relative humidity, averaged over 1–10 July 2018 for              background station Mainz-Mombach. With a decrease
day (0700–2100) and night (2100–0700) we find mean                   of the mean bias in 2 m temperature (Fig. 5a) averaged
biases improved for both periods for all variables ex-               over the model period 1–10 July from −1.27 (BASE)
cept for wind direction (bold letters in Table 3). For               to −1.76 K (NO_URB), most of the bias reduction can
secondary pollutants NOx and ozone, we find lower bi-                be accounted to night-time and late evening where the
ases for the NO_URB configuration during the day, with               diurnal profile of BASE is shifted closer towards the ob-
the latter most likely to be explained by lower NOx bi-              served value. Single Buildings are not represented but
ases as both pollutants are chemically linked. Due to the            parameterized within TERRA_URB. Following Mus-
coarse resolution of the model grid and the emission                 setti et al. (2020), it is hypothesized that heat storage in
data set, only urban background stations are adequate                building materials and increased trapping of longwave
for model-observation comparison in an urban context.                radiation in street canyons and release of surface sensi-
With the measurement station Mainz-Mombach, offi-                    ble heat at the ground and from the building surfaces acts
cially classified as an urban background station we eval-            as heat source for the lowest model layer both at day and
uate the model comparing hourly mean values averaged                 night-time. The introduction of building effects in BASE
over 10 days model time. For the comparison, we use the              considers a sky view factor, which hampers radiative
grid cell that has the closest distance to the geographical          cooling at night-time. In combination with the reduced
location of the measurement point. Hence, the model is               evaporative cooling, an increase of roughness length
not able to capture the local flow conditions at the ex-             from 4.8 m (NO_URB) to 6.1 (BASE), heat storage in
act measurement location but rather represents a back-               building walls and roofs and an anthropogenic heat flux,
ground meteorology. With absolute differences between                a central urban grid cell in BASE shows decreased la-
day and night being in the same order, simulated diur-               tent heat flux and a reduced sensible heat loss at evening
nal averages are about two times higher than observed                and night-time compared to NO_URB (Fig. 5c). With an
ones. Wind speed is generally very low at that location              impervious surface area fraction of 0.48, the respective
and time.                                                            grid cell is considered as suburb-like, with still a signifi-
    In order to get a more detailed picture on the diur-             cant amount of natural vegetation. The temperature bias
nal cycle of temperature and NO2 , diurnal mean val-                 reduction is in the same order as reported for the urban
ues are calculated from the model output for the urban               area of Berlin by Trusilova et al. (2016).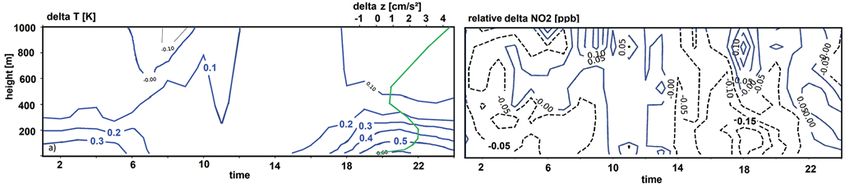
356                 J. Fallmann et al.: Urbanization impact on urban heat and air quality              Meteorol. Z. (Contrib. Atm. Sci.)
                                                                                                                               30, 2021

Figure 6: Boxplots of temperature biases BASE-OBS_RAD (red) and NO_URB-OBS_RAD (blue) (red colour rectangle in Fig. 3b)
observed temperature for four different heights (a) as well as hovmoller time-height plots showing biases BASE-OBS_RAD (dashed) (b) and
the difference of the two model biases (BASE-OBS_RAD)−(NO_URB-OBS_RAD) (c). Negative values indicate a bias reduction (dashed)
when using TERRA_URB, positive values an increase (blue).

    In addition, we find a simultaneous bias reduction                between both biases [BASE-OBS_RAD]−[NO_URB-
of NO2 from 0.98 to 0.2 ppb, accounting for a rela-                   OBS_RAD], with negative vales indicating a lower bias
tive bias reduction from 0.31 to 0.23 (Fig. 5b). While                on the side of BASE. Following the diurnal evolution
both configurations BASE and NO_URB fail to capture                   of the boundary layer, the largest impact of the urban
the diurnal cycle, especially with regard to the morn-                canopy and TERRA_URB respectively on the thermal
ing peak, the evening and nigh-time reduction leads                   structure of the urban boundary layer is noticed around
to an average improvement of the representation of an                 15:00 hrs with −0.7 K up to approximately 400 m to
urban background location. It has to be noted, that a                 about −0.2 around 1000 m. At evening and night-time,
model with coarse resolution is hardly able to account                that bias is reduced to −0.3 to −0.1 for the heights 200
for small-scale features and can not necessarily be used              to 400 m respectively. From Fig. 6b,c it can be con-
for local air quality assessment. The selection of the                cluded, that the impact of the urban layer on the over-
measurement station is another point that has to be ad-               lying atmosphere reaches up to about 1000 m in the af-
dressed critically. The comparison with a central urban               ternoon and between 200 to 600 m in the evening and
station showed a large underestimation as local sources               night-time. These results are well in line with findings
where not accounted for. Therefore, the only valid sta-               for Berlin (Geiss et al., 2017) or for Budapest (Emeis
tion in the area of interest was Mainz-Mombach, which                 and Schäfer, 2006). It has to be noted however, that the
is officially classified as ‘urban background’, and best              quality of the radiometer observations is not assessed.
represents background air quality in that area. Hence,                    The findings from this section are well consistent
the prevailing local conditions at the station were not               with other studies. In terms of NOx , (Sarrat et al.,
considered.                                                           2006) using the MESONH atmospheric model (Lafore
    The impact of the UCM throughout the urban                        et al., 1997) coupled with the urban canopy model TEB,
boundary layer is assessed comparing vertical tempera-                shows that during night-time, the surface NOx and ozone
ture information for the model levels with ground based               concentrations over Paris are better reproduced when an
remote sensing data (OBS_RAD) retrieved from the                      urban scheme is used. This is because the boundary layer
passive micro wave radiometer from the Environmen-                    stays near neutral over the city, and is relatively deep
tal Agency at roof level (30 m) (location marked red in               (Masson, 2006; Demuzere et al., 2017).
Fig. 3b). Due to the technical functionality, values below
120 m height are not recorded in the radiometer mea-                  3.3 Sensitivity of urban canopy
surement. Fig. 6a shows box plots for a model period of                   parametrization to imperviousness
10 days evaluated for four different heights within the
urban boundary layer. Averaged over the entire column                 Difference plots between BASE and NO_URB for the
(represented by these four heights) we find a mean bias               predefined area (urban agglomeration Mainz, Frank-
of −1.4 K for BASE and −1.63 K for NO_URB respec-                     furt, Mannheim) of the model domain show the im-
tively. The highest difference in model bias exists for               pact of the urban canopy parametrization on the sur-
the lowest height (122 m), while the impact of the ur-                face temperature, air temperature and NO2 concentra-
ban canopy model on the thermal properties of the ur-                 tion. With central urban grid cells (ISA>0.4) sticking
ban boundary layer decreases with height confirmed by                 out particularly at daytime with regard to surface tem-
decreasing differences in the biases between BASE and                 perature (7b), the largest feedback of building structures
NO_URB (Fig. 6a). In the course of the day, we find the               on air temperatures can be found for night-time periods
highest underestimations of the BASE run during day-                  2100–0600 UTC. Stored in building materials during the
time with values from −1 K (120 m to 400 m) to −2.5 K                 day, energy is released into a stably stratified night-time
(>800 m). The night-time bias is lower from 120 m                     urban boundary layer, followed by local heating of ur-
to 800 m (Fig. 6b). Fig. 6c shows the differences                     ban air within the respective grid cells (Fig. 7f). Due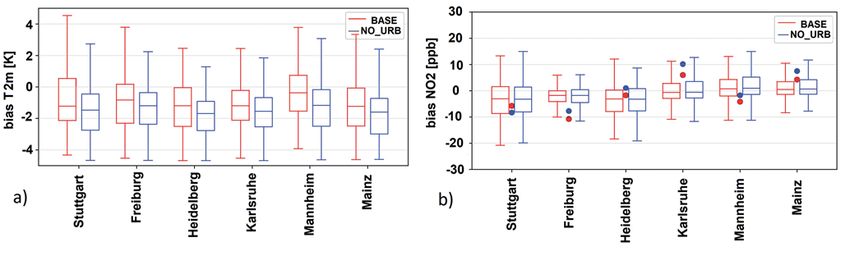
Meteorol. Z. (Contrib. Atm. Sci.)                J. Fallmann et al.: Urbanization impact on urban heat and air quality                357
30, 2021

Figure 7: Mean bias BASE-NO_URB extracted for CM_3 for the Rhine-Main urban area and surrounding for surface tempera-
ture (LST) (a–c), 2 m air temperature (T2m) (d–f) and NO2 (ppb) (g–i). Means over the model period 1–10 July 2018 (a,d,g), the daytime
(07–21 UTC) in b, e, h and night-time (22–06 UTC) in c, f, i. Bold black contour lines indicate central urban area (threshold ISA>=0.3) and
light contour urban background (0.1>ISA>0.3). Black box in 7a represents urban area discussed in Fig. 9.

to weak mean wind, the effect on 2 m air temperature                   each interval. For each grid cell, the difference between
is locally limited to the urban grid cells, correlating to             BASE and NO_URB is calculated and averaged over the
the spatial patterns of surface temperature change in 7b.              respective class cluster. With respect to Fig. 8a,b we find
Maximum difference between urban and rural surface                     a positive correlation between imperviousness and tem-
temperature – namely surface urban heat island amounts                 perature change, with the impact of TERRA_URB in-
to 6.3 K at around 1400 UTC and to 2.1 K with re-                      creasing with increasing ISA. The impact on NO2 near
spect to the canopy UHI, represented by 2 m air tem-                   the surface in Fig. 8c is anti-correlated to ISA, indi-
perature at 2200 UTC. Both values are calculated from                  cating the effect of more intense vertical mixing due
the mean over the model period. Maximum grid cell ur-                  to increased vertical fluxes from surfaces with higher
ban canopy effects account for 4.8 K (surface tempera-                 temperature (Fig. 8a). As indicator for increased ver-
ture) and 1.7 K (air temperature), respectively. Near sur-             tical fluxes, we added the difference in z-wind com-
face NO2 concentrations, during the day are reduced by                 ponent over the boundary layer in Fig. 9a. It becomes
a factor of −0.20 (−20 %).                                             obvious from Fig. 8a,b that higher absolute differences
    The impact of TERRA_URB coupling on model                          are to be expected for daytime with regard to surface-
variables for various degree of surface sealing is tested              and for night-time for air temperature. NO2 concentra-
on the basis of the correlation between impervious sur-                tions are presented for daytime (time with highest emis-
face area and change in thermal or chemical state of the               sions) only as no correlation is to be found for night-
lower urban boundary layer, represented by surface and                 time (Fig. 8c). Aiming for a more detailed analysis of
air temperature (absolute) and NO2 (fractional reduc-                  the inter-dependencies between surface NO2 concentra-
tion), respectively.                                                   tion and both ISA and NOx emission flux we zoom into
    All grid cells in the model domain over a predefined               the Rhine-Main urban area (Fig. 8d–e).
threshold of ISA>0.1 (10 % impervious) are grouped                         In the three city clusters (8d,e) Frankfurt (F), Mainz
into 30 classes with 2 % intervals. The size of the re-                (Mz) and Mannheim/Ludwigshafen (Ma) with dots rep-
spective scatter indicates the number of members within                resenting grid cells with an impervious fraction >0.4,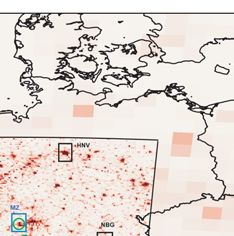
358                 J. Fallmann et al.: Urbanization impact on urban heat and air quality               Meteorol. Z. (Contrib. Atm. Sci.)
                                                                                                                                30, 2021

Figure 8: Correlation between impervious surface (ISA>0.1) and model biases BASE-NO_URB for surface temperature (a) 2 m air
temperature (b) and NO2 (c) at the respective urban grid cells. Scatter plots presented for mean values over 1–10 July 2018, sizes of
dots represent the number of grid cells within one class of bin width 0.01. Regression lines for daytime mean (07–21 UTC) in red and for
night-time (22–06 UTC) in blue. A zoom to the Rhine-Main urban area is shown in Fig. 8d,e with underlying NOx MACCIII emissions in
gray and blue shaded dots presenting the mean bias BASE-NO_URB. Sizes indicate the impervious surface fraction (d) and red shaded dots
showing the mean bias only considering the upper 95 percentile of NO2 concentration representing the daytime emission peaks (e). Location
of scatter in (d, e) indicate three city clusters Mainz (Mz), Frankfurt (F) and Mannheim (Ma)

daily mean NO2 near-surface concentration is decreased                    In Summary that means, that the way, the urban
by −0.15 (−15 %) (8d). The largest relative impact how-               canopy is represented in the model, governs the dy-
ever is not concentrated in the area with highest emission            namical exchange in the urban boundary layer. In av-
fluxes, but for grid cells with highest impervious frac-              erage, using TERRA_URB results in a relative decrease
tion. While mean values sometimes mask short time, lo-                of NO2 . During morning and evening traffic peaks how-
calised effects, the 95th percentile of the simulated NO2             ever, the changed urban morphology from NO_URB to
concentrations, coinciding with the daytime traffic peaks             BASE results in a temporary blocking and relative in-
shows a temporary increase of surface NO2 concentra-                  crease of NO2 .
tion (8e). This can be explained by the emission of NOx                   Hovmoller difference plots for temperature and NO2
into a changed urban morphology within TERRA_URB,                     (Fig. 9) and the vertical profile for the vertical wind com-
represented by mean roof heights and building widths.                 ponent (blue line in 9a) indicate that surface warming
Again, the highest relative increase of up to 0.5 (+50 %)             (Fig. 7) triggers enhanced vertical mixing over the ur-
is to be found at grid cells with highest impervious                  banized region (box in Fig. 7a). Unless in reality fluctu-
fraction. Hypothetically, two additional effects happen               ations of the ascending and descending tendencies vary
here, next to mechanical shear introduced by roughness                significantly between different time steps, the average
elements. Firstly, increased heating rates in the morn-               over the model period showed a clear tendency. Pol-
ing hours slow down, affecting internal boundary layer                lutants emitted during daytime, are consequently dis-
growth and more pollutants accumulate in the internal                 tributed to higher levels (9b). Hence near surface NO2
boundary layer, before it penetrates the residual bound-              levels are decreased by about −0.2. With −0.15 (−15 %)
ary layer aloft. Secondly, weak wind conditions lead to               reduction, the modifications in surface energy balance
the fact, that residual heat and pollutants present in the            are still noticeable at about 300 m height (Fig. 9b).
upper layers mix down. Detecting these small conver-                  The vertical transport of pollutants from the ground
gences within the urban boundary however is hard to                   to higher levels above the urban canopy is indicated
detect at a model resolution of 3 km.                                 by an NO2 surplus aloft. Warming plumes emerge in
Meteorol. Z. (Contrib. Atm. Sci.) J. Fallmann et al.: Urbanization impact on urban heat and air quality 359
30, 2021
Figure 9: Hovmoller diagrams for air temperature [K] absolute (a) and NO2 concentration [fraction] relative difference (b) of BASE-
NO_URB averaged over the urban area of Mainz/Frankfurt as indicated by bold contour (ISA>=0.3) in Fig. 7 presented as hourly means
over the model period 1–10 July 2018. Blue contour indicate an increase, dashed lines a decreasing trend. Green line indicate a profile of
the difference in z-wind component averaged of all days at 2000 hrs.
the BASE simulation, only due to the representation a decentralization of urban space with an increase in the
of the urban canopy by TERRA_URB in the time be- closest rural surrounding at the simultaneous decrease in
tween 1700–0700 UTC (Fig. 9a). They lead to a sur- the urban centres. The experiment is realized, decreas-
plus of 0.1–0.4 K and a decrease in NO2 levels of up to ing the impervious fraction in the core urban grid cells
−0.30 (−30 %). by 30 % and increasing the impervious fraction by 80 %
A slightly reversed tendency occurs between 0800 for the grid cells in close vicinity where ISA is in the
and 1200 hrs, with a relative increase reaching up range of [0.1,0.3] in the BASE simulation (10a, top).
to +5 %. Here, denser building structures introduced The extracted area of interest (10a) consists of
by the UCM lead to trapping of NO2 originating from 289 grid cells with 43 accounting for an impervious sur-
morning emissions. face area fraction ISA>0.3. The highest value in that
These kinds of model systems are hardly capable of area according to the ISA-dataset (Mauch, G., G. Büt-
capturing short time and localized effects. In order to tner and B. Kosztra, 2010) amounts to 0.78. Fig. 10
draw general conclusions on the interplay between ur- analyses the scenarios’ (ISA_minus, ISA_plus) impact
ban morphology, dynamics and air chemistry, we fo- on surface temperature (10b) and air temperature (10c)
cussed on mean values only, unless they might not be and urban heat island with respect to the areas depicted
adequate for snapshots. In terms of relative reductions, in Fig. 10a averaged over grid cells with an impervious
we only look at the differences between the two model surface area fraction of ISA>0.4. The urban heat island
runs BASE und NO_URB, neglecting the results from for surface and air temperature is calculated as differ-
the evaluation and the problems of the model to prop- ence between the mean over all urban grid cells with
erly represent the observed diurnal cycle. ISA >0.4 and the mean of all rural cells with ISA0.4), ISA_plus considers an increase of during the day, leads to a 0.5 K increase in air tempera-
impervious surface area fraction per grid cell by 50 % ture aloft, during night-time. At solar noon, a major part
(10a, bottom), which is equivalent to a 50 % decrease of of the incoming energy is stored in the building materi-
natural land cover in the same cell. ISA_minus considers als. That can explain the slight decrease during the day360 J. Fallmann et al.: Urbanization impact on urban heat and air quality Meteorol. Z. (Contrib. Atm. Sci.)
30, 2021
Figure 10: Change in impervious surface area presented as difference ISA_minus-BASE, ISA_plus-BASE (a) extracted for the Rhine-Main
urban area and mean difference in surface temperature (delta LST) and surface urban heat island (b) and 2 m air temperature and canopy
heat island (c) with delta ISA_plus-BASE (red), delta ISA_minus-BASE (green) and BASE (gray). For UHI calculation, urban area covers
all grid cell within box in Fig. 7a with the criterion ISA[0.4,1.0] and rural grid cells include all grid cells with ISA[0,0.01] in the same box.
(Fig. 10c, left, red). These results are in line with recent compared to BASE. This translates to an average in-
findings from satellite observations for the urban area of crease of 2 m air temperature of 0.2 K in a densified
Boston (Chang et al., 2021). built-up environment and a decrease of 0.3 K for a
Air temperature in urban grid cells with tiles largely greener, more open canopy. While surface temperature
converted from urban to natural (vegetation) slightly in- urban heat island is increased from 3.1 to 4.1 K for
creases in the morning compared to BASE, as broader ISA_plus, a decrease from 3.1 to 1.5 is simulated for
urban canyons allow the flat-angle incoming radiation ISA_minus. Air temperature urban heat island is pro-
to enter the urban canopy and warm the surrounding air jected to increase from 0.9 to 1.1 for ISA_plus and de-
masses. Shadowing effects in the model are considered crease from 0.9 to 0.7 for ISA_minus respectively. Tech-
via the sky view factor, which is calculated by the re- nically, the UHI intensity is retrieved from the difference
lation between building height and road width. Reduc- between mean grid cell value for areas with ISA[0.4;0.1]
ing the imperviousness in ISA_minus considers a higher and rural areas with ISA[0;0.1].
percentage of natural, open space per grid cell and a re- Varying the impervious surface fraction for ISA_plus
duced contribution of the sky view factor to the over- we can assess the sensitivity of temperature change on
all grid cell mean value. In the evening and night-time, change in imperviousness (Fig. 11). First, the change
evaporative cooling of natural tiles comes into play and of imperviousness from ISA_plus to BASE is cal-
lead to relative cooling of urban air. Differences with culated per grid cell. These absolute differences are
regard to canopy urban heat island (Fig. 10c – right) then grouped according to their membership in one of
are most pronounced during evening and night-time for 80 classes of 0.01 width. Sizes of points indicate the
ISA_plus increasing by about 0.4 K. ISA_minus simu- number of grid cells in the respective group. The dif-
lates a maximum decrease of −0.6 K around 2000 UTC. ference in impervious fraction is correlated to the differ-
Between 2000 to 2200 UTC the gradient is reversed ence in surface temperature (Fig. 11a) and air tempera-
(Fig. 10c right, green) as grid cells in the rural surround- ture (Fig. 11b) in the respective group. All grid cells with
ing with a relative increase in impervious surface frac- difference in impervious surface area higher than 0.395
tion due to urban sprawl effects (10a, top) hampering are grouped in the last class accounting for 10 grid cells
the evaporative cooling performance of neighbouring ru- out of 768 in total. These calculations are done for the
ral grid cells. Except between 1200 and 1300 UTC, the Rhine-Main area as depicted in Fig. 7.
canopy UHI (calculated from 2 m air temperature) is de- Fig. 11a shows a linear correlation between change
creased for ISA_minus for the entire model period. The in imperviousness through densification and change in
increase in ISA_plus is limited to evening, night-time surface temperature (LST) of R = 0.73, with a projected
and noon. Surface temperature averaged over model temperature increase of about of 0.17 K per 10 % in-
period and core urban area is increased by 1.1 K for crease in imperviousness. With R = 0.81, the highest
ISA_plus and decreased by 1.5 Kelvin for ISA_minus sensitivity of surface temperature towards surface mod-Meteorol. Z. (Contrib. Atm. Sci.) J. Fallmann et al.: Urbanization impact on urban heat and air quality 361
30, 2021
Figure 11: Sensitivity of surface (LST) (a) and air temperature (T2 m) change (b) towards change of impervious surface area fraction for
the urban area (bold contour in Fig. 8) when applying the scenario ISA_PLUS. Change in temperature shown for average over model period
1–10 July 2018 (black), daytime (red) and night-time (blue). Sizes of dots indicating the number of grid cells lying within ISA class of 0.01
width.
ification is found at night-time (R = 0.81), however with ues represent an upward directed motion inside a denser
a less steep slope. Obtaining an R-value of 0.59, the and warmer urban environment. That aspect causes the
daytime increase amounts to about 0.2 K per 10 % in- dilution of NO2 via vertical turbulence. Z-wind differ-
crease respectively. On the other hand, with regard to ences for ISA_minus are pointing in the opposite direc-
air temperature the increase is less than about 0.05 K tion (not shown).
per 10 % for all times of the day. From Fig. 11 it can During evening and night-time however, vertical pro-
be hypothesized that the urban air warms at a maxi- files averaged over the core urban area (bold contour in
mum rate of 0.2 K per 0.8 K increase in surface temper- Fig. 7a) show a relative increase in near surface NO2
ature. Fig. 11 underlines findings from (Martilli et al., concentrations between 21:00–22:00 hrs by about 10 %
2020) regarding the use of the term ‘urban heat island’ for the difference ISA_plus – BASE (Fig. 12b). With
for assessing heat mitigation potentials for climate sen- the impact of vertical mixing indicated by the blue line
sitive urban planning strategies such as urban greening. in Fig. 12a diminishing in the evening, the blocking fea-
In their study, they suggest using urban heat levels in- ture of a denser urban canopy in ISA_plus compared to
stead, in particular when considering air temperatures. BASE comes into play, leading to a relative increase of
In the appendix Figure A.1 we have therefore included NO2 at the surface by about 10 %. This increase is high-
findings from our simulation which confirm (Martilli est at the surface and noticeable up to about 120 m.
et al., 2020) with regard to a more detailed analysis of Assessing urban air quality necessarily needs to in-
10 urban regions (boxes in Fig. 2). volve other pollutants as well. Tropospheric ozone at
Averaged over all urban grid cells with ISA>0.4 high concentrations near the surface for instance is a
(as defined in the BASE simulation) and model pe- danger to human health particularly at daytime during
riod, dynamical effects in the urban boundary layer heat wave episodes. Model results indicate that over-
force the relative decrease (red) and increase (green) all ozone concentrations are particularly high during
in near surface (10 m) NO2 levels for both scenarios the case study period. In denser urban canopies within
(Fig. 12). Being more or less in the same order (+/−20 % ISA_plus, elevated near surface levels are simulated, due
maximum change), the largest impact focusses on the to excess heat and decreasing NO2 concentration. That
time of the second emission peak from about 1500 to aspect however is only valid for the evening time, when
2000 UTC. Where air pollutants are released into a ozone levels already drop. With a mean relative decrease
warmer (ISA_plus) or colder (ISA_minus) and less dy- of surface urban NO2 concentration of about 15–20 %,
namic urban air – relative to BASE. ozone levels increase by about 4–5 % in average. Simi-
The blue line in Fig. 12 indicates the diurnal mean lar numbers have been found by other studies looking at
difference in z-wind component in the urban canopy covid19 NOx emission reduction (e.g. Amouei Torkma-
layer (15 m), for the scenario ISA_plus. Positive val- halleh et al., 2021; Mertens et al., 2021) A more in362 J. Fallmann et al.: Urbanization impact on urban heat and air quality Meteorol. Z. (Contrib. Atm. Sci.)
30, 2021
Figure 12: Diurnal mean of relative change in NO2 presented as difference ISA_minus-BASE (green), ISA_plus-BASE (red) extracted for
the Rhine-Main urban area (a) (bold contour in Fig. 7a) Blue line displays difference in vertical velocity between ISA_plus and BASE at the
lowest model level, Shading indicates hourly variation for the 10 day model period. Daily mean over 5 simulated hours of vertical profiles
for the difference ISA_plus-BASE (averaged over bold contour of Fig. 7a) for the lowest 7 model levels (b) indicating the evening/night-time
blocking in a denser urban canyon.
depth study of this aspect is not part of that paper, but and observation shows the benefits of TERRA_URB,
needs to be considered in future perspectives. The inter- being limited to this time period, model domain and
action between dynamics and air chemistry as presented setup particularly. In the vertical, we notice an impact of
in this chapter is in line with other studies in that field the urban canopy up to a height of about 1000 m within
(e.g. Sarrat et al., 2006; Lai and Cheng, 2009; Fall- the daytime urban boundary layer and between 200 and
mann et al., 2016; Yuan et al., 2018) 400 m at night, which is in line with observations for
other cities. Bias reduction is larger at night-time, be-
cause TERRA_URB improves the formulation of the
4 Conclusions urban energy balance – particularly with regard to a re-
duced sensible heat loss at night. The sensitivity analysis
Results from that study show that a sophisticated rep- showed, that the impact of TERRA_URB is most pro-
resentation of the urban canopy reduces the mean bi- nounced for high imperviousness, with maximum dif-
ases for air temperature and NO2 concentration between ferences of 1.5 K for surface and 0.6 K for air tempera-
urban background point observations and model grid ture respectively when comparing an urbanized (BASE)
cell for the episode 1–10 July 2018. These assumptions and a configuration without explicit urban parametrisa-
are validated using a state-of-the art chemistry-climate tion scheme.
model, coupled to the urban canopy parametrization The model setup allows for further sensitivity exper-
TERRA_URB. As such, sensitivity tests were per- iments including projected pathways of future urban de-
formed, comparing simulations with (BASE) and with- velopment in the breadth of increasing population. The
out (NO_URB) specific canopy parametrization. difference between a densified and an open space urban
Spatially, the simulation of the surface urban heat is- landscape is well manifested in the dynamics and chem-
land in the model area Frankfurt-Rhein-Main (FRM) for ical properties of the urban boundary layer (0–1000 m).
a selected day and time (4 July 2018 21:15) was im- Simulations show a difference in diurnal mean temper-
proved when using TERRA_URB as compared to satel- ature up to 1.5 K at the surface with effects notable up
lite observation. Adding radiometer measurements, we to approximately 300 m with still about 0.3 K. This ex-
conclude, that the implementation of an urban canopy cess of heat at the surface leads to modified dynamics
parametrization influences surface variables with regard in the urban boundary layer and triggers upward motion
to both dynamic and chemical aspects as well as urban of urban air due to vertical turbulent mixing. This up-
boundary layer properties on a regional scale. Due to a ward motion results in a decrease of daily mean NO2
coarse resolution of the model and the underlying emis- concentration from 10–30 %. Vertical transport of pollu-
sion data set, the system is not able to account for lo- tants within the urban boundary layer leads to a gen-
cal scale features in an urban environment. The mean eral decrease over the entire lowermost urban atmo-
meteorological and air chemical conditions for an urban spheric column (0–500 m). Above that level, we find that
background however were simulated with lower biases the impact of surface modifications are less pronounced
as if no urban canopy model was used. Yet, the general and background effects due to advection from the sur-
bias reduction in temperature and NO2 between model rounding are present. Surface to boundary layer cou-You can also read