Interchange Comparison Safety Tool User Guide - PUBLICATION NO. FHWA-HRT-23-041 MARCH 2023
←
→
Page content transcription
If your browser does not render page correctly, please read the page content below

Interchange Comparison Safety Tool
User Guide

PUBLICATION NO. FHWA-HRT-23-041           MARCH 2023

Research, Development, and Technology
Turner-Fairbank Highway Research Center
6300 Georgetown Pike
McLean, VA 22101-2296
FOREWORD

The Highway Safety Manual has made predictive safety analysis feasible for many basic
roadway elements, including freeway and ramp segments and ramp terminals. This capability
raises the expectation for predicting the safety performance of more complex roadway facilities,
such as interchanges. Although interchanges can be decomposed into basic road elements, the
safety performance of interchanges cannot be derived by simply adding predictions from
individual components.

The Federal Highway Administration (FHWA) supported a project to explore planning-level
analysis of interchange configurations during alternatives analysis or Interchange Access
Requests (IARs). FHWA sought to identify the most commonly considered configurations in
IARs and develop a predictive model and implementation tool. The purpose of this predictive
model and associated implementation tool is to use an approach with more robust considerations
than a single crash modification factor and provide reliable predictions using information
commonly known during interchange project planning. This tool can be used to evaluate the
predicted crash frequency and severity for interchange configurations under consideration using
basic inputs for the entire interchange area.

This user guide assists safety professionals in applying the predictive methodology and using the
accompanying implementation tool. This guide provides details on applying the predictive
method to an interchange area and how that fits into the context of the overall interchange
influence area. Additionally, this user guide details where the predictive method is applicable
and the required inputs and supporting calculations. Finally, this guide provides instructions on
using the spreadsheet implementation tool and interpreting the spreadsheet inputs and outputs.

                                              Brian P. Cronin, P.E.
                                              Director, Office of Safety and Operations
                                                 Research and Development

                                              Notice
This document is disseminated under the sponsorship of the U.S. Department of Transportation
(USDOT) in the interest of information exchange. The U.S. Government assumes no liability for
the use of the information contained in this document.

The U.S. Government does not endorse products or manufacturers. Trademarks or
manufacturers’ names appear in this report only because they are considered essential to the
objective of the document.

                                  Quality Assurance Statement
The Federal Highway Administration (FHWA) provides high-quality information to serve
Government, industry, and the public in a manner that promotes public understanding. Standards
and policies are used to ensure and maximize the quality, objectivity, utility, and integrity of its
information. FHWA periodically reviews quality issues and adjusts its programs and processes to
ensure continuous quality improvement.
TECHNICAL REPORT DOCUMENTATION PAGE

1. Report No.               2. Government Accession No.             3. Recipient’s Catalog No.
FHWA-HRT-23-041
4. Title and Subtitle                                           5. Report Date
Interchange Comparison Safety Tool User Guide                   March 2023
                                                                6. Performing Organization Code:

7. Author(s)                                                       8. Performing Organization Report No.
Scott Himes (ORCID: 0000-0003-2932-7691), Samantha
Arnold (ORCID: 0000-0002-7642-3937), Vikash Gayah
(ORCID: 0000-0002-0648-3360), and Ginny O’Connor
(ORCID: 0000-0002-4668-6832)
9. Performing Organization Name and Address                        10. Work Unit No.
VHB
940 Main Campus Drive                                              11. Contract or Grant No.
Suite 500                                                          DTFH6116D00040
Raleigh, NC 27606
12. Sponsoring Agency Name and Address                             13. Type of Report and Period Covered
Office of Safety and Operations Research and Development           User Manual;
Federal Highway Administration                                     September 2020–November 2022
6300 Georgetown Pike                                               14. Sponsoring Agency Code
McLean, VA 22101-2296                                              HRSO-10
15. Supplementary Notes
The contract manager for this project was Wei Zhang (HRSO-10; ORCID: 0000-0002-5175-7527). The technical
advisory committee included Mark Doctor, Jeff Shaw, Tim Taylor, and Dave Petrucci.
16. Abstract
This user guide is intended for use alongside the Federal Highway Administration (FHWA) report Safety
Comparisons Between Interchange Types (forthcoming) and the spreadsheet tool FHWA Interchange
Configuration Safety Comparison Tool.(1,2) This user guide provides an overview of the data needs and workflow
for using the spreadsheet tool. Additionally, it provides information on the interchange configurations for which
this tool can be used and the ranges of characteristics to which it applies. Further, this guide provides an overview
for finding results within the tool.
17. Key Words                                            18. Distribution Statement
Interchange, configuration, safety, crash prediction, No restrictions. This document is available to the public
predictive model, safety comparison tool,                through the National Technical Information Service,
spreadsheet tool                                         Springfield, VA 22161.
                                                         https://www.ntis.gov
19. Security Classif. (of this report) 20. Security Classif. (of this page)      21. No. of Pages     22. Price
Unclassified                            Unclassified                             22                   N/A
Form DOT F 1700.7 (8-72)                                                  Reproduction of completed pages authorized.
SI* (MODERN METRIC) CONVERSION FACTORS
                       APPROXIMATE CONVERSIONS TO SI UNITS
Symbol             When You Know                         Multiply By              To Find                         Symbol
                                                           LENGTH
in                 inches                                      25.4               millimeters                     mm
ft                 feet                                         0.305             meters                          m
yd                 yards                                        0.914             meters                          m
mi                 miles                                        1.61              kilometers                      km
                                                             AREA
in2                square inches                              645.2               square millimeters              mm2
ft2                square feet                                  0.093             square meters                   m2
yd2                square yard                                  0.836             square meters                   m2
ac                 acres                                        0.405             hectares                        ha
mi2                square miles                                 2.59              square kilometers               km2
                                                           VOLUME
fl oz              fluid ounces                               29.57               milliliters                     mL
gal                gallons                                     3.785              liters                          L
ft3                cubic feet                                  0.028              cubic meters                    m3
yd3                cubic yards                                 0.765              cubic meters                    m3
                                     NOTE: volumes greater than 1,000 L shall be shown in m3
                                                             MASS
oz                 ounces                                      28.35              grams                           g
lb                 pounds                                       0.454             kilograms                       kg
T                  short tons (2,000 lb)                        0.907             megagrams (or “metric ton”)     Mg (or “t”)
                                            TEMPERATURE (exact degrees)
                                                            5 (F-32)/9
°F                 Fahrenheit                                                     Celsius                         °C
                                                           or (F-32)/1.8
                                                       ILLUMINATION
fc                 foot-candles                                10.76              lux                             lx
fl                 foot-Lamberts                                3.426             candela/m2                      cd/m2
                                           FORCE and PRESSURE or STRESS
lbf                poundforce                                    4.45             newtons                         N
lbf/in2            poundforce per square inch                    6.89             kilopascals                     kPa
                      APPROXIMATE CONVERSIONS FROM SI UNITS
Symbol             When You Know                         Multiply By              To Find                         Symbol
                                                           LENGTH
mm                 millimeters                                 0.039              inches                          in
m                  meters                                      3.28               feet                            ft
m                  meters                                      1.09               yards                           yd
km                 kilometers                                  0.621              miles                           mi
                                                             AREA
mm2                square millimeters                          0.0016             square inches                   in2
m2                 square meters                              10.764              square feet                     ft2
m2                 square meters                               1.195              square yards                    yd2
ha                 hectares                                    2.47               acres                           ac
km2                square kilometers                           0.386              square miles                    mi2
                                                           VOLUME
mL                 milliliters                                 0.034              fluid ounces                    fl oz
L                  liters                                      0.264              gallons                         gal
m3                 cubic meters                               35.314              cubic feet                      ft3
m3                 cubic meters                                1.307              cubic yards                     yd3
                                                             MASS
g                  grams                                       0.035              ounces                          oz
kg                 kilograms                                   2.202              pounds                          lb
Mg (or “t”)        megagrams (or “metric ton”)                 1.103              short tons (2,000 lb)           T
                                            TEMPERATURE (exact degrees)
°C                 Celsius                                   1.8C+32              Fahrenheit                      °F
                                                       ILLUMINATION
lx                 lux                                         0.0929             foot-candles                    fc
cd/m2              candela/m2                                  0.2919             foot-Lamberts                   fl
                                           FORCE and PRESSURE or STRESS
N                    newtons                                       2.225             poundforce                      lbf
kPa                  kilopascals                                   0.145             poundforce per square inch      lbf/in2
*SI is the symbol for International System of Units. Appropriate rounding should be made to comply with Section 4 of ASTM E380.
(Revised March 2003)

                                                                ii
TABLE OF CONTENTS
CHAPTER 1. INTRODUCTION ................................................................................................. 1
Objective ..................................................................................................................................... 1
Background ................................................................................................................................. 1
Purpose and Structure of the Guide ......................................................................................... 1
CHAPTER 2. APPLICABILITY.................................................................................................. 3
Interchange Function ................................................................................................................. 3
Interchange Configuration ........................................................................................................ 3
Single Roundabout Interchanges .............................................................................................. 3
Parclo Configurations ............................................................................................................... 3
Not Valid for Spreadsheet Analysis ......................................................................................... 4
Interchange Influence and Interchange Areas ........................................................................ 5
Crash Severities Analyzed ......................................................................................................... 6
CHAPTER 3. SPREADSHEET INSTRUCTIONS..................................................................... 7
Workflow .................................................................................................................................... 7
Step 1: Read Welcome and Instructions Worksheets ............................................................. 7
Step 2: Complete Input Tables.................................................................................................. 8
Interchange Configurations ...................................................................................................... 8
Area Type ................................................................................................................................. 9
Traffic Volumes ....................................................................................................................... 9
Freeway Characteristics ......................................................................................................... 10
Crossroad Characteristics ....................................................................................................... 11
Step 3: Interpret the Outputs .................................................................................................. 14
Calibration .............................................................................................................................. 16
Additional Guidance on Predictive Method ........................................................................... 16
REFERENCES ............................................................................................................................. 17
iiiLIST OF FIGURES
Figure 1. Graphic. Interchange configurations included in the spreadsheet tool. ............................ 4
Figure 2. Graphic. Study interchange area definition.(3) .................................................................. 5
Figure 3. Screenshot. Spreadsheet workflow.(2) ............................................................................... 7
Figure 4. Screenshot. Spreadsheet field coding.(2) ........................................................................... 8
Figure 5. Illustration. Nearest interchange gore distance. .............................................................. 10
Figure 6. Illustration. Intersection skew calculation. ..................................................................... 11
Figure 7. Illustration. Example interchange spreadsheet inputs..................................................... 12
Figure 8. Screenshot. User input from PDO worksheet.(2) ............................................................. 14
Figure 9. Screenshot. Applicability section.(2) ............................................................................... 14
Figure 10. Screenshot. Model output from PDO worksheet.(2) ...................................................... 15
Figure 11. Graph. Total crash frequency from Charts worksheet.(2) .............................................. 15
Figure 12. Screenshot. SDF model output.(2) ................................................................................. 16
LIST OF TABLES
Table 1. Parclo spreadsheet input summary. .................................................................................... 9
Table 2. Required area type inputs. .................................................................................................. 9
Table 3. Summary of required traffic volume inputs. ...................................................................... 9
Table 4. Summary of freeway lane information inputs. ................................................................. 11
Table 5. Summary of crossroad characteristic inputs. ................................................................... 13
ivLIST OF ABBREVIATIONS
A incapacitating injury
AADT annual average daily traffic
B non-incapacitating injury
C possible injury
CI confidence interval
COV coefficient of variation
DDI diverging diamond interchange
FHWA Federal Highway Administration
HOV high-occupancy vehicle
HSM Highway Safety Manual
K fatal
KA fatal and serious injury
KABC fatal and injury crash categories
KABCO injury classification scale
LT left turn
Parclo partial cloverleaf
PDO property damage only
SDF severity distribution function
SPDI single-point diamond interchange
TDI tight diamond interchange
VPD vehicles per day
XR crossroad
vCHAPTER 1. INTRODUCTION
OBJECTIVE
This user guide is intended as a companion to the Federal Highway Administration (FHWA)
report Safety Comparisons Between Interchange Types (herein referred to as “report”) and the
spreadsheet tool FHWA Interchange Configuration Safety Comparison Tool (herein referred to as
“spreadsheet tool”).(1,2) The report contains all of the background research, modeling details, and
supplementary information. All calculations can be performed within the spreadsheet tool.
BACKGROUND
The research project aimed to develop a planning-level safety assessment tool and interchange
safety comparison process for FHWA and State departments of transportation to use when
reviewing Interchange Justification Reports. The safety assessment allows agencies to quantify
the safety performance of proposed designs against a base (or reference) condition for service
interchanges.
The project team developed a spreadsheet tool to implement the methods, geometric and
operational characteristics, and parameters described in the corresponding report. The
spreadsheet tool provides annual crash frequency predictions for individual crash severity levels
using the KABCO injury classification scale, where K represents fatal, A incapacitating injury, B
non-incapacitating injury, C possible injury crashes, and O property damage only (no apparent
injury). The spreadsheet tool includes an estimate of the variability of the prediction so users can
assess the significance of differences among predictions for multiple interchange configuration
types under consideration. The report and spreadsheet tool together provide a planning-level
safety assessment tool analysts can use to compare potential safety performance effects of
freeway access and interchange design decisions.
PURPOSE AND STRUCTURE OF THE GUIDE
This user guide provides detailed instructions for using the spreadsheet implementation tool and
interpreting the results it provides. The user guide is organized into the following three chapters:
1. Introduction: Provides context and identifies the accompanying spreadsheet tool and
report.
2. Applicability: Describes interchange configurations the spreadsheet tool can evaluate and
the corresponding interchange influence areas on which the predictive model is based.
3. Spreadsheet Instructions: Describes how to use the spreadsheet tool. This chapter also
explains the required inputs for the spreadsheet tool and provides references to the report
for users to interpret the spreadsheet inputs and outputs.
1CHAPTER 2. APPLICABILITY
INTERCHANGE FUNCTION
The spreadsheet tool is only valid for service interchanges, which connect freeways to local
surface streets or arterials. System interchanges, which connect freeways to other freeways, were
not included in the predictive model and thus are not considered in the spreadsheet tool.
INTERCHANGE CONFIGURATION
The spreadsheet tool applies to the following interchange configurations:
• Diamond interchange.
• Compressed diamond interchange.
• Roundabout diamond interchange.
• Diverging diamond interchange (DDI).
• Partial cloverleaf (parclo) type A (parclo A).
• Parclo type B (parclo B).
• Parclo type AB (parclo AB).
• Single-point diamond interchange (SPDI).
• Tight diamond interchange (TDI).
Single Roundabout Interchanges
Single roundabout interchanges are commonly considered and installed as service interchanges;
however, this study found that jurisdictions that mention single roundabout interchanges are often
referring to diamond interchanges with roundabouts at the crossroad ramp terminals. Single
roundabout interchanges are not included in the model or spreadsheet; analysts should determine
whether the diamond interchange definition fits their proposed configuration if they intend to use
the spreadsheet tool.
Parclo Configurations
For the study design, data collection, and analysis, the project team focused on parclo
configurations most commonly considered and installed (A2, A4, B2, B4, AB2, and AB4) and
developed models with the intent of capturing any safety performance differences between these
parclo types. Due to the sheer number of possible combinations, the project team did not include
other parclo configurations in this research. The report includes descriptions of the parclo
configurations.
The spreadsheet combines diamond interchanges and compressed diamond interchanges into one
category. Parclo AB and parclo B are also combined into one category. These groupings indicate
that the predictive method found no safety performance differences between the two interchange
configurations. Figure 1 shows all nine interchange configurations viable for comparative
analysis using the spreadsheet tool.
3Source: FHWA.
Figure 1. Graphic. Interchange configurations included in the spreadsheet tool.
Not Valid for Spreadsheet Analysis
The following interchange configurations and characteristics were excluded from the predictive
model and thus not suitable for analysis using the spreadsheet tool:
• Full cloverleaf interchange.
• Displaced left-turn interchange.
• Single roundabout interchange.
• Ramps to frontage road interchange.
• Braided ramp interchange.
• “Dogbone” or double roundabout interchange.
• System interchange.
• Interchange with more than six ramps.
• Interchange with direct-connection ramps.
Planners often search for unique solutions to operational or safety concerns to fit local design
constraints; therefore, they are encouraged to seek alternative methods for evaluating interchange
configurations not included in this study.
4INTERCHANGE INFLUENCE AND INTERCHANGE AREAS
The general study area, or area of influence, necessary for conducting safety and operational
analysis for interchange access improvements can vary substantially in size and scope. The
spreadsheet tool focuses on the interchange area rather than the interchange influence area. To
eliminate variability across all nine studied interchange configurations, the interchange area
applicable to the predictive model developed for this project was defined as follows:
• Freeway mainline: Includes 1,500 ft upstream and downstream of the painted gores
farthest from the crossroad on either side.
• Crossroad: Includes 100 ft upstream and downstream of the gore or curb return of the
outermost ramp connection for each terminal (crossroad).
• Ramps (maximum of six).
• Ramp terminals.
Figure 2 represents the interchange study area defined in this project.
Source: FHWA.
Figure 2. Graphic. Study interchange area definition.(3)
5When applying the predictive models for safety comparisons, users should determine the
maximum possible interchange area dimensions among the alternatives considered and apply
those dimensions to all alternatives. For alternative interchanges with a smaller footprint, users
would apply the Highway Safety Manual (HSM) predictive models to account for differences in
interchange area dimensions among the alternatives.(4)
CRASH SEVERITIES ANALYZED
The spreadsheet tool provides separate predictions for property damage only (PDO) crashes and
fatal and injury crashes (K, A, B, and C on the KABCO scale). Fatal and injury crashes are also
known as KABC crashes. Additionally, the spreadsheet tool employs severity distribution
functions (SDFs) to predict the probability of individual KABC crash outcomes. The resulting
probability from the SDF is multiplied by the prediction for KABC crashes to determine the
predicted number of crashes by severity outcome.
6CHAPTER 3. SPREADSHEET INSTRUCTIONS
WORKFLOW
The spreadsheet tool is divided into six worksheets. Refer to the report for methodology and
supporting details for the model used in the spreadsheet tool.
The Welcome and Instructions worksheets provide background information for users. The
Abbreviations Used section in the Instructions worksheet defines abbreviations used in the
spreadsheet and this user guide.
Users enter input in the PDO and SDF worksheets. The PDO worksheet inputs are carried
through to the KABC worksheet because the predictive methodology uses the same inputs for
PDO and KABC crash frequency. Users enter separate inputs in the SDF to determine the
probability of individual crash severity outcomes. Each worksheet provides predicted crash
outcomes, which the Charts worksheet tab summarizes. The PDO and KABC worksheets
calculate the predicted crash frequency at the interchange level. The SDF worksheet calculates
the impact of various interchange features on crash severity. Users can see the crash frequency
results and the 95-percent confidence interval (CI) ranges on the Charts worksheet. Figure 3 is a
screenshot of the various worksheets within the spreadsheet with steps 1–3 of the intended
workflow listed for reference.
Source: FHWA.
Figure 3. Screenshot. Spreadsheet workflow.(2)
STEP 1: READ WELCOME AND INSTRUCTIONS WORKSHEETS
The Instructions worksheet provides descriptions of each worksheet and detailed descriptions for
all inputs required for using the spreadsheet.
The spreadsheet identifies inputs and outputs using colors and patterns, which are described in
figure 4.
7Source: FHWA.
Figure 4. Screenshot. Spreadsheet field coding.(2)
Users modify cells highlighted as “Required input information” on both the PDO and SDF
worksheets. These cells are the only cells in the spreadsheet intended for user modification.
This worksheet also indicates the key crash frequency model results and the results from applying
the SDFs. Additionally, this worksheet alerts users when information is linked to another
worksheet.
Required input cells will alert the user if an incorrect value has been entered, and users should
refer to the Instructions worksheet for additional information.
Cells are formatted to produce errors when nonconforming input is present. Users should enter
values into each cell individually and not copy and paste cells to duplicate information across
tables, or the conditional error formatting will be lost.
STEP 2: COMPLETE INPUT TABLES
The two input tables are located at the top of the PDO worksheet and the SDF worksheet. Users
should complete both of the input tables before interpreting the results. The following sections
provide context and additional information about the required inputs.
Interchange Configurations
Nine interchange configurations are grouped into seven outputs in the PDO worksheet and six
outputs in the SDF worksheet. Users may input the same geometric and operational
characteristics for all types under consideration, or they may vary input parameters when
conducting a simultaneous test. The spreadsheet and predictive model use the
diamond/compressed diamond combined category as the base condition, meaning the user will
need to provide inputs to this category regardless of whether these interchange types are
considered.
For parclo interchanges, the spreadsheet requires additional inputs on the SDF worksheet to
differentiate between the various parclo configurations included in the study. Table 1 summarizes
the inputs for parclo interchange configurations in the implementation spreadsheet.
8Table 1. Parclo spreadsheet input summary.
Worksheet Relevant Input Parameters User Input in Spreadsheet
PDO N/A N/A
Type A or B parclo interchange 1 if user is considering one of these types;
(includes A2/A4/B2/B4) 0 otherwise
SDF
Type AB parclo interchange 1 if user is considering one of these types;
(includes AB2/AB4) 0 otherwise
N/A = not applicable.
Area Type
The predictive model differentiates between rural and urban area types. Urban areas are defined
as having a population greater than 5,000. Table 2 provides an example input for area type in the
implementation spreadsheet.
Table 2. Required area type inputs.
Worksheet Relevant Input Parameters User Input in Spreadsheet
PDO Urban area type 1 if in an urban area; 0 otherwise
SDF N/A N/A
Traffic Volumes
Freeway annual average daily traffic (AADT) volume, the crossroad AADT volume, and the
ramp AADT volumes are all required inputs for the spreadsheet. For freeway mainline and cross
streets, the AADT is the bidirectional traffic volume. The coefficient of variation (COV) of ramp
volumes is also a required input for the model. The implementation spreadsheet automatically
calculates this value based on user inputs of individual ramp volumes. Note that up to six ramp
volumes may be entered into the spreadsheet. If the subject interchange has fewer than six ramps,
then the unnecessary rows can be left blank. Table 3 provides a summary of required traffic
volume inputs for crash frequency and SDF worksheets.
Table 3. Summary of required traffic volume inputs.
Worksheet Relevant Input Parameters User Input in Spreadsheet
Freeway AADT Volume in vpd
XR AADT Volume in vpd
PDO Total ramp AADT Volume in vpd
Calculated in spreadsheet
COV of ramp volumes
(requires individual ramp AADTs)
1 if freeway through lanes carry more than
Freeway AADT ≥200,000 vpd
200,000 vpd; 0 otherwise
SDF
XR AADT greater than or equal to 1 if crossroad through lanes carry more
30,000 vpd than 30,000 vpd; 0 otherwise
vpd = vehicles per day; XR = crossroad.
9Freeway Characteristics
The distance between adjacent gore areas along the freeway is accounted for in the predictive
model as a factor that increases crash frequency. This distance is also accounted for in the SDF as
a factor that increases the probability of fatal and serious injury (KA) severity crashes within the
crash distribution. The nearest interchange gore distance is measured from the closest gore areas
between adjacent interchanges in the same direction of travel. Figure 5 describes this parameter.
Source: FHWA.
Figure 5. Illustration. Nearest interchange gore distance.
The predictive model accounts for managed lanes on the freeway as a factor associated with
increased crash frequency when at least one managed lane is present within the defined
interchange area. In this case, managed lanes refer to high-occupancy vehicle (HOV) or
high-occupancy toll lanes. This methodology development did not include other managed lane
strategies, such as part-time shoulder use, reversible, contraflow, or bus-only lanes. The
spreadsheet input is a yes or no response from the user regarding whether one or more managed
lanes are within the interchange area.
The number of through lanes on the freeway is accounted for in the predictive model to evaluate
AADT per lane as well as a factor specifically accounting for the effect of the number of lanes.
The base condition is four or fewer through lanes on the freeway (in both directions combined),
meaning spreadsheet output is affected when five or more lanes are input. Users input the number
of freeway through lanes (bidirectional total) as a whole number value. The SDF worksheet uses
a yes or no input to account for the number of through lanes, depending on whether the total is
greater than or equal to eight lanes. Table 4 provides a summary of freeway lane information
inputs.
10Table 4. Summary of freeway lane information inputs.
Worksheet Relevant Input Parameters User Input in Spreadsheet
Nearest interchange gore distance 1 if distance ≤0.5 mi; 0 otherwise
within 0.5 mi (figure 5)
1 if there are any managed lanes within the
Managed lanes on freeway
defined interchange area; 0 otherwise
PDO
Total number of through lanes on the
Freeway number of through lanes freeway within defined interchange area
(bidirectional total) (do not include auxiliary or managed
lanes)
Freeway posted speed limit Enter speed limit in mph
Nearest interchange gore distance 1 if distance ≤0.25 mi; 0 otherwise
within 0.25 mi (see figure 5)
SDF
1 if freeway has ≥8 through lanes;
Freeway has eight or more lanes
0 otherwise (do not include auxiliary or
(bidirectional total)
managed lanes)
Crossroad Characteristics
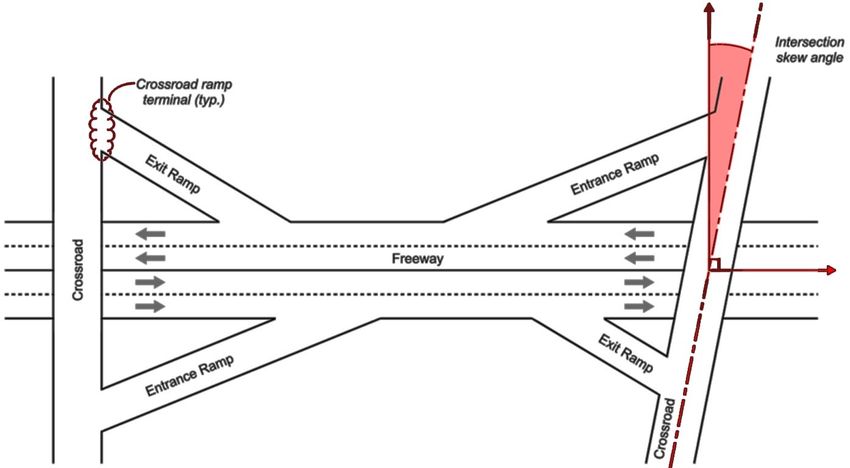
The intersection skew angle is measured as the angle between the crossroad centerline and the
freeway centerline at the interchange. The skew angle between crossroad and freeway is
accounted for in the predictive model as a factor associated with an increase in crash frequency
when the skew angle is greater than 30 degrees. Figure 6 describes this parameter.
Source: FHWA.
typ = typical.
Figure 6. Illustration. Intersection skew calculation.
11The predictive model accounts for the interchange’s total number of through lanes on the
crossroad to evaluate AADT per lane and a factor specifically accounting for the effect of the
number of lanes. The base condition for the SDF is four or fewer through lanes, meaning
spreadsheet output is affected when five or more lanes are input. Users input the total number of
crossroad through lanes (bidirectional total) as a whole number value. The number of through
lanes on the crossroad is included in the SDF as a factor that moves the severity distribution
toward more severe crash outcomes when more lanes are present. Users input yes or no as to
whether the bidirectional total is four or more through lanes.
Left-turn lanes on the crossroad are accounted for in the predictive model as a factor associated
with a decrease in crash frequency. The PDO worksheet accepts values ranging from zero to
seven total left-turn lanes on the crossroad. This value includes all left-turn lanes from the ramp
terminals onto the crossroad and from the crossroad onto the ramps. Figure 7 provides more
details.
Source: FHWA.
LT = left turn.
Figure 7. Illustration. Example interchange spreadsheet inputs.
The SDF worksheet accounts for the distance from crossroad ramp terminals to adjacent
intersections along the crossroad. The distance is measured from the centerline of the ramp
terminal to the nearest intersection outside the defined interchange area. Figure 6 illustrates the
usual location of a typical crossroad ramp terminal.
12The number of pedestrian crossings conflicting with right-turning vehicles across the interchange
is accounted for in the SDF as a factor that moves the severity distribution toward a higher
probability of more severe outcomes. Users input a value from 0 to 7, representing the total
number of conflicts present. A conflict is defined as a right-turn movement intersecting with a
pedestrian movement. If there are multiple adjacent right-turn movements from a single leg of an
intersection within the interchange area, users should count it as one conflict point if the
right-turn movements cross paths with a pedestrian movement.
Figure 7 provides an example of various crossroad characteristics at an interchange required for
spreadsheet input. Table 5 summarizes input requirements for crossroad characteristics and
features.
Table 5. Summary of crossroad characteristic inputs.
Worksheet Relevant Input Parameters User Input in the Spreadsheet
Intersection skew angle >30 1 if angle between XR and freeway is >30
degrees degrees; 0 otherwise
XR number of through lanes Total number of through lanes on the XR
PDO (bidirectional total) within the defined interchange area
Total number of LT lanes on the XR
Number of LT lanes on the XR at
within the defined interchange area
intersections
(0 minimum, 7 maximum)
XR posted speed limit Enter speed limit in mph
Nearest XR adjacent intersection 1 if the nearest intersection along the XR is
(signal or roundabout) within 0.10 ≤0.10 mi from any of the XR ramp
mi of ramp terminal terminals; 0 otherwise
SDF Number of pedestrian crossings Total number of pedestrian crossings that
conflicting with right-turning right-turning vehicles conflict with within
vehicles across the interchange the defined interchange area; 0 otherwise
XR has four or more lanes 1 if XR has ≥4 through lanes;
(bidirectional total) 0 otherwise
Figure 8 provides a snapshot of the User Input section of the PDO worksheet. In this sheet, the
user can enter data for any interchange configurations for comparison. However, as noted in the
Interchange Configurations section, data must be entered for the diamond/compressed option
since the calculations work from this configuration as the baseline. Also, as noted, changes made
in the PDO worksheet will automatically update the KABC worksheet.
13Source: FHWA.
Std = standard.
Figure 8. Screenshot. User input from PDO worksheet.(2)
Additionally, users are directed to review the Applicability section of the PDO worksheet. As
shown in figure 9, this section includes the AADT ranges for each interchange configuration
available in the tool. For each configuration, the recommended minimum and maximum AADT
values are included for the freeway, crossroad, entrance ramps, and exit ramps. Caution should be
used when interpreting results outside these bounds, and further consideration of the operational
merits should be taken. For example, roundabout diamond interchanges generally had lower
volumes and may not operate well at volumes higher than those used to develop the model.
Source: FHWA.
Figure 9. Screenshot. Applicability section.(2)
STEP 3: INTERPRET THE OUTPUTS
As shown in figure 10, the primary output of the spreadsheet is in the Model Output section on
the PDO worksheet. This section provides the predicted crash frequency for each interchange
configuration in units of crashes per year. Results are split into PDO severity-level crashes,
combined KABC severity-level crashes, and the total (KABC plus PDO) interchange crashes.
These values are based on the predictive model developed for this project and are applicable over
the entire interchange area; the model does not determine the location of the predicted crashes
14within the interchange. Chapter 5 in the report provides background information on the predictive
model.
Source: FHWA.
LB = lower bounds; UB = upper bounds.
Figure 10. Screenshot. Model output from PDO worksheet.(2)
The PDO worksheet also provides the 95-percent CIs as a range of values between lower and
upper bounds for the crash frequency results. CIs are a measure of statistical certainty: the wider
the range, the more caution should be used in applying the model results. Additionally, the
predictive model results suggest that while there may be a difference based on the expected
value, the differences may not be statistically different, which should be considered when
evaluating the safety effects of each interchange configuration.
The Charts worksheet displays the model output in a visual format. Charts show the predicted
crash frequency and 95-percent CI upper and lower bounds for PDO, KABC, and combined
KABC plus PDO results. Figure 11 provides an example chart from the worksheet highlighting
predicted total (KABC plus PDO) crashes for each configuration and applicable 95-percent CIs.
Source: FHWA.
Figure 11. Graph. Total crash frequency from Charts worksheet.(2)
As shown in figure 12, the SDF worksheet provides a breakdown of the SDF results by
interchange configuration. The worksheet predicts the proportion of KABC crashes, given that a
crash has occurred. Results are combined for K and A severity levels. These proportions are
multiplied by KABC crash frequency on the KABC tab to provide a prediction for crash
frequency by severity level.
15Source: FHWA.
Figure 12. Screenshot. SDF model output.(2)
Calibration
The predictive model provided in this worksheet is based on data from five States. As with other
predictive models, local conditions may dictate that safety performance will differ by jurisdiction,
and calibration is necessary for using the results to compare differences in terms of the number of
crashes. If the tool is used without calibrations, users are encouraged to consider the relative (or
percent) difference between alternatives in terms of safety benefits. Users can refer to appendix A
of the HSM Part C predictive method for the calibration procedure.(4)
Additional Guidance on Predictive Method
Users are encouraged to conduct evaluations within the parameters presented for interchange
configurations discussed in this guide. However, the predictive method may not be applicable in
some situations, or unique circumstances may not fit within the criteria for using the predictive
method. In these situations, if crash prediction is necessary, users should consider applying the
predictive method from chapters 18 and 19 of the HSM.(4) If data required for the chapter 18 and
19 predictive method are unavailable, and users opt to employ this tool, they should document
any assumptions made, noting specific situations where the models have been extended for
analysis. Further documentation should include additional factors that may contribute to a
potential bias in safety estimation.
Practitioners should exercise caution when making decisions based purely on safety prediction
models. Refer to the Conclusions and Recommendations section (chapter 7) of the report for
additional insight into the applicability of model results to planning-level decisionmaking.
16REFERENCES
1. Himes, S., V. Gayah, J. Gooch, G. O’Connor, and T. Le. Forthcoming. Safety
Comparisons Between Interchange Types. Washington, DC: Federal Highway
Administration.
2. FHWA. 2023. FHWA Interchange Configuration Safety Comparison Tool (software).
3. Himes, S., V. Gayah, J. Gooch, G. O’Connor, and T. Le. 2023. Safety Comparison of
Interchange Configurations. TechBrief No. FHWA-HRT-23-029. Washington, DC:
Federal Highway Administration.
4. American Association of State Highway and Transportation Officials. 2010. Highway
Safety Manual, 1st ed. Washington, DC: American Association of State Highway and
Transportation Officials.
17Recommended citation: Federal Highway Administration,
Recycled Interchange Comparison Safety Tool User Guide
HRSO-10/03-23(WEB)E
Recyclable (Washington, DC: 2023) https://doi.org/10.21949/1521985You can also read