CFD tool application in predicting the behavior of a centrifugal fan designed by one-dimensional theory
←
→
Page content transcription
If your browser does not render page correctly, please read the page content below
Research, Society and Development, v. 10, n. 12, e412101219653, 2021
            (CC BY 4.0) | ISSN 2525-3409 | DOI: http://dx.doi.org/10.33448/rsd-v10i12.19653

CFD tool application in predicting the behavior of a centrifugal fan designed by one-
dimensional theory
Aplicação da ferramenta CFD na previsão do comportamento de um ventilador centrífugo
projetado com a teoria unidimensional
Aplicación de la herramienta CFD para predecir el comportamiento de un ventilador centrífugo
disenado con la teoria unidimensional

                                                    Received: 08/20/2021 | Reviewed: 08/29/2021 | Accept: 09/23/2021| Published: 09/25/2021

                                                                                                   Henrique Marcio Pereira Rosa
                                                                                             ORCID: https://orcid.org/0000-0002-1437-2265
                                                                                                    Universidade Federal de Viçosa, Brazil
                                                                                                              E-mail: henrique.rosa@ufv.br
                                                                                                            Gabriela Pereira Toledo
                                                                                             ORCID: https://orcid.org/0000-0001-8920-6256
                                                                                                Universidade Estadual de Campinas, Brazil
                                                                                                         E-mail: g235585@dac.unicamp.br

      Abstract
      Computational fluid dynamics (CFD) is the most current technology in the fluid flow study. Experimental methods for
      predicting the turbomachinery performance involve greater time consumption and financial resources compared to the
      CFD approach. The purpose of this article is to present the analysis of CFD simulation results in a centrifugal fan. The
      impeller was calculated using the one-dimensional theory and the volute the principle of constant angular momentum.
      The ANSYS-CFX software was used for the simulation. The turbulence model adopted was the SST. The simulation
      provided the characteristic curves, the pressure and velocity distribution, and the static and total pressure values at
      impeller and volute exit. An analysis of the behavior of the pressure plots, and the loss and recovery of pressure in the
      volute was performed. The results indicated the characteristic curves, the pressure and velocity distribution were
      consistent with the turbomachinery theory. The pressure values showed the static pressure at volute exit was smaller
      than impeller exit for some flow rate. It caused the pressure recovery coefficient negative. This work indicated to be
      possible design a centrifugal fan applying the one-dimensional theory and optimize it with the CFD tool.
      Keywords: Characteristic curves; Volute; Pressure plots; Losses.

      Resumo
      A dinâmica de fluidos computacional (CFD) é a tecnologia mais atual no estudo de escoamento de fluidos. Métodos
      experimentais para prever o desempenho de turbomáquinas envolvem maior consumo de tempo e recursos financeiros
      em comparação com a abordagem CFD. A proposta deste artigo é apresentar a análise dos resultados de simulação
      CFD de um ventilador centrífugo. O rotor foi calculado utilizando a teoria unidimensional e a voluta o princípio do
      momento angular constante. Para a simulação foi utilizado o software ANSYS-CFX. O modelo de turbulência
      adotado foi o SST. A simulação forneceu as curvas características, a distribuição de pressão e velocidade, e valores de
      pressão estática e total na saída do rotor e da voluta. Uma análise do comportamento das parcelas de pressão, e da
      perda e recuperação de pressão na voluta foi realizada. Os resultados indicaram que a curva característica e a
      distribuição de pressão foram coerentes com a teoria das turbomáquinas. Os valores de pressão mostraram que a
      pressão estática na saída da voluta foi menor que a da saída do rotor para algumas vazões. Isto causou coeficientes de
      recuperação de pressão negativos. Este trabalho indica que é possível projetar um ventilador centrífugo aplicando a
      teoria unidimensional e otimizá-lo com a ferramenta CFD.
      Palavras-chave: Curvas características; Voluta; Parcelas de pressão; Perdas.

      Resumen
      La dinámica de fluidos computacional (CFD) es la tecnología más actual en el estudio del flujo de fluidos. Los
      métodos experimentales para predecir el rendimiento de las turbomáquinas implican un mayor consumo de tiempo y
      recursos financieros en comparación con el enfoque CFD. El propósito de este artículo es presentar el análisis de
      resultados de simulación CFD de un ventilador centrífugo. El rotor se calculó utilizando la teoría unidimensional y la
      voluta el principio de momento angular constante. Para la simulación se utilizó el software ANSYS-CFX. El modelo
      de turbulencia adoptado fue el SST. La simulación proporcionó las curvas características, la distribución de presión y
      velocidad, y los valores de presión estática y total en la salida del impulsor y la voluta. Se realizó un análisis del

                                                              1
Research, Society and Development, v. 10, n. 12, e412101219653, 2021
               (CC BY 4.0) | ISSN 2525-3409 | DOI: http://dx.doi.org/10.33448/rsd-v10i12.19653

         comportamiento de las gráficas de presión, y la pérdida y recuperación de presión en la voluta. Los resultados
         indicaron que la curva característica y la distribución de la presión fueron coherentes con la teoría de las
         turbomáquinas. Los valores de presión mostraron que la presión estática en la salida de la voluta fue menor que en la
         salida del rotor para algunos flujos. Esto provocó coeficientes de recuperación de presión negativos. Este trabajo
         indica que es posible diseñar un ventilador centrífugo aplicando la teoría unidimensional y optimizarlo con la
         herramienta CFD.
         Palabras clave: Curvas características; Voluta; Cuotas de presión; Pérdidas.

1. Introduction
         Computational fluid dynamics (CFD) is the most current technology in the fluid flow study used in many applications
(Cabral et al., 2020; Pereira & Gois, 2020; Zapata et al, 2021). Experimental methods for predicting the turbomachinery
performance involve greater time consumption and financial resources compared to the CFD approach, which has been widely
used in fluid flow simulation in turbomachinery (Danish et al., 2014; Galloni, et al. 2018; Panigrahi & Mishra, 2014; Nataraj &
Ragoth-singh, 2014; Abdelmadjid, et al., 2013; Madhwesh et al., 2011; Kim, et al., 2012). Successful results in predicting flow
patterns indicate that CFD may be able to assist a design engineer in achieving improved designs. Many researchers have
applied the CFD technique in studies of fans and turbomachinery in general.
         Shojaeefard et al. (2012) used CFD to evaluate the influence of blade angle and width at the impeller outlet of a
centrifugal pump on the flow behavior for two different fluids: water and oil.
         Galloni, et al. (2018) studied by means of CFD a radial fan for electric motor cooling. They investigated the influence
of both the impeller shape and the number of blades, and showed that, for a given blade number, the dimensionless flow
capacity depends on the aspect ratio of the impeller.
         Xiaoran et al. (2018) used the CFD technique to analyze the flow asymmetric characteristics of a reversible pump-
turbine operating in pump mode, taking as an analysis premise the relationship between pressure fluctuations and unstable flow
pattern in the impeller.
         Wang et al. (2017) proposed to change the blades profile of a pump impeller to operate as a turbine with good
performance. In this study, the hydraulic loss, the characteristic of the internal flow and the distribution of the static pressure
were analyzed based on the numerical results from CFD.
         Applying CFD tool combined with Matlab, Gjeta (2019) studied the effect of the clearance gap between the impeller
and the volute on the performance of a centrifugal. The automized coupling with Matlab allowed a large number of parameter
variations.
         Rosa and Emerick (2020) evaluated the influence of intermediate blades inserted between the main blades in a
centrifugal pump impeller. The intermediate blades were 30% long of the main blade. The CFD results of three configurations
were compared: 1) without an intermediate blade; 2) with intermediate blades at the entrance; 3) with intermediate blades at
the outlet.
         Hariharan and Govardhan (2016) studied the increase in efficiency in an industrial centrifugal fan comparing the use
of parallel wall volute with rectangular volute for four different impellers diameter. According to the authors, the volute is the
starting point to improve the performance of a fan because it is the element with the lowest performance in centrifugal fans.
         The CFD tool has also been used to study noise in turbomachines, which is a parameter that also influences
performance (Scheit et al., 2012; Kuan, et al., 2017; Naik & Magdum, 2018).
         In this context, this work presents a theoretical study based on CFD simulation results on the performance of a
centrifugal fan dimensioned by one-dimensional theory. The simulation of some flow rate points, allowed carrying out the
dimensionless characteristic curves. The pressure and velocities distribution at transversal and longitudinal planes were
analyzed according to turbomachinery theory. The averaged pressure values obtained from simulation allowed studying the

                                                                2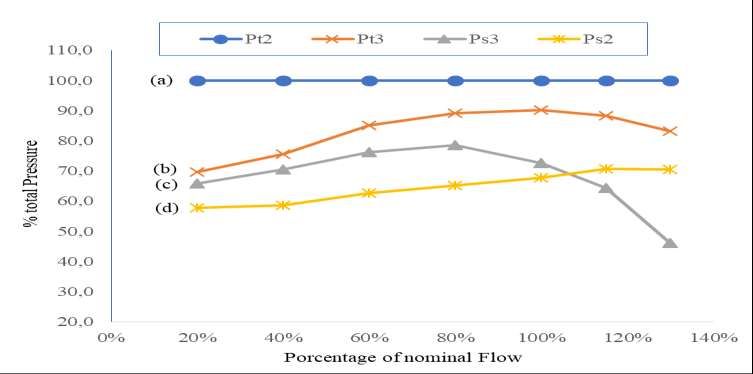
Research, Society and Development, v. 10, n. 12, e412101219653, 2021
               (CC BY 4.0) | ISSN 2525-3409 | DOI: http://dx.doi.org/10.33448/rsd-v10i12.19653

variation of the static, dynamic and total pressure between the exit of impeller and of volute. They were useful also to analyze
of pressure recovery and losses on volute.

2. Methodology
        In this work, a centrifugal fan with mass flow rate of      = 0.1205 kg/s and rotation n = 3550 rpm was studied. The
impeller was designed by application of one-dimensional theory with correction based on Pfleiderer slip factor (Pfleiderer,
1952). The impeller has 11 backward curved blades, and the other geometrical data shown in Table 1. Figure 1a shows a
drawing of the impeller.
        The volute was designed based on the constant angular momentum principle (Pfleiderer, 1952; Sedille, 1967),
considering a constant width of 47 mm. The spiral was divided into 16 parts and the radius are shown in Table 2. The volute
was designed with SolidWorks® software, and is illustrated in Figure 1b. The dimension at volute exit is 125 x 47 mm.

                                             Table 1. Impeller geometric parameters.

                                         D1        D2        Bt       B2     β1         β2
                                      (mm)        (mm)     (mm)     (mm)     (º)        (°)
                                      102,0       241,2     3,46     12,0   30,4       34,1
                                      D1         Entry diameter
                                      D2         Exit diameter
                                      Bt         Blade thickness
                                      B2         Exit width
                                      β1         Inlet blade angle
                                      β2         Outlet blade angle
                                                         Source: Authors.

                              Figure 1a.-Impeller.                                 Figure 1b.-Volute.

                                                         Source: Authors.

                                                                3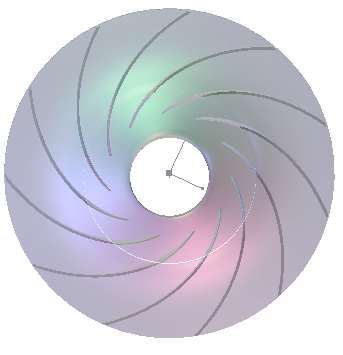
Research, Society and Development, v. 10, n. 12, e412101219653, 2021
(CC BY 4.0) | ISSN 2525-3409 | DOI: http://dx.doi.org/10.33448/rsd-v10i12.19653
Table 2. Radius used for the spiral volute.
i 1 2 3 4 5 6 7 8 9 10 11 12 13 14 15 16
R(i)
131 136 141 146 152 157 163 169 175 182 188 195 202 210 217 225
[mm]
Source: Authors.
2.1 Mathematical model
Considering the incompressible flow and steady-state approximation the general equations that govern the flow within
the fan are solved by application of RANS (Reynolds Average Navier-Stokes) equations, that use average values and
introduces the Reynolds Stress on momentum equation (ANSYS, 2001).
The Equation 1 and 2 give the continuity and momentum equations:
(1)
(2)
Where:
u - fluid velocity (for rotating domain u will be the relative velocity);
i, j – components;
- Fluid specific mass;
P – Static pressure;
τij - Shear stress tensor, related to fluid viscosity;
- Additive term, related to additional forces.
For rotating domain wtih angular velocity , the additive term is required to include the effects of the Coriolis force
and the centrifugal force (Jafarzadech et al., 2011), given by Equations 3:
(3)
Being:
− Angular velocity;
r – Position vector.
The term from Equation 2 is the Reynolds Stress (ANSYS, 2011), obtained by Equation 4.
(4)
Where:
– Kronecker symbol;
μt – turbulent viscosity;
k – turbulence kinetic energy.
4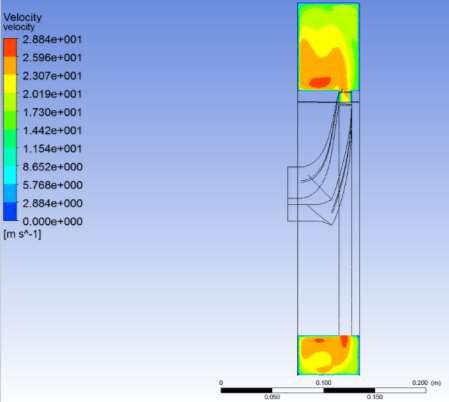
Research, Society and Development, v. 10, n. 12, e412101219653, 2021
                (CC BY 4.0) | ISSN 2525-3409 | DOI: http://dx.doi.org/10.33448/rsd-v10i12.19653

         Turbulent viscosity and turbulent kinetic energy are parameters associated with turbulence modeling. The method of
obtaining these parameters is what differentiates the most used turbulence models in the modeling of flows in turbomachines.
         As the equations do not have analytical solutions, except for some specific cases, they are solved using numerical
methods based on the flow field discretization. The CFD / Ansys-CFX tool uses the finite volume method (Derakhshan, et al.,
2012; Hariharan & Govardhan, 2016) applied to the flow domain.

2.2 Mesh construction

         Discretization implies dividing the fluid domain into small elements (mesh). In this work, the “meshing” software,
which is part of the Ansys package, was used to make an unstructured mesh with a majority of tetrahedral elements with
refinements close to the edges, which is a region of interest for the occurrence of important physical phenomena.
         In areas with high curvature or close to the surface, the “sizing” function allowed to control growth and mesh
distribution.
         The mesh refinement has a limit beyond which further refinement will not give results that are more accurate. The
search for this limit is the mesh test, which consists in evaluating the variation of a reference quantity as a function of the mesh
size. A variation smaller than 0.5% is a value adopted as satisfactory (Derakhshan, et al., 2012; Derakhshan et al., 2013).
         The Figure 2 shows the graph of the mesh test. The 783,840 elements mesh was selected for the impeller + volute.

                                                       Figure 2. Mesh test.

                                                          Source: Authors.

2.3 Boundary conditions

         As boundary condition, the configuration used at impeller entrance was the “inlet” configuration with the static
pressure (0.0 Pa) value. At volute exit, the configuration was the “outlet”, assigning the value of the mass flow rate. The
change in the flow rate allowed to simulating several operation points.
         On the other surfaces of the impeller (blade, hub and shroud), and on the walls of the volute, a “wall” configuration
was used, adopting a non-slip condition between the fluid and the wall (Derakhshan et al., 2013; Zhu et al.., 2016) and
superficial roughness of e = 50μm, considering commercial steel as material (Fox et al., 2003). As the impeller is a rotating
domain and the volute is stationary, a Frozen Rotor condition was adopted in the impeller-volute interface, which allows local
flow characteristics to be transported through this interface.
                                                                 5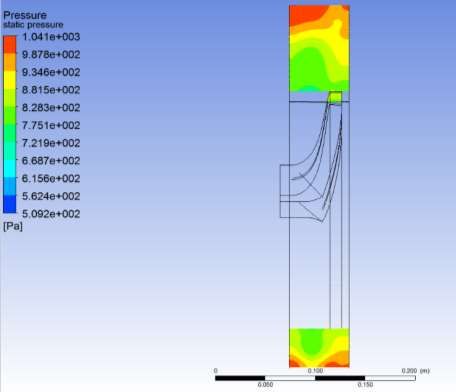
Research, Society and Development, v. 10, n. 12, e412101219653, 2021
                  (CC BY 4.0) | ISSN 2525-3409 | DOI: http://dx.doi.org/10.33448/rsd-v10i12.19653

         The points of operation simulated given as a percentage of nominal flow rate were 20%, 40%, 60%, 80%, 100%,
115% and 130%. The reference pressure used was 0.0 Pa and the properties of the fluid were those of air at 25ºC.
         To contemplate the turbulence effects that occurs in the flow inside the fan, ANSYS® CFX uses turbulence models.
The adopted in this work was the SST (Shear Stress Transport), developed by Menter (1994). It is a hybrid model that
combines features of the κ−ε and κ−ω models. The κ−ε algorithm provides better results in flow regions away from walls. On
the other hand, the one for κ−ω compute better the phenomena close to walls. The SST model combine the two models through
the automatic function for near-wall flow treatment. It is widely used in centrifugal fans simulations (Azem et al., 2018). Using
the dimensionless distance from the wall as a comparison parameter, the automatic function selects which algorithm to use. In
regions close to the walls, uses the κ−ω model, and in distant regions, uses the κ−ε model (Shojaeefard, 2012; Paramasivam et
al., 2017).
         The energy transferred by the fan to the fluid in terms of total pressure, hydraulic power, and efficiency are given by
Equations 5, 6 and 7 respectively.

                                                                                         (5)

                                                                                         (6)

                                                                                         (7)

Where:
ΔPTotal – Total pressure gain (static + dynamic) between inlet and outlet, in Pa;
PT,o – Total pressure at the fan outlet, in Pa;
PT,i – Total pressure at the fan inlet, in Pa;
Q – Volumetric flow rate, in m3/s;
PH – Hydraulic power, in W;
PE – Power consumed, in W;
η – Efficiency.

3- Results and Discussion
3.1 Characteristic curves
         Figure 3 shows the characteristic curves, where the flow rate and total pressure variation are dimensionless by the
flow and pressure coefficients, given by Equations 8 and 9. The curves behavior is consistent with turbomachinery theory. The
design point refers to the 0.25 flow coefficient, whose efficiency is 0.796. The figure shows that the maximum efficiency was
0.807, and it occurred for ɸ=0.15.

                                                                                         (8)

                                                                                         (9)

Where:
ɸ - flow coefficient
Ψ– pressure coefficient
U2 – tangencial velocity at impeller exit, in m/s
                                                                 6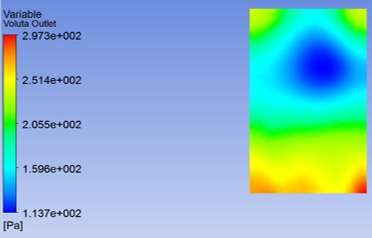
Research, Society and Development, v. 10, n. 12, e412101219653, 2021
               (CC BY 4.0) | ISSN 2525-3409 | DOI: http://dx.doi.org/10.33448/rsd-v10i12.19653

                                                 Figure 3. Characteristic curves.

                                                         Source: Authors.

3.2 Pressure distribution analysis

         The Figure 4 shows the static pressure distribution for the nominal flow rate: 4a) in a transverse plane that passes
through the width midpoint at the impeller exit, and 4b) in a longitudinal plane that passes through the fan axis.
         Analyzing only the impeller, the pressure distribution shows the following elements: 1) static pressure gradually
increases with the impeller radius; 2) for the same radius, the pressure on the blade front face is greater than on the back face;
3) near the blades exit edge the pressures on both sides tend to equalize; 4) static pressure in the blades inlet region is low.
These elements reveal a behavior consistent with the turbomachinery theory. (Pfleiderer, 1952; Stepanoff, 1957; Sedille,
1967).
         Regarding the volute, the pressure distribution shows higher pressures than on the impeller, since part of the dynamic
pressure at the impeller exit is transformed into static pressure in the volute. Near the volute wall, the figure 4a shows that the
static pressure is greater throughout the curved extension; this is caused by the fluid particles inertia that go towards the wall.
This situation also causes secondary flows, as shows the longitudinal section (Figure 5). This flow behavior is similar to flows
in curved pipes, as described by Stepanoff (1957).

                                                                7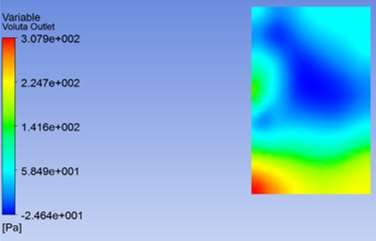
Research, Society and Development, v. 10, n. 12, e412101219653, 2021
(CC BY 4.0) | ISSN 2525-3409 | DOI: http://dx.doi.org/10.33448/rsd-v10i12.19653

     Figure 4a. Static pressure distribution for the nominal flow rate– Transverse plane.

                                       Source: Authors.

    Figure 4b. Static pressure distribution for the nominal flow rate – Longitudinal plane.

                                       Source: Authors.

                                              8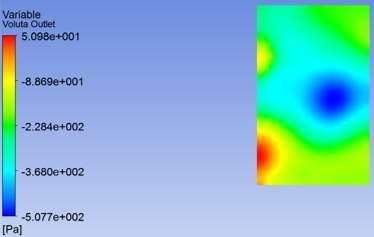
Research, Society and Development, v. 10, n. 12, e412101219653, 2021
               (CC BY 4.0) | ISSN 2525-3409 | DOI: http://dx.doi.org/10.33448/rsd-v10i12.19653

                        Figure 5. Vetor velocity distribution for nominal flow rate on longitudinal plane.

                                                         Source: Authors.

         The Figure 6 shows the velocity distribution for the nominal flow rate: 6a) in a transverse plane that passes through
the width midpoint at the impeller exit, and 6b) in a longitudinal plane that passes through the fan axis. The figure shows that
the velocity is high at the impeller exit, but decreases as the flow progresses through the volute. Figures 4 and 6 complement
each other in terms of the transformation of dynamic into static pressure in the volute, where the velocity decreases in Figure 9,
the static pressure increases in Figure 7.

                            Figure 6a. Velocity distribution for nominal flow rate- Transverse plane.

                                                         Source: Authors.

                                                                9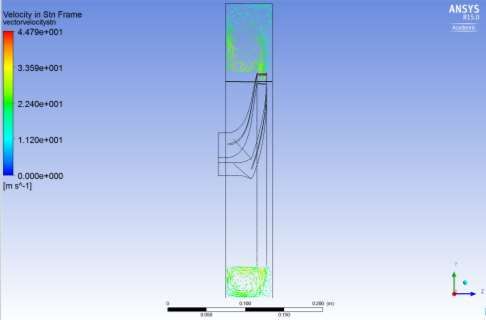
Research, Society and Development, v. 10, n. 12, e412101219653, 2021
               (CC BY 4.0) | ISSN 2525-3409 | DOI: http://dx.doi.org/10.33448/rsd-v10i12.19653

                          Figure 6b. Velocity distribution for nominal flow rate - Longitudinal plane.

                                                           Source: Authors.

3.3 Pressure parcels behavior
         With CFD simulations is possible to obtain values of static and total pressures in specific regions of the fluid domain.
The values are weighted averages in the respective regions, being the static pressure (Ps) weighted by the area, and the total
pressure (Pt) by the mass flow. Figure 7 presents the behavior for these pressures: (a) total pressure at impeller exit-Pt2, (b)
total pressure at volute exit-Pt3, (c) static pressure at volute exit-Ps3, and (d) static pressure at impeller exit-Ps2.

                                                                  10
Research, Society and Development, v. 10, n. 12, e412101219653, 2021
(CC BY 4.0) | ISSN 2525-3409 | DOI: http://dx.doi.org/10.33448/rsd-v10i12.19653
Figure 7. Pressure parcel behavior.
Source: Authors.
The Figure 7 shows a decrease of total pressure with flow rate, going from 1647 Pa to 1150 Pa, therefore a reduction
of 497 Pa. The static pressure at the impeller exit also decreased; however, it presented a smaller variation, from 952 Pa to 811
Pa, a reduction of 141 Pa.
The smaller reduction in static pressure is associated with the fact that for centrifugal impellers, the static pressure
produced is partially composed of a fixed portion, which does not depend on flow rate. This portion is the centrifugal effect
(Equation 10), and is associated with the tangential velocity at the impeller exit and impeller entry (Stepannof, 1957; Sedille,
1967; Turton, 1995).
(10)
Where:
U1 – tangencial velocity at impeller inlet, in m/s
The figure also indicates that the volute exit pressures also decreased with flow rate. However, from 80% the decrease
is more pronounced (1093 Pa to 530 Pa), and becomes lower than the static pressure at the impeller exit for 115% and 130%
flow rate.
Another way to analyze the behavior of the pressure parcels is through the ratios of these with the total pressure at the
impeller exit, as Figure 8 presents.
11Research, Society and Development, v. 10, n. 12, e412101219653, 2021
(CC BY 4.0) | ISSN 2525-3409 | DOI: http://dx.doi.org/10.33448/rsd-v10i12.19653
Figure 81. Ratios of pressure parcels with the total pressure at the impeller exit.
Source: Authors.
The Figure 8 shows that the static pressure parcel at the impeller exit has increased from 58% to 71%. This data
seems incorrect, since the increase in flow rate should cause an increase in kinetic energy and not static pressure. This occurs
because the flow absolute velocity at the impeller exit decreases for flow rates greater than the nominal (Sedille, 1967). On the
other hand, the static pressure parcel at the impeller exit decreased by 20% (66% to 46%).
3.4 Volute pressure recovery
Considering the graph in Figure 7, the vertical distances measured in pressure units between some lines provide other
pressure value (Table 3). A similar interpretation on Figure 8 indicates that the verticals distances are in units of percentage of
the total pressure at the impeller exit.
Table 3. Other pressure values.
Pressure Vertical distance between lines:
Dynamic pressure at impeller exit (Pd2): (Pd2=Pt2-Ps2); aed
Dynamic pressure at impeller exit (Pd3): (Pd3=Pt3-Ps3); bec
Volute pressure loss (ΔPv): (ΔPv=Pt2-Pt3); aeb
Static pressure recovered in the volute (Prec): (Prec=Ps3-Ps2) ced
Source: Authors.
Using the vertical distances, the Figure 7 shows that the dynamic pressure at impeller exit is the amount of energy
available to three energy portions: 1) overcome the loss in the volute, 2) provide dynamic energy necessary for the fluid to
12Research, Society and Development, v. 10, n. 12, e412101219653, 2021
(CC BY 4.0) | ISSN 2525-3409 | DOI: http://dx.doi.org/10.33448/rsd-v10i12.19653
flow after fan exit, and 3) enable some static pressure to be recovered. However, the figure also shows that for flow rate greater
than the nominal, Pd2 was insufficient to meet the three parcels; it fully met only one, the loss in the volute. This resulted in
static pressure at the volute exit lower than that at the impeller exit, so there was no static pressure recovery in the volute, but a
decrease. Thus, part of the static pressure at the impeller exit was used to accelerate the flow towards the fan exit.
The pressure recovery coefficient (Cp), given by Equation 11, indicates how much of the dynamic pressure at the
impeller exit is transformed into static pressure at the volute exit.
(11)
The graph in Figure 9 shows the Cp for different flow rate.
Figure 9. Pressure parcel behavior.
Source: Authors.
The graph shows that Cp slowly increased to the maximum value of 0.381 at 80% flow rate. Afterwards, it rapidly
decreased, passing through the nominal, with Cp=015, and becoming negative for the higher flows.
For 130% flow rate, the Cp is -0.831. This indicates that a portion of the static pressure at the impeller exit equivalent
to 83.1% of the dynamic pressure at the impeller exit was transformed into dynamic pressure in the volute. This analysis is
supported by the graph in Figure 7, where it can be observed that the vertical distance between lines “d” and “c” is a little
smaller than between lines “a” and “d”.
These data show that the design of this fan is deficient in terms of static pressure recovery. This occurs because the
dynamic pressure at the volute exit is a function of the velocity, which is a function of the flow, so there is no way to reduce
the dynamic pressure without changing the dimensions of the volute. As an estimate, a 25% increase in volute width
corresponds 20% reduction in average velocity at volute exit and 36% in dynamic pressure. These values are not exact as they
consider one-dimensional flow (average values), however they provide a reasonable estimate. Another way to improve
pressure recovery would be to place a cone at the impeller exit.
On CFX-post a parameter named “Variable” was created. It provides the value of the difference between static
pressure at the point and average static pressure at the impeller exit. The Figure 10 shows the distribution of this parameter in
the impeller exit section for some flow rates.
13Research, Society and Development, v. 10, n. 12, e412101219653, 2021
(CC BY 4.0) | ISSN 2525-3409 | DOI: http://dx.doi.org/10.33448/rsd-v10i12.19653
Figure10. "Variable" distribution in the impeller exit section for some flow rate.
Flow - 80% Flow - 100%
Flow - 115% Flow - 130%
Source: Authors.
The Figure 10 shows large variations between the minimum and maximum for the different flow rates: 183 Pa, 333
Pa, 615 Pa and 1018 Pa respectively for 80%, 100%, 115% and 130%. This reveals that the greater the flow rate, less uniform
is the flow at the volute exit, and that the degree of non-uniformity does not increase linearly with the flow rate.
The figure also indicates that for 115% flow rate, the area with negative values is greater than that with positive
values. For 130% it is even higher, with positive values being restricted to a small region in the lower left. Negative values
indicate that the static pressure at the point is smaller than static pressure at the impeller exit.
These results seem contradictory, since one of the objectives of the volute is to transform dynamic pressure into static
pressure. However, it is not contradictory because: 1) the volute receives the flow from impeller; 2) due to the principle of
energy transformation in the impeller, the absolute velocity at impeller exit decreases with the increase in flow rate; 3)
dynamic pressure is a direct function of absolute velocity (Equation 12), so it decreases with increasing flow rate; 4) as a
consequence, part of the static pressure at the impeller exit must be transformed into dynamic pressure in the volute.
The vertical distance between lines “a” and “d” in Figures 7 and 8 shows that the dynamic pressure at the impeller exit
decreased with flow rate.
(12)
Where:
C2 – absolute velocity at impeller exit, in m/s
14Research, Society and Development, v. 10, n. 12, e412101219653, 2021
(CC BY 4.0) | ISSN 2525-3409 | DOI: http://dx.doi.org/10.33448/rsd-v10i12.19653
3.5 Volute loss
According to (Hariharan & Govardhan, 2016) the volute is the least efficient fan component. Using the vertical
distances between lines “a” and “b” the figure 7 shows that the smallest volute loss (127 Pa) occurs for the nominal flow rate.
For smaller and larger, the loss increases progressively, with the highest value (499 Pa) being for the 20% flow rate. A similar
configuration is observed in Figure 8, where it is possible to deduce how much of the total pressure at the impeller exit was
used to overcome the volute loss.
The volute loss behavior is coherent with the fan's performance curve (Figure 3); there is a direct relationship between
them so the performance behavior follows that of the volute loss.
4. Conclusion
This work performed a CFD simulation of a centrifugal fan. The dimensionless characteristic curves obtained were
coherent with centrifugal fans. The 80% efficiency approximately was maintained for flow rate from 80% to 100% of the
nominal.
The static pressure and velocity distributions for the nominal point showed behavior consistent with that expected by
turbomachinery theory.
The pressure parcels showed the static and total pressure at impeller and volute exit decreased with flow rate. For the
flow rate higher than nominal the dynamic pressure at impeller exit was not enough to provide dynamic energy necessary for
the fluid to flow after fan exit. There was a transformation of part of the static pressure at impeller exit into dynamic pressure
on volute. Therefore, the static pressure at volute exit was smaller than impeller exit. It caused a deficient static pressure
recovery in the volute, especially for higher than nominal flow rate. The results suggest that increasing the volute width could
improve pressure recovery.
The smallest loss in the volute occurred at the nominal point, and the largest for the smallest flow rate.
The work showed that it is possible to design a centrifugal fan using the one-dimensional theory and CFD simulation
to assess the quality of the design regarding performance, and thus elaborate changes to improve it.
References
Abdelmadjid, C., Mohamed, S. & Boussad, B. (2013). CFD Analysis of the volute geometry effect on the turbulent air flow through the turbocharger
compressor. Energy Procedia, 36, 746-755. https://doi.org/10.1016/j.egypro.2013.07.087.
ANSYS. (2011). CFX Solver theory guide. ANSYS.
Azem, A., Mathis, P., Stute, F., Hoffmann, M., Muller, D. & Hetzel, G. (2018). G. Efficiency increase of free running centrifugal fans through a pressure
regain unit used in an air handling unit. Energy & Buildings,165, 321-327. https://doi.org/10.1016/j.enbuild.2018.01.041.
Danish, S. N., Khan, S. D.-D., Umer, U, Qureshi, S. R. & Ma, C. (2014). Perfomance evaluation of tandem bladed centrifugal compressor. Engineering
Applications of Computacional Fluid Mechanics, 8 (3), 382-295. https://doi.org/10.1080/19942060.2014.11015523.
Derakhshan, S., Yang, S.-S. & Kong, F.-Y. (2012). Theoritical, numerical and experimental prediction of pump as turbine performance. Renewable Energy,
48, 507-513. https://doi.org/10.1016/j.renene.2012.06.002.
Derakhsan, S., Pourmahdavi, M., Abdolahnejad, E., Reihani, A. & Ojachi, A. (2013). Numerical shape optimization of a centrifugal pump impeller using
artificial bee colony algorithm. Computers & Fluids, 81. 145-151. https://doi.org/10.1016/j.compfluid.2013.04.018.
Cabral, E. de M., Souza, J. S. de, Magalhães, H. L. F., Porto, T. R. N., Silva, C. J., Gomez, R. S., Lima, W. M. P. B. de, Lima, E. S. de, & Lima, A. G. B. de.
(2020). Oil-water separation process analysis in hydrocyclone via CFD. Research, Society and Development, 9 (11), e90001110610.
https://doi.org/10.33448/rsd-v9i11.10610.
Fox, R. W., Mcdonald, A.T., Pritchard, P. J. (2003). Introduction to fluid mechanics. John Willey & Sons Inc.
Galloni, E., Parisi, P., Marignetti, F. & Volpe, G. (2018). CFD analyses of a radial fan for electric motor cooling. Thermal Science and Engineering Progress,
8, 470-476. https://doi.org/10.1016/j.tsep.2018.10.003.
15Research, Society and Development, v. 10, n. 12, e412101219653, 2021
(CC BY 4.0) | ISSN 2525-3409 | DOI: http://dx.doi.org/10.33448/rsd-v10i12.19653
Gjeta, A. (2019). Effect of Clearance Gap in Spiral Casing Design of a Centrifugal Fan with Optimized Impellers. European Journal of Engineering and
Technology Research. 4 (9), 181-185. https://doi.org/10.24018/ejers.2019.4.9.1533.
Hariharan, C. & Govardhan, M. (2016). Improving performance of an industrial centrifugal blower with parallel wall volutes. Applied Thermal Engineering,
109 (part A), 53-64. https://doi.org/10.1016/j.applthermaleng.2016.08.045.
Jafarzadech, B., Hajari, A., Alishahi, M. M. & Akbari, M. H. (2011) The flow simulation of a low-specific-speed high-speed centrifugal pump. Applied
Mathematical Modelling, 35, 241-249. https://doi.org/10.1016/j.apm.2010.05.021.
Kim, J. H., Cha, K. H., Kim, K. Y., & Jang, C. M. (2012). Numerical investigation on aerodynamic performance of a centrifugal fan with splitter blades.
International Journal of Fluid Machinery and Systems, 5 (4),168-173. http://dx.doi.org/ 10.5293/IJFMS.2012.5.4.168.
Kuan, Y, D., Huang, J. M., Wong, J. H., Chen, C. Y., Lee, S. M. & Hsu, C. N. (2017). Investigation of the flow and noise distribution on a blower via
integration of simulation and experiments. Journal of Mechanics, 34, 151-158. https://doi.org/10.1017/jmech.2017.36.
Madhwesh, N., Vasudeva, K. & Yaganesh, S. N. (2011). Impeller treatment for a centrifugal fan using splitter vanes – a CFD approach. In Proceedings of the
World Congress on Engineering -WCE 2011, London, U.K.
Menter, F. R. (1994). Two-equation eddy-viscosity turbulence models for engineering applications. AIAA-Journal, 32(8), 1598-1605.
https://doi.org/10.2514/3.12149.
Naik, V. R. & Magdum, V. B. (2018). Design and development of a blower impeller by reverse engineering for noise reduction using CFD. International
Journal of Applied Engineering, 13 (11), 9982-9987.
Nataraj, M. & Ragoth singh, R. (2014). Analyzing pump impeller for performance evaluation using RSM and CFD. Desalination and Water Treatment, 52,
6822-6831. https://doi.org/10.1080/19443994.2013.818924
Panigrahi, D. C. & Mishra, D. P. (2014). CFD simulations for the selection of an appropriate blade for improving energy efficiency in axial flow mine
ventilation fans. Journal of Sustainable Mine, 13 (1), 15-21. https://doi.org/10.7424/jsm140104.
Paramasivam, K., Rajoo, S., Romagnoli, A. & Yahya, W. J., (2017). Tonal noise prediction in a small high speed centrifugal fan and experimental validation.
Applied Acoustics, 125, 59-70. https://doi.org/10.1016/j.apacoust.2017.04.009.
Pereira, E. F., & Gois, L. M. N. (2020). Simulation of an industrial waste treatment tank. Research, Society and Development, 9(4), e180942542.
https://doi.org/10.33448/rsd-v9i4.2542.
Pfleiderer, C. (1952). Turbomachines. Springer-Verlag.
Rosa, H. M. P. & Emerick, B. S. (2020). CFD simulation on centrifugal pump impeller with splitter blades. Revista Brasileira de Engenharia Agrícola e
Ambiental, 24 (1), 3-7. https://doi.org/10.1590/1807-1929/agriambi.v24n1p3-7.
Scheit, C., Karic, B. & Becker, S. (2012). Effect of blade wrap angle on efficiency and noise of a small radial fan impellers – A computational and
experimental study. Journal of Sound and Vibration, 331, 996-1010. https://doi.org/10.1016/j.jsv.2011.10.014.
Sedille, M. (1967). Turbomachines hydrauliques et thermiques. Tome 2. Masson & Cie Éditeurs.
Shojaeerd, M. H., Tahani, M., Ehghaghi, M. B., Fallahian, M. A. & Beglarari, M. (2012). Numerical study of the effects of some geometric characteristics of a
centrifugal pump impeller that pumps a vicous fluid. Computers & Fluids, 60, 61-70. https://doi.org/10.1016/j.compfluid.2012.02.028.
Stepanoff, A. J. (1957). Centrifugal and axial flow pumps: Theory, design and applications. John Wiley & Sons Inc.
Turton, R. K. (1995). Principles of turbomachinery.: Chapman & Hall.
Xiaoran, Z., Yexiang, X., Zhengwei, W., Hongying, L., Soo-hwang, A., Yangyang, Y. & Honggang, F. (2018). Numerical analysis of non-axisymmetri flow
characteristic for a pump-turbine impeller at pump off-design condition. Renewable Energy, 115, 1075-1085. https://doi.org/10.1016/j.renene.2017.06.088.
Wang, T., Wang, C., Kong, F., Gou, Q. & Yang, S. (2017). Theoritical, experimental, and numerical study of special impeller used in turbine mode of
centrifugal pump as turbine. Energy, 130, 473-485. https://doi.org/10.1016/j.energy.2017.04.156.
Zapata, A., Amaris, C., Sagastume, A. & Rodríguez, A. (2021). CFD modelling of the ammonia vapour absorption in a tubular bublble absorber with
NH3/LiNO3. Case Studies in Thermal Engineering, 27, 101311. https://doi.org/10.1016/j.csite.2021.101311.
16You can also read