Last Interglacial sea-level data points from Northwest Europe
←
→
Page content transcription
If your browser does not render page correctly, please read the page content below

Earth Syst. Sci. Data, 14, 2895–2937, 2022
https://doi.org/10.5194/essd-14-2895-2022
© Author(s) 2022. This work is distributed under
the Creative Commons Attribution 4.0 License.

                    Last Interglacial sea-level data points from
                                 Northwest Europe
        Kim M. Cohen1 , Víctor Cartelle2,a , Robert Barnett3 , Freek S. Busschers4 , and Natasha L. M. Barlow2
        1 Department of Physical Geography, Utrecht University, P.O. Box 80.115, 3508TC Utrecht, the Netherlands
              2 School of Earth and Environment, University of Leeds, Woodhouse Lane, Leeds LS2 9JT, UK
                  3 Department of Geography, University of Exeter, Rennes Drive, Exeter EX4 4RJ, UK
             4 TNO Geological Survey of the Netherlands, P.O. Box 80.015, 3508TA Utrecht, the Netherlands
                 a current address: Flanders Marine Institute (VLIZ), InnovOcean site, Wandelaarkaai 7,

                                                 8400 Oostende, Belgium
                                  Correspondence: Kim M. Cohen (k.m.cohen@uu.nl)

                              Received: 31 October 2021 – Discussion started: 10 November 2021
                            Revised: 2 May 2022 – Accepted: 10 May 2022 – Published: 27 June 2022

      Abstract. Abundant numbers of sites and studies exist in NW Europe that document the geographically and
      geomorphologically diverse coastal record from the Last Interglacial (Eemian, Ipswichian, Marine Isotope Stage
      5e). This paper summarises a database of 146 known Last Interglacial sea-level data points from in and around
      the North Sea (35 entries in the Netherlands, 10 Belgium, 23 in Germany, 17 in Denmark, 9 in Britain) and the
      English Channel (24 entries for the British and 25 for the French side, 3 on the Channel Isles) believed to be a
      representative and fairly complete inventory and assessment from ∼ 80 published sites. The geographic distri-
      bution (∼ 1500 km SW–NE) across the near field of the Scandinavian and British ice sheets and the attention
      paid to relative and numeric age control are assets of the NW European database. The research history of Last
      Interglacial coastal environments and sea level for this area is long, methodically diverse and spread through re-
      gional literature in several languages. Our review and database compilation effort drew from the original regional
      literature and paid particular attention to distinguishing between sea-level index points (SLIPs) and marine and
      terrestrial limiting points. We also incorporated an updated quantification of background rates of basin subsi-
      dence for the central and eastern North Sea region, utilising revised mapping of the base Quaternary, to correct
      for significant basin subsidence in this depocentre. As a result of subsidence, lagoonal and estuarine Last Inter-
      glacial shorelines of the Netherlands and the German Bight are preserved below the surface. In contrast, Last
      Interglacial shorelines along the English Channel are encountered above modern sea level.
         This paper describes the dominant sea-level indicators from the region compliant with the WALIS database
      structure and referenced to original data sources (https://doi.org/10.5281/zenodo.6478094, Cohen et al., 2021).
      The sea-level proxies are mostly obtained from locations with good lithostratigraphic, morphostratigraphic and
      biostratigraphical constraints. Most continental European sites have chronostratigraphic age control, notably
      through regional pollen association zones with duration estimates. In all regions, many SLIPs and limiting points
      have further independent age control from luminescence, uranium series, amino acid racemisation and electron
      spin resonance dating techniques. Main foreseen usage of this database for the near-field region of the European
      ice sheets is in glacial isostatic adjustment modelling and fingerprinting Last Interglacial ice sheet melt.

Published by Copernicus Publications.
2896                                                               K. M. Cohen et al.: Last Interglacial sea-level data points

1   Introduction                                                  fluenced the depth of preservation, surveying and mapping
                                                                  strategies and the taphonomy characteristics of typical sites.
Near-field records of Last Interglacial (LIG; ∼ 129–116 ka;       In the southern North Sea coastal region (e.g. the Nether-
within Marine Isotope Stage (MIS) 5e) sea level are critical      lands, NW Germany and SW Denmark) and their offshore
for establishing improved reconstructions of past ice sheets,     areas, key sites are many-metres-thick infills of topographic
constraining models of solid Earth processes and fingerprint-     depressions in deglaciated terrain, between the maximum
ing the source of ice sheet melt (Dutton et al., 2015; Long       ice margins of the Saalian glaciation (MIS 6) and the Last
et al., 2015). However, the near-field LIG sea level has re-      Glacial (Fig. 1) (e.g. Zagwijn, 1983; Höfle et al., 1985; Streif,
ceived comparatively little attention compared to the far field   2004; Beets et al., 2005; Konradi et al., 2005). Along the
due to the challenges of dating estuarine sequences prior to      English Channel many LIG sites comprise flights of raised
radiocarbon chronologies and the complications of regional        beaches, e.g. West Sussex coastal plain, southern England
glacial isostatic adjustment (GIA). The main aim of this pa-      (Bates et al., 2010) and Cotentin, and northwestern France
per is to describe a standardised database of geological sea-     (Coutard et al., 2006). Along both the North Sea and the
level proxies, compiled using the tools available through the     English Channel, the mouths of rivers record transgressed
World Atlas of Last Interglacial Shorelines (WALIS) project       palaeovalleys and provide opportunities to constrain the re-
for Northwest (NW) Europe, in particular around the North         gional LIG sea-level highstand (e.g. Antoine et al., 2007; Bri-
Sea and English Channel region. This is a location that is        ant et al., 2012; Bogemans et al., 2016; Peeters et al., 2016).
near an extensive MIS-6 Eurasian ice sheet (e.g. Svendsen et      In the interest of brevity, a summary of the history of research
al., 2004; Ehlers and Gibbard, 2004; Lambeck et al., 2006;        in the study area is provided in Appendix A.
Lang et al., 2018) and has an extensive history of palaeoen-         This paper sets out to describe the SLIPs and supporting
vironmental research (e.g. Dixon, 1850; Harting, 1874; Van        marine limiting and terrestrial limiting data points (Table 2)
Leeuwen et al., 2000).                                            extracted from the regional literature, evaluated and stored
   The dataset documented in this paper comes from sev-           in the WALIS database according to the prescribed interface
eral countries and physiographically diverse lengths of LIG       and formats. This paper first covers the North Sea, then the
coastline, including tectonic depocentre areas with signifi-      English Channel region. This regional division is also some-
cant background basin subsidence (North Sea basin). The           what reflected in the descriptions of SLIP types, vertical land
research history in this region is long, going back to the        motion (VLM) and age assignments (various dating meth-
19th century, when marine molluscan biostratigraphic evi-         ods). At the end we provide some reflections on future re-
dence first identified the buried Last Interglacial equivalent    search challenges in this region.
of the North Sea (Harting, 1874; Lorié, 1906; Nordmann,
1928) and former shorelines along the south coast of Eng-
                                                                  2     Sea-level indicators and chronostratigraphy
land (Dixon, 1850; Reid, 1892, 1893, 1898). Many of the
sites documented here were studied 50+ years ago by ex-           2.1    Regional context
perts in microfossil and sedimentological analysis rather than
with a focus on establishing sea-level index points (SLIPs)       Considerable spatial variation exists along the coastline of
under now well-developed frameworks (Shennan, 1982; van           the present North Sea and English Channel (Fig. 1), as it
de Plassche, 1986; Hijma et al., 2015; Rovere et al., 2016),      did during the LIG (regionally known as Eemian and Ip-
meaning that data considered essential for modern sea-level       swichian; Table 1). Extensive lowland coastal plains with
databases (e.g. elevation surveys) are missing in some in-        back-barrier tidal environments, marshes and lagoons dom-
stances. Age constraints are also a challenge. In NW Europe,      inate the Belgian–Dutch–German–Danish stretch of North
age control on LIG estuarine deposits typically relies on rel-    Sea coast. These are interrupted by headlands of Saalian-age
ative dating, based on micro- and macrofossil biostratigra-       ice-marginal morphology as well as by estuaries and deltas
phy (notably pollen; Zagwijn, 1961, 1996), and amino acid         of the main rivers: Scheldt, Meuse, Rhine, Ems, Weser and
racemisation (AAR) methods. Although the biostratigraphic         Elbe. The northern English and East Anglian coasts of the
schemes allow us to resolve relative ages within the inter-       North Sea have cliffs comprising Middle Pleistocene till ac-
glacial (i.e. early, middle and late), tying them to an abso-     cumulations over Cretaceous chalk bedrock. In SE England,
lute chronology has to rely on chronostratigraphical correla-     the Thames Estuary is flanked by a coastal plain with smaller
tions to other parts of Europe and the North Atlantic. More       estuaries and Paleogene outcrops to the north and smaller-
recently studied or revisited sites may have luminescence-        estuary-interrupted chalk cliffs to the south. The connection
derived or U-series-derived numeric age constraints, which        between the North Sea and English Channel is a transgressed
improves the dating independence.                                 gorge, eroded repeatedly since the Middle Pleistocene by
   The thickness and nature of the LIG coastal geomorphol-        lowstand periglacial and proglacial outwash rivers (Gibbard,
ogy and sedimentary sequences in NW Europe vary con-              1995; Bridgland and D’Olier, 1995; Gupta et al., 2007; Tou-
siderably. Differences in geological–geomorphological set-        canne et al., 2010; Mellett et al., 2013). The British and
tings along and between the large stretches of coast have in-     French coasts on either side of the English Channel alternate

Earth Syst. Sci. Data, 14, 2895–2937, 2022                                        https://doi.org/10.5194/essd-14-2895-2022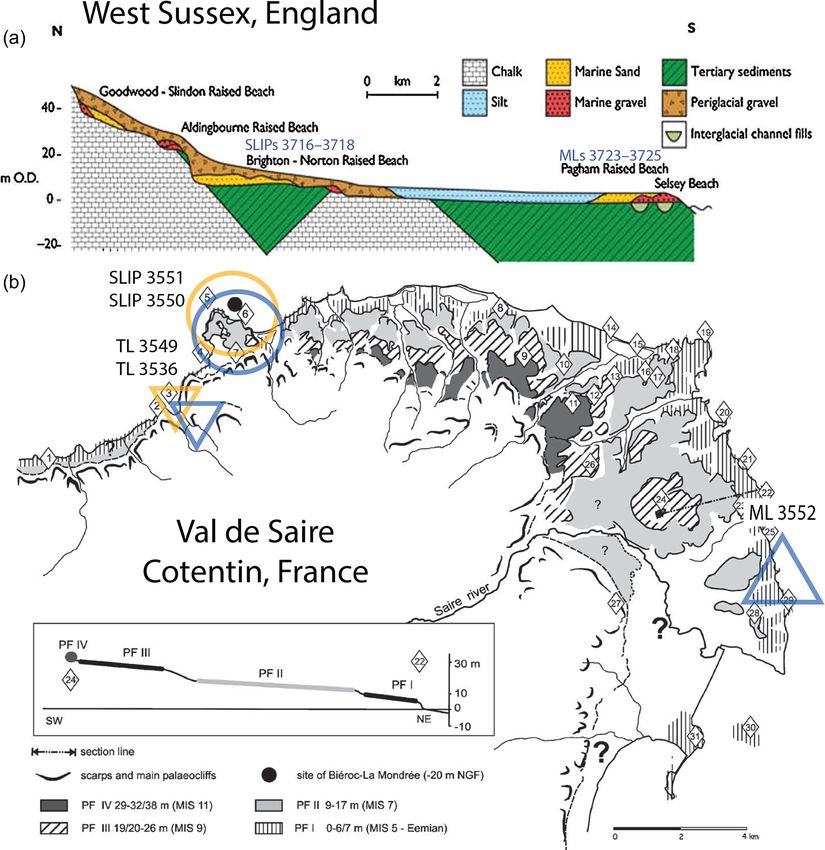
K. M. Cohen et al.: Last Interglacial sea-level data points                                                                                 2897

Figure 1. Overview of study area (Northwest Europe) with data points (legend groups; cf. Sect. 2) showing location of all data points
entered into WALIS as part of this work. Penultimate (Saalian, MIS 6, PGM) and Last Glacial maximum (LGM) ice limits compiled from
regional studies (Ehlers et al., 2004; Busschers et al., 2008; Moreau et al., 2012; Lang et al., 2018; Gibbard et al., 2018; Cartelle et al., 2021)
and adjoining super-regional overviews (Ehlers and Gibbard, 2004; Batchelor et al., 2019). Pleistocene depocentre in the North Sea further
detailed in Sect. 3.3. Axis through North Sea and English Channel informs the presentation of data in Figs. 4 and 5. Selection of topographic
names from text included, offshore sites with informal short IDs from source papers. Bathymetry and DEM backdrop: WMS service of
EMODnet Bathymetry Consortium (2020), which incorporates land data © OpenStreetMap contributors 2020. Distributed under the Open
Data Commons Open Database License (ODbL) v1.0.

between estuaries (Somme, Seine, Sélune, Rance) and em-                     the UK (Ehlers and Gibbard, 2004). Furthermore, long-term
bayments rimmed with cliffs and gravelly and sand beaches,                  basin subsidence of the area means that in locations onshore
in a variety of substrates (Mesozoic, Palaeozoic, crystalline).             and offshore the Netherlands and NW Germany (depocentre
Bedrock islands off the main coasts, such as the Isle of Wight              indicated in Fig. 1), even the shallowest preserved LIG sea-
and Channel Islands, were also islands in the LIG (Sect. 4).                level archives are encountered several metres below modern
   There are also notable differences between LIG coastal                   mean sea level (MSL), below their elevation of deposition.
geomorphology and that of today. The broad position of                      By comparison, western North Sea and English Channel LIG
estuaries and cliff beach settings along the English Chan-                  features along the coast of the UK and France are gener-
nel and SW North Sea can be regarded as essentially the                     ally preserved at elevations higher than present sea level. The
same between the LIG and Holocene (Fig. 1). In contrast,                    combination of the “fresh” MIS-6 glaciated landscape and re-
the configuration of lagoons, river mouths and morainic is-                 gional basin subsidence (Cohen et al., 2014, 2017) strongly
lands in the Dutch and the German Bight sectors of the North                affects the way deposits can be geologically and palaeogeo-
Sea, critically in the area between the Saalian maximum and                 graphically mapped, reconstructed and studied (e.g. mainly
Last Glacial limits, is relatively different (Fig. 1). In the               from boreholes versus mainly from outcrops). This also im-
eastern North Sea region the Eemian transgression flooded                   pacts the extent over which deposits tend to be preserved
a paraglacial landscape left after the Saalian deglaciation,                (extensive basin-central patches versus small pockets along
whereas the MIS-6 glaciation did not extend as far south over               the rims of a system) and what relative age controls and dat-

https://doi.org/10.5194/essd-14-2895-2022                                                    Earth Syst. Sci. Data, 14, 2895–2937, 2022

2898                                                                     K. M. Cohen et al.: Last Interglacial sea-level data points

Table 1. Global and regional time division schemes with details of the Eemian/Last Interglacial period.

ing opportunities apply, resulting in regional variability in the       tation of marine terraces and raised beaches (from setting A)
dating techniques applied (Table 2).                                    is kept short as these SLIP types had been introduced and
                                                                        used in earlier WALIS publications (e.g. Rubio-Sandoval et
                                                                        al., 2021; Cerrone et al., 2021, in this special issue; and Ro-
2.2    Overview of indicator types
                                                                        vere et al., 2016). SLIP types from estuarine river mouth,
A wide range of sea-level indicators are present in NW                  lagoonal and incised valley alluvial settings and the study-
European literature recording the LIG sea-level history in              area-specific glaciogenic isolation basins (i.e. settings B and
this region. Most of these studies constrain relative sea-level         C) are documented in Sect. 2.2.1–2.2.6. All these SLIP types
(RSL) elevations by combining sedimentary properties, fos-              are widely used in Holocene RSL databases; their introduc-
sil content and architectural evidence (Fig. 2). In the scope           tion in the LIG context and documentation here are mainly a
of the special issue and the WALIS database format we re-               formalisation for WALIS purposes.
viewed the literature and categorised the findings to WALIS-               The decision-making workflow in Table 3b shows that in
standardised sea-level indicator types (listed in Table 3a and          addition to the specifically added types (salt marsh, basal
further documented below), with particular attention to sub-            peats, drowned valley floor, estuarine terrace, isolation basin;
merged valleys and further alluvial coastal plain settings              i.e. WALIS type IDs 17–20 and 37), we also occasionally
from which series of SLIPs in lateral and vertical sequence             use more generic, readily available “lagoonal deposits” and
can constrain sea level through multiple stages of the inter-           “shallow or intertidal fauna” classifications (WALIS type IDs
glacial. In Table 3b we summarise the decision-making pro-              15 and 33), though as far less favoured options. Table 3b also
cess of which geological observations become what SLIP                  outlines how to differentiate sites and samples as a marine or
types and the priority that is given in cases where a site could        terrestrial limiting data point rather than a SLIP. For example,
be classified as multiple SLIP types.                                   we classified so-called “regressive peat beds” from the late
   We employ 10 SLIP types, five of which were already part             LIG that previous literature has used as sea-level constraints
of the database set-up (“WALIS generic”) and five of which              instead as late interglacial terrestrial limiting data points (Ta-
have been added by us during our literature review (“paper              ble 2).
author added”). The SLIP types are split over three main set-
tings (labelled A, B and C in Fig. 2 and Table 3b). Documen-

Earth Syst. Sci. Data, 14, 2895–2937, 2022                                               https://doi.org/10.5194/essd-14-2895-2022
K. M. Cohen et al.: Last Interglacial sea-level data points                                                                                                                      2899

Table 2. NW Europe WALIS data point totals, split by region.

   Region                                        Main age control                                                      Last Interglacial                   Older interglacials
                                                                                                             SLIPs        Marine     Terrestrial   SLIPs       Marine    Terrestrial
                                                                                                                         limiting      limiting               limiting     limiting
                                                                                                                           points        points                 points       points
   North Sea
   N Netherlands (NL)                            Glaciogenic underlain∗ , pollen                                 12            12            11       2              0            0
   Central NL lagoon, Rhine estuary              association zones (PAZs), Lusitanian biota,
                                                 optical stimulated luminescence (OSL), AAR
   Belgium (B)                                   PAZs, OSL                                                         8             1            1       1              0            0
   Scheldt estuary
   NW France (F)                                 Thermoluminescence (TL), OSL                                                                         1              0            0
   Calais
   German Bight (GER)                            Glaciogenic underlain∗ ,                                        11              4            5
   Wadden Sea, Elbe estuary                      PAZs
   SW Denmark (DK)                               Glaciogenic underlain∗ , PAZs,                                    6             2            3
   Tønder, Esbjerg                               foraminifera association zones (FAZs),
                                                 AAR, Lusitanian biota
   N Denmark (DK)                                Glaciogenic under- and overlain,                                  0             6            0
   Skagen, Anholt                                FAZs, Lusitanian biota, AAR
   SW Baltic (GER)                               Glaciogenic underlain∗ and overlain,                              0             3            0
   Kiel                                          FAZs, PAZs, Lusitanian biota
   Northern England (UK)                         Glaciogenic underlain∗ and overlain                               2             0            1
   East Anglia (UK)                              Biostratigraphic (macro- and microfossil),                        1             2            1       1              0            2
   Norfolk, Suffolk                              AAR
   Thames Estuary (UK)                           Biostratigraphic (macro- and microfossil),                        0             0            2
   London, Mersea                                AAR
   English Channel
   Hampshire and West Sussex (UK)                OSL, AAR                                                         3              6            5       0              5            4
   Offshore (UK)                                 OSL                                                              0              1            1
   Devon (UK)                                    Speleothem U series                                              1              0            0
   Normandy (F): Cotentin                        Morphostratigraphy, OSL, TL                                     10              1            3
   Channel Islands (UK): Jersey                  Morphostratigraphy, U series                                     3              0            0
   NE Brittany (F)                               Morphostratigraphy, OSL                                          4              1            1
   Further west
   SW Wales (UK)                                 AAR                                                               3             0            0
   W Cornwall (UK)                               AAR                                                               3             0            1
   W and S Brittany (F)                          Morphostratigraphy                                                5             0            0
   TOTALS                                                                                                        72            39            35
∗ One can commonly separate the Eemian from older interglacial deposits because they directly overlie MIS-6 glaciogenic sediments.

2.2.1      Indicator type: drowned valley floor                                                     ish, estuarine in-wash. It grades upward into established
                                                                                                    tidal, brackish to saline, full estuarine facies. See Hijma
This indicator type relates to a contact between terrestrial de-                                    and Cohen (2011, 2019) for Holocene examples and Sier et
positional facies (below) and subaqueous depositional facies                                        al. (2015) and Peeters et al. (2016, 2019) for LIG examples.
(above) and provides constraints for marked sea-level-rise-                                            The transgressive contact has a direct relationship to the
created SLIPs (e.g. Fig. 2b). The terrestrial facies is typ-                                        point of estuarine inundation and is therefore a SLIP. The
ically a decimetre-thick organic river mud with immature                                            secondary contact within the terrestrial facies can be used as
palaeosol, if not a flood-basin peat bed, with further fluvial                                      a terrestrial limiting point. Tides at the estuary mouth and
facies below. The subaquatic facies is typically a decimetre–                                       their inland propagation, amplification and dissipation do af-
metre-thick organic mud, rich in fine and coarse detrital or-                                       fect estuarine-type SLIPs. Herein the estuary in a freshly
ganic matter; rich in silt admixture; bearing tidal indica-                                         drowned “underfilled” lowland valley differs (e.g. Martinius
tors; and bearing microfossil indicators of occasional brack-

https://doi.org/10.5194/essd-14-2895-2022                                                                                  Earth Syst. Sci. Data, 14, 2895–2937, 2022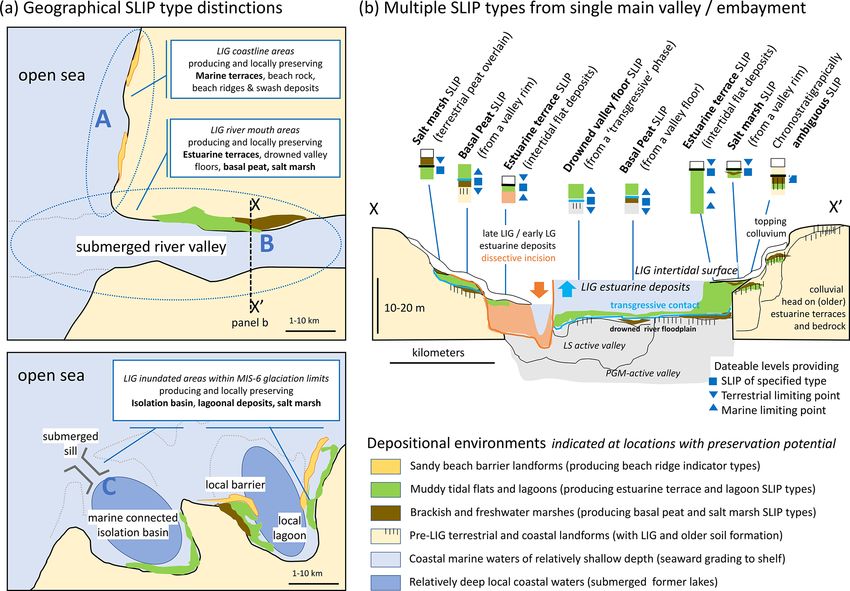
2900                                                                       K. M. Cohen et al.: Last Interglacial sea-level data points

Figure 2. Schematic map (a) and section (b) illustrating the geographical and sedimentary distinctions between the various SLIP types used
for NW Europe in the WALIS database. In panel (a) three main groups of SLIPs are distinguished: A – coastline areas facing open sea, B –
estuaries filling drowned river valleys, and C – glacially inherited marine-connected isolation basins and embayments. In panel (b) multiple
SLIP types as well as terrestrial and marine limiting data points are summarised from local outcrops and boreholes. This includes SLIPs
which record RSL rise, SLIPs which record stable sea level, and SLIPs which record RSL fall causing dissection and incision (orange arrow)
within the estuarine cross-section. The symbology introduced for SLIP, terrestrial limiting and marine limiting points matches those in Fig. 1
and Figs. 4 and 5. Drowning sequences (e.g. submerged valley floors or basal peats, spanning a local or regional transgressive contact,
common from early to middle interglacial phases in NW Europe) below the potential SLIP position often record a further terrestrial limiting
data point. In contrast, estuarine terrace SLIPs typically have marine limiting indicators from facies underlying the SLIP and are common
from middle–late and post-interglacial phases (Table 1).

and Van den Berg, 2011) from that typically observed in                  2.2.2    Indicator type: basal peats
later-stage filled estuaries. In wide valleys experiencing rel-
atively rapid postglacial transgression, tidal amplification             Basal peats are terrestrial deposits encountered along the
(owing to estuary funnelling) is not yet a major factor and              base of transgressive-to-highstand depositional systems and
may in fact be dampened inland. On the other hand, in inland             in submerged position on inner shelves (e.g. Jelgersma, 1979;
parts of the estuary riverine discharge may impose a gradient            Hanebuth et al., 2000). Using basal peats as RSL indicators
and lift water levels to the same altitudes and above those of           became widely established in Holocene sea-level commu-
high tides in the estuary mouth (Van de Plassche, 1995; Vis              nities in the 1970s (Van de Plassche, 1986), both onshore
et al., 2015). For these reasons, the “drowned valley floor”             and offshore. Jelgersma (1961) and Van de Plassche (1982,
base-estuarine indicator type is kept separate from the “basal           1995) provide classic Holocene reference examples for the
peat” and “estuary terrace” indicator types (Sect. 2.2.2 and             Netherlands. Likewise, it is useful as an RSL indicator in in-
2.2.4; Table 3b).                                                        terglacial coastal settings (e.g. Zagwijn, 1983; Streif, 1990,
   The reference water level (RWL; Woodroffe and Barlow,                 2004; Konradi et al., 2005), especially when combined with
2015) definition for this indicator is the midpoint between the          palynological investigations to provide time control on the
highest astronomical tide (HAT) and mean sea level (MSL,                 position within the interglacial (see Sect. 2.3).
i.e. half-tide). The indicative range is the interval between               Basal peats are submerged terrestrial peats (swamp, fen,
HAT and MSL.                                                             carr, marsh) overlain by subaqueous deposits (tidal, estuarine
                                                                         or lagoonal (organic) muds), allowing the identification of a

Earth Syst. Sci. Data, 14, 2895–2937, 2022                                                 https://doi.org/10.5194/essd-14-2895-2022
K. M. Cohen et al.: Last Interglacial sea-level data points                                                                               2901

Table 3. (a) Types of RSL indicators used in the NW Europe database. (b) Practical scheme for SLIP type choice, as developed during data
entry.

           (a)
           Name of RSL indicator                  Indicator reference(s)                      ID in    Region and
                                                                                              WALIS    no. of occurrences
           WALIS generic, not documented here – see WALIS supporting literature, including other Earth System Science Data (ESSD)
           special issue papers
           Marine terrace                         Pirazzoli (2005),                           7        France (12 LIG, 3 older), UK (1)
                                                  Pedoja et al. (2011),
                                                  Rovere et al. (2016)
           Beach deposit or beach rock            Mauz et al. (2015),                         11       France (6 LIG, 1 older),
                                                  Rovere et al. (2016)                                 UK (4 LIG, 9 older)
           Beach ridge,                           Otvos (2000),                               12, 29   France (1), UK (2 LIG, 1 older)
           Beach swash deposit                    Rovere et al. (2016)
           Lagoonal deposit                       Rovere et al. (2016),                       15       The Netherlands (3 LIG, 1 older)
                                                  Zecchin et al. (2004)
           Paper author added as part of this study, documented by Sect. 2.2.1 to 2.2.5
           Drowned valley floor                   Vis et al. (2015),                          17       The Netherlands (1), Denmark
           (transgressive contact)                Peeters et al. (2016, 2019)                          (1)
           Basal peat (non-mangrove)              Jelgersma (1960),                           18       The Netherlands (3),
                                                  Van de Plassche (1982),                              Germany (3), Denmark (2)
                                                  Zagwijn (1983),
                                                  Hijma and Cohen (2019)
           Isolation basin (marine connection)    Zagwijn (1983),                             19       The Netherlands (3)
                                                  Van Leeuwen et al. (2000),
                                                  Beets et al. (2006)
           Estuarine terrace (preserved tidal     De Moor and De Breuck (1973),               20       Belgium (9 LIG, 1 older), Ger-
           flat surface)                          Zagwijn (1983),                                      many (5),
                                                  Peeters et al. (2016, 2019)                          The Netherlands (2 LIG, 1 older)
           Salt marsh (various subtypes)          Engelhart and Horton (2012)                 37       UK (2)
           WALIS generic, but region-specific information provided in Sect. 2.2.6
           Shallow or intertidal marine fauna     Subregion-specific                          33       Germany (3), Denmark (3),
                                                  references in Sect. 2.2.6                            UK (3)

regional transgressive surface at the drowning contact (e.g.                    context that level becomes a terrestrial limiting point. In ar-
Hijma and Cohen, 2011, 2019). Basal peats occur over mul-                       gued cases a limiting point may be upgraded to a SLIP if
tiple substrates and palaeosurfaces, such as those provided                     it formed along the inland rim of a transgressive lagoonal
by valley floors and valley rims (e.g. Fig. 2b), but also over                  or lagoonal-deltaic environment (e.g. Van de Plassche, 1986;
interfluve highs (regional relief) as well as on the flanks of                  Nelson, 2015). To do so, one should assess the palaeogeo-
small-scale isolated local relief within broader coastal deltaic                graphical situation of the basal peat data point or swarm of
plains. The encountered peaty terrestrial facies is typically a                 data points (Vis et al., 2015; Hijma and Cohen, 2019).
few decimetres thick (in a compacted state; cf. Greensmith                         The RWL of this indicator for swamp basal peats is
and Tucker, 1986; Brain, 2015). Depending on lateral and                        GWL − 0.1 m and for marsh basal peat is GWL − 0.5 m
vertical position (Fig. 2b) the basal peat may overlie a surface                (GWL stood at 0.1 and 0.5 m, respectively, above the level
with just an immature floodplain palaeosol (see Sect. 2.2.1,                    where the peat formed). The indicative ranges for swamp and
“Indicator type: drowned valley floor”) or a surface with a                     marsh peat GWL and derived sea-level indicators are 0–0.2
more developed palaeosol (e.g. interfluve settings).                            and 0.3–0.8 m, respectively, above the level where the peat
   The very top of a basal peat bed indicates submergence                       formed. See Sect. 3.2 for additional compaction corrections.
of a swamp and marsh, and this level may be taken as a
SLIP. The very base of basal peat bed indicates a palaeo-
groundwater level (GWL), and in a sea-level reconstruction

https://doi.org/10.5194/essd-14-2895-2022                                                      Earth Syst. Sci. Data, 14, 2895–2937, 2022
2902 K. M. Cohen et al.: Last Interglacial sea-level data points
Table 3. Continued.
(b)
Start Select whether you are assessing NW European data points from a setting best characterised as
A – raised beach and marine terraces coastline (typical along the English Channel coast);
B – estuarine river mouth, lagoonal or incised valley (typical along the North Sea coast),
C – some other situation (region-specific).
Setting A Are beach rock, beach ridge deposits and/or beach ridge swash deposits recognised?
If yes → WALIS SLIP type 11, 12 and 29. Direct dating control options: OSL and AAR; indirect: bracketing terrestrial deposits
If no → WALIS SLIP type 7: marine terrace morphostratigraphic feature. Indirect dating control may come from inset terrestrial
deposits.
Setting B Are salt marsh deposits described (usually based on sedimentology and biota – microfossils and mollusca)?
If yes → WALIS SLIP type 37. Direct dating control options: pollen; indirect: AAR and pollen on bracketing deposits
Is freshwater basal peat described? This is terrestrial peat (macro- and microfossils) overlain by subaqueous deposits
If yes → WALIS SLIP type 18. Direct dating: pollen; indirect: OSL, AAR, U series on bracketing deposits
Are intertidal or supratidal facies described? Usually based on sedimentology and biota (microfossils and mollusca)
If yes → WALIS SLIP type 20 lithostratigraphic feature. Direct dating: OSL, AAR; indirect: bracketing deposits
Are subtidal lagoonal facies described? Usually based on sedimentology and biota (microfossils and mollusca)
If yes → WALIS SLIP type 15 lithostratigraphic feature. Direct dating: OSL, AAR; indirect: bracketing deposits
Are shallow marine fossils described in the deposits and not in a reworked or otherwise displaced context?
If yes → consider WALIS SLIP type 33, specifying water depth based on biota;
alternatively, treat as marine limiting data point using conservative (shallowest) water depth (= no SLIP)
Is the material a terrestrial peat overlying nondescript shallow marine deposits?
If yes → consider treating the site as a terrestrial limiting data point with the age of the peat (= no SLIP)
Setting C Is the site a transgressed glaciogenic lake (tongue basin, tunnel valley) and can be treated as an isolation basin?
If yes, do the deposits otherwise classify as one of the options under B?
If yes again → treat as setting B deposits, and potential SLIPs are from after the moment of marine connection
If no → WALIS SLIP type 19. Dating control options: sequence deepest part basin, across connection moment
Are shallow marine fossils described in the deposits and not in a reworked or otherwise displaced context?
If yes → consider WALIS SLIP type 33 specifying water depth based on biota;
alternatively, treat site as marine limiting data point using the most conservative (shallowest) water depth (= no SLIP);
alternatively, browse WALIS’ catalogue of SLIP types developed for other regions, and consider specifying a new type.
2.2.3 Indicator type: isolation basin (Zagwijn, 1983; De Gans et al., 2000), which means addi-
tional uncertainty as to their elevation must be considered.
Isolation basins are used extensively in Holocene sea-level Our WALIS database entries have registered the lake cen-
studies in higher-latitude coastal environments, making use tre core location as coordinates, and note fields mention sep-
of the prominent occurrence of lakes in freshly deglaciated arately where the paired sill level is positioned. The RWL
environments and the ecological sensitivity of such water definition (midpoint between HAT and MSL) and indicative
bodies when connecting and disconnecting from the sea (e.g. range are linked to the sill location and include the uncer-
Sundelin, 1917; Shennan et al., 2005; Long et al., 2011). In tainty in sill level elevation. Water depth of the lake is irrele-
the North Sea area, substantial lakes formed when ice sheet vant in this application.
cover from the penultimate glaciation disintegrated (during
MIS 6). The period at which these lakes connected to the 2.2.4 Indicator type: estuarine terrace
North Sea and transformed into highstand marine embay-
ments has been a primary constraint on the relative timing This indicator type is introduced as a variant of the marine
of the Eemian transgression (e.g. Zagwijn, 1983). The re- terrace and raised beach entries (Table 3) as used elsewhere
constructed elevation of lake sills (the lowest point of the in the WALIS database. This allows one to assign a different
basin rim; Fig. 2b) provides the elevation of a SLIP of this indicative meaning to elevations sampled from estuarine ter-
type, whereas the contact between lacustrine environment races where the “flat” surfaces are usually formed in facies
(lower) and brackish marine environment (upper) established bearing intertidal sedimentological indications (alluvial ter-
in the central part of a basin is where age control is obtained. races) than that assigned to marine terraces that are flattened
Ideally the sill of an isolation basin is formed of unmodi- due to abrasion processes (straths). A basic difference with
fied bedrock (Long et al., 2011). In the North Sea case, it is the marine terraces is the orientation “across” and “along”
formed by glacial diamicton and/or glaciotectonised ridges that of the coastline (Fig. 2, Table 3b: setting A vs. setting B).
Earth Syst. Sci. Data, 14, 2895–2937, 2022 https://doi.org/10.5194/essd-14-2895-2022K. M. Cohen et al.: Last Interglacial sea-level data points 2903
A further difference is the opportunity to tie in estuarine ter- portunities to narrow down the RWL and the indicative range
races with fluvial and terrestrial units and this way (Zagwijn, of some of these SLIPs.
1983; Peeters et al., 2016) recognise dissective incision asso-
ciated with sea-level fall (Fig. 2b). Paraphrasing the marine 2.2.6 Indicator type: shallow or intertidal marine fauna
terrace description (Pirazzoli et al., 2005), it considers “any
relatively flat surface of estuarine origin”. In the estuarine This generic SLIP indicator type entry in WALIS consid-
case, the flatness of the abandoned surface is not so much due ers palaeobiologically identified marine fauna that can be
to wave action and storm swash, but more due to intertidal associated with very shallow water and/or intertidal en-
and supratidal flooding just prior to terrace abandonment. For vironments, especially where fossilised “in viva”. It was
the seaward portions of estuarine terraces, the RWL defini- used when sedimentary and morphological identifiers are not
tion is the midpoint between HAT and MSL, and the indica- available and where sites did not convincingly fall into one
tive range stretches from HAT to MSL. In the landward direc- of the categories listed above (Table 3b). In Danish contexts
tion, estuarine terraces grade to riverine terraces and former foraminifera and diatom assemblages have been used as wa-
floodplains that provide terrestrial limiting points rather than ter depth and current regime biotic indicators in Eemian shal-
SLIPs. Examples include the Balgerhoeke (Heyse, 1979; IDs low marine beds (e.g. Konradi, 1976; Konradi et al., 2005;
339, 340; Scheldt: middle LIG, inland “high stand”) and Pet- Van Leeuwen et al., 2000; Beets et al., 2006). The oth-
ten sites (Zagwijn, 1983; ID 146; Rhine: late LIG, seaward erwise most typical biotic indicators in the North Sea are
“regressive”). shells of common intertidal mollusca; for example Ceras-
toderma edule (also known as Cardium) and Scrobicularia
2.2.5 Indicator types: salt marsh (various subtypes)
plana are very common intertidal species in the North Sea,
in Holocene and LIG deposits alike. Macoma balthica and
Salt marshes have been used extensively in Holocene sea- Spisula truncata are also frequently encountered (and used
level research as their elevation and position are directly con- for AAR characterisation; Miller and Mangerud, 1985; Mei-
trolled by the tidal elevation and therefore can be directly jer and Cleveringa, 2009; Demarchi et al., 2011). In deeper
related to a reference water level (Engelhart and Horton, waters of the offshore North Sea, Skagerrak and SW Baltic,
2012; Shennan et al., 2018; Barlow et al., 2013). The indi- the common species are Arctica islandica (also known as
cator type differs from “basal peat” and “estuarine tidal flat” Cyprina) and Turritella communis. In the English Channel,
types because the study of microfossils allowed it to be iden- foraminifera Elphidium sp. and Ammonia sp. are common
tified as a coastal salt marsh specifically. The identification of intertidal indicators (e.g. Bates et al., 2010). Some of these
palaeo-salt marsh is usually through the identification of salt- species (“Lusitanian components”) in the LIG extended their
marsh-specific taxa such as the pollen of Plantago maritima common presence into the North Sea and the SW Baltic too
and Triglochin (Gehrels, 1994); the presence of salt marsh (e.g. Madsen et al., 1908; Miller and Mangerud, 1985; Fun-
foraminifera such as Jadammina macrescens, Miliammina der et al., 2002; Meng et al., 2022), whereas in the Holocene
fusca and Trochammina inflata (Gehrels, 2000; Edwards and they did not (or to a far more limited extent). Examples
Horton, 2000); and brackish water diatoms and ostracods are Venerupis senescens (Tapes aurea (var. eemensis), Pa-
(Penney, 1987; Zong and Horton, 1998; Barlow et al., 2013). phia aurea, Amygdala), Bittium sp. and Cardium exiguum.
Such microfossils cover a limited elevation range from HAT Nolf (1973), Miller and Mangerud (1986: their part II), Mei-
to MSL and hence make palaeo-salt marshes an excellent jer and Preece (1995), Wesselingh et al. (2010), and Meijer et
SLIP. Where sedimentation could keep up with the rate of al. (2021) are illustrative biota-oriented studies. This means
RSL change, salt marsh may be preserved at the transgres- that literature-reported molluscan faunas hold both “verti-
sive or regressive boundaries often between freshwater peats cal” indicative meaning as well as “age” chronostratigraphic
and estuarine silts and clays. Microfossil sampling resolu- meaning.
tion is often coarse in LIG estuarine sediments (> 5–10 cm For this type, RWL and the indicative range are based on
intervals), and coastal salt marsh deposits may be missed be- the upper and lower limits of living modern analogue faunas
tween samples. Therefore, there are only two explicit occur- (the midpoint and the interval between, respectively).
rences in the LIG salt marsh SLIPs within the NW Euro-
pean database. A number of sites classified as “basal peat” 2.3 Eemian chronostratigraphy
SLIPs may well be overlain by fine-grained marine sedi-
ments that could be salt marsh. Also several “estuarine ter- Where U-series or OSL dates were reported, this age infor-
race tidal flat” sites are reported to have been overlain by salt mation was inserted into WALIS’ database structure. The
marsh muds and peats (e.g. Balgerhoeke, Belgium: IDs 339 great majority of sites in continental NW Europe, however,
and 340; Land Hadeln, Germany: IDs 882 and 883). A de- have chronostratigraphic relative age constraints for which a
fault RWL for this indicator is the midpoint between HAT separate registration scheme exists. We filled this with entries
and MSL, and the interval between HAT and MSL is a de- for the Eemian pollen association zones (PAZs; numbered
fault indicative range. Revisiting such sites may present op- E1–E6) of Zagwijn (1996) as established for the Netherlands.
https://doi.org/10.5194/essd-14-2895-2022 Earth Syst. Sci. Data, 14, 2895–2937, 20222904 K. M. Cohen et al.: Last Interglacial sea-level data points
Table 4. Chronostratigraphical entries for North Sea, Skagerrak–Kattegat and SW Baltic Sea.
Age-constraining information, encoded in WALIS’ Scenario-based age attributions,
chronostratigraphic unit duration and age fields fitting the lower and upper constraints
Chronostratigraphic Duration Duration “Upper” “Lower” Example Example
divisions tied to North Sea constraint uncertainty (oldest) (youngest) early-onset late-onset
LIG sea-level data points (yrs)b (yrs)c numeric numeric scenario scenario
age (ka) age (ka) (ka) (ka)
Zagwijn (1961, 1983, 1996)a
EW-I 10 000 800 115 102 115 to 105 113 to 102
E6/EW break (600) 200 115 112.5 ∼ 115 ∼ 112.5
E6 (E6a, E6b) 4000 250 120 112.5 120 to 115 116.5 to 112.5
E5/6 break (600) 200 120 116 ∼ 120 ∼ 116
E5 4000 250 124 117 124 to 120 122.5 to 117
E4 (E4a, E4b) 1800 110 127 122.5 127 to 124 124.5 to 122.5
E3 (E3a, E3b) 675 45 128.5 124.5 128 to 127 125 to 124.5
E2 (E2a, E2b) 425 30 129 125 128.5 to 128 125.5 to 125
E1 100 10 129 125.5 ∼ 129 ∼ 125.5
Entire Eemian (E1–E6) 11 000 500 129 112.5 129 to 115 126 to 112.5
Seidenkrantz (1993)
Kattegat stadial 1200 200 131 126 131 to 129.5 127.5 to 126
Kristensen et al. (2000)
Cyprina clay (undivided) 6750 500 128 116 128 to 121 124.5 to 116
Cyprina clay, upper saline (E4b, E5, E6a)a 4700 400 126 116 126 to 121 122.5 to 116
Cyprina clay, lower saline (E3b, E4a, E4b)a 1950 200 128 122.5 128 to 122 124.5 to 122.5
Cyprina clay, lowest brackish (E2b, E3a)a 350 100 128.5 124.5 128.5 to 128 125 to 124.5
a WALIS entries use Zagwijn (1961, 1983, 1996) scheme. Descriptions for entries include correlations to schemes of Jessen and Milthers (1928; as used in Funder et al., 2002: Table 2),
Selle (1962; as used in Konradi et al., 2005: Sect. 8), Behre (1962), Müller (1974), and Menke and Tynni (1984). Correlation for Cyprina clay complies with that in Kristensen et al. (2000)
and Meng et al. (2022). b In regular font, for E1 to E6: based on NW German lowland varved lake site “Bispingen”, Muller (1974) and Zagwijn (1996). In italics: for E5/6 break and
E6/EW break, arbitrarily defined as 300 years on either side of break. For EW-I: varve counts in Eifel mar lakes (Sirocko et al., 2005) and their dust-flux correlation with Greenland ice
cores NGRIP and NEEM (Sirocko et al., 2005; NEEM community members, 2013; Sier et al., 2015). For the Kattegat stadial: assessment of Seidenkrantz (1993). These estimated
durations are regarded as minimum durations in the early-onset scenario. c Authors’ expert judgement: acknowledges varve miscount possibilities as well as PAZ correlation diachronicity
issues over ca. 400 km distance between “coastal Netherlands” (Zagwijn, 1961; Amersfoort) and “NW German terrestrial” sites (Müller, 1974; Bispingen), Eifel mar lakes (Sirocko et al.,
2005), NE Denmark (Kattegat stadial; Seidenkrantz, 1993) and/or the SW Baltic (Cyprina clay; Kristensen et al., 2002).
The information in this part of the WALIS database is sum- tions closer to the original estimates of Müller, 1974). The
marised in Table 4. In the note field for each entry, we in- respective WALIS minimum and maximum age entries for
cluded the correlation to regarded equivalent zones in vari- each PAZ cover both options. We note that the application
ous NW German and Danish biostratigraphic schemes for the of Eemian PAZ schemes within the interglacial is relatively
LIG (references in Table 4 footnote). In dedicated numeric straightforward in the LIG coastal zone because of the un-
fields, we register duration constraints provided by varve derlying glaciogenic deposits at most Dutch, German and
counts from the Bispingen site in NW Germany (Müller, Danish sites (Table 2). We stress that the PAZ correlation-
1974) as well as correlated minimum and maximum absolute attributed numeric ages (i.e. the onset scenarios in Table 4)
ages (Table 4: left side). The presented ages aim to encom- should only be applied to localities around the eastern and
pass all presently considered options for the age span repre- southern North Sea area. Bispingen (location of varve counts
sented by the floating PAZ scheme (see Long et al., 2015), of Müller, 1974) is at most 100 km from the German Bight
which includes early-onset and late-onset options (Table 4: and within 500 km of our Belgian sites (Fig. 1). If entries for
right side). Details on the age information (maximum and RSL indicators with palynology-derived chronostratigraphic
minimum spans, early- or late-onset options) are provided in age control are needed for sites further east (e.g. Russian
Appendix B as well as in the note field for the main entry in “Mikulinian” zonation) or to the southwest in the English
the WALIS database itself. Channel, we advise adding separate entries in WALIS, poten-
Since the Tzedakis et al. (2018) publication on Italian tially adapting the advised oldest and youngest age bounds,
speleothem U-series chronology and the Iberian margin ma- and exploring possible W–E diachronicities.
rine isotopic record, the early-onset correlation option for The situation for UK sites is different as palynologi-
PAZ E1–E6 stretches from ca. 129 to 116 ka (PAZ E5 com- cal indicators and settings are often ambiguous in reveal-
mencing around 124 ka), and a late option covers ca. 126 ing whether an interglacial deposit correlates to the LIG or
to 112 ka (with PAZ E5 ending by 117–116 ka and dura- an older counterpart. Due to significant advances in AAR
Earth Syst. Sci. Data, 14, 2895–2937, 2022 https://doi.org/10.5194/essd-14-2895-2022K. M. Cohen et al.: Last Interglacial sea-level data points 2905
methods (Penkman et al., 2013), combined with river terrace Cohen, 2011), when the first 5 m of overburden accumu-
stratigraphy (Bridgland, 1994), vertebrate and mollusca bios- lated (Van Asselen et al., 2011; Keogh and Törnqvist, 2019;
tratigraphy (Schreve, 2001; e.g. Preece, 2001), and indepen- Keogh et al., 2021). Decompaction of decimetre-thick basal
dent geochronology, many British sites previously thought peat beds is achieved by multiplying thickness by a factor
to relate to the LIG based on Ipswichian pollen stratigra- of 2 to 3 (Berendsen et al., 2007; Hijma and Cohen, 2019).
phy (e.g. Hollin, 1977) are now argued to actually date from For Eemian basal peats, the overburden is similarly thick but
preceding interglacials (Penkman et al., 2008, 2011, 2013). exists for longer and can be relatively sandy (descriptions
Therefore, many correlated “Ipswichian” sites from the UK stored in note fields summarise overburden composition for
were not included in the database. Those sites with AAR- those database entries where compaction assessments were
based LIG age associations were included in the WALIS- incorporated). We hence considered a decompaction factor
provided database substructure for this dating type. of 2.5 to 3.5 for dominantly organic beds and 2 to 3 for clay–
peat alternating intervals.
For SLIPs from lagoonal deposits and estuarine tidal flat
3 Elevation measurements and corrections
surfaces (Fig. 2, Table 3a), decompaction of clayey tidal de-
3.1 Elevation measurements and datums
posits immediately underlying these levels is considered. As
in the application to the top of basal peats, we mainly assess
For any palaeoenvironmental record to provide a useful in- “post-depositional” compaction for estuarine sediments. The
dictor of past sea level, the elevation of the deposit or land- compressing of any underlying basal peats would have oc-
form must be recorded (Shennan et al., 2015). Following curred rapidly, i.e. during the functioning of the estuary and
WALIS database structures for this, the measured elevations eventually resulting in the estuary filled with a tidal flat sur-
for the studied sites have been reported in various forms, de- face (Brain, 2015). Subtidal clayey facies is regarded to be
tailed in Table 5. Our approach has been to express eleva- more prone to remaining compaction (decompaction factor
tions for data points as much as possible to 19–20th-century 1.5 to 2.5) than intertidal and supratidal facies (decompaction
reference mean sea level (details given in Table 6), apply- factor 1 to 1.5) because the latter had been subjected to wet–
ing conversions from local datums when needed (for further dry cycles at the time of deposition (Paul et al., 2004). The
discussion see Woodroffe and Barlow, 2015). thickness and composition of overburden affect whether to
opt for the lower or higher side of the decompaction factor.
3.2 Compaction corrections
A few sites in the database are from particularly thick
organo-clastic Eemian sequences, e.g. deglaciation-inherited
Most SLIPs and limiting data points are from sites and indi- deep channels onshore in the German Bight (e.g. Dagebüll,
cator types that do not require compaction correction, e.g. Schnittlohe), and from glacial-tongue basins in the Nether-
marine terraces, beach deposits, drowned valley floor and lands (e.g. Amsterdam, Amersfoort; Fig. 1). We avoided
isolation basin sills (Table 3). Basal peat, lagoonal and es- including heavily compaction-influenced sea-level markers
tuarine tidal flat type indicators do require estimates of com- and regression terrestrial limiting points from such locali-
paction as the sediments are more compressible, and these ties, instead opting for sites along the rims of the basins (see
are often sampled from buried positions with considerable Kasse et al., 2022, for the Amersfoort example). From the
overburden. The decompaction approach is a pragmatic one. deep and thick German Bight sequences, SLIPs and limit-
Detailed compaction correction in general is not feasible, ing points are only recorded in the database from the deepest
and our decompaction approach is based upon analogies and levels in the sequences, for which compaction corrections are
experience in Holocene settings. For the Holocene, geome- relatively minor. The environments became subaqueous fol-
chanical empirical modelling suggests similar decompaction lowing the transgression, and it is the proxy water depth inac-
factors for basal organic beds and clayey, tidal lagoonal se- curacy, rather than decompaction, that affects indicator ele-
quences (e.g. Greensmith and Tucker, 1986; Brain, 2015; vation position and associated uncertainty. In the Amsterdam
Keogh et al., 2021). The corrections have been primarily ap- tongue basin, an isolation-basin-style sill of glaciogenic de-
plied to records from the Netherlands, NW Germany and SW posits controls the elevation of sea level, and therefore com-
Denmark and then mainly to basal peat SLIPs and associated paction could be ignored.
marine limiting indicators (Fig. 2b). All site-specific com-
paction corrections are documented in the “Notes on eleva- 3.3 Vertical land motion (VLM) correction
tion and indicative range” field for each entry.
For basal peats we assume a full analogue with Holocene Rates of vertical land motion (VLM), due to basin subsidence
deposits from the area. Where Holocene peats are overlain and sediment loading in the North Sea basin, are on the order
by 10–15 m of coastal overburden, transgressed peats are of 0.1–0.2 m kyr−1 (Kooi et al., 1998), resulting in up to 10 m
compressed to 50 %–33 % of their original thickness, with of apparent RSL fall simply due to VLM at locations around
the greatest majority of this compression happening in the the LIG highstand shoreline and up to 20 m further offshore
first millennia after burial (Hijma et al., 2009; Hijma and at locations closer to depocentres (Fig. 3). Such spatial varia-
https://doi.org/10.5194/essd-14-2895-2022 Earth Syst. Sci. Data, 14, 2895–2937, 20222906 K. M. Cohen et al.: Last Interglacial sea-level data points
Table 5. Techniques to establish present elevation.
Measurement technique Description
Differential GPS (DGPS) Positions are acquired in the field by “rover” GPS stations, corrected either in real
time or during post-processing with respect to the known position of a “base” GPS
station (or a geostationary satellite system). DGPS accuracy depends on distance
from base station and number of static positions acquired per location.
Metered tape or rod The end of a tape or rod is placed at a known elevation point, and the elevation of the
unknown point is calculated using the metered scale and, if necessary, clinometers
to calculate angles.
Total station or auto- or hand-level The accuracy of the elevation measurement is also inversely proportional to the
distance between the instrument and the point being measured. Furthermore, it takes
over the accuracy of the benchmark used when setting up the total station or hand-
levelling survey.
Multibeam bathymetry data + core depth Bathymetry derived from multibeam surveys in offshore areas, below which the
depth along cores is expressed. Errors differ with coring system (gravity, vibrocor-
ing, rotary drilling, etc.) and should be assessed case by case.
Technique not reported: value read from The elevation measurement technique is unknown; where the technique is left un-
publication mentioned it most probably was hand-level or metered tape.
Technique not reported: value read from The elevation was extracted from a published sketch or topographic section.
cross-section in publication
Table 6. Sea-level datums made use of in this study.
Datum name Datum description
Mean sea level This is the general definition of MSL, with no indications of which datum the mea-
surement referred to. A datum uncertainty can be established on a case-by-case ba-
sis.
DNN (Danish ordnance datum, prior to DNN (Dansk Normaal Nul) is the ordnance datum (O.D.) used in Denmark during
DVR90) the 20th century. It is about equal to MSL during the second half of the 20th century
(mean half-tide) as observed at 10 tide gauges along the Danish coast. DVR90,
which is tied to NAP, replaced DNN in the early 2000s; 0.02 m DNN is 0 m DVR90
in N Denmark; −0.14 m DNN is 0 m DVR90 in SW Denmark.
NAP, NHN, NN (Dutch ordnance datum, NAP (Normaal Amsterdams Peil) is the O.D. in the Netherlands, and NHN (Normal-
Amsterdam, also zero level for the Ger- höhennull) is the German O.D. that shares the datum. The zero level is about equal
man ordnance datum) to MSL during the second half of the 20th century (mean half-tide) as observed in
tide gauges along the Dutch coast. NHN replaced precursor NN (Normalnull) in the
early 2000s, which was also tied to NAP.
TAW+2.33 (Belgian ordnance datum, TAW is a datum based on lowest astronomical tide (LAT) at Oostende (Belgium);
Oostende, offset to get from LAT to MSL) 0 m TAW (Belgium) is −2.33 m NAP/NHN (the Netherlands, Germany), and hence
+2.33 m is the datum offset. For reference, 0 m TAW (Belgium) is −1.83 m NGF
(Nivellement General de la France; France).
OD, or ODN In the UK, OD is defined as the mean sea level at Newlyn (Cornwall, UK) between
(British ordnance datum, Newlyn) 1915 and 1921. For reference, modern MSL is 0.14 m above ODN (OD as defined
at Newlyn) at Portsmouth and Sheerness and 0.23 m below ODN at Immingham.
NGF-IGN69 NGF is the ordnance datum for continental France. The zero level equates to
(French ordnance datum, Marseille) Mediterranean mean sea level (mean half-tide) in Marseille as gauged between 1885
and 1897. For reference, 20/21th-century MSL is 0.505 m above NGF at Brest, 0.585
at Cherbourg, 0.491 at St Malo, 0.585 at Le Havre and 0.571 at Calais and 0.50 m
NGF at Oostende (Belgium; see TAW).
Earth Syst. Sci. Data, 14, 2895–2937, 2022 https://doi.org/10.5194/essd-14-2895-2022K. M. Cohen et al.: Last Interglacial sea-level data points 2907 Figure 3. VLM rates (m kyr−1 ) for North Sea basin LIG data points. Area of subsidence and VLM contours, based on depth of base Pleistocene in marine formations (onshore and offshore data from NL, GER and DK geological surveys), negotiated for water depth reduction during the Early Pleistocene (isoline increment: 0.04 m kyr−1 , i.e. equivalent to 5 m RSL correction accumulated over 120 kyr). Values in black italics: WALIS VLM entries for LIG data points, reproducing Kooi et al. (1998) for the Netherlands. Offshore subsidence patterns deviate subtly from the 1998 publication, and for the German Bight coverage was extended based on improved mapping of base Pleistocene. Backdrop as in Fig. 1, containing land data © OpenStreetMap contributors 2020. Distributed under the Open Data Commons Open Database License (ODbL) v1.0. tion in tectonic subsidence thus significantly affects the com- et al. (1998). Applying VLM corrections allows us to remove parison elevation of inland and offshore RSL data points uniform background non-GIA land-level change, which in through the interglacial. Earlier studies that compiled LIG turn allows the regional spatial and temporal pattern of GIA sea-level data from the North Sea region, as part of larger- RSL due to the growth and melt of the Eurasian ice sheets to scale analysis (notably Lambeck et al., 2006, and Kopp et be explored. al., 2009), implemented VLM corrections (mainly to the data The VLM rates for the southern North Sea in Fig. 3 echo points from Zagwijn, 1983; Fig. A1a) to account for this. Ac- those obtained for Dutch sectors in Kooi et al. (1998: their cordingly, we develop updated VLM corrections based on Fig. 4; all three components summed), who performed a geological information independent of the LIG data points. tectono-sedimentary back-stripping analysis on thickness of To do this consistently for all onshore and offshore sites from Quaternary and Neogene sequence of the basin and pre- the Netherlands, NW Germany and SW Denmark we incor- sented mean rates estimated over the last 2.6 Myr. The start- porate up-to-date mapping of the base Quaternary (equiva- ing point for that was the mapping of Quaternary thickness lent to base Pleistocene) sediments in these areas and expand in the North Sea basin (“accommodation”), based on collated and update the subsidence quantification analysis from Kooi offshore seismo-stratigraphic and onshore lithostratigraphic https://doi.org/10.5194/essd-14-2895-2022 Earth Syst. Sci. Data, 14, 2895–2937, 2022
2908                                                               K. M. Cohen et al.: Last Interglacial sea-level data points

mappings and relying on identification of Early Pleistocene       Dover Strait; Gibbard, 1995; Gupta et al., 2007, 2017) with
marine strata therein (tens to hundreds of metres below the       some isostatic uplift in response. Regardless, the apparent
seabed and Middle Pleistocene glaciogenic unconformities;         uplift due to both GIA and non-GIA VLM based upon the
Ottesen et al., 2014). For reanalysis and assessment of the       flight of raised beaches is modest (+0.02 to +0.04 m kyr−1 ;
1998 outcomes (1990s state of mapping offshore was rather         Pedoja et al., 2018). This similarly applies to sites along
coarse), we re-generated such source materials from cur-          the English and French sides of the English Channel. The
rent onshore–offshore geological survey digital mapping re-       flight of raised beaches in West Sussex (Bates et al., 2010;
sources (2020 state of mapping, especially refined offshore       Briant et al., 2019) occurs in an area where net uplift is
and better aligned across national borders). For the onshore      thought to be significant, with apparent rates between 0.06
and nearshore the Netherlands, the VLM results broadly re-        and 0.12 m kyr−1 , explaining the mean vertical separation of
produced the accommodation patterns and mean subsidence           highstand beaches of the last few cycles (e.g. Westaway et
rates over the last 2.6 Myr. For areas further offshore, the      al., 2006), although these rate calculations are sensitive to
mapping of the base Quaternary had been considerably re-          terrace age attributions (see Sect. 6.2). Moreover, the values
vised (e.g. Lamb et al., 2018) compared to the 1990s. This        for sections of French and English coastlines are total rates
has shifted depocentre contours, which locally nudged VLM         that do not independently allow for separating out non-GIA
values from −0.03 to +0.03 m kyr−1 relative to the 1998 re-       and GIA (including hydro-isostasy) components. Overall, the
sults. VLM rates for the German Bight lay outside the area        anticipated non-GIA VLM vertical corrections for uplifting
covered in the 1998 analysis but are now otherwise produced       sites along the English Channel coast would be significantly
in the same way. Figure 3 thus is an expansion of earlier basin   smaller than the ones specified for the North Sea depocentre
subsidence component quantifying work.                            (perhaps with West Sussex data points as a local exception).
   The contour lines in Fig. 3 served as VLM subsidence           Developing such corrections remains an ongoing challenge
isolines where values for newer data points had to be as-         for this area.
sessed. VLM used in WALIS for this region ranges from                Where we report VLM-corrected elevations for North Sea
−0.02 m kyr−1 at marginal locations to −0.24 m kyr−1 at           SLIPs and limiting data points in the next section, we calcu-
sites over Quaternary depocentres. VLM rate uncertainty           lated these with the “late onset” numeric ages as listed in Ta-
is ±0.01 for sites along the basin margin (subsidence of          ble 4. The vertical positions will further rise if the age model
−0.02 to −0.03 m kyr−1 ) and increases to ±0.04 in far off-       is shifted to the older onset scenario. In the transect plot of
shore depocentres. The propagated effects of combined age         Fig. 4, such age attribution sensitivities will affect early- and
uncertainty, palaeo-RSL uncertainty and VLM uncertainty           late-LIG data points collected offshore more than the mid-
on projecting North Sea data points in age–depth plots are        interglacial data points that predominantly come from inland
considerable, shifting from decimetres to metres as report-       positions (Sect. 4.1 and 4.2).
ing palaeo-RSL elevation with and without VLM correc-
tion in the next sections shows. Our vertical corrections
and associated uncertainties for the Zagwijn (1983) sub-          4     Overview of data points
set were verified to reproduce such calculations reported in
Lambeck et al. (2006). We also verified our rate uncertain-       This section summarises the database contents for NW Eu-
ties against those used in Kopp et al. (2009). The WALIS-         rope, as based upon the data input considerations outlined
registered uncertainty for North Sea offshore site “#2” is        above. The overview is grouped by region and where age
similar (−0.03 vs −0.0255 m kyr−1 ), but for inshore sites of     constraints allowed are broadly characterised as early, middle
the Zagwijn (1983) series our uncertainties are roughly twice     and late LIG. Figures 4 and 5 present the data points along
those used in Kopp et al. (2009).                                 broad SW–NE transects in the North Sea and the English
   We do not provide VLM rates for the stable and modestly        Channel (see Fig. 1), i.e. at increasing distance from main
uplifting areas around the margin of the North Sea basin          MIS-6 ice cover over NW Europe.
and along the English Channel. Independent estimation of
the rates of VLM are not available as studies that provided       4.1    North Sea: the Netherlands and Belgium
uplift rates do so based upon the same marine terrace ele-
vations that we document as SLIPs. Very modest long-term          In the Netherlands and Belgium availability of national on-
subsidence rates may apply to NE Belgium, Denmark and             line geological datasets (e.g. Van der Meulen et al., 2013)
N Germany during the Pleistocene, or alternatively they can       means that all sites and boreholes in this region were looked
be viewed as fairly stable (Kiden et al., 2002). Whether the      up in web portals to verify coordinates, surface elevations,
Dover–Calais area is neotectonically active, and owing to         layer depths etc. For the Netherlands we used https://www.
what cause, is debated (e.g. Van Vliet-Lanoë et al., 2000;        dinoloket.nl/en/subsurface-data (last access: 1 October 2021)
Westaway et al., 2002; García-Moreno et al., 2015). The           and for Belgium (Flanders) https://www.dov.vlaanderen.be
region is also known to have lost considerable volume of          (last access: 1 October 2021), and we have included the orig-
bedrock in Middle Pleistocene times (proglacial erosion of        inal IDs from these portals. Coordinates of legacy sites based

Earth Syst. Sci. Data, 14, 2895–2937, 2022                                        https://doi.org/10.5194/essd-14-2895-2022
You can also read