Learning mutational signatures and their multidimensional genomic properties with TensorSignatures
←
→
Page content transcription
If your browser does not render page correctly, please read the page content below
ARTICLE
                  https://doi.org/10.1038/s41467-021-23551-9                  OPEN

                  Learning mutational signatures and their
                  multidimensional genomic properties with
                  TensorSignatures
                  Harald Vöhringer1, Arne Van Hoeck                      2,   Edwin Cuppen2,3 & Moritz Gerstung                     1,4 ✉
1234567890():,;

                  We present TensorSignatures, an algorithm to learn mutational signatures jointly across
                  different variant categories and their genomic localisation and properties. The analysis of
                  2778 primary and 3824 metastatic cancer genomes of the PCAWG consortium and the HMF
                  cohort shows that all signatures operate dynamically in response to genomic states. The
                  analysis pins differential spectra of UV mutagenesis found in active and inactive chromatin to
                  global genome nucleotide excision repair. TensorSignatures accurately characterises
                  transcription-associated mutagenesis in 7 different cancer types. The algorithm also extracts
                  distinct signatures of replication- and double strand break repair-driven mutagenesis by
                  APOBEC3A and 3B with differential numbers and length of mutation clusters. Finally, Ten-
                  sorSignatures reproduces a signature of somatic hypermutation generating highly clustered
                  variants at transcription start sites of active genes in lymphoid leukaemia, distinct from a
                  general and less clustered signature of Polη-driven translesion synthesis found in a broad
                  range of cancer types. In summary, TensorSignatures elucidates complex mutational foot-
                  prints by characterising their underlying processes with respect to a multitude of genomic
                  variables.

                  1 European Molecular Biology Laboratory, European Bioinformatics Institute (EMBL-EBI), Hinxton, UK. 2 Center for Molecular Medicine and Oncode Institute,

                  University Medical Center Utrecht, Universiteitsweg 100, Utrecht, The Netherlands. 3 Hartwig Medical Foundation, Amsterdam, The Netherlands. 4 European
                  Molecular Biology Laboratory, Genome Biology Unit, Heidelberg, Germany. ✉email: moritz.gerstung@ebi.ac.uk

                  NATURE COMMUNICATIONS | (2021)12:3628 | https://doi.org/10.1038/s41467-021-23551-9 | www.nature.com/naturecommunications                               1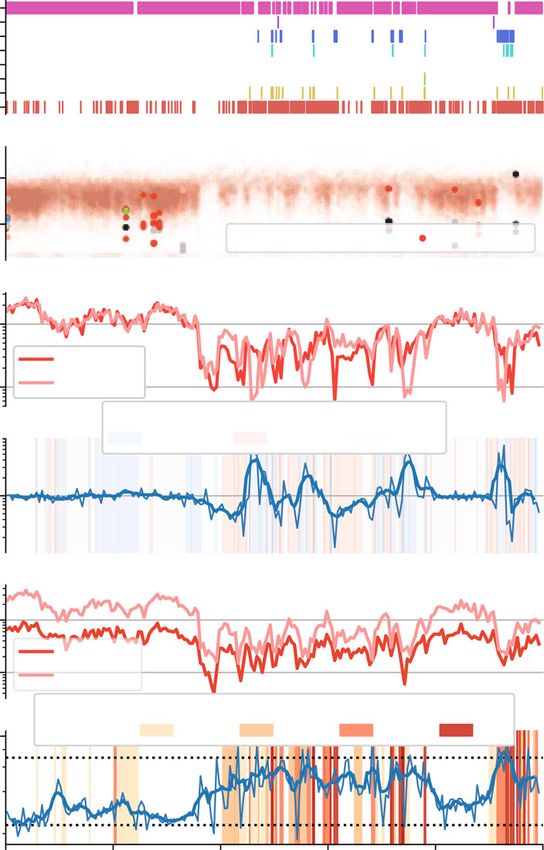
ARTICLE NATURE COMMUNICATIONS | https://doi.org/10.1038/s41467-021-23551-9
C
ancer arises through the accumulation of mutations base substitutions by expressing the mutated base pair in terms of
caused by multiple processes that leave behind distinct its pyrimidine equivalent (C > A, C > G, C > T, T > A, T > C and
patterns of mutations on the DNA. A number of studies T > G) plus the flanking 5′ and 3′ bases. We additionally cate-
have analysed cancer genomes to extract such mutational sig- gorised other mutation types into 91 MNV classes, 62 indel
natures using computational pattern recognition algorithms such classes, and used the classification of SVs provided by the
as non-negative matrix factorisation (NMF) over catalogues of PCAWG Structural Variants Working Group17. In addition to
single nucleotide variants (SNVs) and other mutation types1–8. So the immediate base context, a number of genomics features have
far, mutational signature analysis has provided more than 50 been described to influence mutation rates. Here, we use 5 dif-
different single base substitution patterns, indicative of a range of ferent genomic annotations—transcription and replication strand
endogenous mutational processes, as well as genetically acquired orientation, nucleosomal occupancy, epigenetic states as well as
hypermutation and exogenous mutagen exposures9. clustered hypermutation—and generate 96-dimensional base
Mutational signature analysis via computational pattern substitution spectra for each possible combination of these
recognition draws its strength from detecting recurrent patterns genomic states separately and for each sample. Partitioning var-
of mutations across catalogues of cancer genomes. As many iants creates a seven-dimensional count tensor (a multi-
mutational processes also generate characteristic multi nucleotide dimensional array), owing to the multitude of possible
variants (MNVs)10,11, insertion and deletions (indels)12–14, and combinations of different genomic features (Fig. 1a).
structural variants (SVs)6,15–17 it appears valuable to jointly Both transcription and replication introduce a strand specifi-
deconvolve broader mutational catalogues to further understand city, which provides a distinction of pyrimidine and purine base
the multifaceted nature of mutagenesis. context, which is considered to be indistinguishable in the
Moreover, it has also been reported that mutagenesis depends
on a range of additional genomic properties, such as the tran-
scriptional orientation and the direction of replication18–20, and a Structure of the SNV count tensor
sometimes manifests as local hypermutation (kataegis)1. Addi- Mutation count
matrix
Mutation count
tensor
tionally, epigenetic and local genomic properties can also influ- Split by
transcription
Split by
replication
Split by clustering state (2),
nucleosome position (4)4 and
ence mutation rates and spectra21–23. In fact, these phenomena n samples
strand strand epigenetic environment (16)
1 TssA 2 TssAFlnk 16 Baseline
may help to more precisely characterise the underlying muta- p mutation
types
Coding C C C C
2 clustered
1 unclustered
tional processes, but the large number of possible combinations strand L G U
1 minor
T out
Template T T T
makes the resulting multidimensional data structure unamenable strand L G U
to conventional matrix factorisation methods. Unknown
strand
U U
L
U
G
U
U
2 minor
in
We present TensorSignatures, a multidimensional tensor fac-
Leading
strand
LaGging
strand
Unknown
strand
torisation framework incorporating the aforementioned features for
a more comprehensive extraction of mutational signatures. We 4 Baseline
apply TensorSignatures to 2778 whole genomes from the Pan
b TensorSignature Factorization
Cancer Analysis of Whole Genomes (PCAWG) consortium24, and
Mutation counts Exposures Signatures
validate our findings in an additional 3824 metastatic cancer whole 1. Factorization of n samples s signatures
genomes from the Hartwig Medical Foundation (HMF)25. The count matrix into
signatures
MNVs,
Indels, q mutation q mutation Signature
types types matrix
resulting tensor signatures add considerable detail to known Mutation count matrix
SVs
n samples
other mutation types
mutational signatures in terms of their genomic determinants and
s
Signature tensor
2. Factorization of n samples s signatures
broader mutational context. Strikingly, some signatures are being count tensor into p mutation
types
p mutation
types
tensor signatures
further subdivided based on genomic properties, illustrating the Mutation count tensor shared between
array of SNV count
differential manifestation of the same mutational process in dif- matrices for each
SNV and other
mutation types and
state combination
ferent parts of the genome. This includes UV-mutagenesis and same for alll states
and variant types
tobacco associated mutations, manifesting at differential rates in
active and quiescent chromatin, and enables the algorithm to detect c Factorization of signature tensor
the prevalence of transcription-associated mutagenesis18,26 in more Signature tensor Signatures Activities
cancers than currently appreciated. The incorporation of additional strand specific Activity in a given combination of state and
mutational signatures signature-specific coefficients
variant types enables TensorSignatures to delineate two APOBEC (same across all states)
signatures manifesting as replication associated mutations, or highly C C C Spectrum
Coding
Clustering Nucleosome Epigenetic
L G U strand coefficients coefficients coefficients
clustered SV-associated base substitutions indicative of APOBEC3A T T T Spectrum
s
s
and 3B1,18,19,27–30. Finally, TensorSignatures confirms localised L G U
Template
strand 1
1
1
s s s
1
s 4
somatic hypermutation at transcription start sites in lymphoid L
U
G
U
U
U
1 2
1
1 16
neoplasms7, with a distinct spectrum from a mostly unclustered,
Spectrum
Leading
strand
Spectrum
LaGging
strand
genome-wide signature of translesion synthesis found in a range of
other cancer types28. Taken together, TensorSignatures sheds light
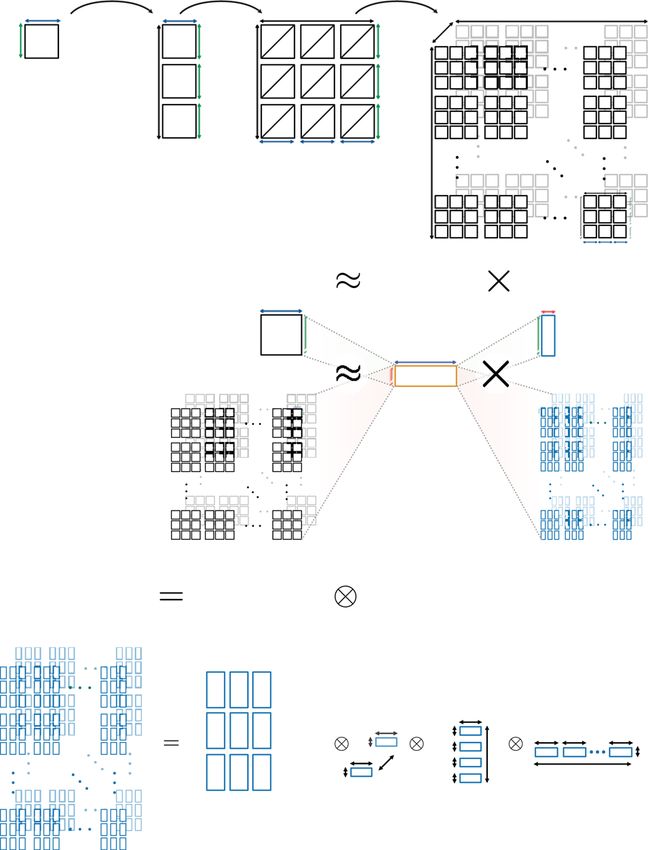
on the manifold influences that underlie mutagenesis and helps to Fig. 1 A multidimensional tensor factorisation framework to extract
pinpoint mutagenic influences by jointly learning mutation patterns mutational signatures. a Splitting variants by transcriptional and
and their genomic determinants. TensorSignatures is implemented replicational strand, and genomic states creates an array of count
using the powerful TensorFlow31 backend. The software is available matrices, a multidimensional tensor, in which each matrix harbours
as a python package on the PyPI repository and results presented in the mutation counts for each possible combination of genomic states.
this study can also be explored on a webserver - see section Code b TensorSignatures factorises a mutation count tensor (SNVs) into an
availability at the end of the article. exposure matrix and signature tensor. Simultaneously, other mutation
types (MNVs, indels, SVs), represented as a conventional count matrix are
factorised using the same exposure matrix. c The signature tensor has itself
Results a lower dimensional structure, defined by the product of strand-specific
Multidimensional genomic features of mutagenesis. It is com- signatures, and coefficients reflecting the activity of the mutational process
mon practise in mutational signature analysis to classify single in a given genomic state combination.
2 NATURE COMMUNICATIONS | (2021)12:3628 | https://doi.org/10.1038/s41467-021-23551-9 | www.nature.com/naturecommunications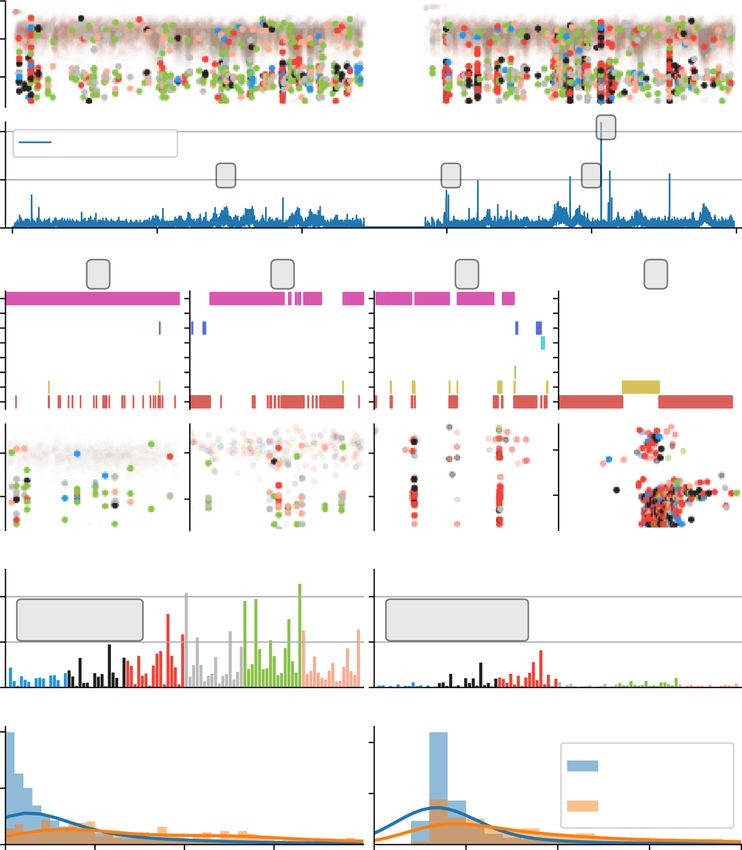
NATURE COMMUNICATIONS | https://doi.org/10.1038/s41467-021-23551-9                                                                    ARTICLE

conventional 96-dimensional representation of single base                       a set of defined genomic activity coefficients, measuring the
substitution spectra. In transcribed genes, mutation rates may                  relative activity of every signature in each state of a given genomic
differ between template and coding strand, because RNA                          feature. Simulation studies show that this joint inference of
polymerase II recruits transcription-coupled nucleotide excision                mutation spectra and genomic features provides a more accurate
repair (TC-NER) upon lesion recognition on transcribed DNA                      inference in comparison to conventional NMF relying on a 96-
only. Thus, TC-NER usually leads to lower mutation rates on the                 trinucleotide channel decomposition only and subsequent
template strand, but also the opposite effect—transcription                     assessment of signature properties, or post-hoc posterior prob-
associated mutagenesis (TAM)—occurs18,26. Similar effects are                   ability calculations (Supplementary Figs. 2 and 3, Methods).
observed between leading and lagging strand replication18,20,                      Furthermore, TensorSignatures incorporates the effect of other
possibly because the leading strand is continuously synthesised by              variants (MNVs, indels, SVs), which remain unoriented and are
DNA polymerase ϵ, while lagging strand DNA synthesis is                         expressed as a conventional count matrix, by sharing the same
conducted by DNA polymerase δ, and is discontinuous due to                      exposure matrix as SNVs. This enables to jointly learn mutational
formation of Okazaki fragments. Since not all mutations can be                  processes across different variant classes more robustly in
oriented either due to absent or bidirectional transcription, or                comparison to approaches which rely on (post-hoc) matching
because of unknown preferred replication direction far from a                   mutational spectra (Supplementary Fig. 4, Methods).
replication origin, this creates a total of 3 × 3 = (template, coding,
unknown) × (leading, lagging, unknown) combinations of orien-
tation states in the count tensor (Fig. 1a).                                    Most mutational signatures are composed of diverse mutation
   Numerous studies found a strong influence of chromatin                        types and vary across the genome. To assess the capabilities of
features on regional mutation rates. Strikingly, these effects range            TensorSignatures, we analysed the somatic mutational catalogue
from the 10 bp periodicity on nucleosomes23 to the scale of kilo-               of the PCAWG cohort comprising 2778 curated whole-genomes
to megabases caused by the epigenetic state of the genome21. To                 from 37 different cancer types containing a total of 48,329,388
understand how mutational processes manifest on histone-bound                   SNVs, 384,892 MNVs, 2,813,127 deletions, 1,157,263 insertions
DNA, we computed the number of variants on minor groove                         and 157,371 SVs. Applying TensorSignatures to the PCAWG
DNA facing away from and towards histone proteins, and linker                   dataset and using the conservative BIC (Supplementary Fig. 5)
DNA between two consecutive nucleosomes. Additionally, we                       produced 20 tensor signatures (TS) encompassing mutational
utilised ChromHMM annotations from 127 cell-lines32 to                          spectra for SNVs and other mutation types (Fig. 2a), and asso-
annotate genomic regions with consensus epigenetic states, which                ciated genomic properties (Fig. 2b). Reassuringly, we extracted a
we used to assign SNVs to epigenetic contexts. Together this adds               number of signatures with SNV spectra highly similar to the well
two dimensions of size 4 and 16 to the count tensor (Fig. 1a).                  curated catalogue of COSMIC signatures9,33. 14/20 signatures
   Finally, there are mutational processes capable of introducing               were similar to those detected by a de novo analysis of
large numbers of clustered mutations within confined genomic                     SigProfiler34, which detected 22 signatures, two of which con-
regions. This phenomenon is termed kataegis1 and is thought to                  sidered to be sequencing artefacts (Supplementary Fig. 6).
be caused by multiple mutational processes28. To detect such                       Interestingly, our analysis revealed a series of signatures that
mutations, we developed a hidden markov model (HMM) to                          have similar SNV spectra in common, but differ with regard to
assign the states clustered and unclustered to each mutation based              their genomic properties or mutational composition. These
on the inter-mutation distance between consecutive mutations.                   signature splits indicate how mutational processes change across
Separating clustered from unclustered mutations adds the final                   the genome and will be discussed in further detail below. In the
dimension in the mutation count tensor, which has a total of 6                  following, we refer to signatures via their predominant mutation
dimensions with 2 × 576 = 1152 combinations of states (Fig. 1a).                pattern and associated genomic properties. Of the 20 signatures, 4
                                                                                were observed in nearly every cancer type (Fig. 2c): TS01,
                                                                                characterised by C > T mutations in a CpG context, most likely
TensorSignatures learns signatures based on mutation spectra                    due to spontaneous deamination of 5meC, similar to COSMIC
and genomic properties. At its core, mutational signature ana-                  SBS1, TS02 of unknown aetiology, and two signatures with
lysis amounts to finding a finite set of prototypical mutation                    relatively uniform base substitution spectra, TS03 (unknown/
patterns and expressing each sample as a sum of these signatures                quiet chromatin), and TS04 (unknown/active chromatin), which
with different weights reflecting the variable exposures in each                 loosely correspond to SBS40 and SBS5.
sample. Mathematically, this process can be modelled by non-                       While the most prevalent mutations are single base substitutions,
negative matrix factorisation into lower dimensional exposure                   there are 16/20 signatures with measurable contributions from other
and signature matrices. TensorSignatures generalises this frame-                mutation types (>1%; Fig. 2b). The most notable cases are TS15,
work by expressing the (expected value of the) count tensor as a                which is similar to a compound of COSMIC signatures SBS6/15/26
product of an exposure matrix and a signature tensor (Fig. 1b;                  + ID1/2 and characterised by C > T transversions in a GCN context
Methods). Counts are modelled by an overdispersed negative                      and frequent mononucleotide repeat indels indicative of mismatch
binomial distribution, which is a robust statistical model that also            repair deficiency (MMRD). Similarly, TS16, likely to reflect
enables to choose the number of signatures with established                     concurrent MMRD and POLE exonuclease deficiency, exhibits large
statistical model selection criteria, such as the Bayesian Infor-               probabilities for deletions and a base substitution pattern similar to
mation Criterion (BIC) as evidenced by extensive simulations                    SBS14. Large proportions of SVs (~25%) were found in TS11, which
(Supplementary Fig. 1).                                                         reflects SV-associated APOBEC mutagenesis caused by double
   The key innovation of TensorSignatures is that the signature                 strand break repair with a base substitution spectrum similar to
tensor itself has a lower dimensional structure, reflecting the                  SBS2/13. Furthermore, TS19 apparently reflects a pattern of
effects of different genomic features (Fig. 1c). This enables                   homologous recombination deficiency (HRD), characterised by a
the model to simultaneously learn mutational patterns and their                 relatively uniform base substitution pattern similar to SBS3, but a
genomic properties by drawing information from the whole                        high frequency of SVs, in particular tandem duplications (Supple-
dataset, even when the number of combinations of genomic states                 mentary Note 1 and Fig. 93).
becomes high (1152). In this parametrisation each signature is                     9/20 signatures displayed a measurable propensity to generate
represented as a set of 2 × 2 strand-specific mutation spectra and               clustered mutations (>0.1%; Fig. 2b). The proportions of clustered

NATURE COMMUNICATIONS | (2021)12:3628 | https://doi.org/10.1038/s41467-021-23551-9 | www.nature.com/naturecommunications                            3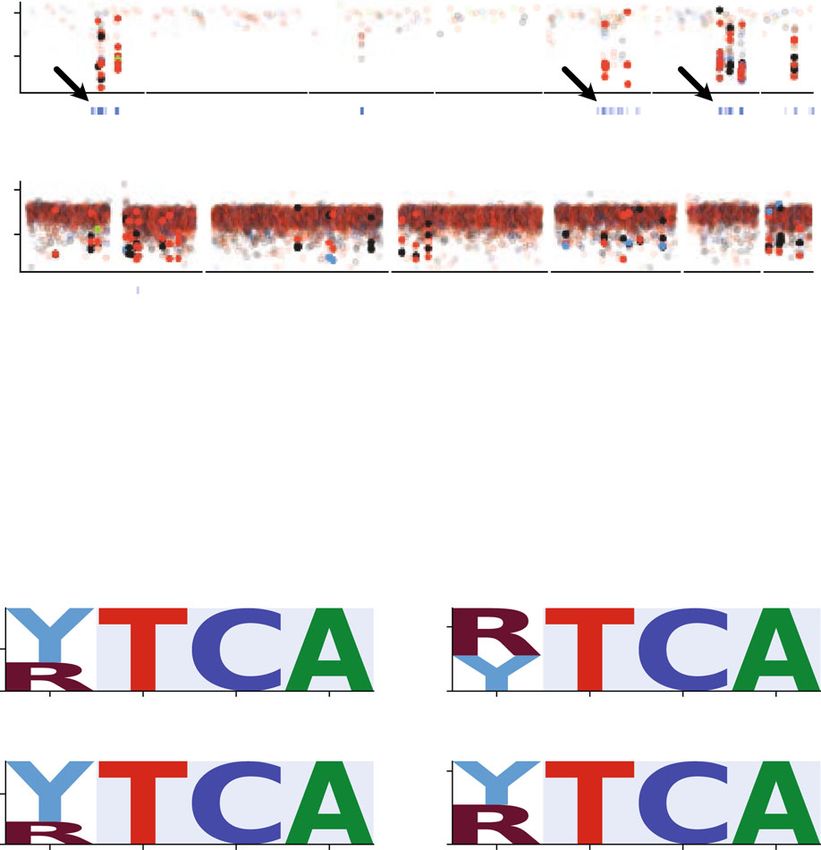
ARTICLE                                                                      NATURE COMMUNICATIONS | https://doi.org/10.1038/s41467-021-23551-9

Fig. 2 Applying TensorSignatures on 2778 whole genomes from the ICCG PCAWG consortium revealed 20 tensor signatures and their genomic
properties. a Upper panels depict SNV spectra, and a summarised representation of associated other mutation types (error bars determine 95% bootstrap
confidence intervals). SNV mutations are shown according to the conventional 96 single base substitution classification based on mutation type in a
pyrimidine context (blue C > A, black C > G, red C > T, green T > A, grey T > C, salmon T > G) and 5' and 3' flanking bases (in alphabetical order). The panel
under each SNV spectrum indicates transcriptional (red), and replicational strand biases (blue) for each mutation type, in which negative deviations
indicate a higher probability for template or lagging strand pyrimidine mutations, and positive amplitudes a larger likelihood for coding or lagging strand
pyrimidine mutations (and vice versa for purine mutations). b Heatmap visualisation of extracted tensor factors describing the genomic properties of each
tensor signature. Proportions of other mutation types and clustered SNVs are indicated in percentages. Transcriptional and replicational strand biases
indicate shifts in the distribution of pyrimidine mutations on coding/template and leading/lagging strand. Coefficients < 1 (pink) indicate signature
enrichment on template or lagging strand DNA, and conversely values > 1 (green), a larger mutational burden on coding or leading strand (a value of 1
indicates no transcriptional or replicational bias). Relative signature activities in transcribed/untranscribed and early/late replicating regions. Coefficients >
1 (turquoise) indicate enrichment in transcribed and early replicating regions, while values < 1 (brown) indicate a stronger activity of the mutational process
in untranscribed or late replicating regions. Relative signature activities on nucleosomes and linker regions, and across epigenetic states as defined by
consensus ChromHMM states. Scores indicate relative signature activity in comparison to genomic baseline activity. A value of 1 means no increase or
decrease of a signature’s activity in the particular genomic state, while values > 1 indicate a higher, and values < 1 imply a decreased activity. c Signature
activity in different cancer types (Exposures). Upper triangles (green) indicate the mean number of mutations contributed by each signature, lower
triangles show the percentage of samples with a detectable signal of signature defined as the number of mutations attributed to the signature falling into a
signature-specific typical range (Methods). Greyed boxes indicate cancer types for which a signature was not found to contribute meaningfully. Source
data are provided as a Source Data file.

mutations produced by each mutational process were highest in                     hypermutation (SHM). While both TS13 and TS14 have only
signatures associated with APOBEC and activation-induced                          mildly diverging base substitution spectra, with TS14 being similar
deaminase (AID) activity: Up to 79% and 0.6% of SNVs attributed                   to SBS9, they dramatically differ in the rates at which they generate
to TS11 and TS12, respectively, were clustered, with otherwise                    clustered mutations, which are 59% and 1%, respectively (Fig. 2b).
indistinguishable base substitution spectra. A similar phenomenon                    5/20 signatures exhibit substantial transcriptional strand bias
was observed in two signatures reflecting Polη driven somatic                      (TSB ≥10%; Fig. 2b). This is strongest in the UV-associated

4                   NATURE COMMUNICATIONS | (2021)12:3628 | https://doi.org/10.1038/s41467-021-23551-9 | www.nature.com/naturecommunications
NATURE COMMUNICATIONS | https://doi.org/10.1038/s41467-021-23551-9                                                                    ARTICLE

signature TS06, similar to SBS7b, where the rate of C > T                       catalogue, however without measurable transcriptional strand
substitutions on the template strand was half of the correspond-                bias. A second derived signature is similar to SBS39; our analysis
ing value on the coding strand, highly indicative for active TC-                reveals replication strand bias for C > G variants and a potentially
NER. In contrast, TS08, similar to SBS16, shows largest activities              wider range of cancer types for both signatures. Further, signature
in liver cancers and preferably produces T > C transitions on                   TS12, resembling replication associated APOBEC mutagenesis,
template strand DNA. In line with a transcription-coupled role,                 split into two signatures with base substitution spectra similar to
the activity of TS08 shows a noteworthy elevation in transcribed                SBS2 (C > T) and SBS13 (C > G), but preserving the strong
regions. Both signatures will be discussed in more detail later on.             replication strand bias. Lastly, a split of TS10, likely attributed to
   Analysis of pyrimidine/purine shifts in relation to the direction            mutagens included in tobacco smoke, was observed.
of replication indicated 9/20 signatures with replication strand                   Finally, a set of 10 signatures without close match to those in
biases (RSB ≥10%). In accordance with previous studies, TS12                    the PCAWG cohort was found (Fig. 3c). This includes five spectra
asserts a higher prevalence of APOBEC-associated C > D                          linked to cancer therapies, illustrating the additional insights on
mutations, consistent with cytosine deamination, on lagging                     preceding therapies provided by the HMF metastatic cancer
strand DNA which is thought to be exposed for longer periods as                 cohort. TS21 is characteristic of treatment with the methylating
opposed to more processively synthesised leading strand                         agent temozolomide (SBS11); the observed transcriptional strand
DNA18–20. Conversely, TS17, associated with POLE exonuclease                    bias reflects a higher rate of G > A mutations on the coding strand
variants (SBS10a/b), displays a pyrimidine bias towards the                     (equivalent to higher rates of C > T on the template strand),
leading strand18 (Fig. 2b). Since DNA polymerase ϵ performs                     consistent with methyl guanine being removed by TC-NER in the
leading strand synthesis, the strand bias indicates that C > A (G >             absence of MGMT. TS22 and TS23 have been previously
T) mutations arise on a template C, presumably through C ⋅ dT                   associated with cisplatin (termed E-SBS21 and E-SBS14)36,37.
misincorporation35. Further examples with replication strand                    While both signatures exhibit mild transcriptional strand biases,
biases include the MMRD-associated signatures TS15 and TS16                     only TS23 shows a strong association with MNVs going in line
discussed above. Of note, the two SHM-associated signatures                     with the propensity of cisplatin/oxaliplatin to form intrastrand
TS13 and TS14 displayed opposing patterns with respect to their                 DNA adducts (Supplementary Fig. 8c). TS24 displays the
activity in oriented (early) and unoriented (late) replicating                  characteristics of treatment with 5-FU, which inhibits thymine
regions (Fig. 2b).                                                              synthesis and has been proposed to be mutagenic via genomic
   Furthermore, all signatures showed signs of differential activity            fluorouracil incorporation37. TS28, with similarity to SBS41, was
with respect to their genomic features. This was particularly                   only found in two samples, possibly due to treatment with the
pronounced for epigenetic effects and could be grouped in                       experimental drug SYD985, which consists of a duocarmycin-
broadly two classes: Those that are elevated in active (TssA,                   based HER2-targeting antibody-drug conjugate25.
TssAFlnk, TxFlnk, Tx and TxWk) and depleted in quiescent                           Further, TensorSignatures detected a signature of colibactin,
regions (Het, Quies), and vice versa. This phenomenon includes                  TS25, which has been previously characterised36,38. TS25 displays
the two omnipresent signatures with relatively uniform spectra                  contributions of MNVs and short indels, activity in active
TS03 and TS04, suggesting a mechanism associated with the                       genomic regions and concomitant transcriptional strand bias of
chromatin state behind their differential manifestation (Fig. 2a).              T > C mutations (Fig. 3c, d). TS26’s indels and similarity to
This also applies to two signatures associated with UV exposure,                SBS15 suggests an association with MMRD; TS27 has an
TS05 and TS06, and also two signatures of unknown aetiology,                    unknown aetiology and displays strong replicational strand bias.
most prominently found in Liver cancers, TS07, similar to SBS12,                The large proportion of structural variants and the flat SNV
and TS08, which we will discuss in more detail in subsequent                    spectrum of TS29 may represent non-specific mutagenesis at SVs.
sections. To ensure that these epigenetic associations were not an              TS30 was found in lymphoid and other cancers and had a high
artefact of the consensus annotation, we matched cancers to their               proportion of clustered mutations, similar, but not identical to
closest Roadmap cell-line(s) (Supplementary Table 1) and                        TS14 (Fig. 3d).
performed a TensorSignatures extraction, which yielded highly                      Taken together, the TensorSignatures analysis of the PCAWG
concordant epigenetic signature activities (Supplementary Fig. 7).              and HMF cohorts revealed that mutational signatures are
                                                                                composed of diverse mutation types and vary extensively across
                                                                                the genome. In the following, we explore some of the genomic
Validation of TensorSignatures in the HMF cohort. The                           activity patterns and properties of selected TensorSignatures in
aforementioned observations were replicated in a fully indepen-                 further detail. An emerging feature was differential mutagenesis
dent second cohort of whole genomes from the Hartwig Medical                    in active and quiet areas of the genome.
Foundation with 3,824 samples from 31 cancers encompassing
95,531,862 SNVs, 1,628,116 MNVs, 9,228,261 deletions,
5,408,915 insertions and 1,001,433 structural variants25. Applying              The spectrum of UV mutagenesis changes from closed to open
TensorSignatures to this data set produced 27 tensor signatures                 chromatin, reflecting GG- and TC-NER. Two signatures, TS05
(Supplementary Fig. 8a). Of these 10 closely resembled (cosine                  and TS06, were exclusively occurring in Skin cancers of both
distance < 0.2) signatures of the discovery analysis with closely               cohorts and displayed almost perfect correlation (Spearman R2 =
matching genomic activity coefficients (Fig. 3d, Supplementary                   0.98, Supplementary Fig. 9a) of attributed mutations, strongly
Fig. 8b). These include the signatures of spontaneous deamina-                  suggesting UV mutagenesis as their common cause. Both signatures
tion TS01, the two signatures of UV mutagenesis TS05/06, SV-                    share a very similar SNV spectrum, only differing in the relative
associated APOBEC mutagenesis TS11, as well as signatures of                    extent of C[C > T]N and T[C > T]N mutations, which is more
MMRD TS16, POLEexo mutations TS17, as well as MUTYH                             balanced in TS06 (Fig. 2a). However, they strongly diverge in their
deficiency TS18, HRD TS19 and TS20.                                              activities for epigenetic contexts and transcriptional strand biases:
   A further 7 signatures seemingly constitute splits of tensor                 TS05 is enriched in quiescent regions, and shows no transcriptional
signatures from the PCAWG cohort (Fig. 3b). A complex three-                    strand bias, while the opposite is true for TS06, which is mostly
way split appeared to occur for TS03 and TS04, which were found                 operating in active chromatin (Fig. 2b). Of note, the spectra of these
in a broad range of cancer types. One of the derivative signatures              signatures closely resemble that of COSMIC SBS7a and SBS7b,
resembles the mutation spectrum of SBS8 from the COSMIC                         which have been suggested to be linked to different classes of UV

NATURE COMMUNICATIONS | (2021)12:3628 | https://doi.org/10.1038/s41467-021-23551-9 | www.nature.com/naturecommunications                            5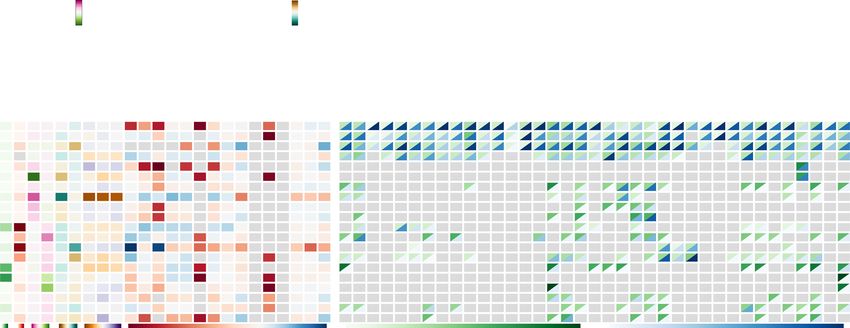
ARTICLE NATURE COMMUNICATIONS | https://doi.org/10.1038/s41467-021-23551-9
a Validated TensorSignatures (HMF cohort)
TS01-N[C>T]G (Cos dist.: 0.002) TS05-T[C>T]N (Cos dist.: 0.001) TS06-Y[C>T]N (Cos dist.: 0.030) TS07-N[T>C]N (unknown) (Cos dist.: 0.057)
0.25
0.25 0.25 0.1
0 0 0 0
Del
Ins
Del
Ins
Del
Ins
Del
Ins
SV
SV
SV
SV
MNV
MNV
MNV
MNV
0.2 0.2 0.25 0.05
0 0 0 0
0.2 0.2 0.25 0.05
TS11-T[C>D]W;SV (Cos dist.: 0.005) TS16-N[C>A]T;ID (Cos dist.: 0.108) TS17-T[C>A]T (Cos dist.: 0.076) TS18-N[C>A]W (Cos dist.: 0.006)
0.03 0.01 1.00
0.5
0.1 0.5 0.1
0 0 0 0 0 0
Del
Ins
Del
Ins
Del
Ins
Del
Ins
SV
SV
SV
SV
MNV
MNV
MNV
MNV
0.25 0.03 0.01 0.1
0 0 0 0
0.25 0.03 0.01 0.1
TS19-N[N>N]N;SV (Cos dist.: 0.159) TS20-N[T>G]T (Cos dist.: 0.001)
0.03 0.2 0.25
0 0 0
Del
Ins
Del
Ins
SV
SV
MNV
MNV
0.05 0.2
0 0
0.05 0.2
b Split TensorSignatures
TS03-N[N>N]N (Cos dist.: 0.047) TS03-N[N>N]N (Cos dist.: 0.087) TS04-N[N>N]N (Cos dist.: 0.236) TS10-N[C>A]N-q (Cos dist.: 0.024)
0.05 0.05 0.1
0.03
0 0 0 0
Del
Ins
Del
Ins
Del
Ins
Del
Ins
SV
SV
SV
SV
MNV
MNV
MNV
MNV
0.03 0.03 0.03 0.05
0 0 0 0
0.03 0.03 0.03 0.05
TS10-N[C>A]N-a (Cos dist.: 0.153) TS12-T[C>D]W (a) (Cos dist.: 0.118) TS12-T[C>D]W (b) (Cos dist.: 0.272)
0.5
0.05 0.25
0 0 0
Del
Ins
Del
Ins
Del
Ins
SV
SV
SV
MNV
MNV
MNV
0.05 0.25 0.25
0 0 0
0.05 0.25 0.25
c Novel TensorSignatures
TS21 - Temozolomide TS22 - Carboplatin/Cisplatin (E-SBS21) TS23 - Cisplatin/Oxaliplatin (E-SBS14) TS24 - Capecitabine/5-FU (E-S B S14)
0.1 0.2 0.1
0.25
0 0 0 0
Del
Ins
Del
Ins
Del
Ins
Del
Ins
SV
SV
SV
SV
MNV
MNV
MNV
MNV
0.05 0.1 0.05 0.25
0 0 0 0
0.05 0.1 0.05 0.25
TS25 - Colibactin/Unknown TS26 - MMRD TS27 - Unknown TS28 - Unknown
0.1 0.03 0.1
0.05 0.5
0 0 0 0 0
Del
Ins
Del
Ins
Del
Ins
Del
Ins
SV
SV
SV
SV
MNV
MNV
MNV
MNV
0.05 0.05 0.03 0.05
0 0 0 0
0.05 0.05 0.03 0.05
TS29 - Unknown TS30 - Unknown
0.01 0.01 0.25
0.5
0 0 0 0
Del
Ins
Del
Ins
SV
SV
MNV
MNV
0.05 0.05
0 0
0.05 0.05
d Tensorfactors and Exposures
Fig. 3 Tensor signatures of the HMF cohort. a Validated tensor signatures with high similarity (indicated as cosine distance) to the mutational processes
extracted in our discovery analysis using PCAWG data. b TensorSignatures splits that seemingly represent derivatives of tensor signature TS03, TS04,
TS10 and TS12. c Tensor signatures of the HMF cohort. d Extracted tensor factors, exposures and summed squared errors of tensor factors from the
discovery and validation analysis. Source data are provided as a Source Data file.
damage39. However, as our genomically informed TensorSignatures which is almost entirely absent in signature TS05 (Fig. 4a). To
inference and further analysis show, the cause for the signature verify that this signature inference is correct, and the observed
divergence may be found in the epigenetic context, which seemingly bias and spectra are genuinely reflecting the differences between
not only determines mutation rates, but also the resulting muta- active and quiescent chromatin, we pooled C > T variants from
tional spectra. Skin-Melanoma samples which revealed that the data closely
A characteristic difference between the two signatures is the resembled predicted spectra (Fig. 4b). In addition, quiescent
presence of a strong transcriptional strand bias in signature TS06, chromatin also displays a predominant T[C > T]N substitution
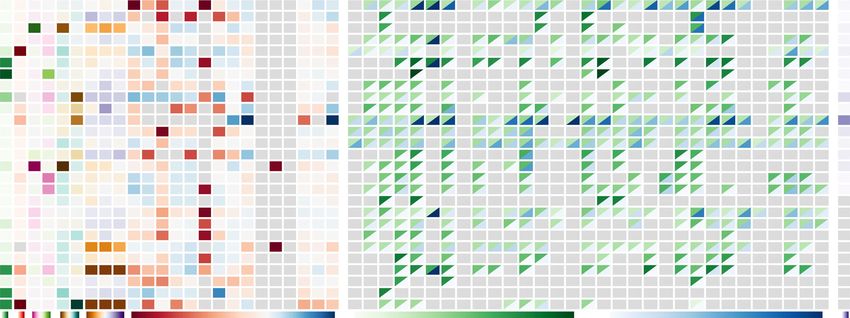
6 NATURE COMMUNICATIONS | (2021)12:3628 | https://doi.org/10.1038/s41467-021-23551-9 | www.nature.com/naturecommunicationsNATURE COMMUNICATIONS | https://doi.org/10.1038/s41467-021-23551-9 ARTICLE Fig. 4 The spectrum of UV mutagenesis changes from open to closed chromatin. a C > T mutation probabilities of TensorSignatures TS05 and TS06 for coding and template strand DNA (error bars determine 95% bootstrap confidence intervals). b Pooled PCAWG Skin-Melanoma C > T variant counts from coding and template strand DNA in epigenetically active (TssA, TssAFlnk, TxFlnk, Tx and TxWk, right) and quiescent regions (Het and Quies, left). c Consensus ChromHMM states from a representative 10 Mbp region on chromosome 1, and the corresponding mutational density of pooled Skin- Melanoma samples. d N[C > T]N and N[G > A]N counts in 50 kbp bins, and their respective ratios (thin blue line: ratio; thick blue line: rolling average over 5 consecutive bins) illustrate the transcriptional strand bias of C > T mutations in quiescent and active regions of the genome. e Relationship between expression strength and the spectral shift of C > T mutations in terms of binned C > T variant counts in TpC and CpC context and their respective ratios (thin blue line) as well as a rolling average (thick blue line). f Gene expression strength vs. transcriptional strand bias (measured by the ratio normalised C > T variants in Skin-Melanoma on coding and template strand), and gene expression strength vs. C[C > T]/T[C > T] spectral shift (indicated as the ratio of normalise C > T mutations in 5'C and 5'T context). g Transcriptional strand bias and C[C > T]/T[C > T] spectral shift in GG-NER deficient XPC−/− cSCC genomes. Blue curves: quadratic fit. Source data are provided as a Source Data file. spectrum (5’C/5’T = 0.3), while the spectrum in active chromatin T[C > T]N mutations, which manifests as an increasing C[C > T] is closer to Y[C > T]N (5’C/5’T = 0.58), as predicted by the N and T[C > T]N ratio, reaching a ratio of approximately 0.5 in signature inference (Fig. 4a). This difference does not appear to be the highest expression quantiles (Fig. 4f). related to the genomic composition, and holds true even when The diverging activity in relation to the chromatin state adjusting for the heptanucleotide context (Supplementary suggests an underlying differential repair activity. Global genome Fig. 9b). nucleotide excision repair (GG-NER) clears the vast majority of To illustrate how the mutation spectrum changes dynamically UV-lesions in quiescent and active regions of the genome and is along the genome in response to the epigenetic context, we triggered by different damage-sensing proteins. Conversely, TC- selected a representative 10 Mbp region from chromosome 1 NER is activated by template strand DNA lesions of actively comprising a quiescent and active genomic region as judged by transcribed genes. As TS05 is found in quiescent parts of the consensus ChromHMM states, and the varying mutational genome, it appears likely that it reflects the mutation spectrum of density from pooled Skin-Melanoma samples (Fig. 4c). As UV damage as repaired by GG-NER. Based on the activity of expected, actively transcribed regions display a strong transcrip- TS06 in actively transcribed regions and its transcriptional strand tional strand bias (Fig. 4d). Further, this change is also bias, it seemingly reflects the effects of a combination of GG- and accompanied by a change of the mutation spectrum from a T TC-NER, which are both operating in active chromatin. This [C > T]N pattern to a Y[C > T]N pattern with the ratios indicated joint activity also explains the fact that the spectrum of TS06 is by our TensorSignatures inference (Fig. 4e). found on both template and coding strands. These observations are further corroborated by RNA-seq data This attribution is further supported by data from n = 13 available for a subset of samples (n = 11): The transcriptional cutaneous squamous cell carcinomas (cSCCs) of n = 5 patients strand bias is most pronounced in expression percentiles greater with Xeroderma Pigmentosum, group C, who are deficient of than 50 leading to an increased ratio of coding to template strand GG-NER and n = 8 sporadic cases which are GG-NER mutations (Fig. 4f). Again, the decline is accompanied by a shift proficient40. XPC/GG-NER deficiency leads to an absence of in the mutation spectrum: While both C[C > T]N and T[C > T]N TS05 in quiescent chromatin and to a mutation spectrum that is variant counts decline steadily as gene expression increases, the nearly identical in active and quiescent regions of the genome reduction of C[C > T]N mutations is larger in comparison to (Supplementary Fig. 9c). Furthermore, the UV mutation NATURE COMMUNICATIONS | (2021)12:3628 | https://doi.org/10.1038/s41467-021-23551-9 | www.nature.com/naturecommunications 7
ARTICLE                                                                  NATURE COMMUNICATIONS | https://doi.org/10.1038/s41467-021-23551-9

spectrum of XPC/GG-NER deficiency, which is thought to be                      most frequently found in Liver cancers, where they are strongly
compensated by TC-NER, differs from that of TS06, reinforcing                 correlated (R2 = 0.68, Supplementary Fig. 10a), they are also
the notion that TS06 is a joint product of GG- and TC-NER. This               observed in a range of other cancers, indicating that they are
is further supported by the observation that XPC/GG-NER                       reflecting endogenous mutagenic processes.
deficiency leads to a near constant coding strand mutation rate,                  The most prominent difference between these signatures is the
independent of transcription strength40 (Fig. 4g), indicating that            depletion of mutation types in 5’-B context on coding strand
the transcriptional dependence of coding strand mutations in                  DNA in TS08 (Fig. 5c; B = C, G, or T). Signature TS08 displays a
GG-NER proficient melanomas and cSCCs is due to transcrip-                     strong transcriptional strand bias, as previously noted for
tionally facilitated GG-NER.                                                  SBS1626, and is confirmed here by a direct investigation of
   While the activity patterns of TS05 and TS06 appear to be well             variant counts (Fig. 5d). A further defining feature of TS08 are
aligned with GG-NER and GG/TC-NER, these observations,                        indels ≥2 bp (Fig. 2a, Supplementary Note 1 Fig. 38), which were
however, do not explain the observed differences in mutation                  reported to frequently occur in highly expressed lineage-specific
spectra. The fact that the rates of C[C > T]N and T[C > T]N                   genes in cancer12, consistent with experimental data of
mutations change between active and quiescent chromatin—and                   transcription-replication collisions42. In line with this, mutation
the fact the these differences vanish under XPC/GG-NER                        rates showed a dynamic relation to transcriptional strength
deficiency—suggests that DNA damage recognition of CC and                      (Fig. 5e). Normalised counts of T > C mutations on coding and
TC cyclobutane pyrimidine dimers by GG-NER differs between                    template strand initially decline for low transcription. Yet this
active and quiescent chromatin, with relatively lower efficiency of            trend only continues on the coding strand for transcription
TC repair in quiescent genomic regions, as evidenced by TS05.                 quantiles (>50), but reverses on the template strand, producing
                                                                              more N[T > C]N, and most commonly A[T > C]N, mutations the
                                                                              higher the transcription, in line with previous reports of TAM18.
A differential mutation spectrum of tobacco-associated muta-
                                                                                 While this effect is most common in Liver-HCC samples,
tions in regions with TC-NER. A similar split of an exogenous
                                                                              where it has been described in detail, it has been observed that
mutational signature into quiet and active chromatin was
                                                                              SBS5, one of three broadly active signatures, displays signs of
observed in lung cancers of the HMF cohort where TS10 splits
                                                                              potential contamination by SBS16/TS08 in the absence of further
into two signatures, HMF TS10-q, which shows largest activity in
                                                                              intra-genomic stratification. Accordingly, a genomically informed
heterochromatin, while HMF TS10-a is enriched in actively
                                                                              analysis by TensorSignatures also discovers this signature in
transcribed regions, and exhibits a strong transcriptional strand
                                                                              highly transcribed genes of Head-SCC, Stomach-AdenoCa and
bias with lower rates of C > A changes on the coding strand,
                                                                              Biliary-AdenoCa (Fig. 5f, Supplementary Fig. 10b), showing that
equivalent to G > T transversions on the template strand (Figs. 3b,
                                                                              A[T > C]W TAM and N[T > C]N mutagenesis in heterochro-
d and 5a). This strand bias has been attributed to TC-NER
                                                                              matic regions occur in a broad range of cancers.
removing benzo[a]pyrene derived adducts on guanines from the
template strand41.
   The emergence of two mutational signatures indicates that this
                                                                              Replication- and DSBR-driven mutagenesis by APOBEC3A
repair process also changes the mutation spectrum. The suggested
                                                                              and 3B. APOBEC mutagenesis has been previously studied in
split is also evident in pooled mutations from HMF lung cancers
                                                                              detail in cancer genomes1,30,43, revealing and localisation to
in quiescent and active genomic regions, respectively, revealing
                                                                              double strand breaks (kataegis)1 and replication strands bias18–20.
that predicted spectra coincide with corresponding tensor
                                                                              Further investigations in experimental systems and cancer gen-
signatures HMF TS 10-q and TS10-a (Fig. 5b). The C > A (G >
                                                                              omes discovered an extended base context characteristic of the
T) mutation spectrum observed in quiescent regions, extracted by
                                                                              enzymes APOBEC3A and APOBEC3B, respectively revealing a
HMF TS10-q, displays highest rates of mutations in a CCN
                                                                              high contribution of APOBEC3A27 across the genomic back-
(NGG) context (Fig. 5a). Interestingly, the same pattern is also
                                                                              ground and elevated contributions of APOBEC3B to SV-
observed in actively transcribed regions for C > A on the template
                                                                              associated mutation clusters28,44. Still, these facets are not part
strand, equivalent to G > T mutations on the coding strand. This
                                                                              of current reference catalogues; instead SBS2 and SBS13 dis-
is in contrast to the C > A coding strand pattern, and HMF TS10-
                                                                              criminate the effects base excision repair operating downstream
a, for which this difference is largely eroded. These observations
                                                                              of APOBEC induced uracil, producing C > G (SBS2) and C > T
reflect how TC-NER removes genotoxic guanine adducts from
                                                                              substitutions (SBS13), respectively. The unified approach of
the template strand, which leads to lower mutation rates and also
                                                                              TensorSignatures may help consolidate some of the observed
a more homogeneous base context of G > T mutations. The
                                                                              facets of APOBEC mutagenesis. For example, it has not been
differentential mutation spectrum indicates that either the
                                                                              studied whether the sparse set of clusters attributed to APO-
efficiency of TC-NER—or the mutagenicity of residual genomic
                                                                              BEC3A display a replication strand bias, which would confirm
alterations—differs depending on the base context, analogous to
                                                                              them to arise during (lagging strand) replication.
observations in UV-induced mutagenesis. The result being that
                                                                                 TensorSignatures TS11 and TS12 share a common base
the mutation types and rates caused by tobacco-associated
                                                                              substitution spectrum, but differ greatly with regard to their
carcinogens differ between coding and template strand in
                                                                              genomic properties: While TS12 is dominated by SNVs (99%)
transcribed regions and also to different mutation spectra in
                                                                              with strong replicational strand bias, SNVs in TS11 make up only
quiescent and active genomic regions.
                                                                              64% of the overall spectrum and are highly clustered. The rest of
                                                                              the spectrum is mostly dominated by structural variants (Figs. 2a
Transcription-associated mutagenesis is common in highly                      and 6a, Supplementary Note 1 Fig. 53). Reassuringly, the
transcribed genes. A third split of mutational signatures between             difference in clustering propensity and replication strand bias
active and quiet regions was observed in Liver and other cancer               are also directly apparent in the mutation spectra and rainfall
types (Fig. 2b, c), driven by differential activity of TS07 and TS08,         plots of samples with high contributions of either signature
which closely resemble COSMIC signatures SBS12 and SBS16,                     (Fig. 6b, c). SV proximal and distal clustered variants do not
respectively. In line with previous findings18,26, there was a strong          display a replicational strand bias, indicating that both arise in a
transcriptional bias of TS08, introducing 1.6 × more T > C var-               DSB driven manner, the latter presumably during successful
iants on the template strand (Fig. 2b). While both signatures are             DSBR, which did not manifest as SV (Supplementary Fig. 11a).

8                 NATURE COMMUNICATIONS | (2021)12:3628 | https://doi.org/10.1038/s41467-021-23551-9 | www.nature.com/naturecommunications
NATURE COMMUNICATIONS | https://doi.org/10.1038/s41467-021-23551-9 ARTICLE
Fig. 5 Genomically dependent T > C mutagenesis in Liver-HCC and other cancer types. a C > A mutation type probabilities of HMF TS10-q and TS10-a for
coding and template strand DNA. b Pooled HMF lung samples C > A variant counts from coding and template strand DNA in quiescent (Het and Quies,
left) and epigenetically active regions (TssA, TssAFlnk, TxFlnk, Tx and TxWk, right). c T > C mutation type probabilities of PCAWG TS07 and TS08 for
coding and template strand DNA. d Pooled PCAWG Liver-HCC T > C variant counts for coding and template strand DNA in epigenetically active and
quiescent regions. e, f Transcriptional strand bias and A[T > C]/B[T > C] spectral shift in samples from different cancers with TS07 and TS08
contributions. Lines correspond to quadratic fits. Source data are provided as a Source Data file.
However, clusters at SVs tend to be larger (Median 717 vs. 490 reported previously7, suggesting an association with activation-
bp) and tend to have more mutations per cluster (Median 5 vs 4 induced cytidine deaminases (AID), which initiates somatic
variants; Fig. 6d), suggesting a higher processivity of APOBEC hypermutation in immunoglobulin genes of germinal centre B
mutagenesis during DSBR. To further the link of these signatures cells46,47.
to APOBEC3A and APOBEC3B mutagenesis, we studied the TensorSignatures analysis finds that TS13 activity is 9 × and 8×
extended motifs YT[C > T]A and RT[C > T]A, which suggest a enriched at active transcription start sites (TssA) and flanking
higher prevalence of purines (R) over pyrimidines (Y) at the -2 5’ transcription sites (TxFlnk, Fig. 2b), respectively. To illustrate
nucleotide27. Indeed, clustered TS12 mutations comprise only a this, we pooled single base substitutions from Lymph-BHNL
low fraction of purines, indicative of APOBEC3B, while this samples and identified mutational hotspots by counting muta-
proportion increases to approximately 50% in TS11 samples, tions in 10 kbp bins (Fig. 7a, b), which revealed that clustered
consistent with the reported motif of APOBEC3A (Fig. 6e, mutations often fell accurately into TssA regions (Fig. 7c). The
Supplementary Fig. 11b). aggregated clustered mutation spectrum in TssA/TxFlnk regions
Finally, we note that, using data from the HMF cohort, TS12, across lymphoid neoplasms (Lymph-BNHL/CLL/NOS, n = 202)
was further split into C > T and C > G akin to mutational indeed showed high similarity to TS13, possibly with an even
signatures SBS2 and 13 from the COSMIC catalogue (Fig. 3b). more pronounced rate of C > K (K = G or T) variants similar to
These two signatures were attributed to differential activity of SBS849 (Fig. 7d). Conversely, the clustered mutational spectrum
OGG/UNG-driven base excision repair of uracil created by from all other epigenetic regions was characterised by a larger
APOBEC-induced cytosine deamination45. The observation that proportion of T > C and T > G mutations, similar to TS14, which
this split occurs for TS12 rather than TS11, suggests that repair of only produces about 1% clustered mutations and closely
replication-driven APOBEC3A mutagenesis, may be subject to resembles SBS9, attributed to Polη-driven translesion synthesis
higher variation in downstream BER than DSBR-driven APO- (TLS) during somatic hypermutation45.
BEC3B mutagenesis. While TS13 and TS14 are strongly correlated (R2 = 0.88,
Supplementary Fig. 12), the diverging localisation pattern and
SNV spectrum, characterised by higher rates of C > K mutations
Targeted somatic hypermutation at TSS and dispersed clus- in TS13, indicates that a related, but different mutational process
tered translesion synthesis. Two other TensorSignatures pro- drives TSS hypermutation, seemingly linked to AID. The
duced substantial amounts of clustered variants with, but differential mechanism behind TS13 also manifests as longer
different epigenomic localisation. TS13 showed largest activities clusters (Median: 1068 vs. 183 bp), which contain more variants
in lymphoid cancers and produced 60% clustered variants per cluster (Median: 8 vs. 3 mutations) in comparison to TS14
(Fig. 2b). The SNV spectrum resembles the c-AID signature (Fig. 7e). As a further distinction, the weakly clustered TLS
NATURE COMMUNICATIONS | (2021)12:3628 | https://doi.org/10.1038/s41467-021-23551-9 | www.nature.com/naturecommunications 9ARTICLE NATURE COMMUNICATIONS | https://doi.org/10.1038/s41467-021-23551-9
Fig. 6 Double-strand break and replication induced APOBEC mutagenesis. a C > G and C > T spectra of TS11 and TS12 for leading and lagging strand DNA
(error bars determine 95% bootstrap confidence intervals). Pie charts underneath indicate percentages of clustered mutations and the contribution of
other mutation types in TS11 and TS12. b Observed unclustered (top) and clustered variants (bottom) in TS11 and TS12 high samples (TS11 and TS12
contributions > 10% and 70% respectively). c Rainfall plots with SV annotations from a typical sample with high TS11 (top) and TS12 contributions
(bottom). d Size distribution of mutation clusters (consecutive clustered mutations), and the distribution of number of variants per mutation cluster in TS11
and TS12 high samples respectively. Curves depict corresponding kernel density estimates. e Motif logo plots of the tetranucleotide context at mutated
TCA sites in yeast cells exposed to APOBEC3A/3B mutagenesis respectively27, and similar motif logo plots extracted at clustered mutations from samples
with high TS11 or TS12 exposures. Source data are provided as a Source Data file.
signature TS14 can be found in more than 15 cancer types, that genomic associations cannot be unambiguously attributed
suggesting a broad involvement of this mutagenic process in based on the mutation spectrum alone.
resolving endogenous and exogenous DNA alterations28. Finally, In comparison to comparable tools for mutational signature
a third mutational signature of somatic hypermutation, TS30, was analysis, TensorSignatures is currently not optimised to maximise
found in lymphoid and other cancers of the HMF cohort. This the number of extracted signatures, but rather to characterise
signature displayed a large proportion of clustered mutations and the properties of recurrent mutational processes. Compared
an enrichment in early replicating regions similar to TS13, to the curated COSMIC catalogue of mutational signatures, the
combined with an SNV spectrum that was closer to TS14 (Cosine automated analysis with TensorSignatures currently misses
distance d = 0.13 vs. 0.25), suggesting that TS30 may represent a the signatures of of Aflatoxin (SBS24, n = 2 samples with relative
combination of TS13 and TS14. exposure >5%), platinum therapy (SBS31, n = 2; SBS35, n = 11)
and a signature characteristic of base excision deficiency by
Discussion NTHL1 defects (SBS30, n = 45), which in aggregate are estimated
We presented TensorSignatures, a framework for learning to contribute 0.2% of single base substitutions in the PCAWG
mutational signatures jointly from their mutation spectra and cohort. One reason for this discrepancy is that the COSMIC
genomic properties to better understand the underlying muta- catalogue is informed by an additional 1865 whole genome
tional processes. We illustrated the capabilities of this algorithm samples from other sources, which provide stronger evidence for
by presenting a set of 20 mutational signatures extracted from rarely recurring mutational signatures. In order to maximise the
2778 cancer genomes of the PCWAG consortium, and validated yield of novel signatures—a somewhat different objective to
our analysis on additional 3824 metastatic samples from the HMF characterising genomic properties of recurrent processes—a more
cohort. The analysis demonstrated that the majority of muta- bespoke analysis recognising each cancer type and its preferred
tional signatures comprised different variant types, and that no set of mutational signatures as well as a careful assessment of
single mutational signature acted uniformly along the genome. potential sequencing and analysis artefacts is necessary.
Measuring how mutational spectra are influenced by their asso- Nevertheless, the number of signatures in our discovery ana-
ciated genomic features sheds light on the mechanisms under- lysis closely matched the decomposition rank suggested by
lying mutagenesis, as demonstrated by multiple previous SigProfiler (default settings, v1.0.17), indicating that Tensor-
investigations18–20. However, as such calculations have been Signatures is similarly sensitive, while providing the benefit of
carried out after defining mutational signatures, they cannot characterising extracted mutational processes with respect to a
detect more subtle signature changes associated with genomic multitude of genomic variables. The observed discrepancy of
features and struggle to localise very similar mutational sig- approximately 30% between methods highlights some of the
natures. A joint inference also helps to dissect mutational pro- challenges in mutational signature analysis, which needs to dis-
cesses in situations where mutation spectra are very similar, such criminate between genuine biological signal and noise. As our
10 NATURE COMMUNICATIONS | (2021)12:3628 | https://doi.org/10.1038/s41467-021-23551-9 | www.nature.com/naturecommunicationsNATURE COMMUNICATIONS | https://doi.org/10.1038/s41467-021-23551-9 ARTICLE Fig. 7 Identification of a highly clustered mutational signature at active TSS. a Rainfall plot of pooled variants from Lymph-BHNL samples on chromosome 1 (highlighted dots indicate clustered mutations). b Binned (10 kb) SNV counts of chromosome 1. Numbers 1-4 indicate mutation hotspots. c Consensus ChromHMM states and rainfall plots at mutation hotspots. d Pooled clustered variants from PCAWG Lymph-BHNL/CLL/NOS samples from TssA or TxFlnk (TS13-like), and all other epigenetic states (TS14-like). e Size distribution of mutation clusters (consecutive clustered mutations), and the distribution of number of variants per mutation cluster in TS13 and TS14 high samples respectively. Source data are provided as a Source Data file. simulations showed, using more types of mutations and genomic annotated variants by approximately 30% as many parts of the features may increase the accuracy of extracting signatures and of genome are annotated as ‘variable’ (an extra state introduced by measuring their local activities. Further refinements may include TensorSignatures). An analysis based on partially matched tissues to model a preferred activity of a particular signature in a given showed that this approach is likely to underestimate the effect of tissue type; including such preference may help better ascertain genomic factors on mutagenesis and that the reduction of signal the sets of signatures found in a particular genome. Also, incor- makes the analysis of rare elements, such as enhancers, noisier porating more genomic features, potentially so in quantitative (Supplementary Fig. 7). As more and more tissues are being ways, and ideally matching these annotations to each tumour type genomically profiled, we expect that further tissue-specific are likely to increase the power of the analysis. TensorSignatures annotations—and also entirely new genomic features—will appears to be well suited for such refined and future analyses as emerge, which will produce more accurate and novel insights into tumour specific genomic annotations are likely to be assembled the determinants of mutagenesis. over the next years. Accompanying these anticipated develop- Studying the signatures discovered in the PCAWG and HMF ments, further simulation tools cognisant of various genomic data sets revealed that the SNV spectra of TS05 and TS06 show features have to be developed, as current frameworks do not high similarity to signatures SBS7a and SBS7b of the COSMIC recognise the genomic distribution of point mutations9. catalogue of mutational signatures. Due to the high similarity of Epigenetic annotations, for example, currently exist only for a the mutational spectra, it is difficult to unambiguously attribute subset of cancer types—and it may even be that individual cancer individual mutations to these signatures and measure their subtypes derive from distinct cells of origin with unique epige- genomic activity and transcriptional strand biases based on the nomic characteristics. To facilitate a pan-cancer analysis, Ten- mutation spectra alone. TensorSignature analysis reveals that the sorSignatures uses, similar to previous studies18,23, consensus two processes are strongly differing with respect to their epige- annotations comprising those genomic regions found to vary only netic context and transcriptional strand bias pointing towards lowly between different cell types. This reduces the number of differentially active GG-NER to be the underlying cause of the NATURE COMMUNICATIONS | (2021)12:3628 | https://doi.org/10.1038/s41467-021-23551-9 | www.nature.com/naturecommunications 11
You can also read