Microbial river-to-sea continuum: gradients in benthic and planktonic diversity, osmoregulation and nutrient cycling
←
→
Page content transcription
If your browser does not render page correctly, please read the page content below
Tee et al. Microbiome      (2021) 9:190
https://doi.org/10.1186/s40168-021-01145-3

 RESEARCH                                                                                                                                           Open Access

Microbial river-to-sea continuum: gradients
in benthic and planktonic diversity,
osmoregulation and nutrient cycling
Hwee Sze Tee1, David Waite1,2, Gavin Lear1 and Kim Marie Handley1*

  Abstract
  Background: Coastal aquatic ecosystems include chemically distinct, but highly interconnected environments.
  Across a freshwater-to-marine transect, aquatic communities are exposed to large variations in salinity and nutrient
  availability as tidal cycles create periodic fluctuations in local conditions. These factors are predicted to strongly
  influence the resident microbial community structure and functioning, and alter the structure of aquatic food webs
  and biogeochemical cycles. Nevertheless, little is known about the spatial distribution of metabolic properties across
  salinity gradients, and no study has simultaneously surveyed the sediment and water environments. Here, we
  determined patterns and drivers of benthic and planktonic prokaryotic and microeukaryotic community assembly
  across a river and tidal lagoon system by collecting sediments and planktonic biomass at nine shallow subtidal sites
  in the summer. Genomic and transcriptomic analyses, alongside a suite of complementary geochemical data, were
  used to determine patterns in the distribution of taxa, mechanisms of salt tolerance, and nutrient cycling.
  Results: Taxonomic and metabolic profiles related to salt tolerance and nutrient cycling of the aquatic microbiome
  were found to decrease in similarity with increasing salinity, and distinct trends in diversity were observed between
  the water column and sediment. Non-saline and saline communities adopted divergent strategies for
  osmoregulation, with an increase in osmoregulation-related transcript expression as salinity increased in the water
  column due to lineage-specific adaptations to salt tolerance. Results indicated a transition from phosphate
  limitation in freshwater habitats to nutrient-rich conditions in the brackish zone, where distinct carbon, nitrogen
  and sulfur cycling processes dominated. Phosphorus acquisition-related activity was highest in the freshwater zone,
  along with dissimilatory nitrate reduction to ammonium in freshwater sediment. Activity associated with
  denitrification, sulfur metabolism and photosynthesis were instead highest in the brackish zone, where
  photosynthesis was dominated by distinct microeukaryotes in water (Cryptophyta) and sediment (diatoms). Despite
  microeukaryotes and archaea being rare relative to bacteria, results indicate that they contributed more to
  photosynthesis and ammonia oxidation, respectively.
  Conclusions: Our study demonstrates clear freshwater–saline and sediment–water ecosystem boundaries in an
  interconnected coastal aquatic system and provides a framework for understanding the relative importance of
  salinity, planktonic-versus-benthic habitats and nutrient availability in shaping aquatic microbial metabolic
  processes, particularly in tidal lagoon systems.

* Correspondence: kim.handley@auckland.ac.nz
1
 School of Biological Sciences, University of Auckland, Auckland 1010, New
Zealand
Full list of author information is available at the end of the article

                                        © The Author(s). 2021 Open Access This article is licensed under a Creative Commons Attribution 4.0 International License,
                                        which permits use, sharing, adaptation, distribution and reproduction in any medium or format, as long as you give
                                        appropriate credit to the original author(s) and the source, provide a link to the Creative Commons licence, and indicate if
                                        changes were made. The images or other third party material in this article are included in the article's Creative Commons
                                        licence, unless indicated otherwise in a credit line to the material. If material is not included in the article's Creative Commons
                                        licence and your intended use is not permitted by statutory regulation or exceeds the permitted use, you will need to obtain
                                        permission directly from the copyright holder. To view a copy of this licence, visit http://creativecommons.org/licenses/by/4.0/.
                                        The Creative Commons Public Domain Dedication waiver (http://creativecommons.org/publicdomain/zero/1.0/) applies to the
                                        data made available in this article, unless otherwise stated in a credit line to the data.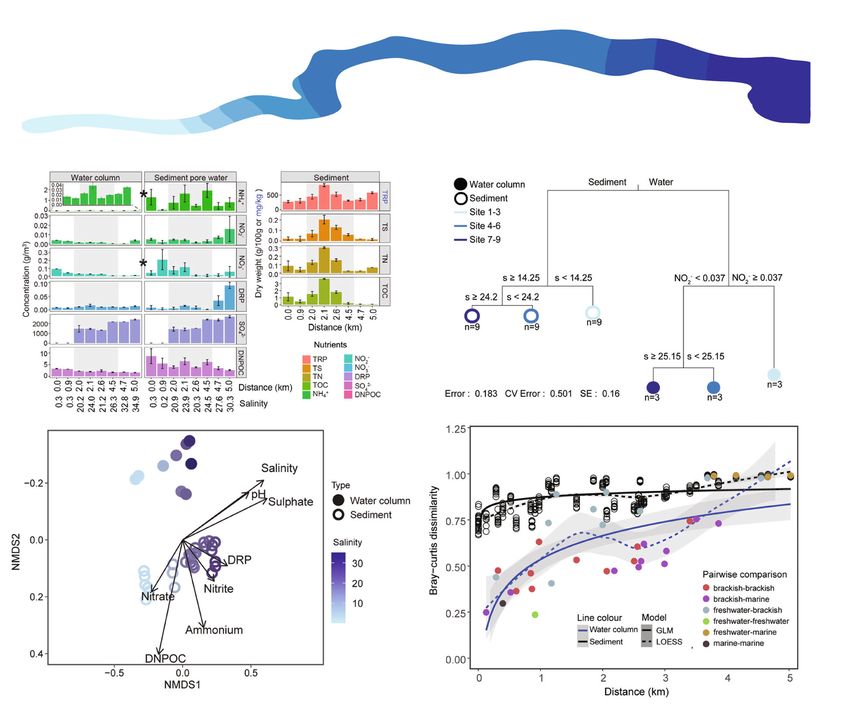
Tee et al. Microbiome   (2021) 9:190                                                                          Page 2 of 18

Introduction                                                  Sulfate-rich saline water promotes the formation of fer-
Across connected riverine, estuarine and marine envi-         rosulfides, resulting in less phosphate sorption in sedi-
ronments, freshwater flow and tidal influx helps to redis-    ments and higher phosphate concentrations in saline
tribute nutrients and establish a strong salinity gradient    water [23, 25, 26]. Riverine systems, however, are often
[1–3]. Such gradients directly influence the resident         phosphate-limited due to greater phosphate sorption in
community composition and distribution, resulting in          non-saline sediments [27]; it is therefore likely that
lower benthic macrofaunal species richness within the         freshwater microbial communities rely on high-affinity
horohalinicum (where salinities are between 5 and 8 [4])      phosphate uptake mechanisms. Estuarine conditions are
and higher microbial richness [5–8]. Global surveys of        comparatively rich in both nitrogen and phosphorus,
microbial diversity have demonstrated that both salinity      which support the growth of primary producers [28],
and environment type (such as water or sediment) are          and in turn, heterotrophs [29, 30]. Benthic photosyn-
major factors influencing bacterial [9] and archaeal com-     thesis has been shown to promote nutrient-regulating
munity composition [10]. Besides nutrients, river dis-        biogeochemical processes in estuaries, such as coupled
charge and phytoplankton community composition are            nitrification–denitrification [31]. However, the relative
also known to drive changes in planktonic estuarine           contribution of each of the taxa within the microbiome
communities [11, 12]. Previous studies of planktonic          toward biogeochemical cycling across river–estuary–
prokaryotic communities across freshwater-to-marine           marine transects remains understudied.
transects have highlighted significant differences in gene      To determine microbial taxonomic and functional di-
abundances related to glycolysis, respiration, catabolic      versity, and metabolic hotspots, across a river-to-sea
pathways, osmolyte and metal transport, and the biosyn-       transect, we sampled benthic sediment (hereafter re-
thesis of quinones and isoprenoids between low and            ferred to as “benthic” samples) and overlying water
high salinities, in line with the shifts in taxonomic         (“planktonic” samples) along a 5-km stretch connecting
groups [13, 14]. However, little is known about the col-      the Waiwera river, estuary and beach (Auckland, New
lective microbial ecology of bacteria, archaea and micro-     Zealand). The Waiwera river predominantly drains
eukaryotes in sediment and water across river-to-sea          rural pastoral catchments [32], and is therefore im-
salinity gradients; how these factors (water, sediment,       pacted by anthropogenic activities, as is typical for estu-
salinity) affect microbial gene expression across this en-    aries globally [33, 34]. The river and estuary have a
vironmental continuum also remains largely unexplored.        water depth of approximately 0.2–1 m, and the estuary
  A key factor shaping microbial community distribu-          is classified as a permanently open tidal lagoon estuary
tions across salinity gradients is lineage-specific adapta-   [35] and is subjected to daily tidal influxes from the
tions for salt tolerance [6, 8–10, 12, 15, 16]. Bacteria      Hauraki Gulf (Pacific Ocean). Tidal lagoon systems,
adopt two distinct strategies to cope with osmolarity         also known as bar-built coastal lagoons, or barrier
changes in their environment: (1) a salt-in strategy          enclosed lagoons, can be found throughout the world
which promotes K+ accumulation and (2) the synthesis          (e.g. Laguna Madre in Texas, USA [36]; Mosquito La-
or uptake of organic compatible solutes which function        goon in Florida, USA [37]; and Paravur estuary in Ker-
as osmoprotectants [17]. Various K+ uptake systems            ala, India [38]) and occupy about 13% of the global
have been reported to date, for example, both trkA and        coastline [39]. They are also the most common estuary
kup systems in hyperosmotic environments, and the kdp         systems in New Zealand [40] and the UK [41]. A nat-
system for low external K+ concentrations [18–21]. Bac-       ural continuous salinity gradient occurs along the Wai-
teria can also employ various Na+/H+ antiporters and          wera river and estuary, potentially exerting a strong
Na+ translocating dehydrogenases to export Na+ extra-         influence on the assembly of microbial communities.
cellularly in highly saline environments [13, 15]. Taxa       We hypothesised that non-saline, saline, water and
and strategies employed are therefore predicted to            sediment communities would be strongly demarcated
change across coastal salinity gradients. Although, cer-      by distinct prokaryotic and eukaryotic compositions,
tain lineages, for instance, members of the order Pelagi-     and utilise distinct osmoregulatory and nutrient acqui-
bacterales (SAR11), have been found at different              sition mechanisms, reflecting, for example, nutrient
salinities, suggesting ecological adaptations within mi-      limitations in the freshwater (P) and marine (N) end-
crobial lineages to salt [16, 22].                            member environments. Combining metagenomic,
  In addition to salinity, dramatic differences in nutrient   metatranscriptomic and geochemical data, we identified
availability and types are typically observed across fresh-   the impact of salinity and nutrient availability on pro-
water to marine systems and have been predicted to            karyotic and microeukaryotic community diversity and
strongly influence community composition and function         on critical physiological and ecological processes, such
[1–3]. These systems mix nitrogen-rich freshwater with        as osmoregulation, primary production and nutrient
sulfate and phosphate-rich marine water [23, 24].             cycling.
Tee et al. Microbiome   (2021) 9:190                                                                            Page 3 of 18

Results and discussion                                        microbial community composition comparable to those
Community partitioning based on salinity and sediment–        between water and sediment at the same salinity (Bray–
water habitat preferences                                     Curtis dissimilarities 0.97 to 0.99 on average; Supple-
Contribution of salinity versus other environmental           mentary Table 2). Predictably, the combination of salin-
parameters in shaping microbial communities                   ity and environment type contributed to almost entirely
Nutrient and salinity gradients are major features of es-     distinct communities (Bray–Curtis dissimilarities of 0.99
tuarine systems, leading to higher estuarine productivity     to 1.0, or 1.0 on average). Sediment and water environ-
[1–3]. Accordingly, we observed a general decrease in         ments are typically separated by large differences in
nitrate concentrations along the Waiwera river–estuary–       redox processes, oxygen, nutrient and terminal electron
sea transect, higher organic carbon concentrations in         acceptor availability [44, 45]. This is also evident in our
brackish sediments, and an increase in dissolved reactive     study, where concentrations of ammonium, nitrate and
phosphorus and sulfate with salinity (Fig. 1a, b). We         dissolved non-purgeable organic carbon (DNPOC) were
therefore tested the contribution of salinity relative to     significantly higher in the sediment porewater, compared
other geochemical variables in differentiating prokaryotic    with the overlying water column (Wilcoxon, p < 0.05,
and microeukaryotic composition along this transect. To       Fig. 1b).
achieve this, near full-length small subunit (SSU) rRNA
gene sequences were assembled and clustered into 6964         Salinity gradients and the non-saline–saline divide in
bacterial, 291 microeukaryal and 79 archaeal operational      sediment and water microbial communities
taxonomic units (OTUs, unique at 97% sequence iden-           Consistent with salt as a major driver of aquatic commu-
tity). Results showed salinity best explains differences in   nity composition, reconstructed SSU rRNA and
sediment bacterial and microeukaryal community com-           Braken2-estimated species abundance profiles indicated
position (Spearman’s correlation coefficient ρ = 0.43–        large differences in the composition of bacteria, archaea
0.91) and planktonic bacterial and microeukaryal com-         and microeukaryotes across the salinity gradient within
position (ρ = 0.78–0.91, Supplementary Table 1). Two          sediment and water environments, although bacteria in-
subsets of parameters were maximally correlated with          variably dominated both the benthic and planktonic
dissimilarities among planktonic (salinity, ammonium,         communities (Fig. 2a, trends exhibited by key taxa are
and phosphate, ρ = 0.19) and benthic archaea (salinity        described in Supplementary Information). An overall de-
and nitrate, ρ = 0.90, Supplementary Table 1), suggesting     crease in both planktonic and benthic community simi-
that besides salinity, nutrients play important roles in      larities occurred with increased difference in salinity and
structuring these aquatic communities, in agreement           geographic distance (Fig. 1e and Supplementary Figure
with previous studies [11, 12, 22]. Overall, our results      2a), resulting in a clear separation between non-saline
correlate strongly with research showing salinity is a        and saline community compositions (Fig. 1d). Results re-
major global driver of prokaryotic community compos-          flect the substantial physiological adaptations required
ition [9, 10].                                                for salt tolerance [14–16]. The rate of increasing dissimi-
   Although salinity strongly differentiated each of the      larity was far greater among water column communities
planktonic and benthic communities relative to other          (analysis of covariance, p < 0.0001), owing to the rela-
geochemical factors, water-vs-sediment environment            tively high similarity between neighbouring communi-
type was found to be the single most important factor         ties. Greater spatial dissimilarity overall was observed
distinguishing microbial communities overall (Fig. 1c).       among communities at benthic sites, including among
This was due to consistently large differences in benthic     sites located only 5 m apart (Fig. 1e). This suggests sedi-
and planktonic communities across the gradient, regard-       ment is a more heterogeneous environment compared
less of salinity (Fig. 1d; Supplementary Table 2), which      to the overlying water, and is consistent with previous
resulted in significantly different benthic and planktonic    comparisons of planktonic and benthic microbial com-
microbial communities overall based on Bray–Curtis dis-       munities in river or coastal settings [42, 43]. The strong
similarities (Benjamini–Hochberg adjusted p < 0.05,           spatial heterogeneity of benthic communities is likely
Supplementary Table 3; Fig. 1d and Supplementary Fig-         due to greater stability within sediments, which are less
ure 1). Results, therefore, support research highlighting     impacted by tidal mixing [1, 46].
the importance of these environment types, along with            To further compare community differences across the
salinity, in structuring microbial communities [9, 10].       transect, we categorised sediment and overlying water
However, few studies, as here, have compared sediment         samples as each belonging to three distinct environ-
and water communities directly within the same system         ments (non-saline, 0–0.5; brackish, 0.5–30; marine, 30–
[42, 43]. We found that only when comparing the effect        35), based on the salinity of porewater or water samples,
of end-member salinities (non-saline vs marine) on ben-       respectively (Fig. 1a and Supplementary Table 4) [47].
thic and planktonic communities were differences in           The benthic community composition (based on OTU
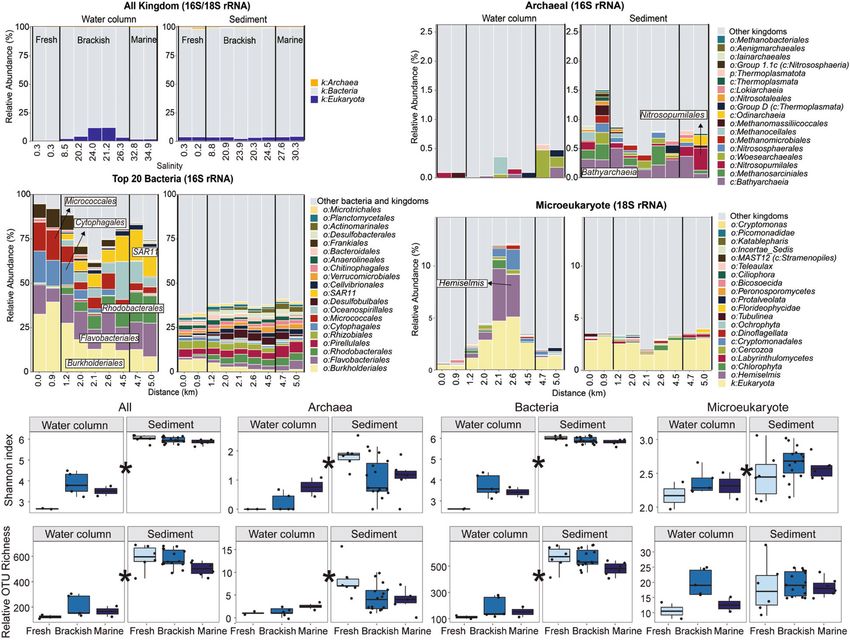
Tee et al. Microbiome      (2021) 9:190                                                                                                  Page 4 of 18

 Fig. 1 Plots showing variation in nutrient concentrations and community composition. a The Waiwera river sampling locations (1 to 9) with
 water column salinity gradient (0–35) shown using kriging interpolation. b Nutrient concentrations in sediment, sediment pore water and water
 samples taken in triplicate across the sampling sites. Grey background represents brackish sites (2.0–4.5 km along the transect). Abbreviations: TRP
 total recoverable phosphorus, TS total sulfur, TN total nitrogen, TOC total organic carbon, DRP dissolved reactive phosphorus, DNPOC dissolved
 non-purgeable organic carbon. Error bars represent standard errors of means. Asterisks (∗) indicate a significant difference between all water
 column and sediment samples (Wilcoxon p < 0.05). c Multivariate regression tree of microbial community abundance data associated with the
 environmental variables. Abbreviations: s salinity, NO2− nitrite, n sample size. Units: nitrite (g/m3). d NMDS ordination of small subunit rRNA gene
 sequences based on Bray–Curtis dissimilarities. Samples are coloured according to salinity. Environmental vectors were fitted onto the NMDS
 scores of the microbial community by the R-function envfit (p < 0.05, permutation = 999). e Distance–decay relationships of community
 dissimilarity (Bray–Curtis index) with increasing geographical distance. The regression lines were fitted to the data points using log generalised
 linear (GLM, solid line) and LOESS (dotted line) models. Each data point represents a pairwise comparison of samples from the water column
 (closed circles) or sediment (open circles)

abundances) was significantly different among non-                           brackish transition (peak at ~1.5 km) and higher simi-
saline, brackish and marine environments (Benjamini–                         larity at the brackish–marine transition (trough at
Hochberg adjusted p < 0.05, Supplementary Table 3).                          ~2.5 km; Fig. 1e). These results support findings that
Fewer benthic and planktonic OTUs were shared be-                            salinity strongly partitions freshwater and marine
tween freshwater and brackish (6.4–10.9%) than be-                           planktonic prokaryotic communities [14, 22], and also
tween saline brackish and marine (13.5–17.9%)                                demonstrate that the relatively small increase in salin-
environments (Supplementary Figure 2b). This is                              ity (of 8) spanning the freshwater–saltwater transition
reflected by the planktonic distance–decay curve,                            represents a powerful ecological barrier for both ben-
which shows greater dissimilarity at the freshwater–                         thic and planktonic communities.
Tee et al. Microbiome      (2021) 9:190                                                                                                 Page 5 of 18

 Fig. 2 Community distribution and alpha diversity. a Bar plots indicate relative abundances of EMIRGE-reconstructed 16S and 18S rRNA gene
 sequences. Site salinities are shown in the upper left plots, and transect distances are given in the lower plots. Taxa are coloured at the order
 level. For each plot, samples from the water column (left) and sediment (right) are further categorised into freshwater, brackish or marine, as
 indicated in the top left plot. b Boxplots illustrate Shannon indices and relative OTU richness in both sediment and water column environments
 across the salinity gradient for archaeal, bacterial and microeukaryal communities (n = 36). Colours indicate environment type (freshwater,
 brackish and marine) based on the salinity gradient. Boxes represent the interquartile range (IQR) between the first and third quartiles and the
 horizontal line inside the box represents the median. Whiskers represent the lowest and highest values within 1.5 times the IQR from the first and
 third quartiles, respectively. Individual sample values are shown as dots. Asterisks (∗) indicate a significant difference between all water column
 and sediment samples (Wilcoxon p < 0.05)

Influence of salinity on microbial alpha diversity                          median taxon richness increased from a minimum in
Microbial community alpha diversity, measured via the                       freshwater to a maximum in marine water (123 to 166
Shannon index and relative OTU richness, was signifi-                       OTUs), while the Shannon index increased from 2.7 in
cantly higher in sediments across the entire transect                       freshwater to 3.5–3.8 in brackish and marine water.
(Fig. 2a; Wilcoxon, p < 0.001), likely due to greater nu-                   Sediment community Shannon diversity and richness
trient availability (Fig. 1b), availability of terminal elec-               decreased along this gradient (Shannon indices from 6.0
tron acceptors, greater diversity in environmental niche                    to 5.9; OTUs from 596 to 502). While greater diversity
space and greater community stability associated with                       or taxon richness in marine water versus freshwater may
more static environmental conditions [1, 46, 48]. Benthic                   be attributed to OTUs being flushed out to sea, we ob-
and planktonic communities exhibited opposing trends                        served no evidence for this, as very few OTUs (
Tee et al. Microbiome       (2021) 9:190                                                                                                    Page 6 of 18

displayed no clear trend (Fig. 2b). Results showed no ob-                      identified a moderate correlation between differences in
vious reduction in prokaryotic or microeukaryote rich-                         gene and transcript abundances (ρ = 0.70, p < 0.01). Mi-
ness in the brackish zone, in contrast with Remane’s                           crobial composition is thought to be a poor predictor of
species minimum concept, which proposes minimum                                ecological processes due to functional redundancy and
richness for benthic macrofauna in the brackish horoha-                        variations in environmental response, leading to marked
linicum [4]. Our results on prokaryotes and microeukar-                        differences in transcript expression [50–53]. To ascertain
yotes, taken together with other studies that have found                       which metabolic features, associated with osmoregula-
a protistan species-maximum in brackish water [5, 49],                         tion, nutrient metabolism and primary production, were
suggest essential differences in taxa diversity associated                     strongly differentiated among freshwater, brackish and
with salinity gradients.                                                       marine environments, and between water and sediment,
                                                                               we applied linear discriminant analysis effect size (LEfSe)
Osmoregulation, nutrient metabolism and primary                                and weighted gene co-expression network analysis
production across environments                                                 (WGCNA). LEfSe results revealed 25 discriminative fea-
Differences in functional gene abundance and expression                        tures from the metagenomes and 42 from the metatran-
across sampled gradients and relationship to taxa                              scriptomes (Fig. 3a; Kruskal–Wallis p < 0.05,
composition                                                                    Supplementary Table 5), indicating a large shift in meta-
Overall, metabolic profiles (genes and genes expressed)                        bolic potential and, most notably, activity across this
decreased in similarity with increasing salinity diver-                        transect (Supplementary Figure 4). In agreement with
gence (Supplementary Figure 2c). However, neither                              LEfSe results, WGCNA analysis showed 4 out of 6 co-
taxonomic nor functional gene data were strong indica-                         expressed gene clusters were significantly associated
tors of gene expression, as previously observed for                            with environment (Supplementary Figure 5; details are
freshwater-to-marine planktonic [14], ocean [50] and hy-                       described in Supplementary Information), revealing a
persaline desert environments [51]. Mantel tests showed                        clear division in metabolism related to nutrient acquisi-
that while taxonomic beta-diversity was strongly corre-                        tion and osmoregulation between sediment and water
lated with differences in functional potential (ρ = 0.90, p                    and between saline and non-saline environments. Genes
< 0.01), it was only weakly correlated with differences in                     and transcript abundances related to phosphorus metab-
gene expression (ρ = 0.54, p < 0.01). Similarly, we                            olism, photosynthesis and osmoregulation were

 Fig. 3 Discriminative features and distribution of functional potential and metabolic activity across the salinity gradient. a Differentially abundant
 metabolic functions from metagenomic (top, n = 36) and metatranscriptomic (bottom, n = 33) data, as determined by LEfSe (specific pathways
 from Supplementary Table 5). Arrows indicate functions were significantly over-represented in their specific habitat. b Pie charts showing the
 relative fraction of functional gene categories across the freshwater-to-marine gradient based on metagenome and metatranscriptome data.
 Transcriptomic data were not obtained for marine sands due to low RNA quality. Colours in both panels indicate key nutrient acquisition and
 osmoregulation pathways
Tee et al. Microbiome (2021) 9:190 Page 7 of 18
significantly higher in fresh, brackish and marine water, genes with salinity suggests that brackish and marine
respectively (Fig. 3 and Supplementary Figure 5). In con- microorganisms increasingly exported destabilising Na+
trast, brackish sediment was characterised by signifi- in exchange for greater accumulation of K+ within cells,
cantly higher sulfur metabolism (Fig. 3a and which stabilise acidic salt-adapted proteins [17, 60, 61].
Supplementary Figure 5). Nutrients in tidal lagoon or Glycine betaine transporters, in contrast, uptake organic
bar-built estuaries, such as in this study, are generally solutes to achieve osmotic equilibrium [17, 62], or for
derived from runoff from land or groundwater inputs, metabolism and ATP generation [63].
and promote primary productivity and nutrient regener-
ation in brackish systems [54]. Fewer genes and tran- Spatial distribution of light and dark primary production
scripts were identified as significantly and differentially Autotrophic microbial and microeukaryotic communi-
abundant among benthic environments due to large var- ties play crucial roles in aquatic primary production and
iations in their relative abundance, reflecting the high form the base of the aquatic food chain. We observed
spatial heterogeneity in benthic community composition taxonomically diverse organisms across the river–marine
and nutrient availability (Figs. 1b and 2a). transect with capabilities for oxygenic or anoxygenic
photosynthesis and carbon fixation via the Calvin–Ben-
Distinct non-saline and saline osmoregulation strategies son, Wood–Ljungdahl and reverse tricarboxylic acid
In line with previous research indicating that microbial (TCA) pathways (Figs. 5 and 6). Gene expression related
taxonomic distributions are primarily driven by salinity to primary production was the highest in water in the
[14], largely due to lineage-specific adaptations to salt mid-brackish zone (salinity = 24; Figs. 4 and 6). This
tolerance [15, 17, 55], our results show that dominant corresponded with increased phytoplankton relative
microbial taxa in non-saline (Betaproteobacteria) and sa- abundance, particularly Cryptophyta (genus Hemiselmis;
line (Alphaproteobacteria and Gammaproteobacteria) Figs. 2a and 6), and a peak in ammonium (0.04 g/m3,
habitats adopted distinct osmoregulation strategies (Figs. Fig. 1b)—the preferred nitrogen source for Cryptomo-
4 and 5 and Supplementary Figure 6). While K+ acquisi- nads [64] (Supplementary Information). Data indicate
tion and Na+ export are considered important mecha- phytoplankton actively assimilated carbon via the Cal-
nisms for osmoregulation in brackish or marine vin–Benson cycle (RuBisCO) and conserved energy via
environments [14, 15], results here illustrate that K+ oxygenic photosynthesis (photosystems I and II; Figs. 5
transport is also crucial in freshwater communities. We and 6). In contrast, diatoms can photosynthesise and fix
observed a significantly greater abundance of the potas- carbon efficiently under low light [65]. Coastal lagoon
sium (K+) transporter gene kdp, in non-saline sediment systems, including the Waiwera river, are shallow water
(Kruskal–Wallis, p < 0.05, Fig. 4 and Supplementary Fig- bodies (Tee et al. Microbiome (2021) 9:190 Page 8 of 18 Fig. 4 Gene and gene expression profiles across the salinity gradient. Line plots showing log10-normalised gene and transcript abundances related to osmoregulation, nutrient acquisition and primary production pathways across the salinity gradient. Genes per category are given in Supplementary Table 9. Asterisks (*) indicate significant correlations between metagenomes and metatranscriptomes (Spearman ρ > 0.5, p < 0.05). Abbreviations: TPM genes/transcripts per million mapped reads Ljungdahl pathway, were primarily expressed in sedi- Wood–Ljungdahl pathway codh genes were highly ment environments. While we did not measure dissolved expressed in brackish sediments, primarily by Chloroflexi oxygen in this study, microorganisms undertaking dark and Deltaproteobacteria (Figs. 5 and 6). Wood–Ljung- carbon fixation typically thrive across a redox gradient, dahl pathway gene expression in the brackish sites was such as the oxic–anoxic interface in aquatic sediments at least 100 times greater than reverse TCA cycle gene [73, 74]. Both the Wood–Ljungdahl pathway and reduc- expression, but 10 times less than the Calvin cycle gene tive TCA cycle are strongly associated with anaerobes, expression (Figs. 5 and 6), highlighting the significance although the latter is also found in microaerobes and of the Calvin cycle and Wood–Ljungdahl pathway for some aerobes [75, 76]. Among organisms undertaking carbon assimilation in this brackish system. dark carbon fixation, we found that the reverse TCA cycle genes (aclA) were significantly more highly Nitrogen and phosphorus acquisition in freshwater and expressed in non-saline sediment (LDA score ≥2), and brackish environments predominantly by Nitrospira (Fig. 6), which our results Ammonium was the main inorganic nitrogen source ob- indicate also undertook complete ammonia oxidation served in benthic environments (0.1–2.7 g/m3), but was (comammox) in this environment (Fig. 5). In contrast, relatively scarce in the water column (
Tee et al. Microbiome     (2021) 9:190                                                                                                Page 9 of 18

 Fig. 5 Schematic illustrating metabolic genes and gene expression in benthic and planktonic environments across the freshwater-to-marine
 transect. Genes with relative abundances and expression levels at least twice higher than in those of other environments are shown. No
 transcriptomics data were available for marine sediments at sites 8 and 9. Key on right: rectangles with numbers represent metabolic pathways;
 ovals with letters indicate the main taxa expressing these genes

where nitrate and nitrite concentrations were also lower                   ammonium concentrations in the present study may not
(Fig. 1b and Supplementary Table 4). While ammonium,                       have affected nitrogenase activity. In contrast, there were
derived from anthropogenic activities, can be the domin-                   few to no nifABDH transcripts detected in the overlying
ant form of N entering shallow tidal lagoon settings [54],                 water, likely due to low predicted iron and molybdenum
such riverine inputs can also be nitrate-dominated [77],                   concentrations [85], which is characteristic of marine
as observed in this study (Fig. 1b). This suggests consid-                 water [81]. High iron and molybdenum are required for
erable benthic regeneration of ammonium [54] in the                        the FeMo nitrogenase cofactor in all known diazotrophs
sampled sediment (top 2 cm). Higher ammonium con-                          [86]. In some bacteria, excess nitrogen assimilated is
centrations in the benthic zones may also be due to sedi-                  stored intracellularly as cyanophycin granules comprised
mentation of phytoplankton blooms, boosting both                           of nitrogen and carbon storage polymers [80, 87]. Our
nitrate uptake and ammonium release in benthic envi-                       results indicate that genes related to cyanophycin (cphA)
ronments [78, 79]. Nitrate is therefore depleted during                    were significantly more abundant and highly expressed
spring bloom progression [54]. To deal with fluctuating                    by Betaproteobacteria in non-saline water (Figs. 3a and
nitrogen availability in aquatic ecosystems, microbial                     5, and Supplementary Figure 7), suggesting active stor-
communities are equipped with strategies for nitrogen                      age and utilisation of cyanophycin granules.
assimilation (e.g. fixation) and storage (cyanophycin) [80,                  Dissolved reactive phosphorus (DRP) concentrations
81]. Genes related to nitrogen fixation (nifABDH) were                     were the highest in marine sediment pore water (0.06 g/
detected and expressed in non-saline and brackish sedi-                    m3 ± 0.03), presumably owing to the naturally higher
ment (Figs. 4 and 5; no transcriptomic data are available                  rate of phosphorus mobilisation in marine sediments
for marine sediment), although ammonium levels were                        [23], and were lowest in freshwater environments (50 g/m3) or                         ment is complex, but is mainly controlled by increased
oxygen (>2 %) is reported to inhibit nitrogenase activity                  desorption under saline conditions [88, 89]. Previous
[82–84]. However, as ammonium concentrations tested                        studies have shown that the high-affinity inorganic phos-
were orders of magnitude higher than those we detected,                    phate transporter pst system and phosphate regulon
Tee et al. Microbiome      (2021) 9:190                                                                                                 Page 10 of 18

 Fig. 6 Distribution of taxon-specific genes and transcripts involved in photosynthesis and carbon fixation across the study sites. NA indicates that
 no transcriptomic data are available for marine sediments. Abbreviations: WGS metagenome, metatranscriptome (WTS), genes/transcripts per
 million mapped reads (TPM)

phoB-phoR (which regulates inorganic phosphate up-                           Our results indicate a reliance on efficient phosphate up-
take) are highly upregulated under phosphate-limited                         take and regulation mechanisms in phosphate-limited
conditions [90, 91]. Accordingly, data here shows that                       freshwater.
genes for phosphate uptake (pstSABC) and regulation
(phoU, phoB and phoR) were negatively correlated with                        Nitrogen cycling dynamics across the salinity gradient
phosphate concentration (ρ = −0.49, p < 0.05) and were                       Genes associated with nitrification and denitrification
significantly more highly expressed in phosphate-limited                     were predominantly expressed in brackish sediments
non-saline water (Fig. 3 and Supplementary Figures 5                         (Fig. 5), corresponding with higher total organic carbon
and 7)—primarily by Betaproteobacteria (Burkholder-                          (TOC), total nitrogen (TN) and total recoverable phos-
iales), which were highly abundant in this environment                       phorus (TRP) concentrations (Fig. 1b). Results indicate
(Fig. 2a). Depending on phosphate availability, phoR can                     that metabolic coupling between distinct taxa, to oxidise
act as a kinase (phosphate-limited conditions) or phos-                      ammonia fully to nitrate, was far more common than or-
phatase (phosphate-sufficient) and thereby activate or                       ganisms undertaking comammox along the transect
interrupt phoB phosphate regulation activity, respectively                   (Supplementary Figure 8). We detected relatively low ex-
[91]. In phosphate-limited conditions, the phosphory-                        pression of amoA genes involved in comammox by the
lated phoB activates the high-affinity pst operon [90, 91].                  class Nitrospira (the genus Nitrospira is well known for
Tee et al. Microbiome   (2021) 9:190                                                                         Page 11 of 18

nitrification and comammox [92]) at a single benthic          relationship between carbon/nitrate or nitrate/nitrite ra-
freshwater site (0.9 km along the transect, Supplemen-        tios and DNRA-related gene expression in sediment
tary Figure 8), where nitrate was highest and ammonium        (Supplementary Table 6). Although nitrate/nitrite ratios
concentration was lowest (Fig. 1b). In contrast, genes in-    decreased across the transect (primarily due to a corre-
volved in nitrification via ammonia oxidation to nitrite      sponding decrease in nitrate), nitrate concentrations
(amoA in archaea) and nitrite oxidation (nxrAB in             were on average over ten times higher for most brackish
Nitrospirae) were highly expressed in the brackish sedi-      sediment (ratios 4–34, distances ≤ 2.6 km along the
ments (Fig. 5 and Supplementary Figure 8). The relative       transect) (Fig. 1b and Supplementary Table 4). This sug-
abundances of ammonia-oxidising bacteria and archaea          gests that other unmeasured factors, such as sulfide con-
can vary in coastal and estuarine sediments, depending        centrations or microbial generation times [100, 103],
on the environmental conditions (salinity, oxygen and         may instead have influenced denitrifier and DNRA
ammonium concentration) [93–95]. Although archaea             activity.
constituted only a minor fraction of the overall micro-
biome (Fig. 2a), gene expression data indicates they were     Sulfur metabolism was most active in the brackish–marine
the primary ammonia oxidiser in brackish sediments            environment
and are important contributors to estuarine biogeo-           Like nitrification–denitrification, genes for sulfur metab-
chemical cycling.                                             olism, including sulfur reduction (cysN, sat and aprA for
  As for nitrification, genes related to nitrous oxide re-    sulfate; dsrABD for sulfite) and oxidation (rdsrAB for
duction (nosD, nosZ), the final step of the denitrification   sulfur), were significantly more highly expressed in
pathway, were predominantly expressed in brackish sedi-       brackish sediments (Fig. 3a, Supplementary Figures 9-
ments (Fig. 4) and were primarily associated with Bacter-     10). Expression was concomitant with highly abundant
oidetes (Fig. 5 and Supplementary Figure 8). Results          Gammaproteobacteria and Deltaproteobacteria capable
therefore suggest a strong coupling of nitrification and      of oxidising sulfur and reducing sulfate, respectively
denitrification in brackish sediments, leading to nitrogen    (Figs. 2a and 5). This is consistent with greater sulfide
loss from this estuary. Steep redox gradients promote         accumulation in brackish sediments owing to high mud
the co-occurrence of aerobic and anaerobic metabolic          and limited oxygen diffusion [30]. Taken together, these
pathways, including the aforementioned dark carbon fix-       results reinforce the findings of studies indicating the
ation reactions and coupled nitrification–denitrification     brackish environment is a hotspot for biogeochemical
[31, 96]. Such a gradient may be expected in brackish         cycling [104, 105]. However, the expression of thiosulfate
sediments given the combination of high mud and or-           oxidation genes (soxBCY) by Alphaproteobacteria was
ganic carbon contents (Fig. 1b and Supplementary Table        significantly higher in marine water (LDA score ≥ 2, Fig.
4), which are associated with hypoxic/anoxic conditions       3a and Supplementary Figure 9) and positively correlated
due to lower diffusion [97] and rapid consumption of          with high sulfate concentrations typical of marine water
oxygen within sediments, combined with oxygen gener-          (ρ = 0.76, p < 0.05; Fig. 1b and Supplementary Figure 5).
ated by photosynthesizing diatoms at the sediment–            Thiosulfate can serve as an electron donor for anoxy-
water interface (Figs. 5 and 6).                              genic photosynthesis [106] and be oxidised to sulfate via
  Unlike denitrification, dissimilatory nitrate reduction     the Sox pathway [107]. Bacterial groups that perform
to ammonium (DNRA) retains bioavailable nitrogen              aerobic anoxygenic photosynthesis (AAP), including
[98]. The first two steps in denitrification and DNRA are     alpha-, beta- and gamma-proteobacteria, are widely dis-
nitrate and nitrite reduction, of which the second step       tributed in the surface ocean [108, 109]. Greater expres-
involves distinct nitrite reductase enzymes (NirKS for        sion of genes related to thiosulfate oxidation
denitrification; NirBD/NrfA for DNRA) [99]. Results           (Supplementary Figure 9) and anoxygenic photosynthesis
show that DNRA genes (nrfA, nrfH) were highly                 (pufLM) by planktonic marine Alphaproteobacteria
expressed in non-saline sediment (Fig. 4 and Supple-          (Figs. 5 and 6) suggests these bacteria may have coupled
mentary Figure 8). The ratio of denitrification-nosZ to       thiosulfate oxidation with photoheterotrophy in rela-
DNRA-nrfA gene expression in freshwater sediment (ra-         tively carbon-limited marine water (DNPOC 1.7 versus
tio = 0.06) was on average 20 times lower than in brack-      2.2 g/m3 in brackish water) [110].
ish sediment (ratio = 1.56, Supplementary Table 6),
suggesting a partitioning between DNRA in freshwater          Conclusions
sediment and denitrification in brackish sediment. Previ-     Across the river–marine transect, in a tidal lagoon set-
ous studies have found that a higher ratio of organic car-    ting, the microbial community and diversity were domi-
bon (electron donor) to nitrate and a greater supply of       nated by bacteria. Contrasting diversity trends were
nitrate relative to nitrite favour DNRA over denitrifica-     observed between the water column and sediments, and
tion [78, 100–102]. However, we did not find any              between prokaryotes and microeukaryotes, reflecting the
Tee et al. Microbiome   (2021) 9:190                                                                           Page 12 of 18

strong geochemical differences between these environ-          to determine mud and sand contents. Mud (clay and silt)
ments, and the distinct physiologies and ecosystem roles       and sand are identified as sediment with sizes of 63 μm, respectively [111]. Mud content was calcu-
yotes represented only a minor fraction of the overall         lated as follows: the weight of mud fraction/weight of
communities, they played significant roles in ammonia          sediments from all fractions × 100 %.
oxidation and photosynthesis, respectively. Microorgan-
isms employed distinct osmoregulation strategies be-           Physiochemical and nutrient analyses
tween freshwater and saline habitats by actively               Temperature, pH and salinity were measured on-site
expressing diverse osmoregulation genes encoding po-           using a Pocket Pro+ Multi 2 Tester (HACH, CO, USA).
tassium, sodium and glycine betaine transporters across        All sediment and water samples were sent to Hill La-
the transect. Results indicate a significant predominance      boratories (Hamilton, New Zealand) for processing. All
of phosphate acquisition in non-saline water, along with       nutrients were measured according to standard Ameri-
microeukaryotic-driven primary production, and pro-            can Public Health Association (APHA) protocols [112].
karyotic nitrification–denitrification and sulfur metabol-     TRP, TS, TN and TOC were only measured from sedi-
ism in the brackish sediments, corresponding with large        ment samples. All other nutrients were measured from
differences in resource availability. Overall, our study       water column and sediment pore water samples. Briefly,
demonstrates that differences in salinity and nutrients        sediment TOC, following pre-treatment with acid to re-
impose significant biological boundaries between sedi-         move carbonates, was analysed using an Elementar Vario
ment and water, and among non-saline, brackish and             MAX Combustion Analyser (Langenselbold, Germany)
marine environments.                                           with catalytic combustion (at 900 °C) and TN was mea-
                                                               sured via an Lachat Quikchem Series 2 Flow injection
Materials and methods                                          Analyser (Lachat Instruments, CO, USA). Total sulfur
Sampling strategy                                              was measured using a LECO SC-32 Sulfur Determinator
Sampling was undertaken on 12 November 2018 within             (MI, USA), and TRP was analysed using a Aquakem
a low tide period. Nine sites (sites 1–9, Fig. 1a; site pho-   Konelab 600 Discrete Analyser (Thermo Fisher Scien-
tos, Supplementary Figure 11) were selected covering a         tific, MA, USA). Water samples were prefiltered through
freshwater-to-marine salinity (S) gradient (0.2 < S < 35)      0.45-μm membrane filters and saline samples diluted
across a 5-km-long transect of the Waiwera river and es-       prior to analyses. Total ammonical-N, nitrate, nitrite and
tuary, north of Auckland, New Zealand (36° 33′ 02.4″ S,        DRP were measured via a Lachat Quikchem Series 2
174° 39′ 08.1″ E). For molecular analyses, at least 10 L       flow injection analyser (Lachat Instruments, CO, USA).
of water was collected between 0.2 and 1 m below the           Sulfate was analysed using a Dionex Ion Chromatog-
surface of all sites and sequentially filtered through ster-   raphy system (Sunnyvale, CA, USA). Samples for
ile 1.2-μm and 0.22-μm mixed cellulose ester filters           DNPOC were acidified to remove inorganic C before
(Merck Millipore, MA, USA). Triplicate water samples           addition of persulfate, heating to a temperature of above
(unfiltered) were similarly collected in polyethylene bot-     375 °C and analysis via a Sievers Innovox TOC analyser
tles for chemical analysis at Hill Laboratories (Hamilton,     (SUEZ Analytical Instruments, CO, USA). River turbidity
New Zealand). The top 2 cm of sediment was collected           data, collected by Auckland Council at GPS coordinates
at three locations approximately 5 m apart at each site        36° 33′ 01.4″ S 174° 39′ 59.3″ E, were obtained from
and wet sieved through a 1-mm mesh sieve to remove             the Land, Air, Water Aotearoa (https://www.lawa.org.nz/
stones, plant material and macrofauna. All filter and          ).
sediment samples for molecular analyses were immedi-
ately preserved with LifeGuard Soil Preservation Solu-         Nucleic acid extraction and sequencing
tion (Qiagen, MD, USA) in sterile 50-mL Falcon tubes           Both RNA and DNA were co-extracted using RNeasy
(1:3 wet sediment-to-LifeGuard ratio, individual water         PowerSoil Total RNA Kits and RNeasy PowerSoil DNA
samples were filtered and preserved within 5–10 min of         Elution Kits (Qiagen, MD, USA). Total RNA and DNA
sample collection) and stored at −80 °C until extraction.      from each sample were isolated from 2–8 g of sediment
Samples for mud content and chemical analyses were             or 1–5 g of filter (1/3-1 filter, 10L water per filter) with
stored at 4 °C.                                                collected planktonic biomass (both 1.2 μm and 0.22 μm
                                                               combined). Extracted nucleic acids were stored at −80
Mud content measurement                                        °C. RNA samples were treated with DNaseI. DNA re-
Sediment samples were oven dried at 105 °C for 12 h            moval was verified by PCR amplification of the 16S
prior to sieving. Sediments were serially sieved using         rRNA genes using 515F/806R primers [113, 114], Jump-
mesh sizes ranging from 1 mm to 63 μm with a sieve             Start REDTaq Readymix (Sigma-Aldrich, MO, USA) and
shaker. Fractions retained on each mesh were weighed           2 μL of the template (sample or positive control), under
Tee et al. Microbiome (2021) 9:190 Page 13 of 18 the following conditions: 95 °C for 5 min; 55 cycles: 95 (DNA) and
Tee et al. Microbiome   (2021) 9:190                                                                                        Page 14 of 18

against the NCBI nr protein database (downloaded on           tree size = 8 to identify the main predictors that correl-
16 February 2020), using a weighted lowest common an-         ate with microbial community structure. As both salinity
cestor (LCA) approach. We retained only hits with at          and distance were highly correlated and exhibited multi-
least 70% query coverage, 80% identity and bit scores         collinearity, we used salinity (and excluded distance) as
within 5% of the top hit for LCA identification.              one of the predictor variables for the analysis. The deci-
                                                              sion tree identifies variance in microbial community
Metagenome and metatranscriptome read mapping and             composition (Bray–Curtis dissimilarity) caused by
counts                                                        threshold values of key site physicochemical attributes.
DNA and RNA (non-rRNA) reads were mapped back to              The values attached to each branch of the tree mark the
metagenomic contigs using BBMap v37.93 [116] with             physicochemical criteria used by the regression tree to
default parameters. Read counts were calculated for each      group samples based on differences in community
predicted open reading frame (ORF) using feature-             composition.
Counts v2.0.0 [134]. Gene and transcript counts were            The correlation between gene and transcript relative
normalised using gene or transcript per million mapped        abundances was measured using the R cor.test function.
reads (TPM) to measure the bulk contribution of the           Mantel tests were run to assess Spearman’s correlations
community [135, 136]. TPM = (number of reads mapped           between functional and taxonomic community dissimi-
to the gene/gene length)/sum (number of reads mapped          larity matrices based on Bray–Curtis dissimilarities.
to the gene/gene length) × 1,000,000.                         LEfSe was applied to metagenomic and metatranscrip-
                                                              tomics data to identify environment-associated meta-
Statistical analyses                                          bolic functions by utilising Kruskal–Wallis and
Unless otherwise stated, the following statistical analyses   Wilcoxon rank-sum tests to determine variations occur-
were carried out in R environment version 3.5.1 [137].        ring between and within environments with a linear dis-
Shannon–Wiener indices, Simpson’s indices and relative        criminant analysis (LDA) score of ≥2 [141]. To
OTU richness were determined using the vegan package          determine co-expressed genes associated with environ-
[138] and the rarefied OTU table combining recon-             mental parameters, weighted correlation network ana-
structed 16S and 18S rRNA genes. A Wilcoxon signed-           lysis was also performed using transcript counts
rank test was performed to determine significant differ-      normalised by TPM as input data to find clusters of
ences in observed diversity between the water column          highly correlated gene transcripts by using WGCNA
and sediment. Distance–decay relationships for micro-         package [142] with minimum module size = 5 and soft-
bial communities and functional gene groups were con-         thresholding power = 14 (R2 = 0.81) to relate the func-
structed by first calculating pairwise Bray–Curtis            tions or modules to one another and to environmental
dissimilarities among sites using the vegdist function in     parameters.
the vegan package [138], and fitting negative exponential
functions via a log-linked generalised linear model
(GLM) or local polynomial regression (LOESS) model.           Supplementary Information
                                                              The online version contains supplementary material available at https://doi.
NMDS ordinations were plotted based on Bray–Curtis            org/10.1186/s40168-021-01145-3.
dissimilarities, and environmental variables were fitted
with 999 Monte Carlo permutation tests using the vegan         Additional file 1. Supplementary tables.
package [138]. Pairwise permutational multivariate ana-        Additional file 2. Supplementary results and discussion, and figures.
lyses of variance (PERMANOVA) with Benjamini–
Hochberg corrections were carried out to test for statis-
                                                              Acknowledgements
tically significant variance among multivariate microbial     Computational resources were provided by New Zealand eScience
community data using the pairwiseAdonis package               Infrastructure. We thank B Weir (Landcare Research) and C Astudillo-García,
[139]. Spearman’s correlation coefficients between the        JS Boey, O Mosley and E Gios (University of Auckland) for assisting in sample
                                                              collection and M Hoggard (University of Auckland) for manuscript edits.
relative abundances of specific taxa and environmental
parameters were calculated using the R cor function.
                                                              Authors’ contributions
Taxa with p < 0.05 were determined to be significantly        KMH, DW, GL and HST designed the study and collected the samples. HST
correlated with the environmental parameters. The             and DW prepared samples for sequencing and nutrient measurements. HST
bioenv function in R’s vegan package [138] was used           and DW processed and analysed the data. HST, KMH and GL wrote the
                                                              manuscript. All authors read and approved the final manuscript.
with Spearman’s rank correlations to search over subsets
of the continuous environmental variables to determine
the best explanatory variables for community compos-          Funding
                                                              This research was supported by Genomics Aotearoa (project 1806), a New
ition. A multivariate regression tree was plotted using       Zealand Ministry of Business, Innovation, and Employment-funded research
mvpart package [140], with 1000 cross-validations and         platform (http://www.genomics-aotearoa.org.nz/).
Tee et al. Microbiome (2021) 9:190 Page 15 of 18
Availability of data and materials 14. Fortunato CS, Crump BC. Microbial gene abundance and expression
The data generated in the current study are all publicly available. All patterns across a river to ocean salinity gradient. PLoS One. 2015;10(11):
sequence data have been deposited with NCBI under BioProject e0140578. https://doi.org/10.1371/journal.pone.0140578.
PRJNA668816. R scripts for plotting figures and statistical analyses are 15. Walsh DA, Lafontaine J, Grossart H-P. On the eco-evolutionary
available at https://github.com/HweeSze/Waiwera_manuscript_plots. relationships of fresh and salt water bacteria and the role of gene
transfer in their adaptation. In: Gophna U, editor. Lateral Gene Transf
Declarations Evol. New York: Springer; 2013. p. 55–77. https://doi.org/10.1007/978-1-4
614-7780-8_3.
Ethics approval and consent to participate 16. Henson MW, Lanclos VC, Faircloth BC, Thrash JC. Cultivation and genomics
Not applicable. of the first freshwater SAR11 (LD12) isolate. ISME J. Nature Publishing Group.
2018;12:1846–60.
Consent for publication 17. Oren A. Life at high salt concentrations. In: Rosenberg E, DeLong EF,
Not applicable. Lory S, Stackebrandt E, Thompson F, editors. The prokaryotes. 4th ed.
Berlin: Springer; 2013. p. 421–40. https://doi.org/10.1007/978-3-642-3
Competing interests 0123-0_57.
The authors declare that they have no competing interests. 18. Trchounian A, Kobayashi H. Kup is the major K+ uptake system in Escherichia
coli upon hyper-osmotic stress at a low pH. FEBS Lett. 1999;447(2-3):144–8.
Author details https://doi.org/10.1016/S0014-5793(99)00288-4.
1
School of Biological Sciences, University of Auckland, Auckland 1010, New 19. Trchounian A, Kobayashi H. K+ uptake by fermenting Escherichia coli cells:
Zealand. 2Current address: Ministry for Primary Industries, Auckland, New pH dependent mode of the TrkA system operating. Biosci Rep. 2000;20(4):
Zealand. 277–88. https://doi.org/10.1023/A:1026493024066.
20. Bañuelos MA, Klein RD, Alexander-Bowman SJ, Rodríguez-Navarro A. A
Received: 30 May 2021 Accepted: 2 August 2021 potassium transporter of the yeast Schwanniomyces occidentalis
homologous to the Kup system of Escherichia coli has a high concentrative
capacity. EMBO J. 1995;14(13):3021–7. https://doi.org/10.1002/j.1460-2075.1
995.tb07304.x.
References
21. Rhoads DB, Waters FB, Epstein W. Cation transport in Escherichia coli. VIII.
1. Allan JD, Ibañez Castillo MM. Stream ecology: structure and function of
Potassium transport mutants. J Gen Physiol. 1976;67(3):325–41. https://doi.
running waters. 2nd ed. Dordrecht: Springer; 2007. https://doi.org/10.1007/
org/10.1085/jgp.67.3.325.
978-1-4020-5583-6.
2. Heinrichs ME, Mori C, Dlugosch L. Complex interactions between aquatic 22. Paver SF, Muratore D, Newton RJ, Coleman ML. Reevaluating the salty
organisms and their chemical environment elucidated from different divide: phylogenetic specificity of transitions between marine and
perspectives. In: Jungblut S, Liebich V, Bode-Dalby M, editors. YOUMARES 9 freshwater systems. Flynn TM, editor. mSystems. 2018;3:e00232–18.
- Oceans Our Res Our Future. Cham: Springer; 2020. p. 279–97. https://doi. 23. Caraco N, Cole J, Likens GE. A comparison of phosphorus immobilization in
org/10.1007/978-3-030-20389-4_15. sediments of freshwater and coastal marine systems. Biogeochemistry. 1990;
3. Cloern JE, Jassby AD, Schraga TS, Nejad E, Martin C. Ecosystem variability 9(3):277–90. https://doi.org/10.1007/BF00000602.
along the estuarine salinity gradient: examples from long-term study of San 24. Xia X, Zhang S, Li S, Zhang L, Wang G, Zhang L, et al. The cycle of nitrogen
Francisco Bay. Limnol Oceanogr. 2017;62(S1):272–91. https://doi.org/10.1 in river systems: sources, transformation, and flux. Environ Sci Process
002/lno.10537. Impacts. 2018;20(6):863–91. https://doi.org/10.1039/C8EM00042E.
4. Remane A. Die brackwasserfauna. Verh Dt Zool Ges. 1934;36:34–74. 25. Berner RA. Sedimentary pyrite formation. Am J Sci. 1970;268(1):1–23. https://
5. Filker S, Kühner S, Heckwolf M, Dierking J, Stoeck T. A fundamental doi.org/10.2475/ajs.268.1.1.
difference between macrobiota and microbial eukaryotes: protistan 26. Emeis KC, Struck U, Leipe T, Pollehne F, Kunzendorf H, Christiansen C.
plankton has a species maximum in the freshwater-marine transition zone Changes in the C, N, P burial rates in some Baltic Sea sediments over the
of the Baltic Sea. Environ Microbiol. 2019;21(2):603–17. https://doi.org/1 last 150 years - relevance to P regeneration rates and the phosphorus cycle.
0.1111/1462-2920.14502. Mar Geol. Elsevier. 2000;167(1-2):43–59. https://doi.org/10.1016/S0025-322
6. Herlemann DP, Labrenz M, Jürgens K, Bertilsson S, Waniek JJ, Andersson AF. 7(00)00015-3.
Transitions in bacterial communities along the 2000 km salinity gradient of 27. Mcdowell RW, Larned ST, Houlbrooke DJ. Nitrogen and phosphorus in New
the Baltic Sea. ISME J. 2011;5(10):1571–9. https://doi.org/10.1038/ismej.2 Zealand streams and rivers: control and impact of eutrophication and the
011.41. influence of land management. N Z J Mar Freshw Res. 2009;43(4):985–95.
7. Herlemann DPR, Lundin D, Andersson AF, Labrenz M, Jürgens K. https://doi.org/10.1080/00288330909510055.
Phylogenetic signals of salinity and season in bacterial community 28. Cloern JE, Foster SQ, Kleckner AE. Phytoplankton primary production in the
composition across the salinity gradient of the Baltic Sea. Front Microbiol. world’s estuarine-coastal ecosystems. Biogeosciences. 2014;11(9):2477–501.
Frontiers. 2016;7:1883. https://doi.org/10.5194/bg-11-2477-2014.
8. Wang J, Yang D, Zhang Y, Shen J, van der Gast C, Hahn MW, et al. Do 29. Andersson A, Brugel S, Paczkowska J, Rowe OF, Figueroa D, Kratzer S, et al.
patterns of bacterial diversity along salinity gradients differ from those Influence of allochthonous dissolved organic matter on pelagic basal
observed for macroorganisms? PLoS One. Public Library Sci. 2011;6(11): production in a northerly estuary. Estuar Coast Shelf Sci. 2018;204:225–35.
e27597. https://doi.org/10.1371/journal.pone.0027597. https://doi.org/10.1016/j.ecss.2018.02.032.
9. Lozupone CA, Knight R. Global patterns in bacterial diversity. Proc Natl Acad 30. Hargrave BT, Holmer M, Newcombe CP. Towards a classification of organic
Sci. 2007;104(27):11436–40. https://doi.org/10.1073/pnas.0611525104. enrichment in marine sediments based on biogeochemical indicators. Mar
10. Thompson LR, Sanders JG, McDonald D, Amir A, Ladau J, Locey KJ, et al. A Pollut Bull. 2008;56(5):810–24. https://doi.org/10.1016/j.marpolbul.2008.02.
communal catalogue reveals earth’s multiscale microbial diversity. Nature. 006.
Nature Publishing Group. 2017;551:457–63. 31. An S, Joye SB. Enhancement of coupled nitrification-denitrification by
11. Mason OU, Canter EJ, Gillies LE, Paisie TK, Roberts BJ. Mississippi River plume benthic photosynthesis in shallow estuarine sediments. Limnol Oceanogr.
enriches microbial diversity in the Northern Gulf of Mexico. Front Microbiol. 2001;46(1):62–74. https://doi.org/10.4319/lo.2001.46.1.0062.
Frontiers. 2016;7:1048. 32. Holland KR, Kleinmans A, Hussain E. State of the environment monitoring:
12. Doherty M, Yager PL, Moran MA, Coles VJ, Fortunato CS, Krusche AV, et al. river water quality annual report 2016. New Zealand: Auckland Council;
Bacterial biogeography across the Amazon river-ocean continuum. Front 2018. p. 1–57. Report No.: TR2018/003
Microbiol. Frontiers. 2017;8:882. 33. Kennish MJ. Estuaries, anthropogenic impacts. In: Schwartz ML, editor.
13. Dupont CL, Larsson J, Yooseph S, Ininbergs K, Goll J, Asplund-Samuelsson J, Encycl Coast Sci. Dordrecht: Springer Netherlands; 2005. p. 434–6.
et al. Functional tradeoffs underpin salinity-driven divergence in microbial 34. Kennish MJ. Environmental threats and environmental future of estuaries.
community composition. PLoS One. Public Library of Science. 2014;9: Environ Conserv. Cambridge University Press. 2002;29(1):78–107. https://doi.
e89549. org/10.1017/S0376892902000061.You can also read


