Optical three-dimensional vibrometer microscope with picometer-resolution in x, y
←
→
Page content transcription
If your browser does not render page correctly, please read the page content below
Optical three-dimensional vibrometer
                 microscope with picometer-resolution
                 in x, y, and z

                 Christian Rembe
                 Robert Kowarsch
                 Wanja Ochs
                 Alexander Dräbenstedt
                 Moritz Giesen
                 Marcus Winter

Downloaded From: https://www.spiedigitallibrary.org/journals/Optical-Engineering on 02 Dec 2021
Terms of Use: https://www.spiedigitallibrary.org/terms-of-use
Optical Engineering 53(3), 034108 (March 2014)

                Optical three-dimensional vibrometer microscope with
                picometer-resolution in x , y , and z
                Christian Rembe,* Robert Kowarsch, Wanja Ochs, Alexander Dräbenstedt, Moritz Giesen, and Marcus Winter
                Polytec GmbH, Research & Development, Polytec Platz 1-7, Waldbronn 76337, Germany

                              Abstract. The state-of-the-art technique for optical vibration analysis of macroscopic structures is laser-Doppler
                              vibrometry in which a single-laser beam measures the motion in the beam direction. Thus, three laser beams are
                              necessary to investigate three-dimensional (3-D) motions. The laser spots can be separated on macroscopic spec-
                              imens with scattering surfaces to prevent optical crosstalk between the measurement beams, but such separation
                              is impossible for a microscopic scatter point. We demonstrate a solution for this problem: an optical 3-D vibrometer
                              microscope with a single-impinging laser beam, which collects scattered light from at least three directions. We
                              prove that it is possible to realize a small laser focus of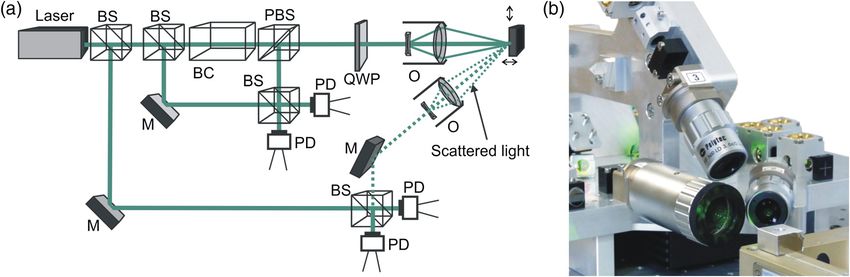
Rembe et al.: Optical three-dimensional vibrometer microscope with picometer-resolution. . .

                         1
                fD ¼       ½~v · ð~kdet − ~kin Þ                                       (1)
                        2π
                is expressed as the scalar product of the velocity vector ~v of
                the scatter point and the difference of the wave vectors
                of the impinging beam ~kin and the wave vector in direction
                of the optical axis of the detection optics ~kdet
                (j~kdet j ≈ j~kin j ¼ 2π∕λ).
                    Note, an arbitrarily moving measurement spot results
                in a Doppler shift f D ðtÞ ¼ ð1∕2πÞ½dϕðtÞ∕dt that is not a con-
                stant frequency shift but the time-dependent derivative of the
                measurement-light phase ϕðtÞ ¼ ~sðtÞ · ð~kdet − ~kin Þ dependent
                on the specimen displacement ~sðtÞ. In a strict sense, Eq. (1) is
                an approximation for the Doppler frequency shift of the scat-
                tered radiation neglecting retardation. However, the formula is
                                                                                                  Fig. 1 The vector diagram in (a) visualizes the vector Eq. (1), while
                sufficient for most technical applications, where the (measur-                    the vector diagram in (b) shows wave vectors for direct reflection with
                able) velocity of the scatter point is much lower than the veloc-                 the surface normal ~n .
                ity of light (j~vj ≪ c) and, in addition, we have measured the
                movement of an accurate stage to study the correctness of                          while the remaining light is used as reference light for the
                Eq. (1), experimentally5 on a rough surface under presence                         three interferometer channels (Fig. 3).
                of laser Speckle effects. Equation (1) and the schematic in                            The impinging beam is frequency-shifted acousto-optically
                Fig. 1(a) show that the measured Doppler shift is proportional                     in respect to the reference beams with a Bragg-cell by 40 MHz
                to the object velocity component in the direction of the bisec-                    to realize a shot-noise-limited heterodyne interferometric
                tor of the angle spanned by ~kdet and ~kin .                                       detection from three balanced photodetectors. The heterodyne
                    Coaxial wave vectors (~kdet ¼ −~kin ) describe the arrange-
                                                                                                   detector signals are digitized and frequency demodulated with
                ment for a standard laser-Doppler vibration measurement
                                                                                                   standard decoders from Polytec, Waldbronn, Germany. In par-
                and measure only the motion component parallel to the meas-
                                                                                                   ticular, the electronics front-end from the existing PSV-500
                urement beam. A coaxial arrangement which also impinges
                                                                                                   system for macroscopic structures can reliably decode object
                the surface collinearly with the surface normal collects a maxi-
                mal light power and receives the maximal Doppler shift for                         motions with up to 2-MHz frequency and a maximum
                out-of-plane motion if, for example, a Lambertian scatter                          coaxially measured velocity of 8 m∕s for the utilized laser
                behavior21 is assumed. As the Doppler frequency shift due                          wavelength of 532 nm. Recently a special controller has
                to in-plane object motion and the spatial distribution of scat-                    been realized at Polytec which has extended the frequency
                tered light are antagonistic there exists also an angular                          range up to 25 MHz and the maximal measurable velocity
                arrangement for ~kdet and ~kin , where the detection of an in-                     up to 10 m/s. An integrated camera allows the analysis and
                plane motion is optimal. A useful criterion is the in-plane,                       adjustment of the beam-path arrangement as well as the align-
                velocity-, or displacement-noise amplitude assuming shot-                          ment of the measurement spot on the sample lighted with an
                noise-limited detection and a certain scatter behavior, con-                       integrated microscope illumination.
                scious that the chosen scatter model will greatly influence                            Our solution measures one direction coaxially to the
                the result.                                                                        impinging beam (on-axis) with interferometer channel 1
                                                                                                   to make best use of the available solid angle above the sur-
                2.2 Scattered-Light Conditions                                                     face, which has to be segmented between the three detection
                                                                                                   channels and the impinging beam (see Fig. 2). We define the
                 Inserting the vector formula for direct reflection ~kdet − ~kin ¼                 z-axis parallel to the impinging laser beam because usually
                 2j~n · ~kin j~n with the surface normal ~n [see Fig. 1(b)] in                     the optical axis of interferometer channel 1 detects the out-
                 Eq. (1), the detected Doppler frequency shift becomes                             of-plane vibration and provides also the beam path for a dig-
                 f D ¼ ð1∕πÞj~n · ~kin j~v · ~n. Obviously, no Doppler frequency                  ital-camera image necessary to align the measurement spot
                 shift due to in-plane motion can be detected (since                               on the sample. The two off-axis interferometer channels
                ~v ⊥ ~n ⇔ ~v · ~n ¼ 0) while “out-of-plane” motion is well                         collect the light under the angle ϕdet in respect to the imping-
                 accessible (since ~vjj~n ⇔ ~v · ~n ¼ j~vj) with a velocity sensitiv-              ing beam. The projections of the two detection channels 2
                 ity of ð1∕πÞj~n · ~kin j. Therefore, a perpendicularly impinging                  and 3 on the x − y plane are orthogonal to ensure equal sen-
                 and detecting beam have been chosen (with a sensitivity
                                                                                                   sitivity in both in-plane directions.
                 2∕λ), and it follows that a Doppler frequency shift due to
                                                                                                       The wave vector ~kin and the three wave vectors ~kdet can be
                 in-plane motion only exists in scattered radiation detected
                                                                                                   expressed in the coordinate system of Fig. 3
                 by the off-axis interferometer channels.                                                       0      1                0 1
                                                                                                                    0                        0
                3 Optical 3-D Vibrometer Microscope                                                          2π B      C            2π  B      C
                                                                                                     ~kin ¼     @ 0 A; ~kdet 1 ¼        @ 0 A;
                                                                                                              λ                       λ
                3.1 Optical System                                                                                 −1                        1
                Our realized setup consisting of three interlaced Mach–                                         0             1                    0          1
                                                                                                                   − sin ϕdet                           0
                Zehnder interferometers is demonstrated in Fig. 2 for two
                interferometer channels.                                                          ~kdet 2 ¼ 2π B@      0
                                                                                                                              C
                                                                                                                              A; and ~kdet 3 ¼
                                                                                                                                                2π B          C
                                                                                                                                                   @ sin ϕdet A: (2)
                                                                                                              λ                                  λ
                   A laser-light power of 5 mW from a green 20-mW diode-                                            cos ϕdet                         cos ϕdet
                pumped, solid-state laser is split to impinge the specimen

                Optical Engineering                                                       034108-2                                             March 2014    •   Vol. 53(3)

Downloaded From: https://www.spiedigitallibrary.org/journals/Optical-Engineering on 02 Dec 2021
Terms of Use: https://www.spiedigitallibrary.org/terms-of-use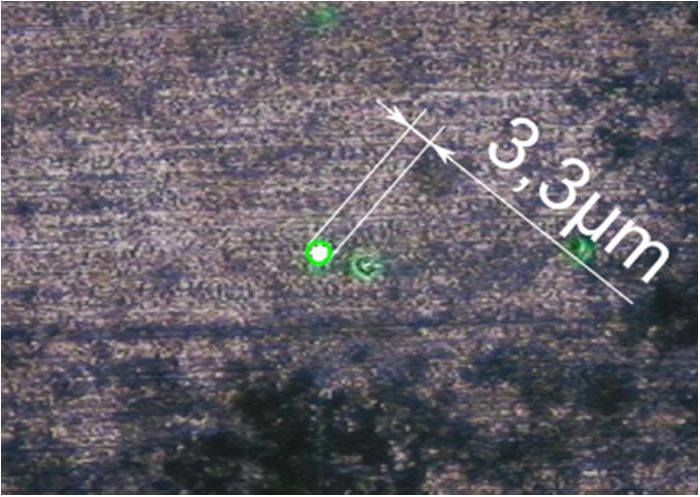
Rembe et al.: Optical three-dimensional vibrometer microscope with picometer-resolution. . .
Fig. 2 Demonstration of the optical setup. The center path and one of the two perpendicular detection
paths are shown in the simplified schematic of our setup (a). The second off-axis-detection channel lies in
the plane perpendicular to the plane shown in (a), and the 90-deg angle between the off-axis-detection
channels can be seen in the photograph (b). BC is Bragg cell, BS is beam splitter, PBS is polarization
beam splitter, QWP is quarter wave plate, A is aperture, PD is photo diode, O is a microscope objective,
and M is a mirror.
0 81 −1
9
Using Eqs. (1) and (3) the relation between frequency vx < ½2 tanðϕdet ∕2Þ
> ½− sin ϕdet −1 0 >
=
shift for all three detection channels and object velocity at B C −1 −1
@ yA
v ¼ λ ½−2 tanðϕdet ∕2Þ 0 ½sin ϕdet
the measurement point is determined as >
: >
;
vz 1∕2 0 0
0 1
0 1 0 10 1 f D1
f D1 0 0 2 vx
B C
~f ¼ B C 1B CB C × @ f D2 A: (4)
@ f D2 A ¼ @ − sin ϕdet 0 1 þ cos ϕdet A@ vy A
λ f D3
f D3 0 sin ϕdet 1 þ cos ϕdet vz
¼ T · ~v: (3) Equation (3) has to be evaluated in the signal processing
to derive the correct vibration information from the three
Doppler shift frequencies.
Equation (3) demonstrates that interferometer channel 1 is
only sensitive to displacements in z-direction, channel 2 is
3.2 Design Criteria of the Optics
sensitive to displacement in x- and z-directions, and channel
3 is sensitive to displacements in y- and z-directions. By The selection of the angle ϕdet and the numerical apertures
computing the inverse matrix T −1 from Eq. (3), we obtain (NAs) of the three channels have to ensure (1) a minimal
(~v ¼ T −1 · ~f) to compute the instantaneous velocities from measurement spot size, (2) sufficient range for the out-of-
the Doppler shifts f D1 , f D2 , and f D3 in the directions plane displacement measurement, and (3) sufficient resolu-
~kdet;1 , ~kdet;2 , and ~kdet;3 by the linear transformation tion of the vibration signals. To realize high NAs with low
aberrations and a large working distance (WD), we use spe-
cial long-distance microscope objectives. Our proposed
design has the advantage that the measurement spot size
is only defined by the diameter of the Gaussian beam
waist on the specimen which results from the collimated-
beam diameter at the exit pupil and the focal length of
the microscope objective of channel 1. For the off-axis inter-
ferometer channels 2 and 3, only collected scattered light
which interferes efficiently with the Gaussian-shaped refer-
ence beams on the photo detectors can contribute to the
heterodyne-signal strength. Thus, the beam propagation
paths of the detecting interferometer channels are defined
by the Gaussian reference beams at the detectors of channels
2 and 3 imaged virtually by the receiving optics on the speci-
men. The better the overlap between impinging and detection
beam paths, the better the sensitivity of the off-axis channels.
Regarding only lateral resolution, the waist diameters of the
Fig. 3 Optical arrangement. General beam arrangement of the inter- Gaussian beams of interferometer channels 2 and 3 at the
ferometer channels with definitions for the detection angle ϕdet and the measurement spot can be larger than the measurement
vibration coordinate system but without the interferometric detection spot size because as passive detectors they do not affect spa-
which is shown in Fig. 2. The wave vector of the incident beam ~k in and
the wave vector of the center detection path ~k det;1 are in direction of tial resolution on the object. Larger waist diameters for chan-
the z-axis. Here, we define that the vectors ~k det;1 and ~k det;2 lie parallel nels 2 and 3 improve the alignment tolerance and
to the x − z plane while ~k det;1 and ~k det;3 lie parallel to the y − z plane. measurement depth at the expense of some sensitivity, as
Optical Engineering 034108-3 March 2014 • Vol. 53(3)
Downloaded From: https://www.spiedigitallibrary.org/journals/Optical-Engineering on 02 Dec 2021
Terms of Use: https://www.spiedigitallibrary.org/terms-of-use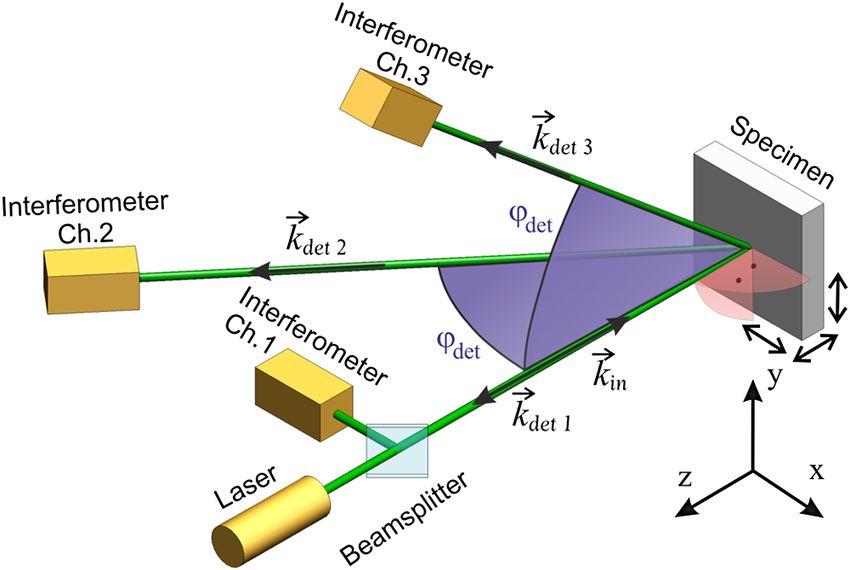
Rembe et al.: Optical three-dimensional vibrometer microscope with picometer-resolution. . .

                the receiving NA is smaller and, thus, less scattered light is                    4 Performance Analysis
                collected.
                                                                                                  4.1 Analyzing the Spot Diameter of the Impinging
                                                                                                      Beam
                3.3 Optimization of the Optical Arrangement                                       An important goal of the 3-D vibrometer microscope design
                The signal-to-noise ratio (SNR) of the detected displacement                      is the generation of a microscopic measurement spot on the
                or velocity signal depends on the square root of the detected                     specimen. The photograph (Fig. 5) of the measurement spot
                power of the measurement light.2 The detected measure-                            captured with an integrated camera module with defined
                ment-light power is proportional to cos ϕdet if an ideal                          pixel size has been evaluated to estimate the focus diameter
                Lambertian scatter characteristic is regarded. This is consid-                    on the specimen.
                                                                                                      The spot has a diameter of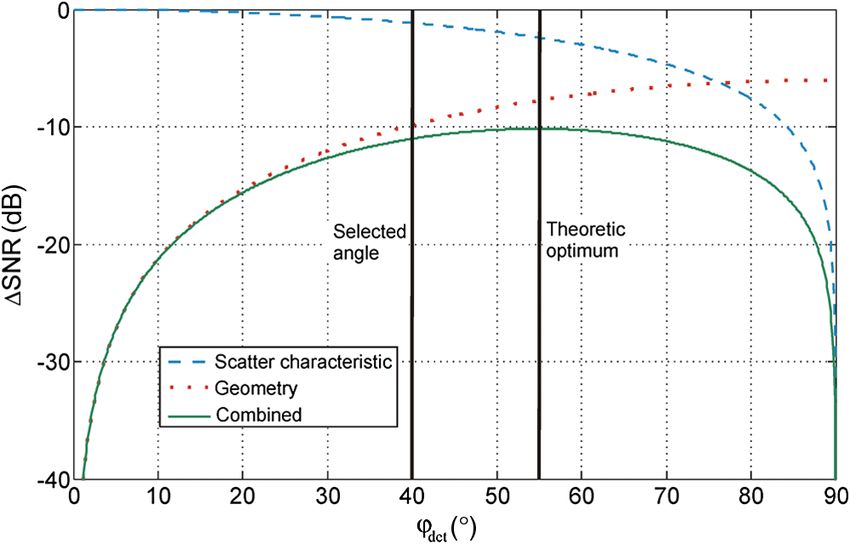
Rembe et al.: Optical three-dimensional vibrometer microscope with picometer-resolution. . .
Fig. 6 The resolution measurement on a grating with an efficiency of 58% in the first order shows a
vibration-amplitude noise level of 185 fm for a resolution bandwidth (RBW) of 9.77 Hz in the in-plane
direction.
noise above 1 MHz if a decoder measurement range of the shaker is 28.28 μm with 3% vibration-amplitude uncer-
400 mm∕s (maximal velocity) is selected. The amplitude pffiffiffiffiffiffi tainty at 159 Hz. The measured motion of the shaker is
resolution corresponds to a resolution of 60 fm∕ Hz, shown in Fig. 7(b). Our system measures clearly the variation
which is a tremendous improvement compared with the res- of the controlled amplitude over time within the uncertainty
olution of video stroboscopy. It should be mentioned that this of the shaker and, therefore, our uncertainty estimation by
resolution can only be achieved when an appropriate grating measuring a vibration standard is limited by the uncertainty
is integrated on the measurement surface. However, it is an of the utilized shaker.
unambiguous proof of subpicometer vibration-amplitude
resolution for x, y, and z directions. The resolution limit
of the out-of-plane direction was p measured
ffiffiffiffiffiffi on a mirror
for the realized system at 15.7 fm∕ Hz.
The accuracy of a laser-Doppler vibrometer is well deter-
mined, and the calibration is defined in the ISO 16063-41
standard.22 However, our new in-plane measurement tech-
nique is not addressed in the ISO standard. Therefore, we
have performed an additional measurement by obtaining the
motion of a traceable calibrated shaker (model VC10 from
Metra Mess- und Frequenztechnik Radebeul, Germany)
in the x-direction (in-plane) of our sensor to prove the accu-
racy of the technique. The schematic of the setup is demon-
strated in Fig. 7(a). The vibration peak-to-peak amplitude of
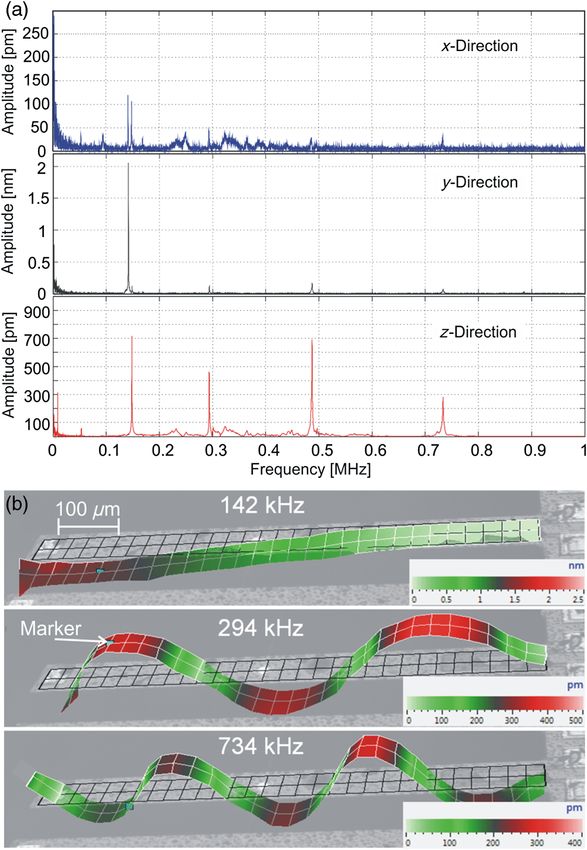
Fig. 8 Example measurement with the three-dimensional (3-D) vibr-
ometer microscope. 3-D vibration spectra (RBW ¼ 78.125 Hz) of a
silicon cantilever microelectromechanical-systems (MEMS) structure
(a) at the marker position excited with a periodic-chirp signal2 from
Fig. 7 Schematic of the setup to prove the accuracy of our method (a) 1 kHz to 2 MHz with an amplitude of 1.5 V and deflection mode
and measurement of the calibrated vibration amplitude of a traceable shape of a cantilever MEMS device (b) at 142, 294, and 734 kHz
calibrated shaker with a peak-to-peak amplitude of 28.28 μm and 3% (top to bottom). Note the different scaling of the amplitudes for clarity
uncertainty (b). and the picometer resolution in x -direction.
Optical Engineering 034108-5 March 2014 • Vol. 53(3)
Downloaded From: https://www.spiedigitallibrary.org/journals/Optical-Engineering on 02 Dec 2021
Terms of Use: https://www.spiedigitallibrary.org/terms-of-use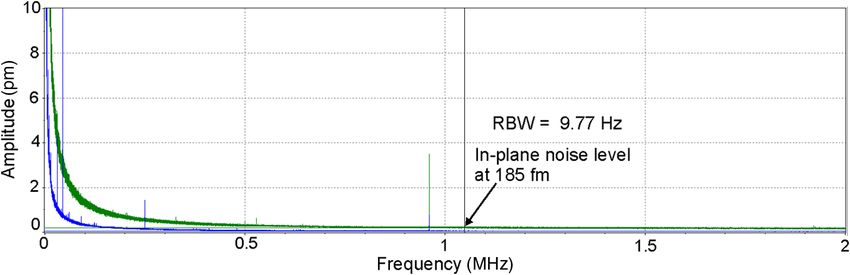
Rembe et al.: Optical three-dimensional vibrometer microscope with picometer-resolution. . .

                4.3 Measuring on MEMS Structures                                                    7. M. Schüssler, M. Mitrofanova, and U. Retze, “Measurement of 2D
                                                                                                       dynamic stress distributions with a 3D-Scanning laser Doppler vibr-
                Scanning measurements have been performed on a cantilever                              ometer,” Modal Anal. Topics 3, 141–151 (2011).
                                                                                                    8. K. Peterson, “Silicon as a mechanical material,” Proc. IEEE 70(5),
                MEMS structure which has been fixed on a motorized x − y                               420–457 (1982).
                translation stage. The spectrum up to 1 MHz is presented in                         9. J. M. Bustillo, R. T. Howe, and R. S. Muller, “Surface micromachining
                Fig. 8(a). For most resonance frequencies, the out-of-plane                            for microelectromechanical systems,” Proc. IEEE 86(8), 1552–1574
                                                                                                       (1998).
                component (z-axis) is predominant but at a frequency of                            10. C. Rembe, T. Tibken, and E. P. Hofer, “Analysis of the dynamics
                142 kHz there is a large in-plane (y-axis) movement. This                              in microactuators using high-speed cine photomicrography,” J.
                reveals the importance of measuring not only the out-of-                               Microelectromech. Syst. 10(1), 137–145 (2001).
                                                                                                   11. C. Q. Davis and D. M. Freeman, “Using a light microscope to measure
                plane component but also the in-plane components of the                                motions with nanometer accuracy,” Opt. Eng. 37(04), 1299–1304 (1998).
                vibrations. Note the picometer resolution in x-direction                           12. C. Rembe and R. S. Muller, “Measurement system for full three-
                                                                                                       dimensional motion characterization of MEMS,” J. Microelectromech.
                achieved at a MEMS cantilever with a rather specular sur-                              Syst. 11, 479 (2002).
                face. The 3-D deflection-mode shapes at several resonance                          13. E. Novak et al., “MEMS metrology using a strobed interferometric
                frequencies can be seen in Fig. 8(b).                                                  system,” in Proc. 17th IMEKO World Congress, IMEKO,
                                                                                                       Dubrovnik, Croatia, Vol. TC2, pp. 178–182 (2003).
                                                                                                   14. S. Petitgrand and A. Bosseboeff, “Simultaneous mapping of out-
                5 Conclusions                                                                          of-plane and in-plane vibrations of MEMS with (sub) nanometer
                                                                                                       resolution,” J. Micromech. Microeng. 14(9), 97–101 (2004).
                We have realized a measurement system which can analyze                            15. Y. Emery, N. Aspert, and F. Marquet, “Dynamical topography mea-
                vibrations in microscopic parts with a 3.5-μm measurement                              surements of MEMS up to 25 MHz, through transparent window,
                spot and with picometer vibration amplitude resolution in all                          and in liquid by digital holographic microscope (DHM),” in AIP
                                                                                                       Conf. Proc., Vol. 1457, pp. 71–77, AIP (2012).
                three directions. The real-time signal makes possible the                          16. S. M. van Netten, “Laser interferometer microscope for the measure-
                analysis of transient vibration phenomena. The scanning                                ment of nanometer vibrational displacements of a light-scattering
                                                                                                       microscopic object,” J. Acoust. Soc. Am. 83, 1667–1674 (1988).
                measurement on a MEMS cantilever demonstrates clearly                              17. J. P. Monchalin et al., “Measurement of in-plane and out-of-plane
                that our patented method23 enables 3-D measurements to                                 ultrasonic displacements by optical heterodyne interferometry,”
                verify the modal behavior of microstructures. The square-                              J. Nondestr. Eval. 8(2), 121–133 (1989).
                                                                                                   18. Y. Yeh and H. Z. Cummins, “Localized fluid flow measurements with
                root dependence2 of the vibration-amplitude noise from                                 an He-Ne laser spectrometer,” Appl. Phys. Lett. 4(10), 176–178 (1964).
                the detected light power leads to an increase of the amplitude                     19. A. I. Mityushin, “A superheterodyne three-component laser Doppler
                noise by a factor of only 10 if a factor of 100 less light is                          anemometer,” Instrum. Exp. Technol. 46, 115–121 (2003).
                                                                                                   20. M. Hugenschmidt, Lasermesstechnik—Diagnostik der Kurzzeitphysik,
                detected and even a small-detected power in the microwatts                             p. 131, Springer, Berlin (2007).
                regime of the scattered light can reveal tiny vibration ampli-                     21. F. E. Nicodemus et al., “Geometrical Considerations and
                tudes below 1 nm. Therefore, we can achieve picometer                                  Nomenclature for Reflectance,” BRDF Physics-Based Vision, Jones
                                                                                                       and Bartlett Publishers, Sudbury, Massachusetts, pp. 94–145 (1992).
                resolution for in-plane vibrations without averaging on spec-                      22. International Standard ISO 16063-41 “Methods for the calibration of
                imens with relatively specular surfaces where only a little                            vibration and shock transducers—Part 41: Calibration of laser vibrom-
                                                                                                       eters,” Int. Org. for Standardization (ISO), Geneva (2011).
                fraction of the light power is scattered in the off-axis detec-                    23. A. Dräbenstedt et al., “Vorrichtung und Verfahren zur interferometri-
                tion aperture. In addition, our technique allows a well-                               schen Vermessung eines Objekts,” DE102011085599B3, 13.12 (2012).
                defined measurement volume because of the pinhole charac-
                ter of the photo diodes and the defined overlap region of the                     Christian Rembe is manager of development optics at the Research
                detection beam paths with the impinging beam. Therefore,                          and Development Department of the Polytec GmbH. He received his
                                                                                                  diploma degree in physics from the University of Hanover, Germany,
                our 3-D vibrometer microscope certainly enables also inter-                       in 1994 and his doctoral degree in engineering from the University of
                esting applications in biology and medicine (e.g., hearing                        Ulm in 1999. His current research interests include optical sensors,
                research) on weakly scattering, vibrating specimens. How-                         optical metrology, and microelectromechanical systems. He is a
                ever, the exploration of the usability of our system in other                     member of SPIE, IEEE, the German VDI, and the German DPG.
                measurement applications is an open task for the future.
                                                                                                  Robert Kowarsch studied optoelectronics and received his diploma
                                                                                                  in 2009 at the University of Applied Sciences of Aalen. Since 2009, he
                Acknowledgments                                                                   has worked as an engineer in the Optics Development Department of
                The authors would like to acknowledge B. Pourat, G.                               the Polytec GmbH. In 2012, he accepted additional responsibility as
                                                                                                  technology manager for laser-Doppler velocimeters.
                Siegmund, V. Roth, L. Heller, A. Collet, M. Herberich, and
                M. Schüssler for the specific contributions of the realization                    Wanja Ochs has studied electrical engineering at the Hochschule
                of the final measurement system (the first prototype of the                       Karslruhe, Germany, and completed his master’s thesis in the
                intended Polytec product MSA-100-3D) which has been                               R&D department of the Polytec GmbH in 2011. After his master’s the-
                used for the measurements of the MEMS-cantilever vibrations.                      sis, he joined the Engineering Department of the Polytec GmbH.

                                                                                                  Alexander Dräbenstedt studied physics at the TU Chemnitz. After
                References                                                                        his diploma thesis about optical near field microscopy, he did his
                   1. L. E. Drain, The Laser Doppler Technique, John Wiley & Sons,                doctorate degree at the Department of Optical Spectroscopy and
                      Chichester (1980).                                                          Molecular Physics. Since 2001, he has worked as an optics design
                   2. C. Rembe et al., Measuring MEMS in Motion by Laser Doppler                  engineer for Polytec GmbH.
                      Vibrometry, pp. 245–292, Taylor & Francis, Boca Raton (2007).
                   3. C. Rembe and A. Dräbenstedt, “The laser-scanning confocal vibrom-           Moritz Giesen has completed his studies in mechatronics focusing on
                      eter microscope: theory and experiments,” Rev. Sci. Instrum. 77,            photonics/high-frequency technology at the Technical University of
                      083702 (2006).
                   4. M. Gennat et al., “Determination of parameters with uncertainties for       Erlangen-Nuremberg in 2011. Since 2011, he has worked as a devel-
                      quality control in MEMS fabrication,” J. Microelectromech. Syst.            opment engineer in the field of optics at Polytec GmbH.
                      22(3), 613–624 (2013).
                   5. R. Kowarsch et al., “Real-time 3D vibration measurements in micro-          Marcus Winter received his dipl.-ing. degree in electrical engineering
                      structures,” Proc. SPIE 8430, 84300C (2012).                                from Technische Universität Berlin in 2004. Since 2011, he has
                   6. K. Bendel, M. Fischer, and M. Schüssler, “Vibrational analysis of           worked as an R&D engineer at the optics development department
                      power tools using a novel three-dimensional scanning vibrometer,”           of Polytec GmbH in Waldbronn, Germany.
                      Proc. SPIE 5503, 177–184 (2004).

                Optical Engineering                                                       034108-6                                               March 2014     •   Vol. 53(3)

Downloaded From: https://www.spiedigitallibrary.org/journals/Optical-Engineering on 02 Dec 2021
Terms of Use: https://www.spiedigitallibrary.org/terms-of-use
You can also read