Past changes in natural and managed snow reliability of French Alps ski resorts from 1961 to 2019
←
→
Page content transcription
If your browser does not render page correctly, please read the page content below
The Cryosphere, 16, 863–881, 2022
https://doi.org/10.5194/tc-16-863-2022
© Author(s) 2022. This work is distributed under
the Creative Commons Attribution 4.0 License.

Past changes in natural and managed snow reliability of French
Alps ski resorts from 1961 to 2019
Lucas Berard-Chenu1,2 , Hugues François1 , Emmanuelle George1 , and Samuel Morin2
1 Univ.
      Grenoble Alpes, INRAE, LESSEM, 38000 Grenoble, France
2 Univ.
      Grenoble Alpes, Université de Toulouse, Météo-France, CNRS, CNRM, Centre d’Etudes de la Neige,
38000 Grenoble, France

Correspondence: Lucas Berard-Chenu (lucas.berard@inrae.fr)

Received: 25 August 2021 – Discussion started: 2 September 2021
Revised: 18 January 2022 – Accepted: 21 January 2022 – Published: 11 March 2022

Abstract. Snow reliability is a key climatic impact driver for   has long been identified to be particularly vulnerable to cli-
the ski tourism industry, although there are only a few stud-    mate change impacts, such as decreases in snow cover du-
ies addressing past changes in snow reliability in ski resorts   ration at low elevation in mountain regions (Martin et al.,
accounting for snow management practices (grooming and           1994; Beniston et al., 1995; Abegg et al., 2017). In order
snowmaking, in particular). This study provides an assess-       to reduce the impact of natural snow cover variability and
ment of past changes in natural and managed snow cover           its long-term decreasing trend due to climate change, snow-
reliability from 1961 to 2019 in the French Alps. In par-        making has emerged and is nowadays routinely used in al-
ticular, we used snowmaking investment figures to infer the      most all ski resorts in developed countries (Steiger et al.,
evolution of snowmaking coverage at the ski resort scale for     2019). Recent progress has been made in the literature to
16 ski resorts in the French Alps, which we used together        better account for snowmaking in future projections of snow
with a detailed snow cover modelling system driven by a          reliability in ski resorts in Europe at the pan-European scale
local atmospheric reanalysis. We find different benefits of      (Morin et al., 2021), in separate European countries (Aus-
snow management to reduce the variability and long-term          tria – e.g. Marke et al., 2015; France – e.g. Spandre et al.,
decrease in snow cover reliability because of the heterogene-    2019; Norway – e.g. Scott et al., 2020a) and in North Amer-
ity of the snowmaking deployment trajectories across ski re-     ica (Scott et al., 2020b). However, while several studies have
sorts. The frequency of challenging conditions for ski resort    documented strong reductions in snow cover amount, depth
operation over the 1991–2019 period increased in November        and duration in many mountain regions of the world over the
and February to April compared to the 30-year reference pe-      past decades (Mote et al., 2018; Klein et al., 2016; Marty
riod 1961–1990. In general, snowmaking had a positive im-        et al., 2017; Matiu et al., 2021; Hock et al., 2019), explicit
pact on snow reliability, especially in December to January.     assessments of the impact of climate change on ski resort
While for the highest-elevation ski resorts, snowmaking im-      operations, based on past observations, have remained lim-
proved snow reliability for the core of the winter season, it    ited (Beaudin and Huang, 2014; Hamilton et al., 2003; Rutty
did not counterbalance the decreasing trend in snow cover        et al., 2017; Steiger, 2011). In fact, the emergence in past
reliability for lower-elevation ski resorts and in the spring.   decades and popularization in major news media of several
                                                                 studies addressing future climate change risks to ski tourism,
                                                                 together with the recurrence of snow-scarce winters in Eu-
                                                                 rope (Durand et al., 2009) and North America (Cooper et
1   Introduction                                                 al., 2016), have somehow led to the broadly accepted con-
                                                                 sideration that climate change has indeed already been hav-
Ski tourism is a major socio-economic component of moun-         ing a strong impact on ski resort operations in the past and
tainous regions for many countries around the world (Vanat,      at present (Knowles and Scott, 2020). Based on interviews
2020). Due to its reliance on the snow cover, ski tourism

Published by Copernicus Publications on behalf of the European Geosciences Union.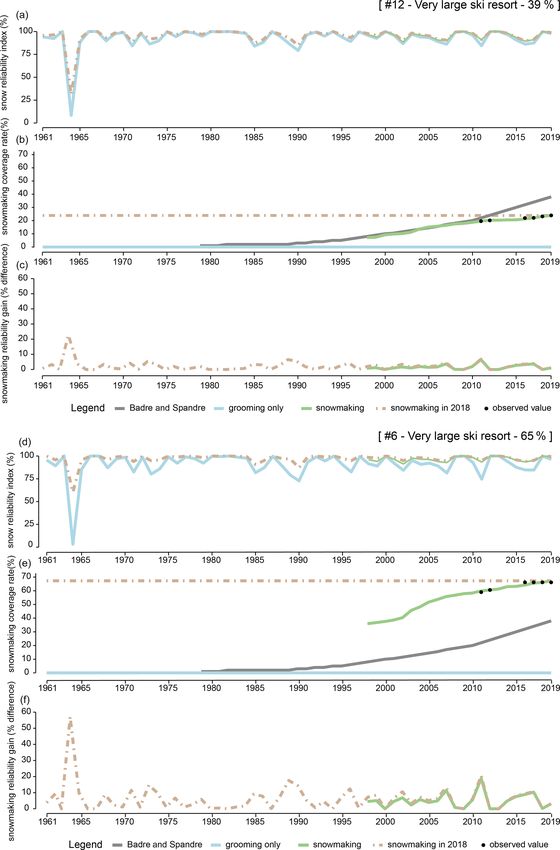
864                                          L. Berard-Chenu et al.: Past changes in natural and managed snow reliability

with ski resort managers and ski tourists, several studies         decades. Indeed, there is no long-term record of snow con-
have documented the fact that many stakeholders from the           ditions in ski resorts that could be used for this purpose, and
ski tourism industry have perceived a change in meteorolog-        there is no way to reconstruct what would be the snow cover
ical and snow conditions, which they did not always attribute      situation without snowmaking once it has been implemented
to climate change (Trawöger, 2014; Bicknell and McManus,           in actual ski resorts. Numerical simulations make it possi-
2006; Morrison and Pickering, 2013). In fact, a substantial        ble to compare the state of the snow cover with and without
body of evidence on climate change impacts on ski tourism          snowmaking, everything else being equal. Section 2 intro-
has been inferred primarily from future climate change pro-        duces the methodology used for this study; Sect. 3 provides
jections rather than from the analysis of past changes in snow     the results; Sect. 4 discusses them, and Sect. 5 concludes.
conditions. In a way, the link between climate change and
snow cover reliability appears to be so direct and obvious
(less snow in a warmer world) that it has been somehow             2     Material and methods
neglected in previous studies addressing past changes, with
only a few exceptions. Alongside this knowledge gap, the ef-       In the absence of a consolidated database providing the time
ficiency of snowmaking based on past observations has sel-         evolution of the snowmaking coverage in each ski resort, this
dom been assessed quantitatively: this also requires in-depth      study uses investment figures related to snowmaking infras-
analysis of ski resorts’ operating conditions for past seasons     tructure in order to infer the time evolution of snowmaking
in a way that allows disentangling the contribution of snow-       coverage in individual ski resorts in the French Alps. To the
making from actual snow conditions.                                best of our knowledge, this approach is unprecedented in the
   Previous studies have led to the development of a so-           scientific community. Such estimates are then used to process
phisticated modelling system to simulate snow conditions in        snow cover simulation produced using the SAFRAN–Crocus
French ski resorts for the past and future, taking explicitly      model chain, with and without snowmaking, spanning the
into account grooming and snowmaking, based on the me-             time period from 1961 to 2019, enabling us to quantify past
teorological reanalysis system SAFRAN and the snow cover           changes in snow reliability at the ski resort scale, explicitly
model Crocus and accounting for several key features of indi-      accounting for snowmaking equipment dynamics in individ-
vidual ski resorts (Spandre, 2016; Spandre et al., 2019). This     ual ski resorts.
model chain takes as input, for each ski resort, the fraction of
ski slopes covered with snow guns. However, in past studies        2.1    Snowmaking investments dataset
the time evolution of snowmaking was applied uniformly to
all ski resorts (Spandre et al., 2019) in the absence of resort-   Investment figures come from a snowmaking investment
level data describing the past time evolution of snowmak-          dataset for 100 French Alps ski resorts from 1997 to 2018
ing fractional coverage in ski resorts. A proper assessment        (Berard-Chenu et al., 2020). The dataset originates from the
of the impact of the interannual variability and long-term cli-    professional journal Montagne Leaders, which manages a
mate change on ski resorts’ operating conditions requires tak-     yearly investment survey completed in a declarative manner
ing into account not only observed meteorological conditions       by ski lift operators. Although collected by a non-scientific
driving the time variations in snow conditions in ski resorts      and unofficial organization, these data hold significant value.
but also the time evolution of their individual snowmaking         For instance Falk and Vanat (2016) and Berard-Chenu et
capacity. In the French Alps, snowmaking emerged in the            al. (2020) used this data source for academic research pur-
1990s, but not all ski resorts have followed the same devel-       poses. The investment survey covers five types of invest-
opment pathway in terms of snowmaking, and there is no             ment: new ski lift, ski lift maintenance (i.e. servicing and
consolidated database describing this past evolution (Berard-      replacement of parts on existing ski lifts and compliance
Chenu et al., 2020). For a given change in a climatic impact       investments), snowmaking, ticketing and ski slope remod-
driver operating at the scale of an entire mountain range, var-    elling. Each type of investment is broken down into sub-
ious snowmaking equipment pathways in different ski resorts        groups. Snowmaking investments are decomposed into six
are thus anticipated to lead to different impacts.                 types: equipment and concepts, water reservoirs, electric-
   In this study, we quantitatively assessed the changes in        ity, civil engineering, buildings, and other. In our investment
operating conditions of ski resorts, with and without snow-        dataset we do not consider all snowmaking investments but
making, taking into account the variability in snowmaking          only those referring to “equipment and concepts”. Indeed,
development dynamics across ski resorts. To do so, we anal-        the subgroup of equipment and concepts is the most relevant
ysed snowmaking investment figures for 16 ski resorts in the       proxy to capture the growth rate of the snowmaking cover-
French Alps from 1997 to 2018 and developed an original            age of ski resorts as it only accounts for the purchase of snow
method to infer the time evolution of the snowmaking cov-          guns. The other snowmaking investments can refer to an in-
erage for each ski resort. These data were used to feed the        crease in the snowmaking instantaneous production capacity,
SAFRAN–Crocus model chain, making it possible to per-              i.e. an electrical power increase or an expansion of the water
form simulations with and without snowmaking for the past          storage capacity. These investments may increase the snow-

The Cryosphere, 16, 863–881, 2022                                                      https://doi.org/10.5194/tc-16-863-2022
L. Berard-Chenu et al.: Past changes in natural and managed snow reliability                                                    865

making production efficiency without any growth of the ski          of the water policy, has initiated an observatory of snowmak-
slope areas equipped with snowmaking facilities. The invest-        ing. Each year this public body collects snowmaking data
ment dataset only contains ski resorts which have invested          from ski resorts in Savoie, among which is the snowmak-
at least once in snowmaking equipment and concepts over             ing fractional coverage. Among the 32 ski resorts equipped
the 1997–2018 period. Investments are in constant prices: we        with snowmaking facilities and registered in the Direction
derived constant price investments from current price invest-       Départementale des Territoires de la Savoie’s database, we
ments with the GDP deflator, a widely used inflation adjust-        removed 3 ski resorts with missing or questionable data. We
ment index.                                                         have a sample of 29 ski resorts after data cleaning. For each
   The literature points to a broad range of figures on cost        ski resort, information is available for their total ski slope
investment for snowmaking facilities. Table 1 shows sev-            area and the area equipped with snow production facilities
eral estimates related to snowmaking investment costs per           for the years 2010, 2011, 2015, 2016, 2017 and 2018.
unit ski slope surface area, ranging from EUR 28 000 to
EUR 240 000 per hectare. Furger (2002) and RMS (Remon-              2.3   Relationship between snowmaking investments and
tées Mécaniques Suisses), the professional association of the             snowmaking fractional coverage
Swiss ski resort operators (RMS, 2011) mentioned a cost in-
vestment in Switzerland but expressed it per kilometre of           We developed a model analysing the relationship between
slope equipped and not per hectare as in the figures in Ta-         the snowmaking surface area coverage with snowmaking in-
ble 1. Furger (2002) estimated the investment costs of snow-        vestments. Among various possibilities, we retained a model
making to be CHF 1 million per kilometre of slope equipped          relating them in a linear way (an exponential model was also
based on a sample of 10 ski resorts located in the canton of        tested, leading to insignificant differences for ski resorts with
Vaud. In France, the latest estimate from Domaines Skiables         sufficiently numerous observation data).
de France dates back to 2018, in an internal training docu-            The linear model to be estimated is
ment intended for snowmakers, with a unit cost ranging be-
                                                                    SMAt = SMAt−1 + α(It − It−1 ) + ε,                           (1)
tween EUR 130 000 and EUR 150 000 per hectare.
                                                                    where t denotes the year.
2.2   Snowmaking fractional coverage reference dataset                 The left-hand variable SMA denotes the ski slope area
                                                                    equipped with snowmaking facilities and I the cumulated
Atout France, which is the national organization responsi-          snowmaking investment. α represents the snowmaking unit
ble for monitoring the tourism sector, has not published es-        surface area equipment cost, and ε is an error term. We esti-
timations of snowmaking facilities since 2009. These esti-          mated the area equipped with snowmaking facilities based
mates were the only reference for professionals (Badré et al.,      on the area equipped and the snowmaking investment in-
2009) until the study of Spandre et al. (2015). The latter as-      crease both from the previous year. Among the 29 ski re-
sessed that 32 % of ski slope areas in the French Alps were         sorts equipped with snowmaking equipment, 13 showed no
equipped with snowmaking facilities in 2014, based on a sur-        increase in terms of their snowmaking coverage despite the
vey involving ski resort managers. They also predicted that         fact they made snowmaking investments over the study pe-
this proportion was likely to reach 43 % by 2020. DSF (Do-          riod. We removed these 13 ski resorts from our sampling
maines Skiables de France), the professional association of         since an increase in the snowmaking coverage rate over the
the French ski resort operators, produces a snowmaking cov-         6 reference years is required to estimate the α coefficient in
erage average rate based on information collected from its          our modelling. Thus our final sample for the evolution of the
members on an annual basis. In its most recent release in           individual snowmaking coverage encompasses 16 ski resorts.
2020, it indicated that 37 % of ski slope areas in France were
equipped with snowmaking facilities. A comparison between           2.4   SAFRAN–Crocus model chain, ski resorts
the DSF snowmaking facilities rate in 2020 and the estima-                geospatial modelling and snow reliability indicator
tion of Spandre et al. (2015) is difficult since the latter only
considers the French Alps and DSF does not provide any in-          We used the SAFRAN–Crocus model chain to simulate snow
formation regarding the representativeness of its sample and        cover characteristics from 1961 to 2019. SAFRAN is a mete-
how the aggregated value was derived for all ski resorts in         orological reanalysis system, combining in situ observations
France.                                                             and numerical weather prediction model output to provide an
   In contrast to the national situation lacking quantitative es-   estimate of the meteorological conditions as a function of el-
timates of snowmaking coverage for individual ski resorts,          evation (by 300 m elevation steps), for “massifs”, i.e. moun-
such information is available for a subregion of the north-         tain areas assumed to be meteorologically homogenous. This
ern French Alps Département de la Savoie) which corre-              system makes it possible to reconstruct the time evolution
sponds to the NUTS-3 level in the European Union nomen-             of the meteorological conditions in the mountain regions of
clature of territorial units. Indeed, the Direction Départemen-     France since the late 1950s (Durand et al., 2009; Vernay et
tale des Territoires de la Savoie, an administration in charge      al., 2019, 2022) and has been used as a basis for several pre-

https://doi.org/10.5194/tc-16-863-2022                                                       The Cryosphere, 16, 863–881, 2022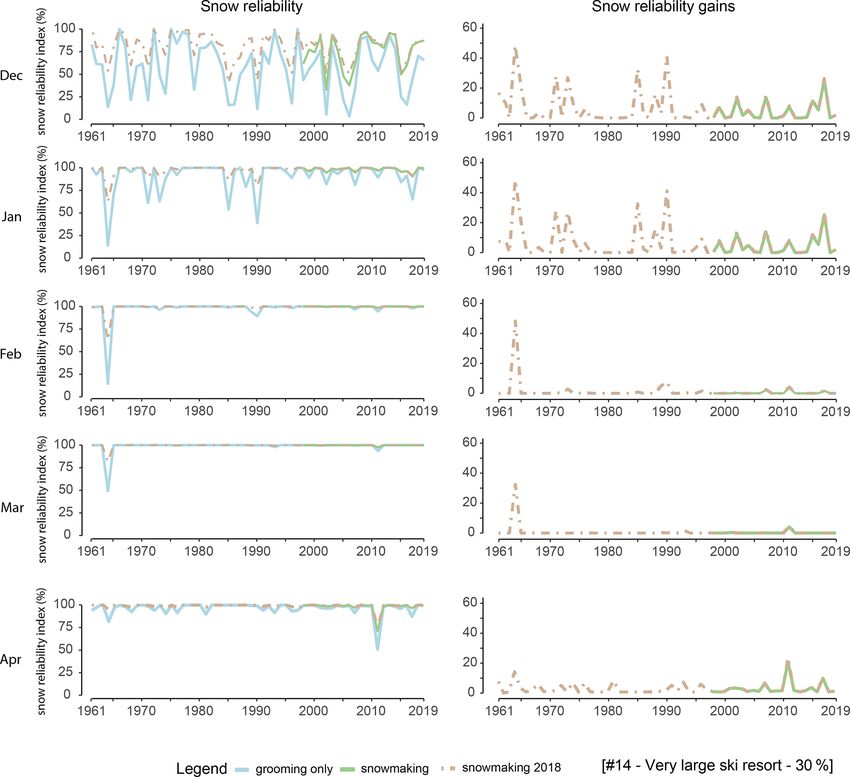
866                                           L. Berard-Chenu et al.: Past changes in natural and managed snow reliability

Table 1. Snowmaking investment cost to equip ski slope areas.

                 Source                   Value mentioned                          Value in constant price from 2018
                                                                                        (thousand EUR per hectare)
                 SEATM (1989)             FRF 1 million per hectare                                             240
                 Vlés (1996)              FRF 1 million per hectare                                             200
                 CIPRA (2004)             EUR 136 000 per hectare                                               162
                 Abegg et al. (2007)      EUR 25 000 to EUR 100 000 per hectare                           28 to 114
                 Breiling et al. (2008)   EUR 150 000 per hectare                                               166
                 Badré et al. (2009)      EUR 150 000 to EUR 200 000 per hectare                         165 to 220
                 DSF (2018)               EUR 130 000 to EUR 150 000 per hectare                         130 to 150

vious studies on the snow cover reliability of ski resorts in        average of the Christmas reliability indicator (15 %) and the
the French Alps and Pyrenees (e.g. Spandre et al., 2019, and         February reliability indicator (85 %) – shown by Spandre
references therein). The hourly resolution SAFRAN meteo-             et al. (2019) to correlate strongly, at the scale of the entire
rological conditions are used as input to the detailed, multi-       French Alps, to annual skier visits from 2002 to 2014 – when
layer snow cover model Crocus, resolving natural processes           using a fixed 30 % snowmaking coverage for all ski resorts.
occurring in the snow cover and at its interfaces with the un-       This method provides, ultimately, resort-level snow reliabil-
derlying ground and overlying atmosphere (Vionnet et al.,            ity indicators at the monthly scale (plus Christmas time pe-
2012). In its Resort version (Spandre et al., 2016), the Crocus      riod and combined indicators) spanning the full time period
model is also equipped with dedicated options for represent-         from the 1960/61 season (1961) to 2018/19 season (2019)
ing snow grooming and snowmaking, in terms of both their             continuously, whose values can be computed depending on
physical characteristics and their typical management opera-         the snowmaking fractional coverage value, with a regular
tion timing and snowmaking production rate (Spandre et al.,          15 % step between 0 % and 90 % where 0 % corresponds
2016, 2019; Hanzer et al., 2020; Morin et al., 2021). Cro-           to grooming only. The time-variable snowmaking coverage
cus model runs were carried out for each relevant SAFRAN             where considered a linear interpolation of the values obtained
massif and all elevations, not only on flat terrain but also for     fractional coverage by steps of 15 %. In addition, based on
eight main orientations (N, NE, E, SE, S, SW, W, NW) and             the gravitational envelope computed for each ski resort, we
slope angles of 10, 20, 30 and 40◦ . Simulation outputs were         compute the fraction of the ski resort above 2000 m eleva-
then aggregated for individual ski resorts at a daily scale used     tion. This elevation threshold roughly corresponds to the di-
to calculate a reliability index for different periods across the    vide between low-elevation and high-elevation mountain ar-
ski season. For each ski resort, a ski resort gravitational enve-    eas, most relevant in the context of elevation-dependent nat-
lope is computed based on a digital elevation model (DEM)            ural snow cover trends (Matiu et al., 2021) in the European
and the location of ski lifts (François et al., 2014, 2016; Span-    Alps. It enables us to compare ski resorts’ geographical char-
dre et al., 2019). Depending on the snowmaking coverage,             acteristics, not only in terms of their minimum–maximum or
simulations carried out with and without snowmaking are              mean elevation but also using a single indicator representa-
combined, as described in Spandre et al. (2019). The loca-           tive of their elevational coverage.
tion of ski slopes equipped with snowmaking is determined
based on their position within the ski resort (elevation, dis-       2.5   Statistical analysis of snow reliability indicators
tance to major ski lift, distance to main housing infrastruc-
ture), following Spandre et al. (2016). This entire procedure        The annual values of the annual-scale indicator values were
enables the generation of, for a given snowmaking coverage,          post-processed as follows. Indeed, the study focuses on ski
a resort-level snow cover indicator, quantifying the fraction        resort operations and how they have been modified in the past
of the ski resort surface area where the amount of snow ex-          decades, accounting for the role of snowmaking. What mat-
ceeds a given threshold (here, 100 kg m−2 snow water equiv-          ters most for ski resorts is not the mean multi-annual snow
alent, which corresponds to 25 cm of snow with a density             reliability or other metrics characterizing their multi-annual
of 400 kg m−3 ) (François, 2021). Daily values of this indica-       average conditions but rather how frequently challenging op-
tor are averaged for each month from November to April, as           erating conditions are encountered. Indeed, snow-scarce win-
well as for the Christmas time period from 20 December to            ters, primarily related to the interannual variability in mete-
5 January. This approach is comparable to the “snow reliable         orological and snow conditions and influenced by long-term
skiing terrain” approach developed and used by Steiger and           climate trends, are a key concern for the ski tourism indus-
Stötter (2013) and Scott et al. (2019). We also computed the         try (Abegg et al., 2021; Morin et al., 2021). We therefore
combined reliability index, corresponding to the weighted            focus on the characteristics of challenging winter seasons
                                                                     and whether their frequency has changed in time. We take

The Cryosphere, 16, 863–881, 2022                                                         https://doi.org/10.5194/tc-16-863-2022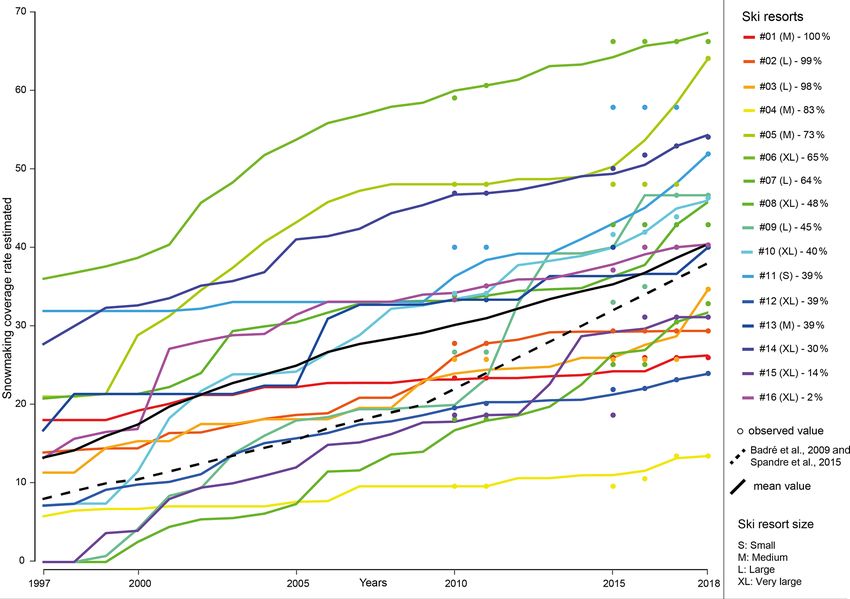
L. Berard-Chenu et al.: Past changes in natural and managed snow reliability                                                  867

as a reference the value of the 20th quantiles of snow reli-       evolution of the snowmaking coverage based on the 16 ski re-
ability indicators for the 30-year long 1960/61 to 1989/90         sorts (black line) is higher than the national average (dashed
(i.e. 1961–1990) reference time period (referred to as Q20         line) throughout the period considered. The figure shows that
values), which corresponds to the typical frequency of chal-       a larger difference is reached for the year 2006 with a differ-
lenging snow conditions every 1 in 5 years and is relevant         ence of almost 10 %, while in 2018 and 1997 the difference
for ski resort operators. This value depends on the ski re-        is 2 % and 5 %, respectively.
sort (because of their various elevations and elevation spans),       The linear modelling estimated a mean alpha coefficient of
on the snowmaking fractional coverage and on the time pe-          8.48 × 10⁻³ , which corresponds to EUR 118 000 per hectare
riod of the year. We then analyse, for the 29-year time period     with a 95 % confidence interval (CI95 % ) of [87, 180]. A boot-
1990/91 to 2018/19 (i.e. 1991–2019), the frequency of winter       strap method (n = 1000 re-samplings of coefficient values)
seasons for which the snow reliability values are below the        was applied to provide the 95 % confidence interval for the
reference Q20. If the value corresponds to more than 20 %          coefficient estimate.
of the years (i.e. 6 years for a full 30-year time period), this
means that the snow conditions have worsened compared to           3.2   Time evolution of combined (Christmas and
the reference period and vice versa. This approach enables               February) snow reliability and relationship to
fair comparisons across time, for a given ski resort, without            snowmaking coverage
comparing, in absolute terms, the mean and low-quantile val-
ues characterizing snow conditions in different ski resorts or     Figure 3 displays the time evolution of the combined snow
with different snow management options. The absolute val-          reliability indicator and snowmaking fractional coverage for
ues for mean or Q20 snow reliability values for different ski      two contrasting very large ski resorts in the Savoie from
resorts can be very different and need to be interpreted sepa-     1961 to 2019, with a snowmaking coverage below (reach-
rately in assessments at the scale of ski resorts, together with   ing ca. 24 % in 2018) and above (ca. 67 % in 2018) the na-
the business model of the tourism destination encompassing         tional average (estimated to be on the order of 38 % in 2018),
each ski resort, within which the reliability of the snow cover    respectively. While some interannual variability is observed
on ski pistes can play a very different role. For example, large   and both ski resorts display contrasting geographical charac-
high-elevation ski resorts are based on high reliability val-      teristics regarding the share of their ski area below 2000 m,
ues with low interannual variability and offer few alterna-        in general the snow reliability values have remained rather
tives to downhill skiing in case of ski resort closure, while      high throughout the entire time period, except for the pe-
lower-elevation ski resorts embedded in a diversified desti-       culiar winter of 1963/64. Compared to a situation without
nation are less dependent on a reliable snow cover on ski          snowmaking, the various snowmaking dynamics lead to very
pistes, which is often less guaranteed in such cases (Luthe        similar snow reliability values, with either no increase in re-
et al., 2012; George-Marcelpoil and François, 2016). Analy-        liability (when the reliability with groomed snow only is al-
ses and presentations were undertaken in open-source R soft-       ready very high and close to 100 %) or an increase on the
ware (R core team, 2020), along with the ggplot2 package           order of 5 % to 10 %. In this example, ski resort no. 6 with
(Wickham, 2016). Figure 1 presents a schematic description         the larger snowmaking coverage fraction shows lower inter-
of the method and the data processing.                             annual variability, when snowmaking is taken into account,
                                                                   than ski resort no. 12 with its lower snowmaking fractional
                                                                   coverage.
3     Results                                                         Figure 4 shows the relationship between the annual
                                                                   snow cover reliability difference between configurations with
3.1    Relationship between snowmaking investments and             snowmaking and the snow cover reliability with grooming
       fractional coverage                                         (no snowmaking, x axis), for two contrasting ski resorts
                                                                   (lower-than-average snowmaking coverage with 83 % of the
The linear modelling for reconstructing snowmaking cov-            ski area below 2000 m on the left and higher-than-average
erage, described in Sect. 2.3, was applied to 16 ski resorts       snowmaking coverage on the right and with 30 % of the ski
in Savoie over the observed period (2010–2018). Figure 2           area below 2000 m). It highlights a large range of variabil-
shows the estimated evolution of the snowmaking coverage           ity for the natural (groomed) snow reliability, from 15 % to
rate over 1997–2018 for these 16 ski resorts. Estimates of         100 % for the ski resort with a greater elevation range below
snowmaking coverage are derived from the individual invest-        2000 m elevation and from 80 % to 100 % for the ski resort
ments of each ski resort. The figure highlights the hetero-        with a larger fraction above 2000 m. The gain in snow cover
geneity of the snowmaking deployment trajectories depend-          reliability due to snowmaking, using either the time-varying
ing on ski resorts. Investment choices directly affect the in-     snowmaking fractional coverage or its value in 2018 for all
crease in the snowmaking coverage for each ski resort: the         considered seasons, is generally larger than the difference be-
snowmaking coverage rates range from 0 % to 37 % in 1997           tween these two configurations and generally correlates with
and from 14 % to almost 70 % in 2018. The average of the           the natural snow cover reliability – i.e. the higher the natu-

https://doi.org/10.5194/tc-16-863-2022                                                     The Cryosphere, 16, 863–881, 2022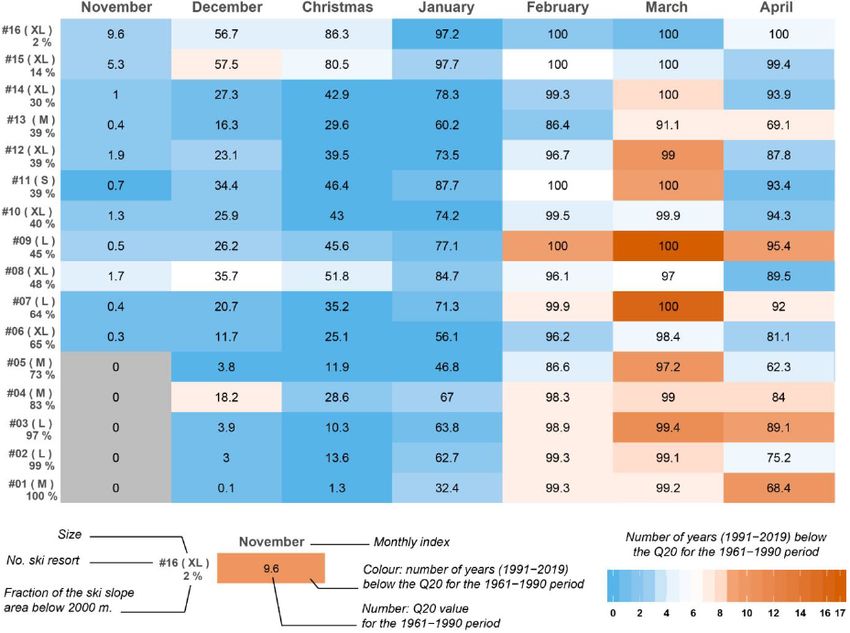
868                                             L. Berard-Chenu et al.: Past changes in natural and managed snow reliability

Figure 1. Schematic description of the methods implemented in this study.

Figure 2. Evolution of the snowmaking coverage rate over 1997–2018 for the 16 ski resorts in Savoie with the linear model. Colours represent
individual ski resorts, anonymized and ordered as a function of the decreasing fraction of the domain below 2000 m.

The Cryosphere, 16, 863–881, 2022                                                              https://doi.org/10.5194/tc-16-863-2022
L. Berard-Chenu et al.: Past changes in natural and managed snow reliability                                                          869

Figure 3. Time evolution of the combined snow reliability indicator and snowmaking fractional coverage for two contrasting very large
ski resorts (ski resort no. 6 has 65 % of its ski area and ski resort no. 12 has 39 % of its ski area below 2000 m) in Savoie from 1961 to
2019. Panels (a) and (d) represent the time variations in the indicator for several snow management options (grooming only, snowmaking
coverage corresponding to Badré et al., 2009 – mean value for all French ski resorts, individual evolution of the snowmaking coverage based
on investment figures and situation corresponding to using the snowmaking coverage in 2018 for the whole time period). Panels (b) and (e)
indicate the corresponding snowmaking fractional coverage. Panels (c) and (f) represent the increase in snow cover reliability compared to
the grooming-only situation. Ski resort no. 6 shows a higher-than-average snowmaking equipment value, while ski resort no. 12 shows a
lower-than-average snowmaking equipment value.

https://doi.org/10.5194/tc-16-863-2022                                                           The Cryosphere, 16, 863–881, 2022
870 L. Berard-Chenu et al.: Past changes in natural and managed snow reliability
ral (groomed) snow cover reliability, the lower the gain from Table 2 shows a synthesis, for the 16 ski resorts of our sam-
snowmaking – although the snow cover reliability values in- ple, of the monthly reliability values (reference Q20, which
cluding snowmaking are increasingly lower than 100 % when characterizes the upper threshold of challenging snow condi-
the natural (groomed) snow cover reliability is lower. This tions) and the evolution of the frequency of exceedance be-
shows that, in these cases, the natural snow cover deficit can low this threshold in a situation without snowmaking. The
almost be fully compensated for (but not entirely), for this in- largest snow reliability values for the reference period are
dicator focusing on the Christmas and February time periods found in February and March, with Q20 values ranging from
with high snowmaking coverage, except in the cases where 86 % to 100 % in February and from 90 % to 100 % in March.
the deficit is too large (in particular, winter 1963/64). Snow reliability values in November are low, on the order of
0 (grey cells) to a 10 % maximum, increasing through De-
3.3 Time evolution of monthly snow reliability cember and January to February and March and with lower
indicators values in April. The table shows that the months most af-
fected by a change from 1961–1990 to 1991–2019 are in
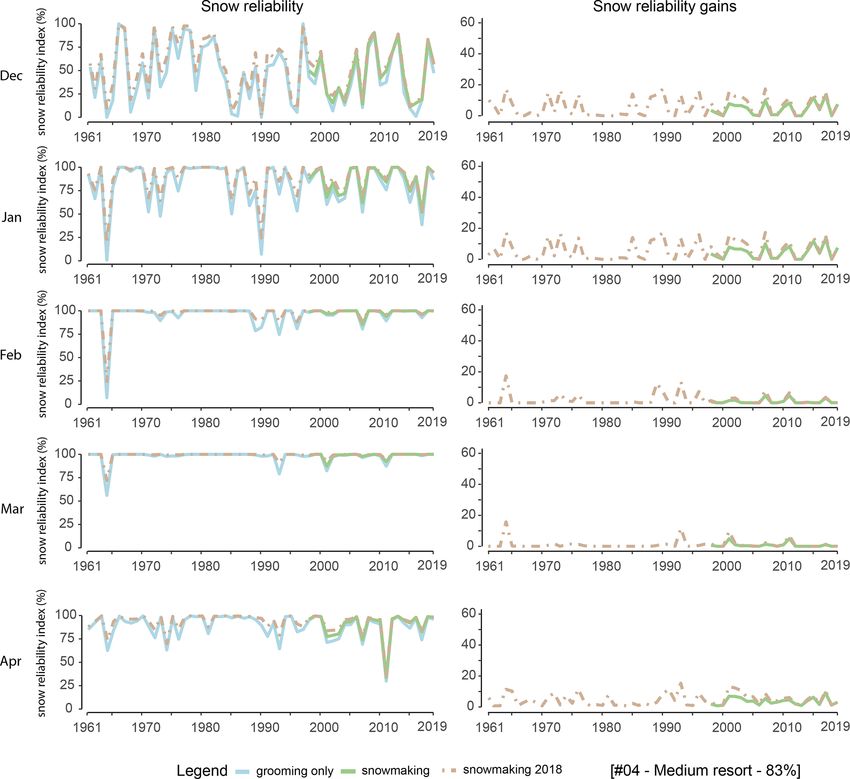
Figures 5 and 6 show the time evolution of the monthly snow November (starting from low values) and February to April,
reliability indicators for the two contrasting ski resorts intro- with different rates of increases in the frequency of challeng-
duced above, showing the large differences between reliabil- ing conditions progressing with the month (February through
ity indicator values across the different months, in particular April) as a function of ski resort elevations (the largest and
the lower values at the beginning and end of the winter sea- highest-elevation ski resorts show changes mostly in Novem-
son, and peak values, on average, in January and February. ber and April, with changes in a growing number of months
Figure 7 shows the relationships between the monthly in- as the elevation range starts from lower elevations). The rate
dicator values in December to April, for the same contrast- of change for the Christmas time period and January shows
ing ski resorts in terms of their snowmaking coverage. It instead a decrease in the frequency of snow conditions below
clearly outlines the differences in snow reliability between the reference value. This result is fully consistent with the
months and between ski resorts and how snowmaking can analysis of natural snow cover trends in the European Alps
(or cannot) compensate for the natural snow cover deficit, (Matiu et al., 2021), showing contrasting patterns depend-
depending not only on the meteorological conditions but also ing on the elevation (represented here through the fraction of
on the snowmaking fractional coverage of individual ski re- the ski resort below 2000 m) and on the month of the year
sorts, which depend on individual strategic choices (and the and marked decreases in snow indicators, especially at low
means to implement them). The gap between snow reliability to intermediate elevations throughout the winter season and
gains for the two contrasting ski resorts is larger, regardless for ski resorts positioned at higher elevations mostly during
of the snowmaking configuration, at the beginning (Decem- springtime.
ber and January) rather than the peak (February and March) Table 3 shows the same results as Table 2 but accounting
of the winter season. For the December index, there is a max- for snowmaking with a fixed snowmaking coverage for each
imum gain below 25 % for ski resort no. 4 (with lower-than- ski resort, corresponding to the value reached in 2018. Com-
average snowmaking coverage and 83 % of its ski area below pared to the snow reliability values of Table 2 with grooming
2000 m), while ski resort no. 14 (higher-than-average snow- only, the reference Q20 value, with snowmaking, is generally
making coverage and 30 % of its ski area below 2000 m) higher. However, with the difference in the November situa-
can benefit from up to 50 % snow reliability gains. With a tion, the general trend in the frequency of exceedance below
snow coverage rate corresponding to 54 % in 2018 (brown the Q20 reference time period shows a very similar pattern to
dots), ski resort no. 14 would have increased its snow relia- that in the natural snow situations, with a shift in snow reli-
bility with snowmaking almost always up to 25 %, whereas ability values but the same temporal pattern. This shows that
its grooming-only snow reliability went down below 50 %. the trend towards increased snow scarcity is rather similar
even with snowmaking but starting from a higher snow relia-
3.4 Change in the frequency of challenging snow
bility level. Changes are most pronounced for the ski resorts
conditions for the 16 ski resorts in Savoie
with a larger fraction below 2000 m and for higher-elevation
In this section we analyse the change in the frequency of oc- ski resorts only at the beginning and end of the winter season
currence of challenging snow conditions from 1961 to 2019 (November and March–April), with fewer negative changes
by splitting the entire time period into two periods of approx- (and even increases) in the core of the winter.
imately 30 years (1961–1990 and 1991–2019) and analysing Table 4 shows the results in the same form as Tables 2
how frequently, in the second time period, the snow condi- and 3 but takes into account the fact that each ski resort has
tions were better or worse than the Q20 threshold of the ref- had different snowmaking coverage dynamics over the past
erence period 1961–1990. We provide the results for the 16 decades. However, due to the fact that snowmaking became
ski resorts in Savoie for which a dedicated analysis of the generalized in the 1990s, the Q20 reference values for the pe-
snowmaking coverage evolution was carried out. riod 1961–1990 are roughly similar to the figures in Table 2.
In general, the figure shows that snowmaking had a positive
The Cryosphere, 16, 863–881, 2022 https://doi.org/10.5194/tc-16-863-2022L. Berard-Chenu et al.: Past changes in natural and managed snow reliability 871 Figure 4. Relationship between the combined snow cover reliability difference (y axis) between configurations with snowmaking and the snow cover reliability with grooming only (no snowmaking, x axis), for two contrasting ski resorts. Figure 5. Time evolution of the combined snow reliability indicator and snowmaking fractional coverage for ski resort no. 4 (medium size, 83 % of its surface area below 2000 m elevation) from 1961 to 2019. The left column represents the time variations in the indicator for several snow management options (grooming only, individual evolution of the snowmaking coverage based on investment figures and the situation corresponding to using the snowmaking coverage in 2018 for the whole time period). The right column represents the increase in snow cover reliability compared to the grooming-only situation (taking into account the evolution in snowmaking coverage since 1997 or using the fractional coverage for 2018 throughout the entire record). Each row corresponds to a monthly snow reliability indicator: December to April. https://doi.org/10.5194/tc-16-863-2022 The Cryosphere, 16, 863–881, 2022
872                                              L. Berard-Chenu et al.: Past changes in natural and managed snow reliability

Figure 6. Similar to Fig. 5 but for ski resort no. 14 (very large ski resort, 30 % of the surface area below 2000 m elevation).

impact on snow reliability in the ski resorts of this sample,              Based on snowmaking investment figures for 16 ski resorts in
especially in December to January and for the entire win-                  Savoie (northern French Alps), we reconstructed their snow-
ter season for the highest-elevation ski resorts. For smaller              making coverage trajectory since 1997, enabling us to quan-
and lower-elevation ski resorts, snow conditions with snow-                tify the impact of snowmaking on the changes in snow relia-
making during the period 1991–2019 are often worse than                    bility over the entire time period. This study fills several gaps
without snowmaking between 1961 and 1990, which means                      in the scientific literature but comes with limitations which
that in such cases snowmaking did not counterbalance the                   deserve some discussion.
decreasing trend in snow cover reliability.
                                                                           4.1   Limitations to the methods employed

4   Discussion                                                             The SAFRAN meteorological reanalysis (Vernay et al.,
                                                                           2019, 2022) used for this research is affected by changes in
In this study, we have quantified the change in snow reli-                 observation network density from 1961 to 2019 and changes
ability in several ski resorts of the French Alps from 1961                to the numerical weather prediction models used as a guess
to 2019, during a time when natural snow cover evolution                   for producing the reanalysis. This can potentially impair its
has shown very strong changes especially at low to inter-                  ability to be used for trend analysis, as noted in Spandre et
mediate elevations, mostly attributed to the effect of atmo-               al. (2015) and Ménégoz et al. (2020). In particular, Vernay et
spheric warming due to climate change (Matiu et al., 2021).                al. (2022) indicate that the magnitude of the wintertime tem-
Our study based on a long time period makes it possible to                 perature trend is probably underestimated in the SAFRAN
analyse the changes in terms of the frequency of occurrence                dataset, owing to temporal heterogeneities in the input data
of challenging snow conditions, defined during the reference               to SAFRAN and stronger temperature deviations from ref-
period 1961–1990 as the value separating the 20 % worst sea-               erence observations at the beginning of the time period. The
sons (lower snow cover indicator values) from the full record.             magnitude of the trend on snow cover (strongly influenced

The Cryosphere, 16, 863–881, 2022                                                                 https://doi.org/10.5194/tc-16-863-2022
L. Berard-Chenu et al.: Past changes in natural and managed snow reliability 873 Figure 7. Relationship between the monthly (December, January, February, March and April, from top to bottom) snow cover reliability difference (y axis) between configurations with snowmaking and the snow cover reliability with grooming only (no snowmaking, x axis), for two contrasting very large ski resorts and for the time period from 1961 to 2019, on the left with below-average snowmaking coverage and on the right with above-average snowmaking coverage. by air temperature trends especially at lower elevation) is the time heterogeneity in the SAFRAN reanalysis is needed therefore potentially underestimated. However, we note that and is currently being investigated, we consider that, due to our analysis here is not based on direct trend analysis but the fact that SAFRAN uses all available observations in a ro- rather on how frequently snow conditions, computed at the bust assimilation framework, it is a usable data source for this monthly scale, fall above or below a given threshold, which work. depends on the meteorological conditions throughout all the Another limitation of this work, in the snow cover mod- winter seasons. We also note that several key features (snow- elling part, is the fact that the Crocus snow cover model not scarce winter 1963/64; low-snow conditions in the late 1980s only uses the same snow management configuration for all and early 1990s; challenging snow conditions in 2001/02, ski resorts but also uses the same one throughout the en- 2006/07 and further recent years; etc.) are aptly reproduced tire time period. Yet, snowmaking technology and manage- by the model chain, hence providing confidence in its ability ment strategies and tactics have evolved over the past decades to characterize the main features of the meteorological con- (Morrison and Pickering, 2013; Wilson et al., 2018). How- ditions of the winters of the past. While further analysis of ever, taking into account other sources of uncertainty and the https://doi.org/10.5194/tc-16-863-2022 The Cryosphere, 16, 863–881, 2022
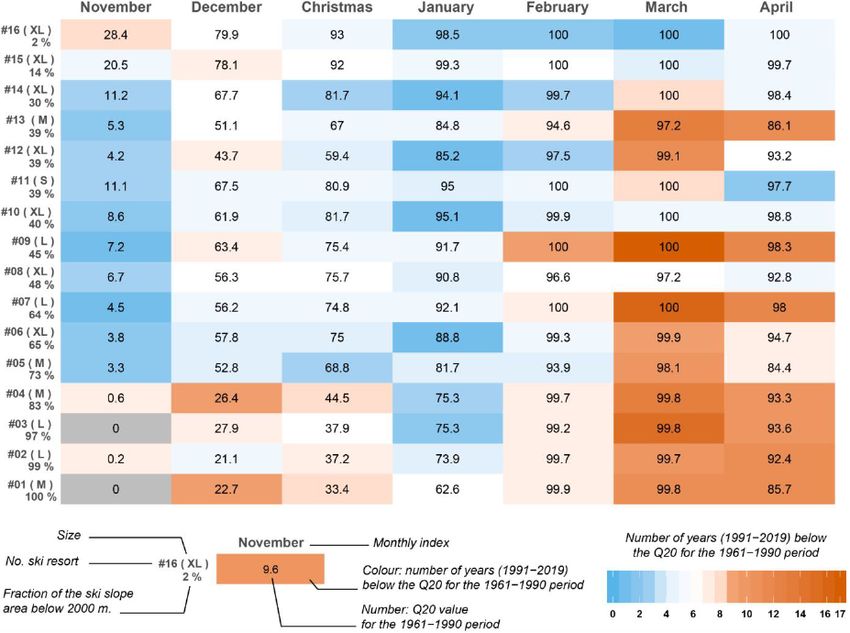
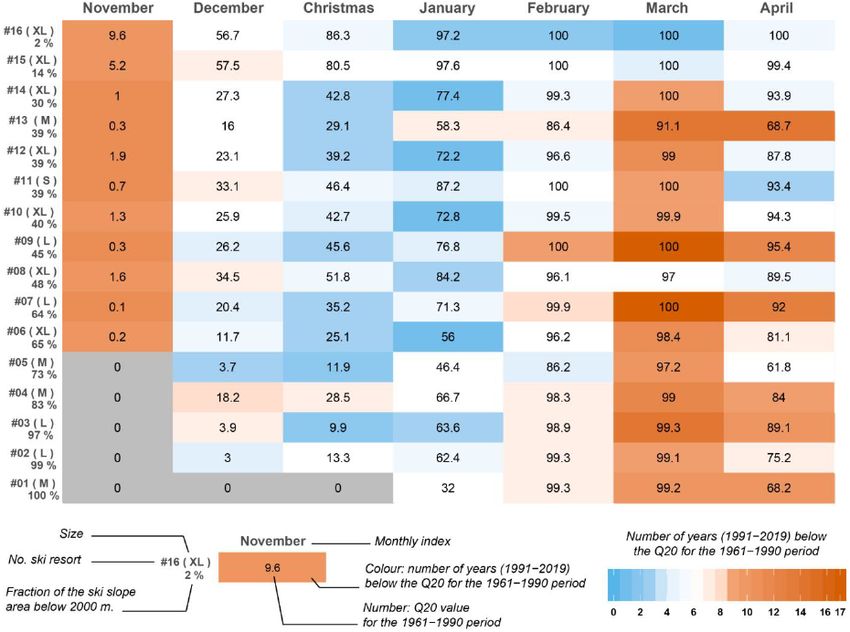
874                                             L. Berard-Chenu et al.: Past changes in natural and managed snow reliability

Table 2. Frequency of occurrence of monthly snow reliability challenging conditions, between 1991 and 2019, below the reference Q20
value for the time period 1961–1990, without snowmaking throughout the entire time period. Each row corresponds to a ski resort (ranked
as a function of the increasing fraction of the domain below 2000 m). Each column corresponds to a monthly reliability indicator. The
values in the matrix correspond to the Q20 reference snow reliability indicator. Red and orange cells correspond to larger frequencies during
1991–2019 than during the reference time period (more often challenging conditions) and vice versa in blue.

Table 3. Same as Table 2 but for the snowmaking coverage of 2018 throughout the entire period from 1961 to 2019 (including for the
reference time period 1961–1990).

The Cryosphere, 16, 863–881, 2022                                                              https://doi.org/10.5194/tc-16-863-2022
L. Berard-Chenu et al.: Past changes in natural and managed snow reliability                                                       875

Table 4. Same as Tables 2 and 3 but with a snowmaking coverage variable in time for each ski resort.

fact that the time evolution of the snowmaking coverage in             tion, e.g. related to the opening of a new subdomain owing
ski resorts is itself largely unknown, accounting for changes          to the installation of a new ski lift.
in snowmaking practices and for the technological charac-                 The modelling approach employed to estimate the evolu-
teristics of snowmaking units appears out of reach and may             tion of the snowmaking coverage rate also has some limita-
be approached in future studies, requiring that further data           tions. In our study, the increase in the snow reliability is only
be made available (or reconstructed from technical historical          possible through a growth in the part of the ski area cov-
sources from ski resort internal documentation, which does             ered with snowmaking. However, snowmaking investments
not always exist). We however consider that our study, which           considered in our study may correspond to other strategies
accounts for grooming and snowmaking and brings together               of ski lift operators. Our model assumes that all the snow-
a large amount of original information into a consistent anal-         making investments always resulted in an increase in the ski
ysis framework, is a relevant addition to the sparse literature        slope area covered by snowmaking. Therefore we removed
on observed changes in ski resort operating conditions and             13 ski resorts without any snowmaking coverage growth de-
provides relevant and valuable results. Another limitation re-         spite investments on purpose. This indicates that snowmak-
lated to changes in time for some of the characteristics of            ing investment choices are more complex than those taken
the systems studied is the fact that we used a fixed number            into account in our linear modelling. For instance, our ap-
of ski resorts across time (even if some opened after 1961),           proach does not represent investments made to optimize ex-
with constant levels of ski lift equipment, corresponding to           isting systems – e.g. the replacement of obsolete snow guns
the end of the time period. This could cause some hetero-              – or to increase the density of snow guns on slopes already
geneities due to the fact that ski slopes are related, in our          equipped. Moreover, based on discussions with snowmak-
work, to the location of ski lifts, and if major changes in ski        ers, we know the ski industry has experienced an ongoing
lifts had occurred from the early 2000s when snowmaking                harmonization of the calculation method of the snowmak-
developed the most, inconsistencies would occur. However,              ing coverage rate for many years, including through the de-
we believe that our approach is relevant because the mod-              velopment of tools dedicated to snowmaking management.
elling framework makes it possible to simplify this complex            We can speculate that the more extended snowmaking sys-
problem, to some extent, by setting some of its dimensions             tems are, the more they require investments for their mainte-
to a given value (here, the geometry of ski resorts) and be-           nance. Considering our model, the constant relationship be-
cause the main features of ski resorts have in fact evolved            tween investments and area equipped lets us think that the in-
little since the early 2000s, so changes in operating condi-           crease in snowmaking coverage may be overestimated. Our
tions are more influenced by the inception and increase in             modelling also provides estimations considering the technol-
snowmaking than by changes in ski resort spatial organiza-             ogy remains constant. As indicated above on the snow cover

https://doi.org/10.5194/tc-16-863-2022                                                           The Cryosphere, 16, 863–881, 2022
876                                          L. Berard-Chenu et al.: Past changes in natural and managed snow reliability

modelling side, we did not implement the potential effects         “[i]n some places, artificial snowmaking has reduced nega-
of technological progress, particularly for recent snowmak-        tive impacts on ski tourism (medium confidence)”. Past im-
ing systems, that could lead to yield increases. Similarly, we     pacts of climate change on natural snow cover reliability in
did not consider variations in investment costs in snowmak-        ski resorts depend more on the indicator chosen to quan-
ing over time, especially the potential decrease in investment     tify the impacts and on resort characteristics than on their
costs to cover ski slopes as snowmaking systems become in-         mountain area they belong to. Indeed the added value of
creasingly popular or the influence of the snowmaking indus-       snow management and snowmaking to reduce these impacts
try consolidation and its consequences on the prices.              is also heterogeneous across ski resorts within a given moun-
   Altogether and despite its limitations, we believe that         tain area. In this sense, while aggregation of results at the
our study provides original and relevant information on ob-        scale of an entire mountain range (e.g. Spandre et al., 2019,
served changes in ski resort operating conditions over cli-        for the French Alps) makes it possible to provide a compact
mate timescales, contributing to filling a critical gap in the     and general picture of the impact of climate change, past or
literature. We also note that many of these limitations can        future, on the supply side of the ski tourism industry and
only be waived by an increasing availability of data relevant      raises awareness at the sectoral scale of climate change im-
to snow management in ski resorts, making it easier to quan-       pacts and risks, it provides a lumped message, which is not
tify the impact of climate change on their operating condi-        applicable at the scale of individual ski resorts, although this
tions and, as a result, better understand the resorts’ sensitiv-   is most often the most relevant governance level for moun-
ity to changing climate conditions and contribute to climate       tain tourism development. Previous studies addressing large
change adaptation in this domain (Spandre et al., 2019; Ger-       geographical domains have generally recognized that studies
baux et al., 2020; Berard-Chenu et al., 2020; Morin et al.,        at the individual scale would be most appropriate to inform
2021).                                                             deliberation and decisions at the local scale, prompting more
                                                                   detailed study at the scale of individual ski resorts (e.g. Ger-
4.2   Quantification of the impact of climate change on            baux et al., 2020; Steiger et al., 2019). The present study re-
      snow reliability, with and without snowmaking                inforces this position and reinforces the need to exercise ex-
                                                                   treme caution when attempting to derive general statements,
This study provides an original appraisal of the time evolu-       at the local or regional levels, about the evolution of ski re-
tion of snow cover reliability, based on a detailed modelling      sort operating conditions. Furthermore, our results indicate
framework enabling the computation of a resort-level snow          that the trends in natural or managed snow cover reliability
reliability indicator, spanning the time period from 1961 to       strongly depend on the period of the year (at the monthly
2019 for multiple ski resorts. Our results indicate that, over     scale), which supports the need to carefully choose relevant
the past 60 years in 16 ski resorts in Savoie, the climate         indicators depending on the ski resort considered (Abegg et
conditions have become increasingly challenging in terms           al., 2021): depending on their business model, size, eleva-
of the natural snow cover of ski resorts, especially for ski       tion range and climate settings, key periods for ski tourism
resorts with a significant fraction of their surface area be-      can be different depending on the ski resort under consider-
low approx. 2000 m. This is particularly the case in the early     ation. The snow reliability index and its derivatives remain
(November, December) and late (March, April) season, with          one indicator among others to analyse the effect of climate
contrasting patterns depending on the fraction of the ski re-      conditions on the operation of the ski tourism industry. For
sort above 2000 m elevation. The results also indicate that        instance, Mayer et al. (2018) illustrated that a thermal com-
not only natural snow cover reliability and its changes but        fort index could have a more significant effect on ski demand
also the benefits of snowmaking in terms of snow reliability       than snow depth. Several microclimatic characteristics may
significantly vary between ski resorts. While at the core of       influence both the operation and the visitation of the ski re-
the winter season the snowmaking deployment trajectory has         sorts. Therefore, the search for a single snow reliability in-
counterbalanced the decrease in natural snow cover reliabil-       dicator universally applicable to ski resorts of all sizes and
ity for ski resorts with a low-elevation domain and in most        settings is probably elusive.
cases increased snow cover reliability, in the early season
and late season snowmaking development has not counter-            4.3   Can the climate change risk reduction factor due to
balanced the snow cover declining trend. In this respect, our            snowmaking implementation be calculated?
results fully corroborate, in the case of the northern French
Alps, the findings highlighted in the IPCC SROCC Sum-              Besides our analysis of the trends in natural and managed
mary for Policymakers (IPCC, 2019) that “[i]n nearly all high      snow cover reliability in ski resorts in the northern French
mountain areas, the depth, extent and duration of snow cover       Alps, which we show varies across ski resorts due to dif-
have declined over recent decades, especially at lower ele-        ferences in geographical settings (in particular the elevation
vation (high confidence)” and that “[t]ourism and recreation,      distribution) and the pace of snowmaking equipment invest-
including ski . . . tourism . . . have . . . been negatively im-   ments over the past decades, our analysis provides some of
pacted in many mountain regions (medium confidence)” and           the information required to assess whether snowmaking has

The Cryosphere, 16, 863–881, 2022                                                       https://doi.org/10.5194/tc-16-863-2022
L. Berard-Chenu et al.: Past changes in natural and managed snow reliability 877 indeed decreased the overall climate risk faced by ski resorts, 1961 to 2019 will undoubtedly be different for each ski re- due to climate variability leading to the occasional occur- sort, so seeking a single climate change risk reduction factor rence of particularly unfavourable meteorological and snow for the entire ski tourism industry is most probably elusive conditions at the scale of 1 year. In a context where both the and would mask out the strong heterogeneity in the climate climate and the extent to which snowmaking is implemented change impact drivers (hazards) and exposure and vulner- have changed, it is virtually impossible to assess the parti- ability of the individual elements (ski resorts) forming the tioning of the climate change risk into its different factors. backbone of the industry as a whole. Still, Domaines Skiables de France, the national organization bringing together French ski resorts, and the National As- 4.4 Past performance is not a guarantee of future sociation of Mayors of Mountain municipalities (ANMSM, results Association Nationale des Maires des Stations de Montagne) have stated that, thanks to snow management (grooming and Our results are consistent with Gonseth (2013), who high- snowmaking) and slope preparation, the risk induced by a lighted snow reliability gains with snowmaking. How- given level of climate hazard has been divided by a factor ever this study stressed diminishing returns to snowmak- of 3 over the past 25 years (Domaines Skiables de France ing investments, similarly to Falk and Vanat (2016). Gon- and ANMSM, 2015). The modelling approach taken in the seth (2013) also pointed out snow reliability gains expected present study allowed us to assess how the current level of with snowmaking remained based on a dual assumption of snowmaking coverage would have behaved against the sit- economic and technical feasibility under future meteorolog- uation which prevailed, for example, during the notoriously ical conditions. The past increases in snow reliability due challenging winter seasons in the late 1980s and early 1990s to snowmaking identified for some ski resorts in our study or even the winter of 1963/64, which is, for our study do- are also consistent with the faith in snowmaking technology main, the most challenging winter season, in terms of snow emphasized by some ski industry stakeholder risk perception conditions, of the entire record from 1961 to 2019. Figures 3, studies. Trawöger (2014) mentioned a “technosalvation” be- 5 and 6 show, for example, absolute values and differences to lief among Austrian CEOs of cable car companies, and in a a no-snowmaking situation, in terms of annual and monthly similar way Bicknell and McManus (2006) showed an “over- snow cover reliability, including these challenging winters. whelming cornucopian belief” regarding snowmaking tech- Figures 4 and 7 show the relationship between reliability in- nology among Australian CEOs of ski lift companies. Steiger dicators accounting for a fixed, 2018-level snowmaking cov- et al. (2019) stated that this belief is a widely held consen- erage and the snow cover reliability values obtained with- sus in the ski industry whereby “with constantly improving out snowmaking. These figures show that challenging win- snowmaking techniques and continued investment, [ski lift ters without snowmaking remain challenging when account- operators] are well prepared for climate challenges that lie ing for snowmaking at current snowmaking equipment lev- ahead”. According to Abegg et al. (2017) the faith placed in els, although in many cases the snow conditions are improved snowmaking by the ski tourism industry is one of the rea- but never, especially in the early (November and Decem- sons why there remains a perception gap between the sci- ber) and late (March and April) season, to the extent that entific literature and some ski tourism industry stakeholders snowmaking fully compensates for challenging natural snow regarding upcoming climate change challenges. The partial conditions. In addition, the evidence provided in this study success of snowmaking in counteracting challenging natural shows not only that the snow reliability benefits of snow- snow conditions may skew ski lift operators’ risk perception making for challenging winter seasons, i.e. snowmaking’s and lead them to consider past performance to plan future capacity to compensate for challenging meteorological and returns on snowmaking in reducing the impacts due to cli- natural snow conditions, are strongly heterogeneous across mate change. Yet, future success of snowmaking as an adap- ski resorts due to the resorts’ differences in geographical set- tive measure is not a guarantee in increasingly challenging tings (in particular their elevation range) but also the key climate conditions, and ski lift operators should not assume periods during the winter season which are most impactful that snowmaking investments will continue to do well in the on their economic results. Providing a single factor for the future simply because they have performed satisfyingly over climate risk reduction due to snowmaking across the entire the past decades. This is especially the case considering that ski industry in a given region would require that a single the snow production demand will increase in a warming cli- indicator could be applied to all ski resorts uniformly and mate (Hock et al., 2019). furthermore that this indicator would be directly related to their economic performance in order to apply a risk approach meaningfully and compute the risk reduction factor related to 5 Conclusions and perspectives a given snowmaking equipment level. While our modelling framework makes it possible to enable further quantifications Our contribution introduces several innovative elements in in the future along these lines, our results suggest that the the assessment of past changes in natural and managed snow climate change risk reduction factor for the past period from reliability in the ski industry. Our approach takes into account https://doi.org/10.5194/tc-16-863-2022 The Cryosphere, 16, 863–881, 2022
You can also read