Will daytime community calcification reflect reef accretion on future, degraded coral reefs?
←
→
Page content transcription
If your browser does not render page correctly, please read the page content below
Research article
Biogeosciences, 19, 891–906, 2022
https://doi.org/10.5194/bg-19-891-2022
© Author(s) 2022. This work is distributed under
the Creative Commons Attribution 4.0 License.

Will daytime community calcification reflect reef accretion
on future, degraded coral reefs?
Coulson A. Lantz1,2 , William Leggat2 , Jessica L. Bergman1 , Alexander Fordyce2 , Charlotte Page1 , Thomas Mesaglio1 ,
and Tracy D. Ainsworth1
1 School of Biological, Earth and Environmental Sciences, University of New South Wales,
Kensington, 2033 NSW, Australia
2 School of Environmental and Life Sciences, University of Newcastle,

Callaghan, 2309 NSW, Australia

Correspondence: Coulson A. Lantz (coulsonlantz@gmail.com)

Received: 5 March 2021 – Discussion started: 24 March 2021
Revised: 25 October 2021 – Accepted: 13 November 2021 – Published: 14 February 2022

Abstract. Coral bleaching events continue to drive the degra-     portion of the NEC signal owed to ahermatypic calcification
dation of coral reefs worldwide, causing a shift in the benthic   increases and coral dominance on the reef decreases.
community from coral- to algae-dominated ecosystems. Crit-
ically, this shift may decrease the capacity of degraded coral
reef communities to maintain net positive accretion during
warming-driven stress events (e.g., reef-wide coral bleach-       1   Introduction
ing). Here we measured rates of net ecosystem calcification
(NEC) and net ecosystem production (NEP) on a degraded            Coral have long been the focus of climate change research in
coral reef lagoon community (coral cover < 10 % and al-           tropical oceans as they are a keystone species responsible for
gae cover > 20 %) during a reef-wide bleaching event in           the biogenic construction of complex reef habitat (Grigg and
February 2020 at Heron Island on the Great Barrier Reef.          Dollar, 1990). Adverse effects to their ability to construct cal-
We found that during this bleaching event, rates of NEP and       cium carbonate structure have negative implications for coral
NEC across replicate transects remained positive and did not      reef ecosystems, given corals are the major organism respon-
change in response to bleaching. Repeated benthic surveys         sible for collectively maintaining the accumulation of perma-
over a period of 20 d indicated an increase in the percent area   nent reef structure at a rate that overcomes the biological and
of bleached coral tissue, corroborated by relatively low Sym-     physical mechanisms that act to break reefs down (carbon-
biodiniaceae densities (∼ 0.6 × 106 cm−2 ) and dark-adapted       ate dissolution, bioerosion, storm activity; Eyre et al., 2018).
photosynthetic yields in photosystem II of corals (∼ 0.5)         In contrast to coral-derived calcium carbonate, other benthic
sampled along each transect over this period. Given that a        marine calcifiers, such as non-sessile Gastropods, Echino-
clear decline in coral health was not reflected in the overall    derms, or Halimeda algae (Ries et al., 2009; Harney and
NEC estimates, it is possible that elevated temperatures in       Fletcher, 2007), secrete calcium carbonate that is relatively
the water column that compromise coral health enhanced the        temporary and does not contribute to the long-term reef struc-
thermodynamic favorability for calcification in other aher-       ture. Traditionally, corals are classed as the dominant calci-
matypic benthic calcifiers. These data suggest that positive      fier on tropical coral reefs, occupying between 10 %–50 % of
NEC on degraded reefs may not equate to the net positive          benthic area in healthy coral reef lagoons (Bruno and Selig,
accretion of a complex, three-dimensional reef structure in a     2007; Brown et al., 2004). As such, estimates of net ecosys-
future, warmer ocean. Critically, our study highlights that if    tem calcification (NEC) are considered synonymous with the
coral cover continues to decline as predicted, NEC may no         growth and function of the entire coral reef community and
longer be an appropriate proxy for reef growth as the pro-        can be used to represent the collective response in coral reef
                                                                  community health to anthropogenic stressors such as ocean

Published by Copernicus Publications on behalf of the European Geosciences Union.
892                          C. A. Lantz et al.: Will daytime community calcification reflect reef accretion on future reefs

warming and subsequent reef-wide bleaching events (Court-           driven stress events (e.g., eutrophication and sedimentation;
ney et al., 2018).                                                  Edinger et al., 2000) in which coral growth rates on undis-
   Presently, records of coral reef NEC during a reef-wide          turbed reefs did not differ from those measured on polluted,
bleaching event (driven by sea surface temperatures plus 1 ◦ C      algal-dominated reefs where habitat structure was clearly
above monthly maximum means; Heron et al., 2016; Sully et           degrading. If the community predominantly becomes cov-
al., 2019) are rare (McMahon et al., 2019). The effects of          ered in algae and the habitat structure is visibly degrading,
bleaching events, and their associated thermal seawater tem-        does NEC still represent reef growth or does it now reflect a
perature anomalies, on coral reef NEC have been predomi-            greater proportion of ahermatypic organism calcification not
nately studied ex situ using recreated communities in aquaria       contributing to permanent structure?
(Dove et al., 2013) or scaling up the response from organism-          Shifts from coral- to algal-dominated reefs without the
level studies, both ex situ (Castillo et al., 2014) and in situ     concomitant decline in NEC have been observed by Kayanne
(Cantin et al., 2010). In studies conducted ex situ in aquaria,     et al. (2005; 7.1 % coral cover), in which no change in NEC
a warming treatment strong enough to cause bleaching (be-           on Shiraho Reef, Japan, was measured despite 51 % of the
tween 1–4 ◦ C above the summer mean) reduced coral calcifi-         corals bleaching during a 1998 bleaching event and a decline
cation rates by 30 %–90 % (Cantin et al., 2010; D’Olivo and         to 5.8 % coral cover. This study suggested that continued cal-
McCulloch, 2017). In situ observations following bleaching          cification by living, unbleached corals, calcifying algae, or
events have shown a 20 %–90 % reduction in individual coral         other benthic calcifiers (e.g., foraminifera, gastropods, echin-
calcification rates (Castillo et al., 2014) and a significant re-   oderms) may have compensated for any expected bleaching-
duction in the coral endosymbiont photosynthetic yields (evi-       driven decline in coral calcification. This discrepancy be-
dence of damage to their photosystems; Warner et al., 1999).        tween Kayanne et al. (2005; no change in NEC on a reef
At the whole community level, the few in situ studies that          with < 10 % coral cover) and that of other NEC estimates
have observed community metabolism during a bleaching               during a bleaching event (decline in NEC on a reef ≥ 10 %
event recorded a 40 % (Dongsha Atoll, Taiwan; DeCarlo et            coral cover; DeCarlo et al., 2014) may be due to a critical
al., 2017) to 100 % (Kaneohe Bay, Hawaii; Courtney et al.,          threshold in the relationship between NEC and percent coral
2018; Kayanne et al., 2005; Palau) decline in reef NEC. This        cover. This is of specific concern when using NEC to monitor
effect has been observed to linger 6 to 12 months after these       community function (i.e., the net accretion of reef structure)
events, with NEC remaining depressed by as much as 40 %–            during coral bleaching or other disturbance events on future,
46 % (Lizard Island; McMahon et al., 2019) and an ultimate          degraded reefs where algae will likely become the dominant
loss of 30 %–90 % of the benthic coral cover (Brown and             benthic member.
Suharsono, 1990; Baird et al., 2002). Experiments with sim-            To address these emerging concerns, this study investi-
ulated communities in aquaria (e.g., Dove et al., 2013) vali-       gated community metabolism on a degraded coral reef com-
date these organism- and community-level in situ studies, in        munity (coral cover < 10 %, algae cover > 20 %) during a
which this same magnitude of warming leads to a reduction           bleaching event at Heron Island on the Great Barrier Reef in
in the experimental community coral cover by 30 %, a 70 %           February 2020. Flow-metabolism transects were established
decline in NEC, and subsequent out-competition of corals by         on two areas within the Heron Island lagoon, and estimates of
neighboring algae.                                                  community metabolism (net ecosystem production, NEP, and
   The overgrowth of algae has been mirrored in the natu-           NEC), coral metaorganism function (photosynthetic yields,
ral reef lagoon environment several times following bleach-         Symbiodiniaceae densities), benthic cover, and bleaching ex-
ing events (Hughes et al., 1999; Diaz-Pulido et al., 2009).         tent (percent bleached coral tissue) were assessed during the
Despite a recovery to normal pre-disturbance NEC within             period of peak thermal stress.
2 years following a 2014 bleaching event at Lizard Island
(Pisapia et al., 2019), there was a permanent shift from coral
to algae as the dominant benthic community member, with             2     Materials and methods
a decline in coral cover from 8 %–3 % along transects estab-
lished at the southeast end of the lagoon (McMahon et al.,          2.1    Study area
2019). This response has been seen elsewhere on the Great
Barrier Reef, where reef-wide bleaching events lead to the          This study was conducted from 15 January to 10 Febru-
overgrowth of unpalatable Lobophora variegata algae (Diaz-          ary 2020. Two separate 200 m × 100 m lagoon sites (la-
Pulido et al., 2009) to the extent that coral became a minor-       goon sites 1 and 2; Fig. 1) that each differed in total coral
ity constituent (∼ 2 %–5 %) in the lagoon’s benthic commu-          cover were established on the southern side of the Heron
nity. This transition to an algal-dominated reef community          Island lagoon (23◦ 260 6700 S, 151◦ 54.9010 E). Community
jeopardizes the efficacy of NEC as a proxy for reef growth          metabolism, physiochemical data, benthic community cover,
given that hermatypic corals can no longer be considered            and bleaching extent were then repeatedly measured on each
the dominant benthic organism (Courtney et al., 2018). Sim-         transect over a period of 20 d. HOBO temperature loggers
ilar questions have been raised after other anthropogenically       (Onset, USA), which recorded temperature (◦ C) at an inter-

Biogeosciences, 19, 891–906, 2022                                                       https://doi.org/10.5194/bg-19-891-2022

C. A. Lantz et al.: Will daytime community calcification reflect reef accretion on future reefs                             893

val of 15 min, were deployed at nine upstream and down-           to calculate the relative percent area of each category over
stream locations (1–9) across the study area (Fig. 1). Over-      time.
lapping loggers located at the middle deployment locations           For mobile invertebrate surveys, a transect tape was laid
(2, 5, and 8) were used for both lagoon sites 1 and 2, result-    along each 200 m transect length, and relatively large, easily
ing in six loggers per site.                                      visible mobile invertebrates (e.g., sea cucumbers, sea hares,
   To measure the accumulation of temperature stress above        sea urchins) located 1 m to the left or right along the tran-
the local bleaching threshold (defined here as the maximum        sect were counted. Surveys were conducted at dawn to en-
of the monthly means, MMM + 1 = 28.3 ◦ C; Liu et al. 2014),       sure a balance of visibility and invertebrate activity and re-
mean temperatures across all nine loggers were used to cal-       peated three times along each transect (n = 9 per site). Data
culate the number of degree heating weeks (DHWs), which           are presented as abundance counts per square meter (indi-
represents the 12-week accumulation of temperatures above         viduals m−2 ). Individuals present at less than 0.1 m−2 were
the MMM (Heron et al., 2016). Because HOBO tempera-               excluded from the final data reported but were included as
ture loggers may record higher temperatures than surround-        part of the invertebrate taxonomy described below. For gen-
ing seawater due to internal heating of the transparent plastic   eral invertebrate taxonomy, while conducting the survey ap-
casing (Bahr et al., 2016), HOBO loggers were deployed in         proaches detailed above, each time a new invertebrate mor-
the shade on a cinder block, and downloaded temperature           phospecies was encountered, photographs were taken and
data were corrected for precision (48 h side-by-side logging      uploaded to iNaturalist, a biodiversity citizen science plat-
of all nine loggers in an aquarium) and accuracy (deploy-         form where identifications are contributed in real time by
ment next to Hanna HI98194 multimeter recording tempera-          both amateur naturalists and professional taxonomists as part
ture). Light loggers (2π Odyssey PAR sensor) were deployed        of a consensus system (https://www.inaturalist.org, last ac-
within the middle of each study site (n = 1 per site). Loggers    cess: 10 October 2020). Using a combination of taxonomic
were attached to a star picket to ensure the sensor was ex-       keys and crowdsourcing via iNaturalist, algae, corals, and
actly 20 cm above the benthos and recorded light intensity at     other sampled marine invertebrates were identified to as fine
15 min intervals. Odyssey light logger data were converted to     a taxonomic level as possible. These data are presented as
micromoles quanta of photosynthetic active radiation (PAR)        presence/absence across the entire 200 m × 400 m study area.
per square meter per second (µmol quanta m−2 s−1 ) using a        Because sampling was conducted at low tide, most fish usu-
linear calibration over a 24 h period with a 2π quantum sen-      ally present in the lagoon were absent and excluded from
sor LI-190R and a LI-COR LI-1400 m (R 2 = 0.92).                  benthic survey data.

2.2   Benthic community surveys                                   2.3   Bleached coral physiology

The benthic community along each 200 m transect was de-           Following the qualitative appearance of bleaching (white
scribed using four survey approaches: (1) point-contact sur-      corals in photo quadrat surveys), efforts were made to pro-
veys, (2) photo-quadrat surveys, (3) mobile invertebrate          vide physiological data that would corroborate bleaching ob-
counts, and (4) invertebrate and algal taxonomy descrip-          servations. This was accomplished through Symbiodiniaceae
tions. For the (1) point-contact surveys and (2) photo-           density analyses for both Acropora spp. (Acropora aspera,
quadrat surveys, benthic cover was categorized as coral (her-     Acropora millepora, Acropora muricata, Acropora humilis)
matypic, live), coral (bleached), coral (soft), algae (fleshy,    and “Other” corals (Pocillopora damicornis, Isopora palif-
non-calcifying), other calcifier (e.g., Halimeda spp.), rub-      era, Porites cylindrica, Montipora digitata). For photophysi-
ble, and sediment. For the point-contact method, the occupier     ology, replicate coral fragments (n = ∼ 15–35 per time point)
of benthic space was recorded underneath each 1 m interval        of both Acropora spp. and “Other” corals were collected
(n = 200 per transect) at the beginning and end of the study,     across all transects at lagoon sites 1 and 2 by hand on 4 and
and data are presented as relative percent cover. These sur-      9 February 2020 (once bleaching was apparent) and used to
veys were repeated twice per transect at the beginning of the     measure photosynthetic efficiency of in hospite Symbiodini-
study (18–20 January 2020) to provide an initial understand-      aceae cells. Measurements of photosystem II dark-adapted
ing of the community assemblage prior to flow-metabolism          yield were taken using a pulse-amplitude modulated (PAM)
measurements. For the (2) photo-quadrat method, a photo of        fluorometer (MAXI Imaging PAM, Waltz, Effeltrich, Ger-
a 1 m2 PVC quadrat was taken at every 5 m interval (n = 40        many) using imaging PAM analysis (n = 3 technical repli-
per transect) three times throughout the study: (1) at the be-    cates per fragment).
ginning prior to any observed bleaching (24 January 2020),           For quantification of Symbiodiniaceae densities, replicate
(2) in the middle after the first observed bleaching event        coral fragments (n = ∼ 15–35 per time point) of both Acrop-
(6 February 2020), and (3) at the end of the study after sev-     ora spp. and “Other” corals were collected across all tran-
eral more observed bleaching incidents (13 February 2020).        sects at lagoon sites 1 and 2 by hand on 30 January and
These images were analyzed in ImageJ using one side of the        12 February 2020. At each sampling time point the most vi-
photo quadrat to set the scale (1 m) and the area tracing tool    sually “stressed” (ranging from pale to completely bleached)

https://doi.org/10.5194/bg-19-891-2022                                                     Biogeosciences, 19, 891–906, 2022
894                           C. A. Lantz et al.: Will daytime community calcification reflect reef accretion on future reefs

Figure 1. (a) Study area (100 m scale) subdivided into lagoon site 1 (red) and lagoon site 2 (blue). Numbered white circles (1–9) indicate
of location water samples and temperature loggers. Yellow triangles indicate location of light loggers. (b) Study area (1 km scale) showing
lagoon site 1 (S1) and lagoon site 2 (S2) in relation to Heron Island and the larger slack-water area. (c) In situ lagoon temperature (◦ C)
averaged across both sites measured by temperature loggers. The dashed black line represents the 24 h average of these temperature data, and
the red line indicates the accumulation of degree heating weeks (DHWs; ◦ C weeks) in these data. (d) Light intensity (µmol quanta m−2 s−1 )
averaged across two light loggers. The green circle represents location of ADV flow meter during Eulerian estimates. All data were recorded
at 15 min intervals from 22 January to 13 February 2020. Aerial photograph is provided by © Google Earth.

corals were collected. A total of 15 fragments from each                counted in triplicate using an improved Neubauer haemocy-
group (Acropora spp. or “Other”) were collected at the study            tometer. Counts were normalized to fragment surface area
site and directly frozen in Whirl-Pak© bags at −80 ◦ C. Tis-            using the wax method (Stimson and Kinzie, 1991).
sue was removed from the skeleton using an airpik and com-
pressed air from diving tanks. Tissue was blown into a zi-              2.4    Lagoon community metabolism measurements
plock bag with 50 mL of 0.45 µm filtered seawater. The al-
gal pellet was washed three times (centrifuged at 3856 × g,             Rates of daytime net ecosystem production (NEP;
4 ◦ C for 5 min) to remove mucous and coral tissue before               mmol O2 m−2 h−1 ) and net ecosystem calcification (NEC;
being frozen at −20 ◦ C for later analysis. The pellet was              mmol CaCO3 m−2 h−1 ) were estimated daily (tides and full
suspended in 10 mL of filtered seawater, and aliquots were              sunlight permitting) over the course of 20 d (22 January
                                                                        to 12 February 2020) along the six transects. To estimate

Biogeosciences, 19, 891–906, 2022                                                             https://doi.org/10.5194/bg-19-891-2022
C. A. Lantz et al.: Will daytime community calcification reflect reef accretion on future reefs 895
rates of NEP and NEC, changes in dissolved oxygen (DO) ter to measure significant changes in seawater chemistry. The
and total alkalinity (AT ) were measured, respectively, 400 m × 100 m area was then designated as two. The spread
during a 3 h window around low tide and peak sunlight of the dye path varied ± 25 m in a north–south direction, and
using both the slack-water and flow-respirometry (Eulerian) triplicate 200 m transects were spaced 50 m apart in parallel
approaches. Because differences in sunlight are a major at each site so that NEC and NEP were averaged across the
driver in NEP variability, measurements were refined to days three downstream locations, representing all potential water
of full sunlight and low tides coinciding with near midday flow paths of the overall study site area. A flow meter was ro-
(11:00–15:00). Flow speeds across the transect were mea- tated between downstream water sample collection locations
sured with an acoustic Doppler velocimeter (ADV; SonTek, (n = 3 per sampling location), and the determined continued
cm s−1 ) recording data at 15 min intervals. This ADV was placement of the one available ADV at the middle down-
placed at the end of the middle transect (Fig. 1). Depth stream location was adequate to represent flow speed across
varied between 0.1–1 m and was measured concurrently all three transects. Within each area, three 200 m transects
with water sample collections at each location. Depth was were established in parallel, 50 m distance from one another
also measured at peak low tide at 5 m intervals along each (Fig. 1). Water samples were collected as close in time as
transect (n = 120 site 1) to ensure that sample location possible at these fixed upstream and downstream locations
depths adequately represented the entirety of the transect. (n = 3 per area) at peak low tide, while lagoon currents were
Salinity (psu) and DO (mg L−1 ) was measured with a unidirectional, running east to west.
Hanna HI98194 multimeter, and DO was converted to mi- 3600 1DO × ρ × u × d
cromoles per kilogram (µmol kg−1 ) using seawater density. NEP = × (1)
100 l
DO probe calibration was performed weekly using a two- 3600 0.5 × 1TA × ρ × u × d
point calibration at 0 % (sodium thiosulfate) and 100 % sat- NEC = × (2)
urated seawater equilibrated with the atmosphere. Samples 100 l
for AT were collected in 60 mL sample polycarbonate sam- The Eulerian approach requires the following measurements:
ple bottles, preserved with saturated mercuric chloride ac- the change in DO and AT (1DO and 1AT ; mmol kg−1 ),
cording to CO2 best practices (Dickson, 2007), and sealed the mean seawater density (ρ; kg m−3 ), the mean current
with a screw top lid and parafilm. Seawater AT was analyzed speed (cm s−1 ), the mean depth over the transect (d; meters),
by potentiometric titration using a Metrohm 848 Titrino plus and the length of the transect (l; meters). For specific de-
automatic titrator (∼ 40 mL of seawater per sample) in dupli- tails on the arrangement of the equations above, including
cates (SD uncertainty < 2 µmol kg−1 ). Overall analytical un- the 3600/100 parameter (to convert cm s−1 to m h−1 ), please
certainty for AT (SD = ± 2.4 µmol kg−1 ) measurements was refer to Langdon et al. (2010).
estimated from repeated measurements of certified reference
2.4.2 Slack-water approach
materials from the Scripps Institute of Oceanography (CRM;
Batch 161). The slack-water approach was used to estimate rates of NEP
and NEC over a relatively larger area of reef (∼ 0.3 km2 ) dur-
2.4.1 Eulerian approach ing a period of 3 h around low tide. This period was cho-
sen based on initial observations of current speed and direc-
Flow metabolism transects were established along a reef area tion that aligned with previous slack-water estimates on this
previously characterized as degraded, where there is less specific area of the Heron lagoon (Stoltenberg et al., 2020).
than 10 % coral cover (Roelfsema et al., 2018). The flow- Starting 2 h before peak low tide, the lagoon becomes sep-
respirometry (i.e., Eulerian approach) measurements were arated from the open ocean, and the current begins flowing
conducted within two designated reef areas (100 m × 200 m; unidirectionally toward the lagoon outlet to the west. This
0.02 km2 ) that significantly differed in coral cover. The de- unidirectional flow behavior continues until roughly 2 h after
fined study area was determined based on the necessary peak low tide; at that time the flow begins to reverse as the
transect length to achieve measurable differences in seawa- tide fills back in over the reef crest. To avoid dilution with
ter dissolved oxygen (1DO = ± 4–7 mg L−1 ) between up- the open ocean and changing current vector directions con-
stream and downstream locations (∼ 200 + m; Langdon et founding residence time estimates, water samples were col-
al., 2010). lected from the same three locations (n = 3 d−1 ) 2 h before
Repeated deployments of fluorescein dye packets across peak low tide and 1 h following.
the research zone at differing tidal periods determined a spe-
cific 400 m × 100 m area of the reef where flow was unidirec- 1DO × ρ × d
NEP = (3)
tional from east to west. This period spanned from 2 h before 1t
to 1 h after peak low tide (3 h total). Outside of this period, 0.5 × 1AT × ρ × d
NEC = (4)
the reef lagoon was no longer physically separated from the 1t
open ocean, flow became multidirectional, and the defined la- The slack-water approach requires the following mea-
goon area became too deep and diluted with open ocean wa- surements: the change in DO and AT (1DO and 1AT ;
https://doi.org/10.5194/bg-19-891-2022 Biogeosciences, 19, 891–906, 2022896 C. A. Lantz et al.: Will daytime community calcification reflect reef accretion on future reefs
mmol kg−1 ), the mean seawater density (ρ; kg m−3 ), mean stream measurement, and f O2air (mg L−1 ) was assumed to
depth over the transect (d; meters), and time between sam- be 100 % saturation at the air temperature over the 3 h mea-
pling (1t; hours). Given the time between samples (∼ 3 h) surement period (∼ 8.10 mg L−1 ).
and mean current speeds (∼ 20 cm s−1 ), these measurements
represent a transect length of roughly 2.5–3 km of reef. 2.4.5 Statistical analyses
2.4.3 Approach comparison All statistical analyses were performed with the SPSS statis-
tics software (SPSS Inc. 2013 Version 26.0). To compare
Both approaches to estimate NEP and NEC provide limita- measured differences in benthic cover (percent coral, percent
tions and advantages with respect to each other (see Langdon algae, percent bleached coral tissue, sediment overgrowth)
et al., 2010). In the Eulerian approach, the exact benthic area and community metabolism (NEP and NEC) between tripli-
contributing to measured changes in seawater chemistry is cate transects, measurement days (n = 12), and lagoon sites
known, and its constituents can be quantified and related to (lagoon site 1, lagoon site 2, and slack water), a one-way
the calculated rates of benthic metabolism. This approach, analysis of variance (ANOVA) model was used where tran-
however, measures change in alkalinity over a relatively sect, day, or site was a fixed effect, and measured values for
smaller area and time period. Resulting fluxes in AT (± 30– percent cover, NEP, and NEC were treated as the response
60 µmol kg−1 ) and DO (± 20–50 µmol kg−1 ) are relatively variable. Results for percent cover compared among tripli-
small compared to the slack-water approach, thereby provid- cate transects and lagoon sites are displayed in Tables S1
ing less confidence in calculated rates of benthic metabolism. and S2, respectively. Before community metabolism mea-
In contrast, the slack-water approach benefits from the surements were compared, assumptions of normality and
relatively large changes in total alkalinity (AT : ± 100– equality of variance were evaluated with a Shapiro–Wilk test
200 µmol kg−1 ) and dissolved oxygen (DO: ± 80– (Table S4). Results for community metabolism compared
150 µmol kg−1 ), which provides more confidence in among triplicate transects, measurement days, and lagoon
AT anomaly calculations and represents a large area of the sites are displayed in Tables S5, S6, and S7, respectively. A
reef flat relative to this study’s flow-respirometry estimates. Tukey HSD post hoc test was used to perform pairwise com-
This approach, however, lacks specificity of the exact area parisons for measured NEC between lagoon site 1, lagoon
of reef affecting changes in chemistry, and DO fluxes site 2, and the slack-water approach (Table S7). To explore
are more vulnerable to gas exchange anomalies. As such, relationships between NEC as a function of NEP, Model II
relating metabolic rates to the benthic community provides regression techniques were used to test for significant linear
uncertainties given daily changes in mean current speed and, relationships (cutoff value p< 0.1), and an ANCOVA was
subsequently, the area of benthos reflected in the AT and DO used to test for differences in NEC vs. NEP slope categorized
anomaly. by lagoon site (lagoon site 1 and lagoon site 2).
Overall, the combination of both approaches can work
in tandem to compensate for their respective weaknesses.
However, neither approach can accommodate dilution with 3 Results
the open ocean, and they generally need to be conducted
3.1 Lagoon community assemblage
in full sunlight or darkness so that community metabolism
does not transition between autotrophy and heterotrophy in Across the whole study area (lagoon site 1 and lagoon site 2
the middle of the measurements. For this reason, community combined), the benthic community was predominately cov-
metabolism estimates were paused from 27 January–2 Febru- ered by sediment (59 ± 7 %) and fleshy algae (25 ± 6 %).
ary when peak low tide occurred around dawn and dusk, and Coral cover (5 ± 3 %) was slightly higher relative to other
changes in DO and AT were negligible. recorded sessile calcifiers (4 ± 1 %) and carbonate rubble
covered in coralline algae (5 ± 2 %). Algae was the domi-
2.4.4 Air–sea gas exchange corrections
nant benthic organism in both lagoon site 1 (28 ± 4 %) and
NEP estimates were corrected for the air–sea gas exchange lagoon site 2 (22 ± 4 %), and cover was significantly higher
(FO2 ) of oxygen using the gas-transfer velocity relation- at lagoon site 1 (p = 0.011) (Table 1). Lagoon site 2 ex-
ships outlined by Wanninkhof (1992) and Wanninkhof et hibited a significantly higher coral coverage (8 ± 3 %) rel-
al. (2009). FO2 was calculated with the following equation. ative to lagoon site 1 (3 ± 2 %) (p = 0.001), the majority
of which were A. aspera, A. millepora, and M. digitata.
FO2 = k K0 (f O2water − f O2air ) , A description of the mobile and sessile invertebrate diver-
sity is described in Fig. 2 and the Supplement (Table S4).
where k is the gas transfer velocity (calculated using and A full list of observed invertebrates and accompanying
averaged daily wind speed from BOM data), K0 is the gas photos can be found at https://www.inaturalist.org/projects/
transfer coefficient, f O2water is the concentration of sea- heron-island-survey-corals-inverts-and-algae, last access:
water dissolved oxygen (mg L−1 ) at the time of the down- 10 October 2020.
Biogeosciences, 19, 891–906, 2022 https://doi.org/10.5194/bg-19-891-2022C. A. Lantz et al.: Will daytime community calcification reflect reef accretion on future reefs 897
Table 1. Percent cover (mean ± SD) measured during point-contact and photo-quadrat surveys. Data for point contact surveys were pooled
across triplicate transects and repeated survey efforts (n = 6 per site) within each lagoon site area. Data for photo-quadrat surveys were
pooled across triplicate transects and repeated survey efforts within each lagoon site area (n = 360 per site).
Category Lagoon site 1 Lagoon site 2 Total
Point Photo Point Photo Mean
contact quad contact quad cover
Hard coral 3±2% 3±2% 8±3% 9±3% 6%
Soft coral 1%< 1%< 1%< 1%< 1%<
Algae 27 ± 4 % 18 ± 5 % 23 ± 4 % 16 ± 4 % 21 %
Other calcifier 3±2% 2±2% 6±1% 2±2% 3%
Rubble 4±3% 2±2% 5±3% 3±3% 4%
Sediment 62 ± 6 % 74 ± 7 % 57 ± 7 % 69 ± 6 % 65 %
Overall, we found 25 coral species in the lagoonal reef exhibited a mean value of 328 ± 247 µmol quanta m−2 s−1
study area, 22 of which were hard corals and 3 soft corals and maximum values of 1001 µmol quanta m−2 s−1 (Fig. 1).
(Fig. 2; Table S8). A total of 13 algae morphospecies Temperature across lagoon site 2 exhibited a mean value
were observed, with one identified as species Valonia ven- of 28.6 ± 1.5 ◦ C and varied between a minimum of 25.9 ◦ C
tricosa and the rest unidentified. Across all other inverte- and a maximum of 34.6 ◦ C. Light at lagoon site 2 exhibited
brate taxa, 19 species of echinoderms, bivalves, and poly- a mean value of 336 ± 254 µmol quanta m−2 s−1 and maxi-
chaetes and 24 species of crustaceans and gastropods were mum values of 969 µmol quanta m−2 s−1 .
observed. Of the 43 non-coral invertebrate species, 15 were Satellite monitoring data (5 km pixel resolution; NOAA
associated with colonies of Pocillopora corals. Sea cucum- Coral Reef Watch; Liu et al., 2006) indicated the accumu-
bers (e.g., Holothuria spp., Stichopus spp.) were the dom- lation of heat stress beginning on 1 February 2020. Lagoon
inant mobile invertebrate, and the lollyfish sea cucumber temperatures peaked 3 d following 4 February (Fig. 1) at
(Holothuria atra) was the most common across both la- which time the first signs of coral bleaching were anecdo-
goon sites (1.2 ± 0.2 individuals m−2 ). Second in abundance tally observed within the study area and in other areas of
was the Herrmann’s sea cucumber (Stichopus herrmanni) the Heron lagoon. Over the course of the study period a
(0.4 ± 0.1 individuals m−2 ). Other notable invertebrates in- total of 3.59 DHWs were accumulated. In the periods be-
cluded Linckia sea stars (Linckia guildingia, Linckia laevi- fore and after the accumulation of heat stress (1 Febru-
gata) and white-speckled sea hares (Aplysia argus) (all found ary 2020), lagoon site 1 mean temperatures were 28.1 ± 1.4
in abundances < 0.1 individuals m−2 ). The largest mobile and 29.0 ± 1.5 ◦ C, respectively, and lagoon site 2 mean tem-
invertebrates observed were Bailer Shell snails (Melo am- peratures were 28.0 ± 1.3 and 29.1 ± 1.5 ◦ C, respectively.
phora) at 30 cm in length and white-spotted hermit crabs Further details on recorded light and temperature data can
(Dardanus megistos) occupying Bailer shells (< 0.1 individ- be found in the Supplement (Table S5).
uals m−2 ).
Our observations included eight species with a conserva- 3.3 Lagoon community bleaching extent
tion status of near threatened or higher, including the small
giant clam Tridacna maxima, Herrmann’s sea cucumber (Sti- Dark-adapted yield was 0.662 ± 0.010 for Acropora
chopus herrmanni), and six coral species (Porites attenu- spp. fragments and 0.576 ± 0.020 for “Other” fragments
ata, Acropora secale, Isopora palifera, Stylophora pistillata, (mean ± SE, n = 35) on 4 February. On 9 February, yield
Favites halicora, Favites rotundata). Notably, our observa- declined 35 % for Acropora spp. to 0.430 ± 0.014 (n = 15)
tion of the aglajid slug Tubulophilinopsis gardineri is one of and 25 % for “Other” fragments to 0.434 ± 0.018 (n = 20).
just five from Heron Island, representing the southernmost Symbiodiniaceae densities were 0.976 ± 0.135 × 106 cm−2
limit of its eastern coast distribution. We also observed an un- for Acropora spp. (n = 15) and 0.507 ± 0.160 × 106 cm−2
described nudibranch species, a yellow-brown Gymnodoris. for “Other” fragments (n = 10) on 30 January. On 12 Febru-
A complete list of all species described can be found in the ary, Acropora spp. densities had declined by 48 % to
Supplement (Table S8). 0.504 ± 0.0849 × 106 cm−2 (n = 15) and by 18 % for
“Other” fragments to 0.414 ± 0.094 × 106 cm−2 (n = 15)
3.2 Lagoon light and temperature (Fig. 3).
Altogether, the percentage of coral tissue exhibiting
Temperature across lagoon site 1 exhibited a mean value bleaching increased from 0 % to 60 ± 11 % over the course of
of 28.6 ± 1.5 ◦ C and varied between a minimum of 25.8 ◦ C the three photo-quadrat survey efforts (Table 3; Fig. S1). Reef
and a maximum of 34.8 ◦ C (Table 2). Light at lagoon site 1 sediment was found to exhibit increased growth of green and
https://doi.org/10.5194/bg-19-891-2022 Biogeosciences, 19, 891–906, 2022898 C. A. Lantz et al.: Will daytime community calcification reflect reef accretion on future reefs
Table 2. Mean values for physiochemical parameters measured at lagoon site 1 and lagoon site 2 over the course of the study. Temperature and
light were logged continuously at 15 min intervals. Temperature data are separated by the pre-bleaching period (22 January–1 February 2020)
and bleaching period (2–10 February 2020). Salinity was measured with each collected water sample (n = 60 per site). Depth was measured
at peak low tide at 5 m intervals along each transect (n = 120 per site). The flow meter was rotated between downstream water sample
collection locations on each day of collection (n = 5 per site).
Parameter Lagoon site 1 Lagoon site 2 Mean
Temperature (◦ C) 28.1 ± 1.3 28.0 ± 1.3 28.0 ± 1.3
Pre-bleaching
Temperature (◦ C) 29.0 ± 1.5 29.1 ± 1.5 29.1 ± 1.5
Bleaching
Salinity (PSU) 35.6 ± 0.2 35.7 ± 0.2 35.7 ± 0.2
Light (µmol m−2 s−1 ) 328 ± 247 336 ± 254 332 ± 251
Depth (cm) 37 ± 7 36 ± 6 37 ± 7
Flow (cm s−1 ) 21.6 ± 2.9 19.2 ± 3.8 20.4 ± 3.3
red microbial biofilms, which grew in cover from 2 ± 1 % pooled together to represent the overall NEC of each area
to 12 ± 4 %. Coral bleaching observed during the study pe- (Table 4). Measured NEC was also highly variable and did
riod was confirmed by PAM fluorometry (dark-adapted yield; not significantly differ over time at lagoon site 1 (p = 0.506),
Fv /Fm ) and Symbiodiniaceae densities (cells × 106 cm−2 ) lagoon site 2 (p = 0.365), and the slack water (p = 0.073).
measured during observed bleaching (Table S6). Estimated NEC in the slack-water approach was significantly
lower compared to Eulerian estimates at lagoon site 1 (p =
3.4 Lagoon community metabolism 0.010) and lagoon site 2 (p = 0.001); these two latter sites
did not significantly differ (p = 0.666). Changes in NEC
The mean ± SD value of NEP and NEC at lagoon site 1 and were significantly related to changes in NEP at both lagoon
lagoon site 2 (pooled together across triplicate transects and site 1 (r 2 = 0.32; p = 0.042) and lagoon site 2 (r 2 = 0.28;
measurement days; n = 36) is displayed in Table 4 and Fig. 3 p = 0.046). Slope values for daytime NEC vs. NEP for la-
and separated by the pre-bleaching (22 January to 1 Febru- goon sites 1 and 2 were 0.28 and 0.24, respectively (Fig. S2).
ary 2020) and bleaching periods (2 to 10 February 2020). To determine potential effects of bleaching on nighttime
Mean daytime net ecosystem production (NEP), averaged dissolution and respiration, nighttime estimates of NEC and
across all days and sites, was 39.4 ± 12.2 mmol O2 m−2 h−1 . NEP were conducted three times throughout the study near
NEP did not significantly differ across triplicate transects the dates of observed progressed bleaching (23 January,
within lagoon site 1 (p = 0.471) or lagoon site 2 (p = 4 and 12 February). However, AT and DO changes were
0.917), so these data were pooled together to represent the too small during lagoon site 1 and lagoon site 2 Eulerian
overall community NEP of each site (Fig. 3). The measured estimates, so nighttime NEC could only be confidently cal-
NEP throughout the study period was highly variable and culated from slack-water estimates. We found mean slack-
did not significantly differ over time (n = 12) at either la- water nighttime NEC (−3.1 ± 1.1 mmol CaCO3 m−2 h−1 )
goon site 1 (p = 0.181) (lowest coral cover site) or lagoon did not significantly differ across transects (p = 0.617) or
site 2 (p = 0.099) (highest coral cover site). NEP did not over time (p = 0.083) within the current study.
significantly differ between lagoon site 1 and lagoon site 2
(p = 0.067). NEP values were not included for the slack-
water approach given the large source of error in air–sea oxy- 4 Discussion
gen exchange.
Mean daytime NEC, averaged across all days and sites, 4.1 Community metabolism response to bleaching
was 12.2 ± 4.5 mmol CaCO3 m−2 h−1 . Measured rates of
daytime NEC did not significantly differ across triplicate The southwestern lagoon area of Heron Island (southern
transects within lagoon site 1 (p = 0.471), lagoon site 2 (p = Great Barrier Reef) is a community characterized by low
0.917) or the slack water (p = 0.581), so these data were coral cover of approximately 5 %–8 %. Within this reef area,
Biogeosciences, 19, 891–906, 2022 https://doi.org/10.5194/bg-19-891-2022C. A. Lantz et al.: Will daytime community calcification reflect reef accretion on future reefs 899
Table 3. Change in the relative percent area (mean ± SD) of coral tissue exhibiting paling or bleaching (bleached coral tissue) and relative
percent area (mean ± SD) of sediment exhibiting overgrowth in the form of visible cyanobacteria mats or Chlorophyta growth (overgrowth
on sediment) over the course of three different survey efforts. Data for each date are pooled across parallel transects within each lagoon
site (n = 120 per site).
Study site 24 Jan 2020 6 Feb 2020 12 Feb 2020
Bleached Lagoon site 1 0±0% 16 ± 3 % 55 ± 8 %
coral tissue Lagoon site 2 0±0% 24 ± 6 % 65 ± 10 %
Overgrowth Lagoon site 1 2±1% 4±2% 10 ± 2 %
on sediment Lagoon site 2 3±1% 5±3% 14 ± 5 %
Table 4. Mean ± SD values for daytime net ecosystem production (NEP; mmol O2 m−2 h−1 ) and net ecosystem calcification (NEC;
mmol CaCO3 m−2 h−1 ) for lagoon site 1 and lagoon site 2, where the Eulerian approach was used (n = 12). NEC for the slack-water
approach included for daytime (n = 11) and nighttime (n = 3) estimates. Data are separated by the pre-bleaching period (22 January–
1 February 2020) and bleaching period (2–10 February 2020; n = 8). Nighttime rates for NEC are included. NEP values are not included for
the slack-water approach given the large source of error in air–sea oxygen exchange.
Approach NEP (mmol O2 m−2 h−1 ) NEC (mmol CaCO3 m−2 h−1 )
Pre-bleaching Bleaching Pre-bleaching Bleaching period
Lagoon site 1 35.0 ± 12.7 39.7 ± 9.6 12.5 ± 4.5 12.6 ± 4.8
Lagoon site 2 44.4 ± 13.6 38.7 ± 13.8 13.3 ± 5.7 12.3 ± 5.4
Slack water (day) 11.0 ± 2.9 10.5 ± 3.0
Slack water (night) −2.8 ± 0.7 −3.4 ± 1.3
the predominant benthic cover was unpalatable algae (ap- NEP and NEC at both lagoon sites did not significantly dif-
proximately 21 %), dominated by the two genera Laurencia fer from estimates during the pre-bleaching period or prior
spp. and Lobophora spp., consistent with that of a degraded estimates on other Great Barrier Reef lagoon communities
coral habitat (Hughes et al., 1999). Prior surveys of the ben- of similar coral cover (e.g., 10–20 mmol CaCO3 m−2 h−1 ;
thic cover in this area of the Heron Island lagoon (scientific Albright et al., 2015; Pisapia et al., 2019; Stoltenberg et al.,
zone) have also estimated relatively low coral cover (0 %– 2021). The lack of a bleaching effect was also mirrored in the
10 %; Roelfsema et al., 2018). slack-water NEP and NEC data, which represented a much
Accumulation of heat stress in the lagoon over the study larger cross section of the lagoon community (∼ 2–3 km tran-
period resulted in 3.59 DHWs as in situ mean temperature sects), where bleaching was also observed (but not quanti-
was elevated from ∼ 28.0 to ∼ 29.1 ◦ C (+1.1 ◦ C). Over this fied during this study period). Importantly, these trends dif-
period, we found that approximately 60 % of corals present fer from those observed by Courtney et al. (2018) during a
within both lagoon sites 1 and 2 exhibited bleaching. These 2015 bleaching event in Kaneohe Bay, Hawaii (∼ 10 % total
bleaching observations were corroborated by both photosyn- cover), where a similar ∼ 1 ◦ C increase in mean reef tem-
thetic yields and Symbiodiniaceae densities of all corals sam- perature resulted in bleaching of 46 % of the coral commu-
pled. Photosynthetic yields recorded on 4 February 2020 in nity, and both NEP and NEC were driven to zero. However,
both the Acropora spp. and “Other” category were barely our results support those of Kayanne et al. (2005), in which
above values considered “healthy” (0.5; Gierz et al., 2020) NEC and NEP remained relatively constant during a bleach-
and, by 9 February 2020, exhibited symbiont loss with values ing event (29 ◦ C; 51 % bleached) in September of 1998 at
below 0.5 (Acro = 0.43 ± 0.01; other = Acro = 0.43 ± 0.01). Shiraho Reef in Japan (5 %–7 % total coral cover). The criti-
Mean Symbiodiniaceae densities across both time points cal difference between these studies is likely due to a thresh-
for the Acropora spp. (0.74 ± 0.11 × 106 cm−2 ) and “Other” old in total coral cover, in which bleaching is less impactful
corals (0.46 ± 0.13 × 106 cm−2 ) were also below normally on NEC when coral is not the dominant calcifying organism
healthy values previously recorded in both Acropora spp. (1– relative to the other calcifying constituents (sediments, rub-
2 × 106 cm−2 , Gierz et al., 2020) and corals in the “Other” ble, calcifying algae, and other sessile or mobile gastropods
category (e.g., Montipora digitata; 2–3 × 106 cm−2 ; Klueter and echinoderms) that are also known to contribute to the
et al., 2006) collected from the Heron Island reef flat. total reef carbonate budget and, in some cases, exhibit posi-
Despite the ongoing reef-wide bleaching event and mea- tive temperature–calcification relationships (Cornwall et al.,
sured decline in coral endosymbiont densities, we find that 2019).
https://doi.org/10.5194/bg-19-891-2022 Biogeosciences, 19, 891–906, 2022900 C. A. Lantz et al.: Will daytime community calcification reflect reef accretion on future reefs
all other benthic constituents that were actively calcifying
regardless of the sea surface temperature (SST) conditions
(Sediment + CCA + Halimeda = 72 %).
One possible explanation for the lack of any observed
changes in NEC could be due to the simultaneous thermal
enhancement of calcification in other benthic members when
the reef seawater was warmed from 28.0 to 29.1 ◦ C. To in-
vestigate the relative contribution to overall NEC from the
assemblage of benthic calcifiers at these respective tempera-
tures, we created an equation based on reported rates in the
literature at 28.0 and 29.1 ◦ C (Eq. 1) at which the summed
community-level calcification rate (NEC) at the respective
temperature (T ) is equal to the sum of the described calcifi-
cation rates for each benthic organism category (net organism
calcification: NOC) multiplied by the recorded cover (Cover)
across lagoon sites 1 and 2 at that temperature (T ).
X
NECT = (NOCT × CoverT ) (5)
To estimate the potential effect of a +1.1 ◦ C change in
seawater temperature on coral calcification for corals ob-
served within the lagoon study sites, the following aquaria
manipulation studies were reviewed: Edmunds (2005), An-
thony et al. (2008), Cantin et al. (2010), and Comeau et
al. (2013, 2016); the following meta-analysis and mod-
eling studies were reviewed: Lough and Barnes (2000),
McNeil et al. (2004), Evenhuis et al. (2015), Kornder et
al. (2018), and Bove et al. (2020). Together, these stud-
ies suggest that mean calcification rates across coral gen-
era most common to the Heron reef flat (Acropora spp.,
Montipora spp., Porites spp., Pocillopora spp.) at 28.0 ◦ C
(4.53 ± 2.31 mmol CaCO3 m−2 h−1 ) increase by approxi-
Figure 2. Cross section of coral, algal, and invertebrate diversity mately 22 % when warmed to a temperature of 29.1 ◦ C. It
observed within the study area. (a) Dipsastraea sp.; (b) Stylophora is important to note this percentage increase is highly vari-
pistillata; (c) Montipora digitata; (d) Sarcophyton sp.; (e) Acropora able and species specific, so numbers used here are sim-
sp.; (f) Pocillopora sp.; (g) Platygyra sp.; (h) Acropora secale; (i)
ply for the purpose of discussion. In comparison, calci-
Porites attenuata; (j) Halimeda sp.; (k) Holothuria atra; (l) Dard-
anus megistos; (m) Trapezia serenei; (n) assemblage of Caulerpa
fication by crustose coralline algae (CCA), which is the
sp. and Laurencia sp. algae covered in scum sp.; (o) Linckia lae- next most studied organism (see meta-analysis by Corn-
vigata; (p) Stichopus herrmanni; (q) Melo amphora; (r) Tridacna wall et al., 2019), has not exhibited changes until tem-
maxima. peratures are as high as 5 ◦ C above ambient temperatures.
Therefore, no change was estimated for mean reported rates
(0.36 ± 0.09 mmol CaCO3 m−2 h−1 ) for commonly studied
4.2 Estimated organism contribution to NEC at CCA species (Lithophyllum kotschyanum and Hydrolithon
elevated temperatures onkodes).
Responses in calcification to warming for Halimeda algae
Importantly, if we consider that rubble observed in lagoon are equivocal (Campbell et al., 2016; Wei et al., 2020). If con-
sites 1 and 2 (approximate cover of 4 %) was predomi- strained to species commonly identified on the Great Barrier
nately covered in crustose coralline algae (CCA) and com- Reef (such as H. opuntia and H. cylindracea; Anon, 2020),
bine these with the other sessile calcifiers observed (which then it can be expected that increasing temperatures will
were predominantly Halimeda spp.; 3 % cover), then her- increase rates of calcification up to temperatures of 30 ◦ C;
matypic corals were not the dominant reef calcifier. Fur- above that they bleach and exhibit a negative calcification re-
ther, if 60 % of the total coral cover was calcifying roughly sponse. As such, narrowed within the ranges observed during
60 % slower due to bleaching (D’Olivo and McCulloch, this study, calcification rates of Halimeda (3.33 ± 2.29 mmol
2017), this would imply that active calcifying coral cover CaCO3 m−2 h−1 ) are estimated to increase by approximately
was likely reduced to only 2 %–4 %. This adjusted “calcify- 7.9 % in response to warming from 28.0 to 29.1 ◦ C. Cal-
ing percent coral cover” is minor compared to the sum of cification responses to warming in carbonate sediments are
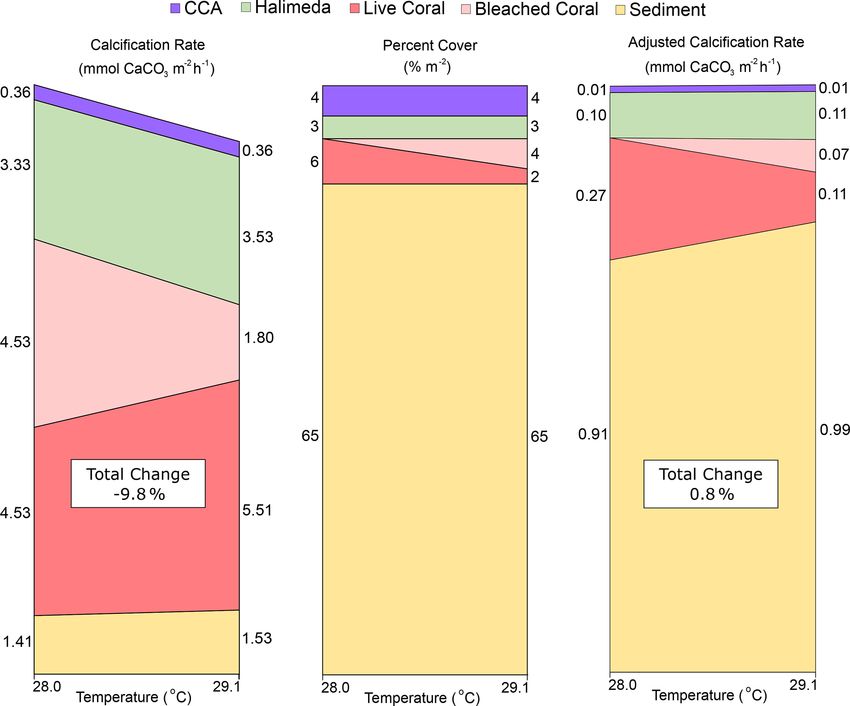
Biogeosciences, 19, 891–906, 2022 https://doi.org/10.5194/bg-19-891-2022C. A. Lantz et al.: Will daytime community calcification reflect reef accretion on future reefs 901 Figure 3. Dark-adapted yield (yellow; top left), Symbiodiniaceae densities (green; top right), rates of net ecosystem production (NEP; mid- dle), and net ecosystem calcification (NEC; bottom) at lagoon site 1 (gray), lagoon site 2 (black), and the larger reef area (dashed; slack water). Dashed yellow and green lines indicate expected healthy values for dark-adapted yield and Symbiodiniaceae densities, respectively. Vertical gray lines indicate the date of photo-quadrat surveys and the resulting percent area of coral that was bleached. NEP and NEC estimates were paused between 26 January and 3 February due to low tides occurring at dawn and dusk in low light conditions, preventing estimates of NEC. Slack-water estimates are excluded from the NEP data given the large error associated with air–sea gas exchange corrections. overall the least studied of the benthic categories in this in NEC during reef-wide coral bleaching. These estimates il- study but potentially the most significant given the domi- lustrate how the decline in coral calcification may be over- nant cover of sediment. A study within the Heron Island la- shadowed by thermal acceleration in calcification in aher- goon indicates that daytime sediment calcification at 28 ◦ C matypic benthic calcifiers. Although some of these calcifiers (1.41 ± 0.29 mmol CaCO3 m−2 h−1 ) would increase ∼ 9 % still accrete limestone structure (e.g., coralline algae), none when seawater is warmed to 29.1 ◦ C (Lantz et al., 2017). replace the complex, three-dimensional structure uniquely When these trends are summed together with the expected created by corals. Our findings highlight the need to better 60 % decline in calcification for the proportion of coral that adjust how NEC is applied as a metric for community func- was bleached, a collective 9.8 % decline in NEC can be ex- tion during bleaching events as these data suggest warming pected (Fig. 4). However, when each category is adjusted for may create a divergence between estimated daytime NEC the percent cover observed at the end of the study at 29.1 ◦ C and actual reef growth on future degraded reef ecosystems. across both lagoon sites, the total change in NEC increases by ∼ 0.8 %. This is largely owed to positive trends in the cal- cification of other benthic community members and provides an explanation why no significant differences were observed https://doi.org/10.5194/bg-19-891-2022 Biogeosciences, 19, 891–906, 2022
902                             C. A. Lantz et al.: Will daytime community calcification reflect reef accretion on future reefs

Figure 4. Visualization of the changes caused by a transition from pre-bleaching (28.0 ◦ C) to bleaching (29.1 ◦ C) temperatures in (a) esti-
mated individual organism calcification rates from the literature (converted to mmol CaCO3 m−2 h−1 ), (b) percent cover across lagoon site 1
and lagoon site 2 combined, and (c) the “adjusted calcification rate” (mmol CaCO3 m−2 h−1 ) calculated by multiplying (a) by (b) at each
temperature. Total change (%) represents the percent difference in the sum of all rates at 29.1 ◦ C relative to 28 ◦ C. Rubble and other calcifier
categories were assumed to be CCA and Halimeda spp., respectively.

4.3   Future considerations                                                representation of reef health given that not all reefs are easily
                                                                           accessible at night for such measurements.
Our study highlights three considerations that may affect                     Secondly the longer-term changes in NEC (when bleached
NEC and need to be further investigated to resolve monitor-                coral eventually dies or the thermal benefits to other calci-
ing issues for degraded coral reef communities. First is the               fiers expire) need to be investigated if we are to accurately
impact of nighttime dissolution on overall 24 h NEC. Esti-                 estimate community function in future reef scenarios. In the
mates of NEC at night (n = 3) in the current study did not                 current study we did not monitor the response in NEC fol-
exhibit a response to bleaching, but a higher frequency is                 lowing the 2020 bleaching event when a return to 28 ◦ C or
needed. Courtney et al. (2018) hypothesized that the dissolu-              lower would likely reduce the thermal benefits to daytime
tion signal was a major driver of the net 24 h zero NEC signal             calcification in the sediment, rubble, live coral, and Hal-
during bleaching. These findings were more recently corrob-                imeda algae that potentially masked the minimized contribu-
orated at the organism level by Orte et al. (2021), in which al-           tion from bleached coral. Under these assumptions, a 7.6 %
gal turfs on dead coral calcified at the same rate as coral dur-           decline in NEC would be expected when temperatures return
ing the day but transitioned to net dissolving at night. This is           to 28 ◦ C. Additionally, if we assume the bleached coral even-
supported by calcification responses to warming in the sedi-               tually dies, and a 60 % reduction to calcification increases to
ment, the most dominant benthic member in this study, where                a 100 % reduction, then community NEC would in theory ex-
warming-driven daytime increases in NEC were largely over-                 hibit a 13.1 % total decline. These post-bleaching estimates
shadowed by nighttime increases in dissolution (Lantz et al.,              may explain the differences between this study and post-
2017), and the sediments transitioned to net dissolving over               bleaching NEC estimates reported on similarly degraded reef
the full 24 h. These results suggest that future studies need to           transects at Lizard Island, Australia (3 % coral cover), by
include nighttime measurements of NEC and NOC but also                     McMahon et al., 2019. At Lizard Island, post-bleaching NEC
highlight the limitation of flow-metabolism approaches as a

Biogeosciences, 19, 891–906, 2022                                                                 https://doi.org/10.5194/bg-19-891-2022
C. A. Lantz et al.: Will daytime community calcification reflect reef accretion on future reefs 903
in 2016 declined by 40 %–46 % relative to pre-bleaching es- monitoring the effect of bleaching on reef accretion in real
timates in 2008 when coral cover was higher (∼ 8 % coral). time. These results, in conjunction with available literature
Finally, the indirect feedbacks on NOC from non- on the importance of nighttime dissolution, suggest that flow-
calcifying community members (e.g., algae) and metabolism approaches to estimate community health may
the carbonate substrate they occupy also need to be limited to reefs accessible at night (e.g., those near a re-
be considered to predict future reef growth (Orte search station or without navigational hazards). Moreover,
et al., 2021). The sum of adjusted NOC (Fig. 4; our study highlights that if coral cover continues to decline
1.30 mmol CaCO3 m−2 h−1 ) only explains 10.6 % of as predicted, NEC may no longer be an appropriate proxy
the measured NEC (12.3 mmol CaCO3 m−2 h−1 ). Such for reef accretion as the proportion of the NEC signal owed
discrepancies may be explained by the exclusion of the to ahermatypic calcification increases. Additional estimates
21 % of space occupied by non-calcifying algae in the of NEC during bleaching events are urgently needed to fur-
NOC summation exercise in Fig. 4. It is possible algae can ther explore the potential decoupling of positive NEC and
provide positive feedback mechanisms to coral calcification reef growth. Concerningly, the data herein suggest that NEC
through adjacent algal-driven NEP (and subsequent modi- may begin to exhibit limitations as a monitoring tool for reef
fications to the surrounding seawater carbonate chemistry; growth when coral becomes the minority benthic constituent.
Gattuso et al., 1998; Unsworth et al., 2012) or the endolithic
micro-calcifiers living inside the dead carbonate substrate
colonized by algal communities (Orte et al., 2021). For Data availability. Data are presently being submit-
example, endolithic microflora (Cyanophyta and Chloro- ted to the Figshare data repository under the DOI
phyta) living within carbonate rocks have been found to https://doi.org/10.6084/m9.figshare.18733019 (Lantz et al.,
modify interstitial pH just beneath the substrate surface to 2022).
values as high as 8.5 (Reyes-Nivia et al., 2013), thereby
creating localized zones supersaturated with aqueous Ca2+
Supplement. The supplement related to this article is available on-
and CO2− 3 ions (Krause et al., 2019) and promoting the line at: https://doi.org/10.5194/bg-19-891-2022-supplement.
inorganic precipitation of minerals such as brucite, micrite,
and dolomite. Critically, these microfloral communities
are more diverse and abundant when living beneath turf
Author contributions. CAL is responsible for study design, data
algae compared to corals (Gutiérrez-Isaza et al., 2015), are collection, analysis, and writing. WL and TDS are responsible for
comparable in their productivity to overlying turf algae study design, data analysis, and writing. JLB, AF, CP, and TM are
(Tribollet et al., 2006), and have been found to precipitate responsible for data collection, analysis, and writing.
dolomite at an accelerated rate when seawater temperatures
were increased from 28 to 30 ◦ C (Diaz-Pulido et al., 2014).
Taken together, this shows that these microfloral communi- Competing interests. The contact author has declared that they or
ties have the capacity to influence bulk seawater chemistry their co-authors have competing interests as specified in the infor-
measurements particularly during coral bleaching events, mation for the associate editor (cover letter).
when warm and well-lit conditions promote their growth.
In addition to these microflora, various cryptic infaunal and
endolithic macrofauna calcify to produce protective shells Disclaimer. Publisher’s note: Copernicus Publications remains
or burrows (e.g., Díaz-Castañeda et al., 2019) and may neutral with regard to jurisdictional claims in published maps and
also be contributing to the NEC signal measured during the institutional affiliations.
bleaching event.
Acknowledgements. This work was funded by the Australian Re-
search Council DP 180103199. We thank the Heron Island Re-
5 Conclusions search Station scientific staff for their support during research. We
also thank all iNaturalist users that helped identify the invertebrates
Ocean warming and subsequent coral bleaching events have photographed during this study, especially Joe Rowlett, Sean Ono,
already degraded coral reef ecosystems for over four decades Frédéric Ducarme, and Pierre Mascar.
and will continue to degrade coral reefs worldwide, reduc-
ing their capacity to provide a complex, three-dimensional
habitat structure. While estimates of NEC via the alkalin- Financial support. This research has been supported by the Aus-
ity anomaly technique may be an appropriate benchmark tralian Research Council (grant no. DP 180103199).
of community function well after bleaching events have oc-
curred and degradation to the coral community is fully re-
alized, the results from this study highlight the shortcom- Review statement. This paper was edited by Jean-Pierre Gattuso
ings of using this approach to estimate daytime NEC when and reviewed by three anonymous referees.
https://doi.org/10.5194/bg-19-891-2022 Biogeosciences, 19, 891–906, 2022You can also read