Renewable Portfolio Standard Assessment for Alaska's Railbelt
←
→
Page content transcription
If your browser does not render page correctly, please read the page content below

Renewable Portfolio Standard
        Assessment for Alaska’s Railbelt
        Paul Denholm, Marty Schwarz, Elise DeGeorge,
        Sherry Stout, and Nathan Wiltse

NREL is a national laboratory of the U.S. Department of Energy           Technical Report
Office of Energy Efficiency & Renewable Energy                           NREL/TP-5700-81698
Operated by the Alliance for Sustainable Energy, LLC                     February 2022
This report is available at no cost from the National Renewable Energy
Laboratory (NREL) at www.nrel.gov/publications.

Contract No. DE-AC36-08GO28308
Renewable Portfolio Standard
       Assessment for Alaska’s Railbelt
       Paul Denholm, Marty Schwarz, Elise DeGeorge,
       Sherry Stout, and Nathan Wiltse

       Suggested Citation
       Denholm, Paul, Marty Schwarz, Elise DeGeorge, Sherry Stout, and Nathan Wiltse. 2022.
       Renewable Portfolio Standard Assessment for Alaska’s Railbelt. Golden, CO: National
       Renewable Energy Laboratory. NREL/TP-5700-81698.
       https://www.nrel.gov/docs/fy22osti/81698.pdf.

NREL is a national laboratory of the U.S. Department of Energy           Technical Report
Office of Energy Efficiency & Renewable Energy                           NREL/TP-5700-81698
Operated by the Alliance for Sustainable Energy, LLC                     February 2022
This report is available at no cost from the National Renewable Energy   National Renewable Energy Laboratory
Laboratory (NREL) at www.nrel.gov/publications.                          15013 Denver West Parkway
                                                                         Golden, CO 80401
Contract No. DE-AC36-08GO28308                                           303-275-3000 • www.nrel.gov
NOTICE

This work was authored by the National Renewable Energy Laboratory, operated by Alliance for Sustainable
Energy, LLC, for the U.S. Department of Energy (DOE) under Contract No. DE-AC36-08GO28308. Internal funding
was provided by the National Renewable Energy Laboratory. The views expressed herein do not necessarily
represent the views of the DOE or the U.S. Government.

                             This report is available at no cost from the National Renewable
                             Energy Laboratory (NREL) at www.nrel.gov/publications.

                             U.S. Department of Energy (DOE) reports produced after 1991
                             and a growing number of pre-1991 documents are available
                             free via www.OSTI.gov.

Cover Photo by Dennis Schroeder: NREL 51227.

NREL prints on paper that contains recycled content.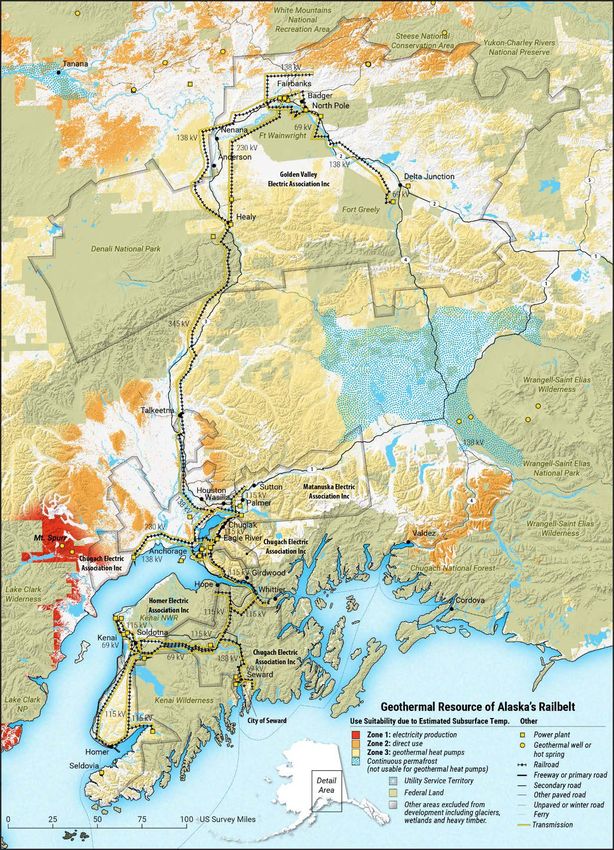
Acknowledgments
This work would not have been possible without the very helpful collaboration, input, and data
provided by numerous stakeholders across Alaska, including (alphabetized):

•   Alaska Energy Authority: David Lockard, Kirk Warren, Conner Erickson, Brian Carey,
    and Josephine Hartley
•   Chugach Electric Association: Arthur Miller, Dustin Highers, Sean Skaling, and Kate Ayers
•   City of Seward Utilities: Rob Montgomery
•   Golden Valley Electric Association: John Burns, John Kelly, Naomi Knight, Corrine Taylor,
    Abbigail Dillard, and the Golden Valley Electric Association Board
•   Homer Electric Association: Mike Salzetti
•   Matanuska Electric Association: Edward Jenkin, Jon Sinclair, Julie Estey, and Erica Wilson
•   Office of the Governor: Jordan Shilling, Tyler Sachtleben
•   Renewable Energy Alaska Project: Chris Rose and Rob Jordan
We would also like to thank (alphabetized by first name):

•   Brian Despard, 1898 & Co.
•   David Burlingame, Electric Power Systems, Inc.
•   Devany Plentovich, Deerstone Consulting
•   Doug Johnson, Ocean Renewable Power Company
•   Erin McKittrick and Hig Higman, Ground Truth Trekking
•   Joel Groves. Polarconsult Alaska, Inc.
•   Matt Perkins and Andrew McDonnell, Alaska Renewables LLC
•   Michael Hubbard, Financial Engineering Company
•   Mike Craft, Alaska Environmental Power
•   Nick Goodman, Cyrq Energy
•   Rob Roys, Launch Alaska
•   Sam Dennis, Renewables IPP
•   Scott Waterman
•   Stephen Trimble, Arctic Solar Ventures
•   Suzanne Settle, Cook Inlet Region, Inc.
The authors would also like to thank the following individuals from the National Renewable
Energy Laboratory for their contributions. Helpful review and comments were provided by
David Hurlbut, Jacquelin Cochran, Gian Porro, Bruno Grunau, Greg Brinkman, Doug Arent, and
Meyer Seligman. Maps were generated by Billy Roberts. Editing was provided by Mike Meshek.

This work was authored by the National Renewable Energy Laboratory, operated by Alliance for
Sustainable Energy, LLC, for the U.S. Department of Energy under Contract No. DE-AC36-
08GO28308. The views expressed in the article do not necessarily represent the views of the
DOE or the U.S. Government. The U.S. Government retains a nonexclusive, paid-up,
irrevocable, worldwide license to publish or reproduce the published form of this work, or allow
others to do so, for U.S. Government purposes.

                                                         iii
This report is available at no cost from the National Renewable Energy Laboratory at www.nrel.gov/publications.
List of Acronyms and Abbreviations
AC                        alternating current
AEA                       Alaska Energy Authority
BESS                      battery energy storage system
CHP                       combined heat and power
CC                        combined cycle
CT                        combustion turbine
DC                        direct current
EIA                       U.S. Energy Information Administration
GVEA                      Golden Valley Electric Association
GWh                       gigawatt-hours
HEA                       Homer Electric Association
HVDC                      high-voltage direct current
IC                        internal combustion
MEA                       Matanuska Energy Association
MMBTU                     million British thermal units
MW                        megawatts
NREL                      National Renewable Energy Laboratory
PM                        particulate matter
PV                        photovoltaics
RPS                       renewable portfolio standard
TWh                       terawatt-hours

                                                         iv
This report is available at no cost from the National Renewable Energy Laboratory at www.nrel.gov/publications.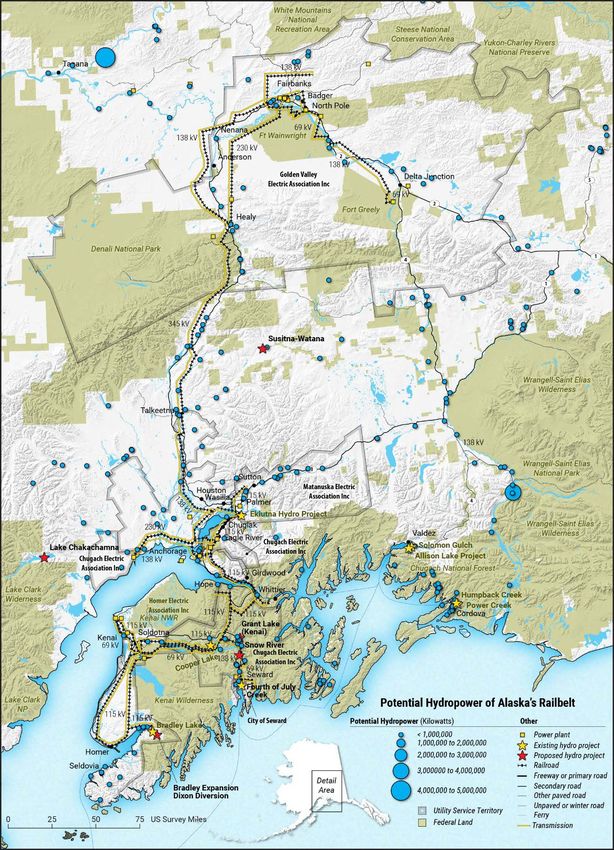
Executive Summary
In December 2021, the Governor of Alaska, Michael Dunleavy, requested support from the
National Renewable Energy Laboratory (NREL) to perform a quick turnaround, preliminary
analysis of the potential impacts of achieving an 80% renewable energy portfolio standard (RPS)
on Alaska’s Railbelt. The Railbelt runs north-south from Fairbanks through Anchorage to the
Kenai Peninsula and represents 75% of Alaska’s electric load. As it is not interconnected to a
larger grid, and it is a winter peaking load, the Railbelt represents a unique electrical system in
the United States.

Due to the quick turnaround time of approximately six weeks, we focused on (1) developing a
set of plausible 80% RPS scenarios, (2) ensuring the envisioned 80% renewable energy systems
could balance load in every hour of the year and provide sufficient operating reserve, and (3)
confirming the dispatch resulted in an 80% renewable energy supply, along with quantifying fuel
savings. Though this limited approach does not definitively identify the optimal RPS portfolio or
provide a comprehensive cost analysis, it can provide insights into the basic techno-economic
feasibility of an 80% RPS. It can also help identify some of the likely elements of such a
portfolio, such as the potential need for new transmission and storage, and the opportunity to
diversify the energy mix to increase resilience to fuel price volatility and reduce reliance on
single fuels. This analysis is a starting point for additional research and consideration of
investment or policy options. Other factors that can inform decision-making are not considered
here.

The analysis includes development of a Base Case scenario that assumes no additional renewable
deployments beyond the planned Bradley Lake Expansion – Dixon Diversion and 25 megawatts
(MW) of small run-of-river hydropower. We then developed five 80% RPS scenarios with
various mixes of renewable energy technologies including solar, wind, hydropower, geothermal,
biomass, landfill gas, and tidal energy. The scenarios include one where hydropower provides
about 65% of annual generation, and one where wind and solar combined provide about 60% of
annual generation.

Each of the scenarios was simulated over a full year of system operation to ensure the demand
for electricity could be met with the available resources, including under conditions of extended
outages of major transmission lines and generation resources. There are two overall findings.

Overall Finding 1: Multiple pathways exist for achieving an 80% RPS while balancing
supply and demand under major outage conditions with appropriate system engineering.

The overarching finding of this analysis is that there are likely multiple pathways to achieving an
80% RPS while maintaining reliable service. All modeled scenarios can achieve 80% renewable
energy while maintaining a balance of supply and demand with no unserved energy or reserve
shortages during normal operations. The system can also serve load under severe outage
conditions in all cases, although the 80% RPS may not be achieved if very long (weeks to
months) outages were to occur on some parts of the grid. This finding depends on the continued
use of best practices and the engineering approaches historically deployed by Alaska’s Railbelt
utilities, particularly regarding the use of state-of-the-art (commercially available) technologies.
Reliable operation was achieved in the model by maintaining a portion of the existing fossil fleet,

                                                         v
This report is available at no cost from the National Renewable Energy Laboratory at www.nrel.gov/publications.
while leveraging the flexibility of hydropower, energy storage, and substantial upgrades to the
Alaska Intertie.

Overall Finding 2: An 80% RPS achieves a substantial reduction in fuel costs, which could
be compared to capital cost expenditures for a comprehensive impact assessment.

Compared to the base case in 2040, an 80% RPS would reduce Alaska’s annual fossil fuel use
by 25–31 trillion BTU. 1 Using a blended fuel price projection of $16.6/MMBTU, this
corresponds to an annual savings of $426 to $506 million. Associated benefits such as fuel price
and customer rate stability, job creation and local air quality were not considered. This savings
will need to be compared to the net change in annualized capital costs of investments in
additional fossil and renewable resources, storage, and transmission needed for either a business-
as-usual path or the 80% RPS. Important next steps could include a comprehensive analysis of
costs and benefits (including resilience) of various scenarios, analysis to support the interim
targets, and engineering analysis of required transmission system upgrades to support
deployment of renewable energy technologies in various locations throughout Alaska’s Railbelt
grid.

This preliminary analysis was conducted to meet an immediate need and was based on the best
information available within timing constraints. NREL used existing data available at the
laboratory, information from the Governor’s Office, as well as data from utilities, the Alaska
Energy Authority, the Renewable Energy Alaska Project and others, where available. The
preliminary analysis covers the service areas of five Alaska Railbelt utilities (alphabetically):

•   Chugach Electric Association
•   City of Seward Electric Department
•   Golden Valley Electric Association
•   Homer Electric Association
•   Matanuska Electric Association.
This analysis only included technology options included in the draft RPS design that was
provided to NREL by the Governor’s office. These resources include biomass, geothermal,
hydropower, landfill gas, solar PV, tidal energy, and wind.

1
 For context, this is the energy equivalent of about 4.3-5.3 million barrels of oil, although most of the energy saved
will likely be in the form of natural gas.

                                                          vi
This report is available at no cost from the National Renewable Energy Laboratory at www.nrel.gov/publications.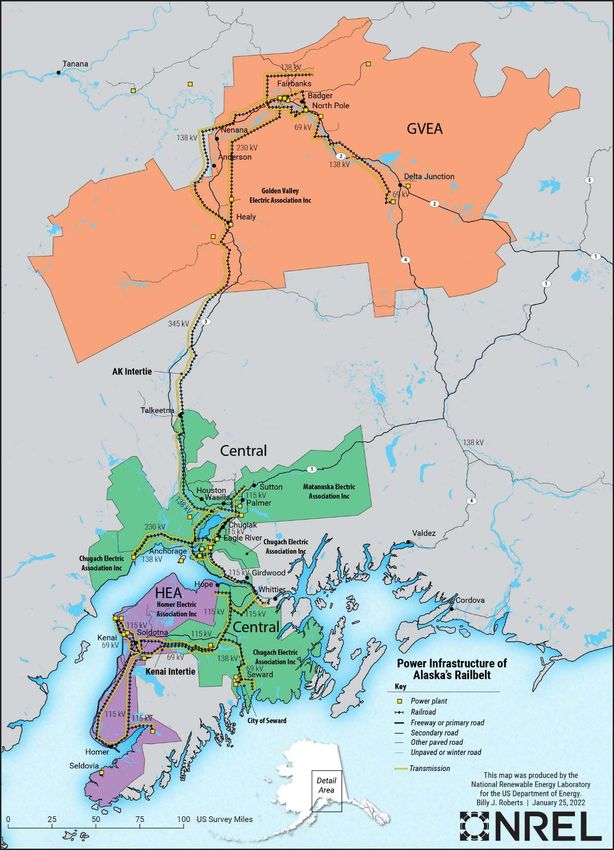
Table of Contents
1     Introduction ........................................................................................................................................... 1
2     Alaska’s Railbelt Power System ......................................................................................................... 3
3     Opportunities for Renewable Electricity in Alaska ........................................................................... 8
4     Methods and Scenarios ..................................................................................................................... 10
      4.1     Study Approach ........................................................................................................................... 10
      4.2     Base Case 2040 Case: No New Renewable Energy .................................................................... 13
      4.3     80% RPS Scenarios ..................................................................................................................... 15
      4.4     Iterative Additions to Provide Resource Adequacy Under Normal and Outage Scenarios ........ 17
5 Findings ............................................................................................................................................... 20
6 Next Steps ........................................................................................................................................... 32
Appendix A. Resource Maps for Alaska’s Railbelt ................................................................................ 33
Appendix B. Performance and Deployment Opportunities by Region along the Alaska Railbelt .... 39
Appendix C. Supplemental Information .................................................................................................. 41

                                                                              vii
This report is available at no cost from the National Renewable Energy Laboratory at www.nrel.gov/publications.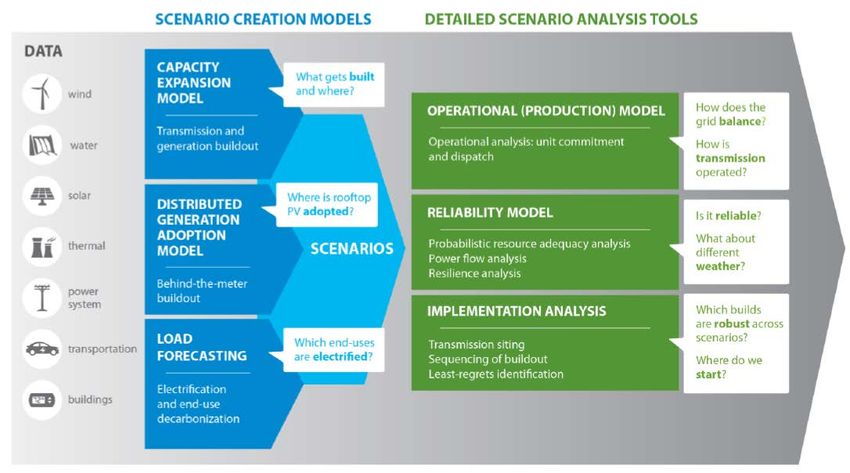
List of Figures
Figure 1. Map of Alaska’s Railbelt power system ........................................................................................ 4
Figure 2. Daily and seasonal generation profiles for 2018 ........................................................................... 6
Figure 3. Wind resources of Alaska’s Railbelt ............................................................................................. 9
Figure 4. Traditional planning process ...................................................................................................... 10
Figure 5. Assumed fuel price trajectories (2020$) ...................................................................................... 14
Figure 6. Stacked bar charts of sources of generation during three hours for the six scenarios ................. 21
Figure 7. System dispatch on the peak demand day in Scenarios 1 (top) and 3 (bottom) .......................... 22
Figure 8. The impact of wind and solar on net load during a four-day period in January .......................... 23
Figure 9. Operation of the Bradley Lake hydroelectric plant ..................................................................... 24
Figure 10. Curtailment and storage use patterns ......................................................................................... 26
Figure 11. Fraction of demand met by wind and solar in the first two months of the year in Scenario 3 .. 27
Figure 12. Flows on the Alaska Intertie ...................................................................................................... 29
Figure 13. Annual fossil generation in 2040 by region............................................................................... 30
Figure 14. Annual fuel savings ................................................................................................................... 30
Figure 15. Conceptual illustration of analysis needed to identify impact on total system costs ................. 31
Figure A-1. Geothermal resources of Alaska’s Railbelt ............................................................................. 33
Figure A-2. Potential hydropower of Alaska’s Railbelt.............................................................................. 34
Figure A-3. Potential pumped storage hydropower of Alaska’s Railbelt ................................................... 35
Figure A-4. Solar PV resources of Alaska’s Railbelt ................................................................................. 36
Figure A-5. Tidal resources of Alaska’s Railbelt........................................................................................ 37
Figure A-6. Wind resource of Alaska’s Railbelt......................................................................................... 38
Figure C-1. Dispatch on peak net demand day ........................................................................................... 42

List of Tables
Table 1. Characteristics of Alaska’s Railbelt Utilities .................................................................................. 3
Table 2. Generation Resource Types for the Utilities in Alaska’s Railbelt (2020 Data) .............................. 7
Table 3. Scenario Targets (% Energy Contribution)................................................................................... 16
Table 4. Final Portfolio: Capacity (MW) .................................................................................................... 19

List of Text Boxes
Text Box 1. Definitions of Types of Renewable Energy .............................................................................. 2
Text Box 2. Capacity- and Energy-Related Terms ....................................................................................... 5
Text Box 3. Key Performance Indicators: The Three Rs ............................................................................ 12

                                                                        viii
This report is available at no cost from the National Renewable Energy Laboratory at www.nrel.gov/publications.
1 Introduction
As of 2020, 30 states had enacted a renewable portfolio standard (RPS), which requires states’
utilities to derive a certain fraction of their total electricity generation from renewable resources.
This report evaluates an 80% RPS, where 80% is defined as the fraction of electricity generated
in Alaska’s Railbelt grid. Based on the current draft RPS design in Alaska, six technologies were
considered: hydropower, solar, wind, tidal energy, geothermal, biomass (including landfill gas). 2
The requirement applies to the Railbelt as a whole, which implies renewable energy certificate
(REC) trading between individual utilities, but not beyond the Railbelt or to other states. We
assume full compliance, and therefore do not consider compliance penalties or other policy
components such as credit banking. 3 The target date for 80% is 2040, and while the draft
proposal includes interim targets, these were not evaluated due to the short project timeline.

In lieu of a more comprehensive analysis required for a full planning study, due to the quick
turnaround time, we focused on (1) developing a set of plausible 80% RPS scenarios, (2)
ensuring the envisioned 80% renewable energy systems could balance load in every hour of the
year and provide sufficient operating reserve, and (3) confirming the dispatch resulted in 80%
renewable energy supply, along with quantifying fuel savings. Section 4 of this report itemizes
the other elements needed for a detailed resource plan.

Each renewable type that is included in the current draft RPS design is defined in Text Box 1.

The draft RPS focuses primarily on the 2040 goal of 80%—rather than lower interim goals—
because of time constraints. And the study aims to provide:

•   A preliminary feasibility analysis of an 80% RPS, considering possible mixes of resources
    that could meet this goal, and a discussion of the elements needed to ensure reliable operation
•   A discussion of possible cost impacts, including the further analysis needed to provide a
    more comprehensive estimate of the costs and benefits of achieving a goal of 80% renewable
    electricity.
The report includes five additional sections:

•   General information about Alaska’s Railbelt power system (Section 2)
•   Opportunities for renewable energy along Alaska’s Railbelt (Section 3)
•   Our model approach, methodology, and scenario assumptions (Section 4)
•   Findings from the model (Section 5)
•   Potential Next steps (Section 6)

2
  Eligible technologies vary by state and region, and often include other approaches, such as energy efficiency, or
renewably derived fuels such as hydrogen.
3
  For addition discussion of RPS design and features see “Renewable Portfolio Standards,” NREL,
https://www.nrel.gov/state-local-tribal/basics-portfolio-standards.html.

                                                          1
This report is available at no cost from the National Renewable Energy Laboratory at www.nrel.gov/publications.
Note that this analysis was conducted to meet an immediate need and was based on the best
information available within timing constraints. It is a starting point for additional research and
consideration of investment or policy options. Other factors that can inform decision-making are
not considered here. The analysis results are not intended to be the sole basis of investment,
policy, or regulatory decisions but are rather intended to understand the technical viability of an
80% RPS.
Text Box 1. Definitions of Types of Renewable Energy
Solar Energy—where energy from the sun is collected for heat to convert it to electricity. For the
purposes of this study, solar energy is assumed be attained using photovoltaic (PV) technology. A
PV cell, or a solar cell, converts sunlight directly into electricity
Wind Energy—where kinetic energy from wind is collected using wind blades, where wind flows
over the blades creating lift, causing the blades to turn. The wind blades are connected to a drive
shaft that turns an electric generator to produce electricity.
Hydropower—where kinetic energy from moving water flows through a penstock and then pushes
against and turns blades in a turbine to spin a generator to produce electricity. Conventional
hydropower facilities are typically either (1) run-of-river facilities where the force of the river’s
current applies pressure on a turbine or (2) storage facilities where water accumulates in reservoirs
created by dams on streams and rivers and is released through turbines to generate electricity.
Biomass—where stored chemical energy from the sun found in organic materials is burned
directly for heat or converted to renewable liquid and gaseous fuels through various processes.
Biomass sources for energy include wood, wood processing wastes, agricultural crops and waste
materials, biogenic materials in municipal solid waste and animal manure, and human sewage For
purposes of this study, this energy source is attained by wood, crops, and landfill materials.
Geothermal—where heat from the Earth is extracted and used for heating and to produce
electricity. Geothermal power plants use both water and heat. This resource is accessed by drilling
wells and piping steam or hot water to the surface, which, in turn powers a turbine that generates
electricity.
Tidal—where kinetic energy from the rise and fall of ocean tides is converted to power, mainly
electricity using a generator. Tides are cyclical and predictable as they are created by the
gravitational effects of the moon and the sun on the Earth
Source: “Energy Explained: Your Guide to Understanding Energy,” EIA,
https://www.eia.gov/energyexplained/.
2
This report is available at no cost from the National Renewable Energy Laboratory at www.nrel.gov/publications.2 Alaska’s Railbelt Power System
This analysis applies to Alaska’s Railbelt power system, which extends from Fairbanks through
Anchorage to the Kenai Peninsula and consists of four electric cooperatives and one municipally
owned (not-for-profit) utility that serve about 75% of Alaska’s electricity (Table 1).
Table 1. Characteristics of Alaska’s Railbelt Utilities
Data are for 2020 and from U.S. Energy Information Administration (EIA) Form 861.a
Annual Sales Customers Fraction of Railbelt
Utility
(GWh) (thousands) Annual Demand (%)
Chugach Electric Associationb 1,945 144 44
Golden Valley Electric Association 1,222 47 28
Matanuska Electric Association 751 67 17
Homer Electric Association 437 33 10
City of Seward Electric Department 52 3 1
Total 4,408 293 100
a “Annual Electric Power Industry Report, Form EIA-861 detailed data files,” EIA,
https://www.eia.gov/electricity/data/eia861/
bCombines data from the Chugach Electric Association and Anchorage Municipal Light & Power which
merged in late 2020.
Figure 1 illustrates Alaska’s Railbelt region. Fairbanks is served by the Golden Valley Electric
Association (GVEA). For the purposes of modeling, we combined the Chugach Electric
Association (serving Anchorage), the Matanuska Energy Association (MEA), and the City of
Seward Electric Department (City of Seward) into a single zone we labeled Central as discussed
in Section 3. The Homer Electric Association (HEA) serves the Kenai Peninsula.
3
This report is available at no cost from the National Renewable Energy Laboratory at www.nrel.gov/publications.Figure 1. Map of Alaska’s Railbelt power system
4
This report is available at no cost from the National Renewable Energy Laboratory at www.nrel.gov/publications.The demand for electricity in
each of these regions varies as Text Box 2. Capacity- and Energy-Related Terms
a function of time of day and Capacity (also “nameplate capacity” or “peak capacity”) generally
season. Figure 2(a) shows refers to the rated output of a power plant when operating at
maximum output. The capacity of individual power plants is
daily load profiles in 2018 for typically measured in kilowatts (kW) or megawatts (MW). The
the Central Region cumulative capacity of systems is often measured in gigawatts
(combining Chugach Electric (GW) or terawatts (TW). Capacity of power plants is typically
Association, MEA and measured by their net AC rating, and we use this standard in this
Seward), GVEA, and HEA in report.
the 4-day period with highest Energy, in this report, refers to electricity generated and used for
(system-wide) annual lighting, appliances, etc. It is typically measured in kilowatt-hours
demand, which occurred (kWh) and represents one kW of power used for an hour.
during the hour ending 7 p.m. Capacity factor (%) is a measure of how much energy is produced
on January 25. Figure 2(b) by a plant compared to its maximum output. It is calculated by
dividing the total energy produced during some period of time by
shows the total system-wide
the amount of energy it would have produced if it ran at full output
demand for this period, as over that period of time.
well as for the periods with
Capacity credit is a measure of the contribution of a power plant to
the lowest demand in October resource adequacy, meaning the ability of a system to reliably
and the highest summer meet demand during all hours of the year. It is measured either in
demand in July. 4 For terms of capacity (kW, MW) or the fraction of its nameplate
clarification, Text Box 2 capacity (%) and indicates the amount or portion of the nameplate
defines capacity versus capacity that is reliably available to meet load during times of
highest system demand—typically the highest net-load hours of
energy. The Railbelt system is the year.
winter-peaking, which is
different from most of the
contiguous United States.
4
Note that the terms generation, load, and demand throughout this document refer to the generation required to
serve the end-use demand, plus transmission losses and internal use. Therefore, numbers will generally be about
7% higher on average when compared to actual sales to end customers. This reflects transmission and
distribution losses.
5
This report is available at no cost from the National Renewable Energy Laboratory at www.nrel.gov/publications.500
450
400
Railbelt Generation (MW)
350
300
250
200
150
100
50
0
1/24/18 12:00 AM 1/25/18 12:00 AM 1/26/18 12:00 AM 1/27/18 12:00 AM 1/28/18 12:00 AM
Central HEA GVEA
Winter peak generation for three modeled utility regions: Central, GVEA, and HEA
800
700
600
Railbelt Generation (MW)
500
400
300
200
100
0
12:00 AM 12:00 PM 12:00 AM 12:00 PM 12:00 AM 12:00 PM 12:00 AM 12:00 PM 12:00 AM
Winter Peak (Jan 24-28) Fall Minimum (October 12-14) Summer Peak (July 31-Aug 3)
(b) Total generation in three periods in Alaska’s Railbelt
Figure 2. Daily and seasonal generation profiles for 2018
All five utilities are electrically interconnected, which allows the utilities to exchange resources
and thus improve the economic operation of the grid. However, the connection between GVEA
and the utilities to the south via the Alaska Intertie is limited; also limited are the connections to
HEA through the Kenai Intertie (see Figure 1, for the location of these interties). Because
transmission outages can occur, these regions can operate largely independently.
6
This report is available at no cost from the National Renewable Energy Laboratory at www.nrel.gov/publications.Because of the need for utilities to operate reliably during failures of these interties, as well as
their relatively small size (which limits the diversity of resources), each utility carries a
significant reserve margin (total capacity compared to peak load). Table 2 summarizes the
system-wide capacity and generation mix in 2020. The combined system capacity of about 1,826
MW, is about 1,075 MW higher than the 2018 peak demand of 751 MW, which equates to a
reserve margin of about 143%. For comparison, North American Electric Reliability
Corporation-recommended reserve margins for (larger and more interconnected) utilities in the
lower 48 states are 13%–17%. 5
Table 2. Generation Resource Types for the Utilities in Alaska’s Railbelt (2020 Data) 6
Capacitya Generation Generation
Generator Type
(MW) (GWh) Fraction
Gas/oil combustion turbine (CT) 754 632 14%
Gas/oil internal combustion (IC) 193 732 16%
Gas/oil combined cycle (CC) 561 1,676 36%
Coal 75 348 8%
Unspecified fossil purchasesb n/a 310 7%
Fossil Subtotal 1,585 3,698 80%
Hydropower 190 815 18%
Wind 44 97 2%
Landfill gas 7 39 1%
Solar 1 13 Opportunities for Renewable Electricity in Alaska
Renewable energy provides several advantages as a source of electricity. Deployment of
renewable energy provides increased price stability in markets that have historically been subject
to significant fuel price variability, as costs are dominated by capital investments and most have
no fuel costs. In addition, some renewable energy resources have lower life-cycle costs than
fossil fuel-generated electricity. According to a comprehensive cost study conducted by the
International Renewable Energy Agency in 2020 which analyzes renewable energy project cost
and auction price data from projects around the globe, renewable power generation costs have
continued to decline coupled with improvements in many areas including, but not limited to,
technologies, economies of scale, supply chain competition, and more. 8 The Land-Based Wind
Market Report, 9 an annual report provided by the Lawrence Berkeley National Laboratory
(LBNL), states that “low power purchase agreement prices have been facilitated by the
combination of higher capacity factors, declining installed costs and operating costs, and low
interest rates.” A similar 2021 technical brief by LBNL on utility-scale solar 10 states that median
installed project costs have steadily fallen at an average of 12% annually since 2010. Other
benefits of renewable energy include local jobs and economic development, as well as improved
local air quality, which is a major concern in several areas of Alaska’s Railbelt that are at, or are
nearing, non-attainment status for fine particulate matter (PM2.5). 11 A renewable portfolio also
allows for a reduction in risk associated with carbon pricing or regulations and affords the
Alaskan Railbelt a higher degree of energy independence.
Figure 3 is a map of the wind resource along Alaska’s Railbelt, shown along an annual average
wind speed gradient. The map, which also shows locations of existing wind energy plants, is
illustrative of what can be found on the resource maps for solar, hydropower, pumped storage
hydropower, geothermal, and tidal energy; see Appendix A for all these maps.
Performance and deployment opportunities for each Alaska Railbelt region are included in
Appendix B.
Study methods and possible renewable energy scenarios to meet an 80% RPS are provided in the
next section.
8
IRENA (International Renewable Energy Agency). 2021. Renewable Power Generation Costs in 2020,
International Renewable Energy Agency, Abu Dhabi.
9
Ryan Wiser, Bolinger, Mark Bolinger, Ben Hoen, Dev Millstein, Joe Rand, Galen Barbose, Naïm Darghouth,
et al., 2021. Land-Based Wind Market Report: 2021 Edition. U.S. Department of Energy Office of Energy
Efficiency and Renewable Energy. DOE/GO-102021-5611. https://www.energy.gov/sites/default/files/2021-
08/Land-Based%20Wind%20Market%20Report%202021%20Edition_Full%20Report_FINAL.pdf.
10
Mark Bolinger, Joachim Seel, Cody Warner, and Dana Robson. 2021. Utility-Scale Solar, 2021 Edition.
https://emp.lbl.gov/sites/default/files/utility-scale_solar_2021_technical_brief.pdf
11
State of Alaska Department of Transportation & Public Facilities, 2020-2023 Statewide Transportation
Improvement Program (STIP), Approved November 23, 2021, Amendment 3 and Incorporated Administrative
Modifications (State of Alaska Department of Transportation and Public Facilities, 2021),
https://dot.alaska.gov/stwdplng/cip/stip/assets/STIP.pdf.
8
This report is available at no cost from the National Renewable Energy Laboratory at www.nrel.gov/publications.Figure 3. Wind resources of Alaska’s Railbelt
9
This report is available at no cost from the National Renewable Energy Laboratory at www.nrel.gov/publications.4 Methods and Scenarios
In a standard planning study, scenarios are developed and analyzed using a multistep process like
the one outlined in Figure 4. The process includes the generation of detailed load forecasts and
distributed resource adoption scenarios, followed by the use of a capacity expansion model to
develop an optimized portfolio that produces a mix of resources with the lowest life-cycle cost.
These scenarios are then analyzed with multiple tools to ensure (1) reliable operation of the
generation and transmissions system and (2) sufficient generation is available to meet demand
under all conditions, including immediately after failures of generation and transmission
equipment. The quick turnaround for this work limited our standard utility planning study
approach to a subset as described below.
This Study
Potential Future Work
Figure 4. Traditional planning process 12
4.1 Study Approach
In lieu of a more comprehensive analysis required for a full planning study, we focused on (1)
developing a set of plausible 80% RPS scenarios, (2) ensuring the envisioned 80% renewable
energy systems could balance load in every hour of the year and provide sufficient operating
reserve, and (3) confirming the dispatch resulted in 80% renewable energy supply, along with
quantifying fuel savings.
12
Gregory Brinkman, Dominique Bain, Grant Buster, Caroline Draxl, Paritosh Das, Jonathan Ho, Eduardo Ibanez,
et al. 2021. The North American Renewable Integration Study: A U.S. Perspective—Executive Summary. Golden,
CO: National Renewable Energy Laboratory. NREL/TP-6A20-79224-ES.
https://www.nrel.gov/docs/fy21osti/79224-ES.pdf.
10
This report is available at no cost from the National Renewable Energy Laboratory at www.nrel.gov/publications.Though this limited approach does not definitively identify the optimal RPS portfolio or provide
a comprehensive cost analysis, it can provide insights into the basic techno-economic feasibility
of an 80% RPS, and it can help identify some of the likely elements of such a portfolio, such as
the potential need for new transmission and storage, and the role of a diverse mix of new
resources.
To perform the analysis, we first developed a set of five 80% renewable energy scenarios,
exploring a range of portfolios that emphasize different technology options. We then evaluated
those scenarios using the PLEXOS production cost model, which is a commercial tool used by
utilities and system operators in the United States. 13 Production cost models simulate the hourly
operation of the generation and transmission system by turning on and off generators and varying
their output to ensure the demand for electricity is met while minimizing system operating cost. 14
These models also optimize the use of storage to balance supply and demand, and they consider
how the system will maintain sufficient operating reserve to address the inherent variability and
uncertainty of both supply and demand, including events such as sudden outages of generators
or transmission and the inability to perfectly forecast the supply of renewable resources. The
carrying capacity of the transmission network is also considered and can be used to demonstrate
the value of transmission upgrades in key regions.
This type of simulation is an iterative process. Initial scenarios may prove infeasible, meaning
the demand for electricity is not always served in all regions. In these cases, the portfolio can be
adjusted, and simulations can be repeated until a reliable mix of resources is identified. Text Box
3 introduces the elements of power system reliability and those considered in this work.
13
For an example study using this tool, see “Interconnections Seam Study,” NREL,
https://www.nrel.gov/analysis/seams.html. Additional model details are available at “PLEXOS,” Energy Exemplar,
https://www.energyexemplar.com/plexos.
14
NREL often evaluates subhourly variability, but insufficient data were available to consider the impact of
increased subhourly variability in this study; instead, we used conservative estimates for operating reserve
requirements needed to address ramp rate requirements within the hour.
11
This report is available at no cost from the National Renewable Energy Laboratory at www.nrel.gov/publications.Text Box 3. Key Performance Indicators: The Three Rs
The primary focus of this work was to develop and evaluate 80% RPS portfolios that reliably serve
customer demand, or more simply stated, keep the lights on. While this goal is often expressed as
“reliability,” it is important to note that reliability involves elements that can be summarized in terms of
the three Rs: resource adequacy, operational reliability, and resilience.
Resource adequacy represents planning for the system's ability to supply enough electricity—at the
right locations—to keep the lights on, even during extreme weather days and when reasonable
outages occur. An adequate system has sufficient spare capacity to replace capacity that fails or is out
of service for maintenance. Increasingly, resource adequacy must account for the variability of
renewable energy supply, the role of storage, and changes in demand patterns. We directly evaluated
resource adequacy was in this study by calculating the reserve capacity available during peak
demand conditions and under transmission outage condition.
Operational reliability enables a system to operate in the seconds during an abnormal event and
minutes after an event. It includes operating reserve and frequency stability, including inertia.
Maintaining operational reliability with growth in inverter-based resources is an important element of
the power sector transition. We considered operational reliability in this study by maintaining adequate
operating reserve that could respond with the necessary speed; however, we did not directly simulate
actual events, such as contingencies are; doing so would require a separate, dedicated analysis. For
this study, we assumed continued growth in the use of fast-responding inverters-based resources
including batteries, which have been used in this role in Alaska for over a decade.
Resilience represents a power system’s ability to withstand and reduce the impact of disruptive
events. Resilience overlaps with the other aspects of reliability; however, one unique aspect of
resilience is related to system recovery—or how quickly power can be restored after an outage. In this
study, we considered resource adequacy and operational reliability by maintaining adequate capacity
(including weather variability) and operating reserve; however, we did not directly measure resilience.
12
This report is available at no cost from the National Renewable Energy Laboratory at www.nrel.gov/publications.4.2 Base Case 2040 Case: No New Renewable Energy
The study began with the development of a power system model of the existing Alaska Railbelt
system that could be used as a reference case (Base case), and this was followed by the
development and evaluation of various 80% portfolios. This Base case system for 2040 assumed
no additional deployment of renewable energy other than 25 MW of small run-of-river
hydropower in the southcentral region and the Bradley Lake Expansion - Dixon Diversion which
we have been informed is in advanced planning stages. Note that there are two Bradley Lake
Expansion—Dixon Diversion options. Both include a diversion of Dixon Glacier runoff and a
dam raise at Bradley Lake, but only the second option considers an additional 63-MW turbine at
the Bradley Lake power station. A third option involves an additional run-of-river power plant at
Martin River, but detailed reports on this option are ongoing so we did not consider it in our
scenarios.
Regional Load
The demand in 2040 was based on the hourly load profiles obtained for each utility for 2018.
This year was chosen in part because it corresponds to the availability of simulated wind
resource data and because it occurred before the impacts of the COVID-19 pandemic on
electricity demand. To account for load growth, these demand profiles were scaled to projected
2040 demand based on population growth estimates. 15 However, we did not consider changes in
load shape resulting from electric vehicle adoption, electrification of heating through heat pump
technologies, other electrification, or changing weather patterns. This scaling resulted in a 2040
annual generation of 5.2 TWh (about a 12% increase compared to 2020) 16 and a peak generation
of 820 MW.
Generation Fleet
We started with each utilities’ existing generation fleet, using capacity and performance based on
utility-provided data and supplemented with public sources. 17 By 2040, many of the thermal
resources will be older than their expected lifetimes, so we retired all thermal units at the age of
approximately 60 years based on historical averages. 18 This resulted in retirements of 427 MW
of capacity. 19 Because of these retirements and load growth, we added fossil capacity to the
generation fleet to the Base Case to meet the reliability criteria discussed in Section 4.4.
15
State of Alaska Department of Labor, 2022, “Alaska Population Projections 2019 to 2045.”
https://live.laborstats.alaska.gov/pop/projections.html.
16
Compared to data from EIA-860.
17
“Form EIA-860 Detailed Data with Previous Form Data (EIA-860A/860B),” EIA,
https://www.eia.gov/electricity/data/eia860/.
“Form EIA-923 Detailed Data with Previous Form Data (EIA-906/920),” EIA,
https://www.eia.gov/electricity/data/eia923/.
18
Andrew Mills, Ryan Wiser, Joachim Seel. 2017. Power Plant Retirements: Trends and Possible Drivers.
Lawrence Berkeley National Laboratory. https://eta-
publications.lbl.gov/sites/default/files/lbnl_retirements_data_synthesis_final.pdf.
19
The larger retirements we assume include Beluga units 1,3, and 5, Healy units 1 and 2, George Sullivan Plant 2
unit 7, Hank Nikkels unit 3, Delta Power, Bernice Lake unit 1, and Chena units 1,2, and 3.
13
This report is available at no cost from the National Renewable Energy Laboratory at www.nrel.gov/publications.We also added the Bradley Lake dam raise—Dixon Diversion which is expected to provide
about 150 annual GWh. We considered a third 63 MW turbine at the Bradley Lake power station
in most of our 80% scenarios, but not the base case.
Fuel Prices
Fuel prices trajectories were derived from projections by the Alaska Energy Authority (Figure 5).
$35
Naptha
$30 Diesel
Natural Gas
Fuel Price ($/MMBTU)
$25 Coal
$20
$15
$10
$5
$0
2020 2025 2030 2035 2040
Year
Figure 5. Assumed fuel price trajectories (2020$)
Transmission
Our model aggregated Alaska’s Railbelt power system into three transmission zones illustrated
in see Figure 1, page 4. Transmission within each modeled zone was unconstrained. Between
each zone, the system model used a limited representation of the current transmission network—
evaluating only the major paths (this assumption applies to both the base case and all 80%
scenarios):
• Alaska Intertie: Runs from Healy to Teeland and is currently rated at about 78 MW of
capacity. We assume that by 2040 it is upgraded to 250 MW and we perform supplemental
analysis where it is increased to over 300 MW of capacity. 20
• Kenai Intertie: Runs from Soldotna to Quartz Creek and is currently rated at about 75 MW
of capacity. We assume upgrades to 100 MW of capacity by 2040 .
No other existing or potential transmission constraints were considered, except where new
renewable capacity was added in the 80% scenarios. In those cases, we assumed interconnections
were sufficient to meet the full output of the new resource into the nearest/appropriate
transmission zone or intertie. Only steady-state thermal limits were evaluated, but dynamics,
20
These values are based on several Alaska transmission studies and correspondence with several utilities.
14
This report is available at no cost from the National Renewable Energy Laboratory at www.nrel.gov/publications.including detailed stability and contingency analysis, were beyond scope of this preliminary
analysis in the time allowed. We assumed average historical transmission and distribution loss
rates which are embedded in the total generation profiles and did not consider how these rates
might vary across the different scenarios.
System Operation and Operating Reserve
The system was simulated assuming system-wide economic unit commitment and dispatch, 21
which essentially resulted in frictionless transactions between utility regions to maximize the
economic and technical efficiency of the power grid. This study did not assume any specific
regulatory approach that might achieve this type of operation. However, multiple approaches
could be taken, including a consolidated balancing area authority or system operator or market-
based approaches. None of these approaches require utilities to merge or otherwise lose
independence to ensure local reliability and rate setting.
We enforced two types of operating reserve. First, the system was assumed to maintain primary
fast responding contingency reserves capable of preventing an under-frequency load shedding
event after the sudden loss of the largest generation or transmission component. We also
maintained a rapid-response regulating reserve, equal to 2% of load, to address short-term
uncertainty. 22
Once this baseline scenario was established, we evaluated it for reliability and further adjusted
the portfolio as described in Section 4.4.
4.3 80% RPS Scenarios
We created five RPS scenarios, each with sufficient generation capacity to meet 80% of annual
generation after considering the deliverability of each renewable resource due to transmission
congestion, losses in storage, and curtailment due to oversupply during periods of high
renewable energy output or low electricity demand. We describe these scenarios briefly in this
section and note that they are not intended to represent definitive or even likely mixes—rather,
they showcase an array of possible pathways.
• Scenario 1: This scenario represents a case where significant new hydropower is developed.
It assumes the characteristics and location of Susitna-Watana to represent this new resource.
In addition, the Dixon Diversion project was added. This includes a dam raise at Bradley
Lake to increase the annual energy budget by 150 GWh, as well as an additional 63 MW
turbine to fill the empty third bay at the existing Bradley Lake power station. Limited
deployment of new wind and solar is required in this scenario.
• Scenario 2: This scenario also assumes significant hydropower development (but less than
Scenario 1). It drops Susitna-Watana but keeps the aforementioned Dixon Diversion project
and adds the proposed Grant Lake and Snow River hydropower projects. The net loss in
hydropower production is replaced with wind and solar.
21
A comprehensive analysis requires running a multistage unit commitment and economic dispatch which helps
account for forecast errors. These data were unavailable; however, the high degree of flexibility in the Alaska
system reduces the importance of modeling day-ahead unit commitment.
22
We would typically perform an estimate of dynamic operating reserve requirements that account for the variability
of wind and solar. Project timeline constraints prevented this, so we used a fixed level.
15
This report is available at no cost from the National Renewable Energy Laboratory at www.nrel.gov/publications.• Scenario 3: This scenario further reduces hydropower production compared to scenario 2 by
adding only the Dixon Diversion project and not Grant Lake or Snow River. Additional wind
and solar is added to make up for the loss in hydropower production.
• Scenario 4: This scenario assumes the same hydropower development as Scenario 3 but
removes some of the wind and solar and replaces it with tidal and geothermal energy.
• Scenario 5: This scenario represents the lowest hydropower development, which is the same
as the Base Case. The only new, large hydropower project is the Bradley Lake dam raise,
which increases its annual energy budget by 150 GWh. A third turbine is not included in this
scenario. Additional tidal and geothermal are also assumed.
All scenarios except Scenario 1 also add 25 MW of small run-of-river hydro in the Central
region, and all scenarios include a 46 MW, 8-hour battery in GVEA, a 46.5 MW 4-hour battery
in Homer, and a 70 MW 4-hour battery in Central. Finally, all scenarios upgrade the thermal
limits of the AK Intertie and Kenai Intertie to 250 MW and 100 MW, respectively (same as the
Base Case).
Table 3 summarizes the targets for the Base case (no new renewable energy) and five 80% RPS
scenarios.
Table 3. Scenario Targets (% Energy Contribution)
Technology
(includes new and Base
existing) Case Scenario 1 Scenario 2 Scenario 3 Scenario 4 Scenario 5
Wind 0% 12% 48% 48% 49% 45%
Solar 0% 1% 7% 12% 4% 3%
Hydropower
(conventional dam
storage) 15% 65% 21% 15% 15% 15%
Hydropower (run-of-
river) 2% 0% 2% 2% 2% 2%
Geothermal 0% 0% 0% 0% 4% 8%
Biomass 0% 1% 2% 2% 2% 2%
Landfill gas 1% 1% 1% 1% 1% 1%
Tidal 0% 0% 0% 0% 3% 5%
Total renewable 19% 80% 80% 80% 80% 80%
Assumptions for the modeling of these resources are summarized below, with additional details
in Appendix C:
Wind: Profiles for hypothetical new wind plants were obtained from Alaska Renewables LLC,
which assume 3.4-MW wind turbines with 100-meter hub heights. 23 Fire Island Wind and Delta
23
See appendix C for additional details
16
This report is available at no cost from the National Renewable Energy Laboratory at www.nrel.gov/publications.Junction Wind were produced by NREL derived using NREL’s renewable energy potential (reV)
tool with NASA data for the year 2018. 24
Solar: We used profiles generated by NREL for 4 locations in Alaska. Three locations use older
resource data which are not time-synchronized with our meteorological year of 2018. The lack of
time-synchronized data for PV is generally not desirable, as it can lead to over or underestimates
of PV output during critical summer peak demand periods. However, the lack of strong summer
peaks in Alaska mitigates this data limitation, and there was no alternative data available in the
timeframe of the study.
Hydropower (conventional dam storage): Monthly water supply for existing hydropower
generators was obtained from EIA-923. For future projects, we used estimated annual water
availability from the Alaska Energy Authority, 25 and this was divided into monthly averages
using projects in the closest area.
Hydropower (run of river): We assumed 25 MW of capacity deployable in the central region. A
single representative hourly profile was applied to all projects. 26
Tidal Energy 27 We assumed up to 75 MW of tidal energy from Cook Inlet is deployable by 2040.
Geothermal: 28 We assumed up to 50 MW of geothermal energy from Mount Spurr is deployable
by 2040.
Biomass: We assumed adequate fuel (wood) for up to a 50 MW plant with a 12,000 BTU/kWh
heat rate. Assumed fuel costs were $9.375/MMBTU.
Landfill gas: We did not consider landfill gas collection expansion and assumed only continued
operation of existing facilities.
4.4 Iterative Additions to Provide Resource Adequacy Under Normal
and Outage Scenarios
Because the power system envisioned in the 80% RPS scenarios rely heavily on the upgraded
Alaska Intertie along with other transmission to access high-quality renewable resources, it
is important to consider the possibility of extended transmission outages. Furthermore, it is
important to consider outages of conventional generators for routine maintenance or unexpected
24
“reV: The Renewable Energy Potential Model,” NREL, https://www.nrel.gov/gis/renewable-energy-
potential.html.
25
AEA memo of Sept 9, 2021, and additional correspondence.
26
Assumption based on conversations with Joel Groves at Polarconsult Alaska. Profiles derived from “Response to
Chugach RFP 21‐23 Providing Conceptual Guidance on ‘Category 2’ Small Hydro Projects”
27
This estimate was derived from conversations with ORPC. For more information, see this report: Kilcher, Levi,
Michelle Fogarty, and Michael Lawson. 2021. Marine Energy in the United
States: An Overview of Opportunities. Golden, CO: National Renewable Energy
Laboratory. NREL/TP-5700-78773. https://www.nrel.gov/docs/fy21osti/78773.pdf.
28
This estimate was derived from conversations with Cyrq Energy. For more information, see this report: WH
Pacific. 2013. Renewable Energy in Alaska. Golden, CO: National Renewable Energy Laboratory. NREL/SR-7A40-
47176. https://www.nrel.gov/docs/fy13osti/47176.pdf.
17
This report is available at no cost from the National Renewable Energy Laboratory at www.nrel.gov/publications.failures. Therefore, we tested each of the six scenarios (the no new renewable energy Base case
and the five 80% renewable energy scenarios) under the following extended outage scenarios,
where system components were unavailable for a several months during all periods of the year,
including winter peak and the summer fire season. We established a criterion where each region
was robust to the combination of three conditions, meaning all three things happen
simultaneously:
• A region is isolated from the other zones for an extended period of time
• The extended loss of a region’s single-largest generation facility (meaning the combined
output of a plant that may have multiple generators)
• Shorter-term loss of additional generators based on an average forced outage rate of 7%.
Specifically, these conditions correspond to the following cases:
• GVEA: Simultaneous loss of Alaska Intertie and the combined North Pole Plant, plus
7% random outage conditions on remaining generators
• Central: Simultaneous loss of both the Alaska Intertie and the Kenia Intertie, plus the entire
Southcentral power project, plus 7% random outage conditions on the remaining generators
• HEA: Simultaneous loss of the Kenai Intertie and Bradley Lake power plant plus 7% random
outage conditions on the remaining generators.
All scenarios, including the base case, assumed planned outages of all Railbelt power plants
according to the 2022 maintenance schedules. 29
We evaluated all scenarios to ensure load was met under these conditions. We did allow for
reserve shortages, particularly as these conditions were already experiencing failures of the
largest single system component, which sets the maximum reserve requirement.
In each case we iteratively added new fossil thermal capacity until all unserved load was
eliminated in each region. We added new simple-cycle gas turbines with performance
characteristics based on an LM6000 aeroderivative gas turbine operating on natural gas. 30 In the
base case we added 447 MW of new capacity (largely in the Central and GVEA regions). In the
RPS Scenarios we added between 223 MW (Scenario 2) and 367 MW (Scenario 1). The
somewhat limited reduction in new fossil capacity in Scenario 1 was due to the assumption that
the system must remain reliable even with the entire large hydropower plant in that scenario on
outage for extended periods of time. The more dispersed and smaller resources in Scenario 2
reduced the amount of fossil capacity needed for resource adequacy under extended outage
conditions. The reduction of new fossil capacity needed in the 80% RPS scenarios compared to
the Base Case (between 80 and 224 MW) was achieved because much of the capacity added,
particularly hydropower, geothermal, tidal energy, and biomass, provided resource adequacy as
discussed in Section 5.
After the iterative additions and simulations, we arrived at the six portfolios that provide an 80%
RPS. It is important to note that the 80% RPS is achieved under “normal” operating conditions
29
Maintenance schedules provided by AEA, 2022.
30
Because of the increased operation of these units in the base case, we also considered a case with more efficient
combined-cycle units in our fuel savings estimates in Section 5.
18
This report is available at no cost from the National Renewable Energy Laboratory at www.nrel.gov/publications.You can also read