SHELTER - THEME URBAN MOBILITY - Hudco
←
→
Page content transcription
If your browser does not render page correctly, please read the page content below
Theme Paper   Policy Review    Case Studies

SHELTER
                                                Publication

                                              October 2013

                              THEME URBAN MOBILITY
HUDCO Loan          FOR A

                   Dream Home

                                                                                        Critique
n   Most competitive interest rate                    n   No pre-payment charges
n   No processing charges                             n   Long tenure
n   No hidden costs                                   n   For all your housing needs

          For more information contact your nearest HUDCO office

          Housing and Urban Development Corporation Limited
          (A Govt. of India Enterprise)
    hudco An ISO 9001 : 2008 Certified Company
    niwas        HUDCO Bhawan, India Habitat Centre, Lodhi Road, New Delhi - 110 003.
                                   www.hudco.org
INSIDE
The mobility pattern of each city is different and so are their solutions. For
small and medium towns, where most of the trips are still being made by
walk or NMT, provisions of planning could include cycle tracks and pedes-
trian networks. For large cities, which has long trips, there needs to be a
dedicated transport system that integrates various modes. To effectively coor-
dinate the interaction of various modes and their integration, a city level
transport authority is needed. The authority will have to work on measures
like traffic calming, together with attempting to maximize the transition of
commuters from motorized modes of transport to non-motorised modes and
public transport.
HUDCO –HSMI Publication, October 2013 THEME : URBAN MOBILITY
Policy Review Parking in Million Plus Feature
Urbanization and Trans- 48 Cities
J.B. Kshirsagar, Mobility Reflections in
portation Diversity Urban Retrospect: My
80
Pawan Kumar
01 Sudeshna Mitra
Parag Pareekh
Public Transport
E-Rickshaw Ride
Sangeeta Maunav
Bandhan Bandhu Majumdar
Public Transport in the
A Case for Road Pricing in Context of Urban Mobility
07 Delhi
Akshaya Kumar Sen
52 in India
Bhargab Maitra
In the Boxes
Shubhajit Sadhukhan 6 Appeal to Contributors
13 Car free zone - Fazilka, India
Metro rail in Indian Cities:
Atal Sarige: An Effective 34 List of existing Regulations for
14
Feasibility and Impacts Protecting the Rights of Pedestrians
Model for Public Trans-
Geetam Tiwari
Rahul Goel
57 port for the Urban poor in
Bangalore?
42 Dial-a-Cycle Rickshaw Service-
Fazilka, India
Srikanth Shastry
47 Forthcoming Event: World Urban
Theme Paper Amit Bhatt
Forum-7 (WUF), 2014
Urban mobility: 51 Course Announcement: Training
23
Case Studies
Options for Sustainability Programme for Urban Local
Rajiv Sharma Bodies
Rendezvous on Wheels:
Taxis for Women by Women
66
56 Eco Mobility World Festival 2013
in the City of Delhi
Sustainable Transport 65 HUDCO’s Contribution to
Sangeeta Maunav Transport Sector
Sustainable Urban Mobility:
35
69 Ten Facts on Global Road Safety
Learning by Doing
Bus Rapid Transit: Paradigm
A.K. Jain 78 Book Review by Dr. Akshaya
Shift in Indian Urban Mass
70
Kumar Sen
Transport System
Eco-mobility: A Strategy for Vijay Anadkat 79 Innovation in HUDCO
43 Sustainable Urban Transport
Kulwant Singh
Amit Bhatt 82 Vision Zero Initiative- Traffic
Safety by Sweden
The views expressed in this publication are the personal views of authors and do not necessarily reflect the official views and policies of HUDCO/HSMI. Articles
or any other material in the publication may be reproduced so long as credit is given and tear sheets are provided to the editor.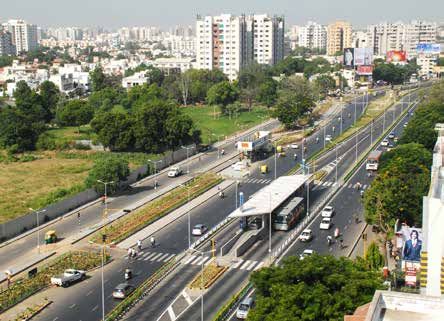
SHELTER                                 FROM THE CHIEF EDITOR
    Vol 14 No.2 October 2013
         www.hudco.org

SHELTER is an official publication of
                                          T   he United Nations has designated the first Monday of October every year as World
                                              Habitat Day. The purpose of World Habitat Day is to reflect on the state of our towns
                                          and cities and the basic right of all to adequate shelter. It is also intended to remind the
HUDCO/HSMI, distributed free of           world that we all have responsibility to shape the future of our cities and towns.
charge. It deals with issues related to
housing, urban development and other      This year, the United Nations chose the theme Urban Mobility because mobility and access
themes relevant to the habitat sector.    to goods and services is essential to the efficient functioning of our cities and towns as they
C ontributions, comments and              expand. Accessible cities encourage a shift towards more sustainable modes of transpor-
correspondence are most welcome and       tation and draw more and more travellers out of cars and onto trains, buses, bike paths,
should be forwarded to:                   and sidewalks. But mobility is about more than just the mode of transport we use. Urban
                                          planning and design should focus on how to bring people and places together, by creating
EDITOR                                    cities that focus on accessibility, and optimal urban densities, rather than simply increasing
SHELTER                                   the length of urban transport infrastructure.
Human Settlement Management
Institute                                 The invention of the wheel represented a major turning point in human civilization. The first
Hudco House, Lodhi Road                   wheels, disks carved from solid wood, may have been built as early as 3500 BC. The earliest
New Delhi-110 003                         use of this device was the potter’s wheel, used to spin and shape clay pottery. It was not
Tel: 24308600-656                         long before the true potential of the wheel was discovered, and wheeled carts soon replaced
Fax: 011-24365292                         the sledge as a means of transportation. By using the wheel, mankind gained the ability to
Email: hsmishelter@gmail.com
                                          work more efficiently and travel more quickly. Unfortunately, the wheel is in discussion
                                          again, but for wrong reason. It has become the leading cause of death for young people aged
BOARD OF DIRECTORS
                                          15-29, globally. As per World Health Organisation (WHO), more than a million people
Chairman & Managing Director
                                          die each year on World’s roads and the cost of dealing with the consequences of these road
Shri V.P. Baligar, IAS
                                          traffic crashes runs to billions of dollars. Road traffic injuries rank eight amongst the leading
Directors
                                          causes of death globally and trends suggest that by 2030 it will reach the fifth rank.
Shri N.L. Manjoka
Shri Anil Kumar Kaushik                   In 2010, the United Nations General Assembly unanimously adopted a resolution calling
Shri K.B.S. Sidhu, IAS                    2011-20 as ‘Decade of Action for Road Safety’. The goal of the Decade (2011-20) is to stabilize
Shri Naresh Salecha                       and reduce the increasing trend in road traffic fatalities, saving an estimated 5 million lives
Prof. Dinesh Mehta                        over the period. Some countries like Sweden is much ahead in this direction. Vision Zero is
Shri Virender Ganda
                                          the Swedish approach to road safety and can be summarised in one sentence: No loss of life
Prof. Sukhadeo Thorat
                                          is acceptable. It is based on the simple fact that we are human and make mistakes. The road
Company Secretary                         system needs to keep us moving and must be designed to protect us at every turn.
Dr. H. Verma
                                          This issue of Shelter has tried to address the subject of urban mobility from various per-
EDITORIAL TEAM                            spectives. The theme paper on Urban Mobility gives an overview of options for achieving
Chief Editor: Rajiv Sharma                sustainability. The article by Dr. Sudeshna Mitra and co-authors, gives an overview of
Editor: Dr. Manika Negi                   transport diversity and its importance for various sections of the society. Dr. Akshaya Sen
Co-Editor: Dr. Akshaya Sen                advocates the effectiveness of road pricing as a tool to improve urban mobility and Dr.
Dr. Ravi Shankar
                                          Geetam Tiwari argues on the effectiveness of metro system for Indian Cities. Urban mobility
Nila Pandian
                                          pattern on a city scale have been covered by AK Jain. Parking and environment-friend-
Rahul Mane
                                          ly modes of transport are covered by JB Kshirsagar & Pawan Kumar; Dr. Kulwant Singh;
Cover Design: Rajiv Sharma, Arun Kr.
Cover photo credit: Rajiv Sharma          and Sangeeta Maunav respectively. The role of public transport in urban mobility has been
                                          strengthened by Dr. Bhargab Maitra & Subhajit Sadhukhan; and meeting the mobility needs
Registered Office:                        of urban poor in Bengaluru has been documented by EMBARQ. The first hand information
Housing and Urban Development             on Bus Rapid Transit System is provided in an article by Vijay Anadkat and Amit Bhatt. The
Corporation Ltd.                          driving experience in a cab for women and by women can be documented only by a woman
HUDCO Bhawan                              and Sangeeta has been able to bring us its insights.
India Habitat Centre
Lodhi Road, New Delhi -110 003            Hope you enjoy reading this issue of Shelter.
POLICY REVIEW
URBANIZATION AND
TRANSPORTATION DIVERSITY
SUDESHNA MITRA For an urban transportation system to rate(2). This results in demand-supply
function efficiently and equitably, it should mismatch–increasing congestion,
PARAG PAREEKH be capable of meeting the transport needs of
BANDHAN BANDHU travel time and degrading quality
the diverse users constituting urban societies.
of urban environment and liveli-
MAJUMDAR Perhaps the most crucial factor that cannot
be neglected is the fact that diversity keeps hood. This becomes critical with the
a balance in the system, a concept derived ever rising urban population and
The present urban from evolutionary biology and used in constraints in terms of spatial dis-
transportation system, apart various spheres of life. The same is equally tribution of land uses, diverse road
needed for urban transport solutions to
from a few exceptions, users belonging to wide range of
make our cities resilient, sustainable, pro-
ductive and livable. In this paper, the authors socio-economic groups with varied
largely neglects specific argued for ‘Transportation Diversity’ as affordability for transport options.
groups such as women, a sustained policy of integrating land-use As a result, a unified motorized
planning with transport planning & policy, transport option is just not suitable
children, elderly citizens, besides successfully implementing various for such diverse population which
people with disabilities, traffic management strategies for sustain-
calls for more diverse and creative
able urban mobility.
people from lower income solutions.
group and students whose 1.0 BACKGROUND AND While socioeconomic profile varies
transport needs are different INTRODUCTION widely in cities of developing
Recent decades have witnessed rapid countries, transport infrastructure
from the majority.
urbanization in developing countries and travel options are often not so
with the phenomenon being most diverse. For example, dedicated
pronounced in China and India. The right of way for public transport
percentage of urban population in and for non-motorized transport
India is projected to rise from 31.3 is grossly missing in urban areas.
per cent in 2011 to 42.5 per cent (566 As a result, interactions between
million) by 2025(1). With economic motorized and non-motorized
development, urbanization is a modes are very frequent leading to
natural phenomenon which impacts conflicts, accidents and very high
every major sphere of activities in traffic related injuries and fatalities.
urban context. However, the impact ‘Push’ factors, such as travel related
is most visible for transportation in accidents and ‘Pull’ factors, such as
general and transportation infra- increased affordability force users to
Dr. Sudeshna Mitra (sudeshna@civil. structures of developing countries in shift to safer and secured mode and
iitkgp.ernet.in) is Assistant Professor with particular, due to the fact that with demand for motorized personalized
Indian Institute of Technology Kharagpur. increased economic development transport increases. However, with
Mr. Parag Pareekh is a M.Tech. student
and Mr. Bandhan Bandhu Majumdar is demand of motorized personalized the help of well-defined policy and
Research Scholar with Indian Institute of transport increases, whereas the planning strategies, it is possible to
Technology, Kharagpur. infrastructure capacity augmenta- meet the needs of various segments
tion does not happen at a similar of road users in an equitable and
OCTOBER 2013 VOLUME 14 NO. 2 SHELTER 1
HUDCO-HSMI Publication
reconciliatory manner. It is in this Based on the collective empirical with various relevant issues in the
context that Transportation Diversity observation from around the world, context of urban transportation such
becomes relevant for urban India it can also be concluded that a diver- as land use, demand management
with due cognizance and recogni- sified urban transport planning is and prioritization strategies that are
tion to societal diversity in terms required to include all sections of interlinked with these performance
of age, gender, income, physical population in an urban context. measures.
capacity, habits and inclination and
economic characteristics. While the 3.0 RELEVANCE AND BENEFITS 3.1 Accessibility and
concept is not new(3), we can say OF TRANSPORTATION DIVERSITY Transportation Diversity
that it is not very popular either, There is no doubt that urban Accessibility is a term that has a
since it is not frequently practiced by multitude of meanings within the
transport is critically linked with
urban planners and engineers and transport profession ranging from
the productivity and quality of
probably not in the list of high pri- the physical access onto a public
urban living— still urban mobility
orities of many transport planning transport vehicle, the ability to get
is besieged by chronic congestion,
and policy making agencies. Never- to a given place, to the accessibility
high rates of road traffic injuries and of information about a particular
theless, Transportation Diversity has
fatalities, transport related emission public transport service.(4) In this
a key role to play in urban land use
and air pollution as well as high context, it is essential to under-
and transport planning and is the
dependence on fossil fuel. In present stand that affordability is the key
focus of this article.
day context, it is thus very essential in defining accessibility of urban
2.0 TRANSPORTATION that we understand the perceived transport. In addition, accessibil-
DIVERSITY benefits that transportation diversity ity is equally important in terms of
can bring, as identified by Litman physical access to transport modes,
According to Litman (2003)(3)
(2010) and shown in Table 1. especially for elderly and disabled.
“Transportation Diversity” may be
defined as “The availability of trans- The importance of the concept can 3.2 Transportation System
portation services in a given situation, be understood better by examining Efficiency and Transportation
in terms of their quantity and quality its relationship with commonly Diversity
i.e. at a specific time and at a specific used performance measures such The term “efficient” is frequently
location, considering the users’ needs as accessibility, efficiency and safety used to define increased vehicular
and abilities”.
Table 1: Perceived benefits from Transportation Diversity [3]
Transportation Diversity can be effi-
Benefit Description
ciently described in terms of various
attributes such as modes, prices, User benefit It brings to the community a wider range of options and choice to save
money, reduce stress, health benefits, provides walkable environment.
services and location options(3). To
Efficiency Offers room for each mode to function and find its target user thus
put transport diversity in perspec- reducing inter-modal conflict.
tive, we may consider the current
Equity A diverse system helps achieve equity objectives by enabling basic
prevalent state of urban transporta- mobility.
tion, which by and large is moving Livability Helps in creating neighborhoods conducive for non-motorized travel,
towards dependence on personal- thus contributing to better livability.
ized motorized traffic. So, improving Resilience Systems with diversity tend to consume less energy and resources and
transport diversity would primarily so are better placed to respond to unexpected changes and disruptions
require improvement of alternative like fuel price rise, oil shock etc.
modes, i.e public transit, walking Economic Reduces cost of travel, optimal use of resources, costs arising from con-
and cycling. development gestion, and resource consumption.
2 SHELTER OCTOBER 2013 VOLUME 14 NO. 2
HUDCO-HSMI Publication
bicycle lanes, advanced stop lines
at signalized intersections, quality
markings & signage at crosswalks,
dedicated bus lanes etc., to name
a few. These measures also restrict
road space for private motorized
vehicles, thereby reducing their
speed and severity of accidents.
In this context, many transportation
safety experts conclude that roads
that are safe for pedestrians and bicy-
clists are also safe for motorists(8).
3.4 Transportation Diversity and
Land use
When it comes to land use it is
observed that decentralized and
suburbanized cities tend to have less
diverse transport systems mainly
Figure 1: Access to public transport (special need based) [5] due to the fact that in such urban
areas, the automobile seems better
speed. It assumes that faster traffic provide conducive and amenable suited to answer the call of mobility.
always increases overall efficien- operating conditions for Non-mo- In general, reduction in commuting
cy(3). Transportation Diversity can time tends to encourage suburban-
torized Transport (NMT) users,
contribute significantly to make ization, contributing to urban sprawl.
leading to their safety as pedestrians
the transportation system efficient The American origin urban planning
and bicyclists. NMT users are always tradition of zoning (designating
by improving operating conditions
for both road based and rail based over-represented in traffic related permitted use of land to strictly
public transport for longer travel injuries and fatalities in urban areas separated single uses like industrial,
distance, and providing infrastruc- in general and that of developing commercial, residential etc.) and its
ture for non-motorized modes for world in particular. This can be done replications in different parts of the
short distance travel. These diver- by providing sidewalks, segregated world which had earlier followed a
sifications ensure efficiency of each
mode by reducing inter-mod-
al conflict and, at the same time,
enhancing multi-modal options for
urban transport.
3.3 Transportation Diversity and
Safety
Transportation diversity has high
potential to bring better safety
compared to automobile dominated
transport system. With mode Figure 2: Traffic calming measure in Figure 3: Advanced stop line(7)
portland(6)
specific planning, it is possible to
OCTOBER 2013 VOLUME 14 NO. 2 SHELTER 3
HUDCO-HSMI Publication
mixed land use policy (many Asian
cities for instance) is largely respon-
sible for the lion’s share of road space
and right of way (ROW) that the
automobile has come to command.
Hence it is very important that in
urban planning both land-uses and
transport planning should be done
in a coherent manner so that suitable
transport options are planned simul-
taneously to a proposed land-use, Figure 5: Green Bike Lane in New York Figure 6: Bus Priority in New South Wales(11)
City (10)
to meet the transport demand
generated by it. In typical Indian and TDM. Some of the measures and service vehicles over single
contexts, mixed land-use has been a like implementing HOV lane (High occupant private vehicles in policy
common phenomenon which should Occupancy Vehicle), HOT (High and planning decisions.
be used advantageously to plan for Occupancy Toll), Road Pricing,
both non-motorized and motorized Congestion Pricing can ensure basic 4.0 POLICY FRAMEWORK
modes. In such contexts various mobility(3). TDM or repackaging IN THE CONTEXT OF
traffic calming measures should also travel demand reduces the demand TRANSPORTATION DIVERSITY
be used in residential areas. However, for motorized private travel, reduces Transport investment policy and
shared and dedicated NMT facilities traffic congestion, increases mobility, Transportation Diversity share
should be planned on urban collec- increases road and parking cost critical linkages. Transport invest-
tors and arterials. savings, promotes consumer savings, ment policy is the most important
increases transport choice, improves determinant of the overall shape of
3.5 Transport Demand efficiency and reduces traffic crashes urban transportation systems as it
Management (TDM) and in addition to its positive impact on is the policy making bodies that are
Transportation Diversity environment. in charge of all decision making and
TDM is a strategic tool to meet the implementation of major programs
3.6 Prioritization and Transport
needs of Transportation diversity. and projects in urban areas. Since
Diversity
Figure-4 shares a very strong rela- Transportation Diversity depends
tionship with transport diversity Prioritization refers to strategies
upon the formulation and execution
to influence transportation policy,
of planning and design strategies to
planning and programs in order to
promote diversity, its relations with
WHY? prioritize allocation of transport
WHEN? innovative transport policy cannot
resources(3). Measures like Road
Purpose of travel Time of travel
be overstated.
Work Peak / Off-peak
School
Shopping
Recreation
Daytime / Evening
Week day / Week end Space Reallocation, Parking Man-
agement, Bus Rapid Transit (BRT) Table-2 presents various transport
TRANSPORTATION (Figure 6), Efficient Pricing (Con- related policies and their impact
DEMAND
MANAGEMENT gestion Pricing, Parking Pricing) as identified by Litman (2010).
(TDM)
are examples of prioritization. Although these policies bring about
WHERE?
Travel destination
HOW?
Travel mode Prioritization is also linked with diversity, it is clear that these policies
the Green Transportation Hier- will also make a transport system sus-
Block Walk or bike
Neighbourhood Public transit
Community
tainable. Hence, it can be concluded
Car - drive / ride
City Tele communications archy—a road use hierarchy that
favors NMT modes, high-oc- that Transportation Diversity would
Figure 4: TDM Flow Model(9) cupancy vehicles, public transit also lead to sustainability.
4 SHELTER OCTOBER 2013 VOLUME 14 NO. 2
HUDCO-HSMI Publication
Table 2: Policies and their impacts on Transport [3] planning & policy, besides success-
fully implementing various traffic
Policies Impacts
management strategies.
Transit Improvements Increases motor vehicle speeds.
In cities like Amsterdam, several
Car sharing Reduces congestion traffic demand management strate-
Pedestrian and Cycling Improvements Improved NMT share gies have been implemented which
HOV Priority Repackage the demand efficiently are aimed at reducing and redirect-
ing personal motorized transport.
Parking Management Ensures safe and secure mobility
The combined modal share of non
Road Pricing (especially HOT lanes) Discourages automobile dependence motorized modes (pedestrians and
bicyclists) in Amsterdam stands
5.0 DISCUSSION AND Hong Kong’s car ownership rate is at 54 per cent which is the result
CONCLUSION among the lowest in the world(13). of sustained policy to promote
In conclusion, some comparisons This is strongly related to their and improve transport infrastruc-
and contrasts are being made in good public transport infrastruc- ture for pedestrians and bicyclists,
the light of Indian urban transport ture that led to high public transport besides successfully employing
patterns vis-à-vis trends observed in patronage. What makes these traffic demand management strate-
some south east Asian and European trends truly outstanding is the fact gies to increase the modal share of
cities. Mckinsey Global Institute[12] that Hong Kong is one of the most public transport. In 2009, the city
(2010) claims that on average, the densely populated cities in the world had 35,000 bike racks and 360km
share of public transport in Indian with 35000 people per sq. km, but it of bike lanes, which are being
cities has dropped from 40 per cent is still one of world’s top economies extended further. The city also has
to 30 per cent between 1994 and with top global per capita GDP. The a bike-sharing system since 1995
2010— a disturbing trend, con- same is true for Singapore, another and is currently reforming it. With
sidering the importance of public leader of Asia pacific, which has a innovative measures, the city of
transit in urban India. Predictions modal share of public transport as Copenhagen has reduced car traffic
by Wilber Smith Associates[2] (2008) high as 59 per cent. The transport by 6 per cent since 2006. The share
and Mckinsey Global Institute[12] administration of Singapore aims of population driving cars to their
(2010) indicate that private car to increase this figure to 70 per cent workplace has fallen from 22 per
ownership will continue to increase by 2020(14). They also aim to reduce cent to 16 per cent, whereas the
leading to urban gridlock and acute average public transport journey share of commuters by train has
congestion(12). They also predict that times from the current 1.8 times to risen from 24 per cent to 33 per cent.
peak vehicular densities will reach 1.5 times of that by car by 2020 in All these results clearly show how
as high as 610 vehicles per lane km order to increase the attractiveness a diversified approach to transport
leading to an average journey time of public transport vis-a-vis private solutions and innovative policies can
during morning peak hour to be as car. At 100 cars per 1000 population, make tangible difference to any city
high as 5 hours. This clearly indicates Singapore’s is among the world’s and make it more livable and sus-
that future of Indian cities is at stake, lowest car ownership rates. This is tainable.
which is however in stark contrast to despite the fact that the city state In the light of the issues mentioned
trends observed in many urban areas Singapore is among world’s leading and discussed in this article, it is
across the globe. For example, Hong economies. These urban transport clear that for an urban transporta-
Kong leads the world with public characteristics of both Hong Kong tion system to function efficiently
transport representing 90 per cent and Singapore can only be attributed and equitably, it should be capable
of total modal split in that city. With to the sustained policy of integrating of meeting the transport needs of
just 50 cars per 1000 population, land-use planning with transport the diverse users constituting urban
OCTOBER 2013 VOLUME 14 NO. 2 SHELTER 5
HUDCO-HSMI Publication
societies. Perhaps the most crucial http://ridermagazine.co.uk/e-pe- 2013 from “http://www.rta.nsw.
factor that cannot be neglected is the tition-calls-for-advanced-stop- gov.au/roadprojects/projects/
fact that diversity keeps a balance in box-use/ bus_priority_program/anzac_
the system, a concept derived from 8. Marshall, E and Garrick, N pde/index.html”
evolutionary biology and used in (2011), “Evidence On Why Bike 12. Mckinsey Global Institute (2010),
various spheres of life. The same is Friendly Cities Are Safer For India’s Urban Awakening: Build-
equally needed for urban transport All Road Users. Environmental
solutions to make our cities resilient, ing Inclusive Cities, Sustaining
Practice 13:16-27(2011). Economic Growth.
sustainable, productive and livable.
9. Transport Canada. 2010. 13. Tang, Siman and Lo , Hong K.
Accessed on 03 May, 2013 from
REFERENCES January2008. Hong Kong: The
http://www.tc.gc.ca/eng/pro-
1. Sivaramakrishnan, K.C and Impact of Public Transit on the
grams/environment-utsp-tdmin-
Singh, B.N. (2011). “Urbaniza- Viability and Sustainability of
tro-1039.htm
tion”. Accessed on 03 May, 2013 Mass Railway Transit –The Hong
10. Roth, M. (2013) “San Francisco Kong Experience,
from “http://planningcommis-
Bike Lanes” Accessed on 15 Aug,
sion.nic.in/reports/sereport/ser/ 14. Ministry of Transport, Singa-
2013 from “http://sf.streetsblog.
vision2025/urban.pdf ”. pore (2012), http://app.mot.gov.
org/2010/05/10/san-francisco-
2. Wilbur Smith Associates (2008), gets-its-first-green-bike-lanes- sg/Land_Transport/Making_
study on traffic and transporta- on-market-street/” Public_Transport_a_Choice_
tion: policies and strategies in Mode/Overview.aspx.
11. NSW Department of Trans-
urban areas in India. Ministry of 15. European Environmental
port (2013), “Bus Priority Pro-
Urban Development.
gramme”. Accessed on 03 May, Bureau, http://sootfreecities.eu/
3. Litman, T. 2010. “Transportation
Cost and Benefit Analysis II –
APPEAL TO CONTRIBUTORS
Transportation Diversity”. Victo-
ria Transport Policy Institute, pp. We invite articles, documentations, research report relating to Housing, Urban Infra-
5.9-1-10 structure and Urban Development. These may be sent to the Chief Editor/Editor,
SHELTER.
4. Department for Transport (DFT), While sending articles please ensure that:
Govt. of UK (2012). “Guidance • The articles is sent as a document file and not as a PDF file
Documents “accessed on 03 May,
• Article must be not more than 7500 words, including notes and references
2013 from “http://www.dft.gov.
• It is typed in double space
uk/webtag/documents/expert/
unit3.6.php#3.6.1.” • All quoted references are written in any of the standardised formats
• All illustrations are drawn in black ink on white paper and the original is sent for
5. U.S. Department of Transpor- publication
tation. “Better Public Transport • Charts and graphs need to be in MS Office (Word/Excel) and not in ‘jpeg’ or
option for everyone”, Intelli- similar format
gent Transportation Systems, All material received will be acknowledged. Those found suitable for publication will
Project No.: EDL# 14138 FHWA- appear in subsequent issue of the journal after editing, while those not published will
JPO-05-046 become part of our data base. We try to build a data base on various aspect of human
settlement for the benefit of researchers, policy makers and practitioners.
6. Tompkins calming techniques.
http://www.tompkins-co.org/ Letters: Readers are encouraged to comment (200 words) on articles published in
planning/htmll.Accessed on 04 Shelter.
Sept, 2013. Book Reviews: Review of books on topics covered in Shelter magazine may be
7. Motor Cycle Rider. 2013, submitted (500 words) for publication.
Accessed on 27Aug, 2013 from
6 SHELTER OCTOBER 2013 VOLUME 14 NO. 2POLICY REVIEW
A CASE FOR ROAD PRICING IN DELHI
AKSHAYA KUMAR SEN The rapid growth of motor vehicles in sight in most metropolitan cities
mega-cities of India owing to increasing in India, particularly so in major
pace of urbanisation has resulted in the
urban centres like Delhi, despite
problems of air pollution, traffic congestion,
accidents, noise, health hazards and overall massive investments in road infra-
Optimal road tolls would be environmental degradation. This is because structure in the form of expansion
road users either completely ignore or insuf- of road widths, building of flyovers
good for firms, for people, ficiently take into account the negative and bridges and expansion of road
and for the environment. externalities of urban transport while networks. This observation seems to
making their travel decisions. This paper
Optimal urban road pricing builds a case for optimal road pricing based
be in line with Downs’ paradox which
on social marginal cost pricing for correct- says that whenever new express-
is likely to increase prices for ing identified market failures so as to make ways are built in metropolitan areas,
car use in congested urban urban roads congestion-free and smooth crowded conditions develop quickly
for all road users. The paper underlines when previously suppressed trips
conditions which would the double dividend of urban road pricing:
are regenerated and daily travelers
encourage the car users not discouraging road use by private vehicles at
switch to their private automobiles
least at certain times and certain parts of the
to bring their cars on the road network; and transferring cash from at desired time of travel. Worse still,
road and look for alternative private persons to public funds. when traffic density is high relative
to the capacity of a facility, travel-
transport such as public 1.0 CONTEXT lers more often than not wind up in
transport. “I will begin with the proposition that a common gluepot in which traffic
in no other major area are pricing comes to a virtual standstill during
practices so irrational, so out of date, the peak hours.
and so conducive to waste as in urban The rapid pace of urbanization
transportation. Resort hotels have and emergence of mega-cities have
off-season rates; theaters charge more resulted in the problems of environ-
on weekends and less for matinees. mental pollution, traffic congestion,
Telephone calls are cheaper at night… accidents, noise, health hazards and
But in transportation, such differen- overall environmental degradation
tiation as exists is usually perverse.” resulting from urban transport.
(Prof. William Vickrey, 1963) Road users either completely ignore
Even after 50 years since Professor or insufficiently take into account
William Vickrey made the above these negative externalities while
Dr. Akshaya Kumar Sen (akshaya_sen@ observation in his celebrated paper making their travel decisions.
hotmail.com) is Assistant General on road pricing (1963), the same These negative externalities are not
Manager (Economics), Housing and
holds true today. It is generally captured in the transactions of the
Urban Development Corporation Limited,
New Delhi. agreed that saturated and congested market for transport services either.
urban roads are still a common Experiments elsewhere show that
OCTOBER 2013 VOLUME 14 NO. 2 SHELTER 7HUDCO-HSMI Publication
the standard way of solving conges- thus become an important area of Over the period 1980 to 2011 the
tion in the long run, by increasing policy research. total number of vehicles has multi-
road capacity via investment in the plied thirteen times. The compound
The present paper builds a case
road infrastructure, seems to induce annual growth rate of vehicles in
for road pricing based on social
ever-increasing demand for travel. Delhi is about 9 per cent. On an
marginal cost pricing for correcting
When road capacity is relative- identified market failures so as to average about 1000 new vehicles
ly fixed, the economic efficient make urban roads congestion-free are added in Delhi every day, most
solution is to price the use of roads and smooth for all road users. of them private (Figure-1). Given
differentially by setting road tolls/ the rapid pace of urbanization, it is
congestion tolls, which reflect the 2.0 URBAN TRANSPORT expected that motor vehicles would
scarce value of road services. Road SCENARIO IN DELHI grow even faster.
space is indeed one of the few
In India, as in other developing Unlike most Indian cities, the traffic
examples of a good or service, which
countries, urbanization is most in Delhi comprise predominantly
market forces have left relatively
untouched. Since the market fails evident in the country’s metropol- of motorized vehicles. The share of
to promote a social optimum, it is itan areas. It is expected that the motorised trips is over 63 per cent
relevant to inquire how these exter- population of Delhi will grow from of the total daily trips. The road
nalities can be mitigated through 16.75 million in 2011 to 23 million space is shared by at least seven
policy initiatives such as implemen- in 2021. Delhi’s population has different types of vehicles, each with
tation of social marginal cost pricing increased eighteen times in a span different static and dynamic char-
of road transport and promotion of of last six decades in comparison to acteristics. The proportion of fast
one mode of road transport at the the national average of 3.5. The total moving vehicles- especially light &
expense of another. Under ideal cir- area of Delhi is 1486 sq. km. with fast vehicles- has increased dramat-
cumstances the suggested economic an urban area of about 500 sq. km ically over the years. As per a study
solution to the externality problem is (RITES, 2005). Delhi has been expe- (TRIPP-IITD, 2000), the share of
to charge users of all transport modes
riencing a consistently high rate of private car transport in total trips
and services for the marginal social
growth of motor vehicles during the is approximately 12.51 per cent
costs, including all external costs,
they inflict on society. This induces last few decades as is evident from (fig-2) whereas the share of public
users to take account of all social Figure 1. transport (bus) is 35.42 per cent. The
costs in making their decisions.
Implementation of this first best 8000000
Figure 1: Growth of Motor Vehicles in Delhi 7228000
principle requires full knowledge of 7000000
all social marginal costs and it has to 6000000
correctly reflect all the interactions 4720405 Year
5000000
between different transport markets. Pvt. Car
Moreover, the basic principle has 4000000 3302044
2-Wheeler
to be adjusted in second-best sit- 3000000 2575731
2116107 Bus
uations where for technical or 2000000
1764558
1472672
political reasons correct pricing of Total
554407 617585 843814
1000000 383610
all transport services at their social 119495
marginal cost is not feasible. An 0
examination of the practicability 1980 1990 1995 1999 2006 2011
and efficiency of social marginal cost
Source: Delhi Statistical Yearbook; Transport Authority, Delhi & MoRT&H, GoI
pricing in urban road transport has
8 SHELTER OCTOBER 2013 VOLUME 14 NO. 2HUDCO-HSMI Publication
Figure-2: Modal Share in Delhi (2000) Fig - 3: Modal Split in Delhi(2007)
Car Two -wheeler
10.74 12.51
Auto Public Transport
25.84
35.42 15%
0.77
14.72 55% 26%
Car Bus
4%
Source: TRIPP-IITD, 2000. Source: RITES, 2010.
remaining 52.07 per cent are shared As per a Study by RITES in 2010, the The rapid urbanisation in Delhi,
by motorised 2-wheelers (14.72 modal split among the motorised together with industry and
per cent), auto-rickshaws (0.77 per average daily trips of 11670629 in transport, has resulted in an equally
cent), bicycles (25.84 per cent) and 2007 was as follows: public transport rapid increase in urban air pollution.
walk trips (10.74 per cent). 54.6 per cent; two-wheelers 25.5 Major motorized modes of transport
per cent; car 15.5 per cent; and auto like buses, cars, auto rickshaws,
The dominance of personalised
4.4 per cent (fig-3). RITES projects trucks and scooter/ motorcycles are
modes of transport has been a charac-
that the share of car would increase major contributors of air pollution.
teristic feature of this growth. As can
to 17.1 per cent by 2021 whereas The use of poor quality fuel (e.g. coal
be seen from figures 1 & 2, the share
the share of public transport would with high sulphur content and leaded
of registered buses in total number of increase to 59.7 per cent by 2010. gasoline till recently), inefficient
motor vehicles, which cater to about This reiterates the fact that if appro- methods of energy production and
35.42 per cent of the total passenger priate steps are not taken now, use, poor condition of automobiles
travel demand, has been a mere 1 urban mobility would pose a greater and roads, and traffic congestion are
per cent. Even the share of Inter- challenge in years to come. major causes of increasing airborne
mediate Public Transport (IPT) like
autos & taxis, as a percentage of the
Figure - 4 Contribution of Various Sectors to Air Pollution
total motor vehicles, has gone down
from 4.3 per cent in 1985 to 3.3 per 120
0
cent in 2004. Average speed of a car 100
10 0
(Contribution%)
0
in peak hours is reduced to less than 1
80 13
24 kmph, while the same for bus Domestic
transport to 21 kmph. On average, 60
92 96 Industrial
per capita trip rate per day in Delhi 40 90
72
Transport
Urban Agglomeration is 0.7816 20
without walk trips and 1.139 with 8 8
0
walk trips. The average trip length CO NOx PM SO2
of all motorised vehicles has also Pollutants
increased over the years adding to
Source: Govt. of India (2003), Auto Fuel Policy Report.
the congestion on the roads.
OCTOBER 2013 VOLUME 14 NO. 2 SHELTER 9HUDCO-HSMI Publication
emissions of sulphur dioxide (SO2), pricing is needed in India, particu- transport management and it works
oxides of nitrogen (NOX), carbon larly in metropolitan cities like Delhi well.
dioxide (CO2), suspended particu- where the problem is severe. Optimal
Queues happen when a demand-
late matter (SPM), lead (Pb), carbon road tolls would be good for firms,
and-supply mechanism fails.
monoxide (CO) and ozone. for people, and for the environment. Economists know that using the
The money raised could be spent pricing system to ration things is
In a city like Delhi, even after many
in useful ways – such as improving the most sensible and effective way.
years of efforts to reduce pollution
public transport, reducing other It is especially necessary on roads
from motor vehicles, road transport
taxes etc. because drivers do not bear in mind,
is responsible for 60 per cent of the
total urban air pollution (Govt. of The argument for optimal road when they make a journey, that
India, 2003). Figure-4 shows that pricing is simple. Imagine what their presence on the road creates
road transport alone is responsible would happen if Kendriya Bhandars an ‘externality’ for others. The affect
for 90 per cent of carbon monoxide and Shopping Malls give away their of traffic congestion, especially on
(CO) and 72 per cent of total NOX products for free or nearly free. highly skilled workers, has not been
emission. CO2 contributes the During long periods of the day, suitably realized. Probably more
maximum, i.e. 62 per cent of the total there would be enormous queues than half of all skilled workforces
pollution which is due to vehicular outside Kendriya Bhandars and in Delhi spend more than 3 hours a
emissions. Shopping Malls. People would day traveling to and fro from work,
have to get up early and allocate on a normal working day. The hours
The increasing vehicle population on time in their diaries just to be able spent on road increases considerably
Delhi roads has also raised the noise to reach the malls to grab these if it happens to be a rainy day or if
levels in Delhi which vary from 54 goods. It would be no use building there is a breakdown of vehicle on
dB(A) to 84.6 dB(A). In addition to wider front doors to these Kendriya the road, which is very common in
causing ill health effects, noise from Bhandars or Shopping Malls (the Delhi. This is a waste of people’s pro-
roads leads to reductions in property let’s-build-more-roads approach), ductivity, it wrecks marriages, and
values. Road accidents are also on or having special approaches that increases road rage and stress-relat-
rise in Delhi despite growth in traffic only certain kinds of people could ed illnesses. Optimal road pricing
management. The deaths on Delhi use (the bus-lane approach). As is a widely acclaimed tool which
road have increased from about 500 soon as the queue starts to shorten, can make our roads run freely and
in early 1970s to over 2000 in 1990s other consumers would notice and smoothly again.
and to 2325 in 2009 as per Delhi come to the new wide-entrance Although exact calculations are
Traffic Police data. The main victims Kendriya Bhandars or Shopping subject to any number of quan-
are the pedestrians whose share Malls. Dealing with the queues tifications and uncertainties, it is
among the deaths on Delhi roads is would be a difficult proposition quite clear that motor vehicles in
50 percent, although their share in for the Mall’s management. The Delhi almost certainly impose very
total traffic flow is only 10.74 per Kendriya Bhandars or Shopping large social costs, most of which
cent. Malls would be better advised to put drivers do not shoulder. In a study,
appropriate prices on their goods so Sen (2007) demonstrated that the
3.0 A CASE FOR ROAD PRICING that persons who are able to pay for current pricing system in Delhi is
The negative effects of urban the goods can only enter the outlets. inefficient and different transport
transport in terms of congestion, This hypothetical situation is an services are grossly under-priced.
air pollution, noise, accidents, etc., illustration of various regulatory As per his study, the generalised
call for an efficient and optimal road and economic principles of urban price including the marginal social
10 SHELTER OCTOBER 2013 VOLUME 14 NO. 2HUDCO-HSMI Publication
cost for driving a small petrol car tions to optimal road pricing some would cut companies’ costs and
driven alone during peak hours of which are as under: make the Indian economy work
on Delhi road was estimated to be more efficiently. It may also be
1. The most common claim is that
Rs. 14.30 per kilometer, where as desirable and efficient on envi-
optimal road tolls would increase
the actual price being paid was Rs. ronmental grounds, as it would
cost of travel of general public as
6.70 per kilometer. The pricing is encourage firms to send freight
well as firms, by making them
inefficient because of mainly two by rail rather than road. It would
pay extra charges. This is not
key reasons directly related to the be a simple matter for a govern-
true. Optimal road tolls would
transport sector: First, the resource ment to set tolls on trucks at a
be good for firms, for people, and
different level, then those on cars.
cost of parking is not charged to the for the environment. Optimal
drivers, which results in inefficiently urban road pricing is likely to 2. Another major criticism is that
and high demand for transport; and increase prices for car use in con- road pricing would hurt the
second, transport pricing is below gested urban conditions which poor. This is unfounded. The
social costs, including marginal would encourage the car users poor does not drive a car. The
external costs that accrue to the not to bring their cars on the road purpose of road pricing would
and look for alternative trans- be to take money from the rich.
society.
port such as public transport. Those on high salaries would be
There is, therefore, a strong case Public transport will become happy to pay a few rupees more
for optimal pricing of urban road more competitive. As a result to be able to get to their work at
transport based on the principles of optimal pricing less time will 9 am without having to rise at the
of Marginal Social Cost. It is fair be wasted in congestion, there crack of dawn. Sensible road tolls
that those who enjoy the benefits will be fewer accidents and the would be designed to be high at
of motor vehicle should pay for quality of the environment will peak times. Those earning good
the costs of that use directly. It improve making the transport wages would travel then and pay
is expected that optimal urban system more efficient and the for the privilege. Those on low
transport pricing measures would society better-off. Road pricing incomes would take alternative
generate three important impacts: would also make life cheaper for transport like bus, metro and/or
firms in India. Tolls would be set travel at other times of the day
(a) Impacts on the transport system
at the right level to make traffic when the tolls are low or even
itself, assessed in terms of transport
flow freely – and not higher. A zero. Charging people to use their
service performance (accessibili-
road toll of Rs 50, say, would be cars will create extra revenue for
ty, speed, reliability, safety, modal
negligible for a firm’s truck car- the government which can be
split, congestion, efficiency); (b) utilized for creating better trans-
Impacts on environment and health, rying Rs.10 million worth of
goods. But it would be a lot of port infrastructure and more effi-
assessed through the monitoring of cient public transport system.
money to a person heading off to
air quality, noise levels, accidents
a leisure centre for squash before 3. Another misleading criticism is
for which transport is responsible;
work or a parent who does not that most road users are against
(c) Impacts on the economy and
want their child to take the bus congestion charging. One of the
society as a whole, which can be to school because it is raining, reasons for this is that opinion
estimated through the assessment of so that road toll would make polls are usually run by organ-
the welfare effects of pricing policies. such persons avoid car use and isations trying to get people to
take them out of the truck’s way. say so. Another reason is that
4.0 MISLEADING OBJECTIONS A truck journey time that is cut people do not realise, when
TO ROAD PRICING by 10 minutes would easily be answering opinion polls, that
There are various misleading objec- worth the toll. Thus, road pricing road tolls would clear the roads.
OCTOBER 2013 VOLUME 14 NO. 2 SHELTER 11HUDCO-HSMI Publication
After an experimental week of 2) Restricted access at certain times using electronic tags and a cordon
road tolls, we think people would or on certain days to different of electronic beacons around the
be delighted and never wish to coloured/numbered cars (e.g. central business district, which
go back to the jams of toll-free Athens, Mexico City); deduct credit from the tags each
roads. This is what is happening 3) Meter parking in residential areas time you pass through them.
on the toll roads such as D-N-D near Central Business Districts
Flyover connecting Noida and (CBD); 6.0 CONCLUSIONS
Delhi. Despite increasing awareness of
4) Closing roads to cars at certain
the growing costs associated to
5.0 IMPLEMENTABILITY OF busy hours of the day ;
excessive congestion, pollution and
ROAD PRICING 5) Toll bridges and flyovers (e.g. despite increasing popularity of road
There is considerable debate in the Delhi-Noida-Delhi flyover). pricing principles, examples of its
literature on the issue of imple- The command and control schemes actual implementation in transport
that involve directly banning drivers have been very slow. In India, in
mentability of optimal road pricing.
infringe personal freedom, and are particular, Marginal cost pricing of
There is no single best mechanism
less desirable and less effective than urban transport is absent and widely
for charging all the now-hidden considered a radical and controver-
road pricing. One of the most com-
costs of driving to users of motor sial policy. Even the National Urban
prehensive and preferred schemes
vehicles. Ideally, the price should be involves ERP, where variable tariffs Transport Policy (NUTP)- 2006 of
based on “polluter pays” principle more accurately reflect the marginal the Government of India is silent
and should be paid as close to the external costs of a trip. Electronic on this important issue of urban
place and time, where the cost Road Pricing (ERP) in Singapore transport. In order to have sustain-
is incurred, as possible. But in has increased charges and lowered able urban mobility, optimal road
practice, it is not always technical- ownership taxes -- hence con- pricing based on marginal social cost
ly or economically feasible. Studies trolling congestion without raising pricing has to be considered and be
around the world find that optimal the total costs to road users. Traffic made acceptable to all stakeholders.
in Singapore moves at an average of People need to be convinced about
transport pricing can be imple-
60kph even at peak times. Road tolls the effectiveness of the measures, use
mented. The concept of marginal
in Singapore have been a success. of revenues and anonymity of the
cost pricing can be translated Queues do not build up. People road pricing mechanism. By making
into concrete pricing or taxation who need to travel urgently, pay a pricing part of a package of policy
measure using existing technology. premium for the convenience, rather measures, by offering alternatives
Simple “second best” approach- than waiting. The London Conges- to car use and by using the revenues
es, such as cordon tolls and peak/ tion Toll system is also working well in the most profitable way for the
off-peak price differentiation, can in the peak hours local context, be it in transport or in
often achieve almost as much as In some of the countries like Spain, other sectors, efficient pricing can be
the theoretically optimal solutions. France, Belgium, Italy, Japan and made acceptable to policy makers
Different countries have adopted some US states, the toll revenue is and citizens and other stakeholders.
used to finance new motorways, and A “clever and intelligent” marketing
different methods of tackling road
users pay for roads through license strategy and sound consultation
congestion. Some of the widely
fees, fuel tax and a weight-distance process is crucial for the success of
followed methods are the following: the road pricing in Indian cities.
charge for heavy goods vehicles.
1) Electronic road pricing (ERP) Other ERP systems have been
schemes, cordon tolls or toll installed in Barcelona, Lisbon, REFERENCES
booths (e.g. Singapore, Spain, Dallas, Oklahoma and Florida. Oslo Delhi Statistical Year book, Director-
Japan); has had a system in place since 1990 ate of Economic & Statistics, Govern-
12 SHELTER OCTOBER 2013 VOLUME 14 NO. 2HUDCO-HSMI Publication
ment of National Capital Territory of
CAR FREE ZONE - FAZILKA, INDIA
Delhi, various years.
Key Information
Delhi Traffic Police Report (2004), • In 2006, Graduates Welfare Asso-
ciation Fazilka (GWAF) organized
Delhi Police, Govt. of India. Car free street for a week
• Entry for cars banned between
Govt. of India (2000), Transport Fuel 10:00 am to 7:00 pm for central
Quality for Year, 2005, Central Pollu- area
• Beneficial impact of car free zone
tion Control Board, New Delhi. 10,000 visitors/day in market areas
23% reduction in accidents in
Govt. of India (2003), Auto Fuel Policy central area
3% reduction in air pollution
Report, Ministry of Petroleum and
25% increase in local sales
Natural Gas, New Delhi. 12% increase in visitors to area
Improved community social life
Govt. of India (2012), Road Transport
Year Book (2009 & 10, 2010-11, Min- Fazilka is a small city in Punjab, India located near India Pakistan border. Like most
small cities in India, Fazilka has many narrow streets in the old market areas and
istry of Road Transport & Highways, excessive growth of motor vehicles in the recent years has lead to increasing traffic
New Delhi, 2012. congestion. In the year 2009, municipal committee decided to convert market area
into car free zone. The main market area around clock tower was declared as car free
Govt. of India (2011), Census of India, zone. The entry of cars between are 10:00 am to 7:00 pm is banned. Only two wheelers
Population Series, 2011 and cycle rickshaws are allowed during this period. Placement of traffic calming
device and permanent barriers at few locations was the key to success.
Indian Institute of Technology (2000), In 2006, a group of people from Graduates Welfare Association Fazilka (GWAF)
organized Fazilka heritage festival for one week. As a part of the festival, they converted
Unpublished survey of 2000 house-
300 m long street (Sandhu Ashram road) into pedestrian street. The success of this
holds in Delhi in 1999-2000, Trans- event led to other opportunities and GWAF conducted an experiment in central zone
portation Research & Injury Preven- as car free zone. In later phase, Shashtri chowk road (800m long )and Wool bazaar
tion Programme (TRIPP), IIT-Delhi. road (400 m long ) were converted into car free zone. This program improved the air
quality, law and order, traffic related issues, and provided healthy social life. (Kumar,
Planning and Design for Pedestrian Safety, 2009)
RITES Ltd. (2005), Integrated
Multi-modal Public Transport The successful implementation car free zone has been beneficial in many ways, not
only by decongesting the market. The local market traders near clock tower are now
Network for NCTD, Final Report pre- happy with the ban of cars and the trading in the shop has increased by 25% since the
pared for GNCTD, 2005. ban.
77% of people accept that pedestrian streets in Fazilka have brought the community
RITES Ltd. (2010), Travel Demand back to the street culture. The pedestrian street will promote walking trips from
Forecast Survey prepared for GNCTD, various residential zones of the city to market areas and 64% people accept that pedes-
2010. trian streets has improved the air quality in Fazilka. Pollution level in central area is
reduced by 3%. (Asija, Pedestrianisation need of the hour: a case study of fazilka town,
2009)
Sen, Akshaya K. (2007), Optimal
Fazilka is a historical town and is likely to have potential for tourism development.
Pricing of Urban Road Transport,
Following the successful implementation of the project, 70% people agree that car
Unpublished Ph.D Thesis, Indian free zone will help to enhance tourism potential for the city. Car free zone has led
Institute of Technology, Delhi, 2007. to reduced accidents and has increased pedestrian safety during day and night time.
A large majority (91%) of people have indicated that they would like to see such
Vickrey, W.S. (1963), Planning in improvements in pedestrian safety throughout the city along with allowing for slow
moving traffic.
Urban and Sub-urban Transport,
American Economic Review, 53, 452- Source: Environmental Planning Collaborative, ‘Sustainable Urban Transport : Princi-
ples & Guidelines for Indian Cities (Draft Report), 2013.
465.
OCTOBER 2013 VOLUME 14 NO. 2 SHELTER 13You can also read