Simulation of long-term changes in environmental factors and grassland composition in three protected areas of Serbia - Tuexenia.de
←
→
Page content transcription
If your browser does not render page correctly, please read the page content below
Tuexenia 37: 431–446. Göttingen 2017.
doi: 10.14471/2017.37.017, available.g.le online at www.tuexenia.de

 Simulation of long-term changes in environmental factors
            and grassland composition in three
                 protected areas of Serbia
             Simulierte Langzeitveränderungen von Umweltbedingungen
              und Graslandvegetation in drei Schutzgebieten in Serbien

            Dragana Čavlović1, *, Jelena Beloica1, Dragica Obratov-Petković1,
                       Vladimir Đurđević2 & Olivera Košanin1
       1
           Faculty of Forestry, University of Belgrade, Kneza Višeslava 1, 11000 Belgrade, Serbia;
            2
             Institute for Meteorology, faculty of Physics, University of Belgrade, Dobračina 16,
                                           11000 Belgrade, Serbia
                        *Corresponding author, e-mail: dragana.cavlovic@sfb.bg.ac.rs

                                                 Abstract
    Intense direct and indirect human pressure has been imposed on grasslands throughout their range.
Mostly due to the constant need for more food production or due to changes in environmental condi-
tions, grasslands as habitats are expected to become highly endangered. The aim of this study was to
estimate the grasslands’ ecological response to future climate and environmental changes.
    The study took place in three ecologically different grassland communities in three protected natural
areas of Serbia (Southeastern Europe), following the same methodology. The study sites were:
1) Peštersko polje Special Nature Reserve (SNR), 2) Deliblato sands SNR (its southern part: Labudovo
okno) and 3) Zasavica SNR.
    Climate change was simulated for mean temperatures and precipitations using the Eta Belgrade
University-Princeton Ocean Model (EBU-POM) climate model, for the A1B Intergovernmental Panel
on Climate Change (IPCC) emission scenario covering the 1951–2100 period and insolation and volu-
metric soil moisture content for the 1979–2100 period.
    Grassland vegetation was analysed at all three sites. One representative plant community per site
was selected for further analysis and simulation of ecological changes. One plot was positioned inside
each of the above-mentioned communities, all vascular plant species inside the plot were recorded, and
soil samples were taken. Ecological Optima (EO) for moisture and temperature were calculated from
modified Ellenberg’s plant indicator values of recorded species.
    The plants’ response to climate and environmental changes was simulated using the VSD+ model
for the 2010–2100 period. The data obtained from the model were further analysed with Canonical
Correspondence Analysis (CCA).
    Overall results show that the temperature rise, along with the irregular precipitation at all three sites,
will lead to a drop of the relative abundance of many native species in the period between 2040 and
2060. The low obtained Habitat Suitability Index for the future means that there will be either unfa-
vourable environmental conditions for the development of grasslands, or the species we analysed were
untypical. Cosmopolitans and xerothermic species will be more accustomed to the new conditions.
Grasses will be the most resilient functional group according to our study.
    It may be concluded that the functional group of grasses will also play the leading role in future
grasslands at the studied sites.

 Manuscript received 02 December 2016, accepted 30 June 2017
 Co-ordinating Editor: Anikó Csecserics                                                                  431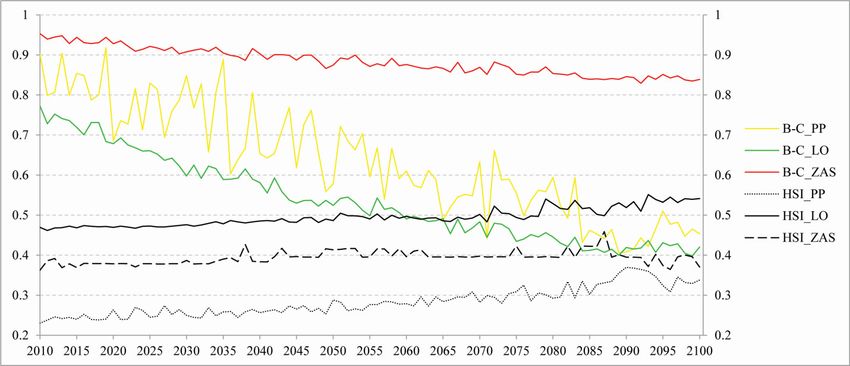
Keywords: climate change, habitat suitability index, plant community simulation, Serbian grasslands,
VSD+ model
Erweiterte deutsche Zusammenfassung am Ende des Artikels

                                       1. Introduction
    According to the Corine land cover map (CLC 2012), grasslands (pastures and natural
grasslands) cover 5.08% of the total territory of Serbia. Zonal distribution of grasslands is
related to orography. 25.4% of all grasslands are in the valleys of the lowland (up to 300 m),
37.8% are in the hilly region (300–1000 m) and 36.8% in the mountain region (above
1000 m). The grasslands of hilly and mountain region are similar with respect to their floris-
tic composition and thus usually treated as a single group, namely as grasslands of the hilly-
mountainous region. These are the floristically richest grasslands, especially in the forest
zone (STOSIC & LAZAREVIC 2009). They are also of the greatest significance for livestock
production since they are the main or even only source of livestock feed in this region. Now-
adays natural grasslands in Serbia are seriously threatened. The abandonment of grasslands,
poor management and insufficient grazing pressure lead to changes in species composition
and to rapid spread of shrubs and tree species (DAJIĆ STEVANOVIĆ et al. 2008, AĆIĆ et al.
2013).
    There have been very few studies that deal with the response of grasslands to climate
change in Serbia (e.g., BELOICA et al. 2015), and grassland biodiversity is generally under-
studied throughout Southeastern Europe (DENGLER et al. 2014). On the other hand, a global
study shows that grassland productivity will increase, especially in the humid temperate and
Mediterranean biome (PARTON et al. 1995). Most native grasslands are likely to contain a
high diversity of drought-tolerant species; hence local native species may help to maintain
ecosystem functioning under changing drought regimes (CRAINE et al. 2013). However,
there is also the risk that drought-tolerant invasive plants will extend their cover in the future
(KELEMEN et al. 2016, WESCHE et al. 2016). Most recent studies including Coupled Model
Intercomparison Project (CMIP5, in: IPCC 2014) have confirmed a tendency towards drier
and warmer climate in the Mediterranean region (which includes Serbia) in the next century
(MARIOTTI et al. 2015, DELL’AQUILA et al. 2016). Future rates of forced warming and drying
(by greenhouse gasses, anthropogenic aerosols and natural forcing) in the Mediterranean are
projected to be higher than in the past century (MARIOTTI et al. 2015). CRAINE et al. (2013)
argued that drought will shift the functional composition of grasslands in ways we do not yet
understand. However, species-rich grasslands will have sufficient functional diversity to help
to maintain ecosystem functioning despite changes in climate.
    JONES et al. (2016) cite evidence-based arguments that grassland ecosystems will be
highly responsive to future changes in soil moisture availability caused by altered precipita-
tion variability and increased duration and frequency of dry periods between rain events.
    Grasslands will likely respond more rapidly to climate and environmental changes than
forests, and changes in vegetation cover will be much easier to detect. Therefore, the aim of
our study was to estimate the grasslands’ response to future climate and environmental
changes. First we tried to detect what changes in climate patterns are expected under the
A1B scenario (IPCC 2014) for the studied region, according to the EBU-POM model. Then
we analysed possible changes in the species composition of grassland vegetation in three
selected plots in Serbia, which emerged as a result of the Very Simple Soil Dynamic model
simulation (VSD+ v. 5.5, 2001, 2015, Alterra, CCE; MOL-DIJKSTRA & REINDS 2017).

432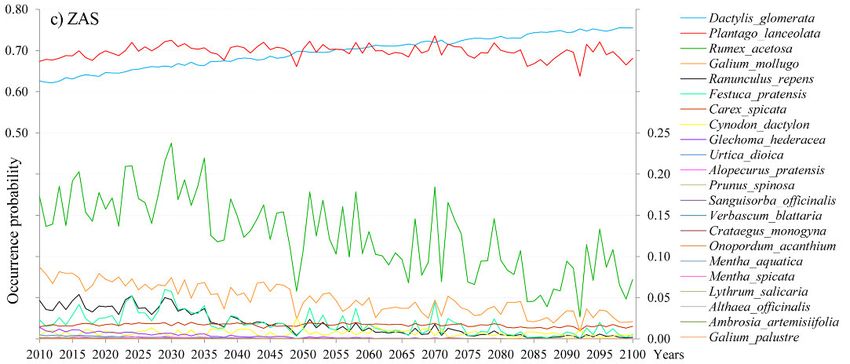
2. Materials and Methods

                                             2.1 Study sites
     Three sites in different parts of Serbia (Southeastern Europe) were selected to study; their basic
characteristics are presented in Table 1. The criteria for the selection of sites were that all sites are
under the national protection regime and designated as Ramsar sites, i.e. internationally important
habitats for migratory birds (NAVID 1989).
     All sites have distinct environmental conditions. The first site, Peštersko polje (PP) Special Nature
Reserve, is located on the Pešter plateau, at an altitude of around 1200 m, with a climate for which the
term “Serbian Siberia” has been coined: The average temperature of the warmest month is around
15.3 °C, summers are short and winters harsh (the lowest temperature ever measured in Serbia,
-39.5 °C, was recorded at this location). The precipitation regime is continental, with a precipitation
maximum in May, but the high altitude and the Mediterranean impact generate a secondary maximum
in November (Republic Hydrometeorological Service of Serbia, RHMS, http://www.hidmet.gov.rs/ciril/
meteorologija/klimatologija_srednjaci.php, accessed 2016–08–29). Grasslands are poorly researched at
the PP site, and only little data is available. The studied community was determined as Ass. Nardetum
strictae Grebenščikov 1950 (RAKONJAC et al. 2008) and therefore classified according to the European
Nature Information System (EUNIS, http://eunis.eea.europa.eu/habitats/1218, accessed 2016–08–29) as
“mat-grass swards” habitat type (LAKUŠIĆ et al. 2005). Natural grassland is the dominant land cover
type, followed by pasture and complex cultivation pattern type (CLC 2012). Dominant influences are:
climate, the river Boroštica (which sometimes floods the area) and grazing.

Table 1. Basic information on the studied sites. SNR – Special Nature Reserve. *Southern part of
Deliblatska peščara (Deliblato sands) SNR.
Tabelle 1. Grundinformationen zu den drei serbischen Untersuchungsgebieten. SNR = Special Nature
Reserve. *, Südteil des Delibater Sande (Deliblatska peščara)-SNR.

Site                                   PP                      LO                       ZAS
Name                             Peštersko polje        Labudovo okno                 Zasavica
Protection status                     SNR                   SNR*                       SNR
Latitude (° N)                      43.08050               44.797222                 44.939611
Longitude (° E)                     20.11475               21.227417                 19.529333
Altitude (m)                          1158                     68                        78
Annual mean temperature (°C)          6.09                  14.73                      10.84
Annual sum of precipitation          710.16                 641.09                     614.72
(mm)
Parent material                 Lacustrine/marsh           Aluvium                    Aluvium
                                   sediments
Soil type WRB                   Haplic Planosol        Gleyic Phaeosem      Gleyic Phaeosem (Eutric)
                                    (Eutric)                 (Eutric)
EUNIS habitat type                   E1.71                    E2.54                  E2.55
                                Mat-grass swards     Meadows of the steppe Meadows of the steppe zone,
                                                      zone, dominated by          dominated by
                                                      Agrostis stolonifera    Alopecurus pratensis
Association                    Nardetum strictae      Trifolio-Agrostietum   Alopecuretum pratensis
                               Grebenščikov 1950     stolonifere Marković Kojić, Mrfat-Vukelić, Dajić,
                                                              1973         Djordjević- Milošević 2003

                                                                                                     433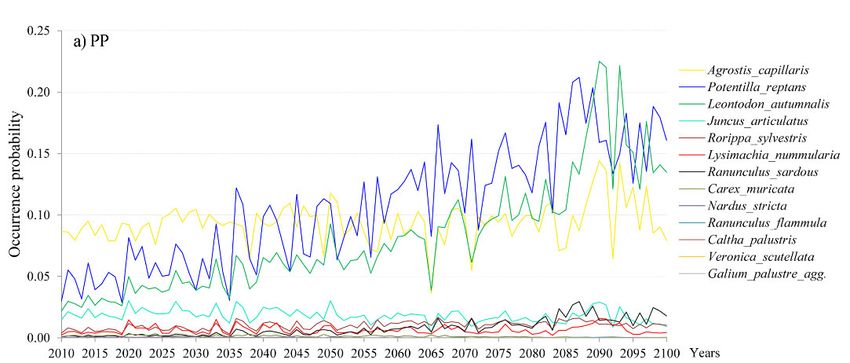
The Labudovo okno (LO) site is the southern part of the Deliblato sands Special Nature Reserve lo-
cated in the South of the Banat (Pannonian Plain). The climate is Pannonian with a Danubian precipita-
tion regime. “Košava”, a strong, winter-specific south-eastern wind, has a special influence, with
a wind force of 5.5 Beaufort (11 m/s) (RHMS). The grassland vegetation is described as Ass. Trifolio-
Agrostietum stolonifere Marković 1973 with high anthropogenic influence, and classified according to
EUNIS (LAKUŠIĆ et al. 2005) as “meadows of the steppe zone, dominated by Agrostis stolonifera”.
This site is frequently mowed and grazed. The dominant land cover is natural grassland, surrounded by
transitional woodland-shrub and a complex cultivation pattern (CLC 2012).
    The third site, Zasavica Special Nature Reserve (ZAS), is located between the Srem and Mačva re-
gions. The climate is also Pannonian, influenced by the Danubian precipitation regime. The Valjevac
pasture, where the research was conducted, is claimed to be the only natural pasture left in the area. It
has been protected since 1997 and restored not long after (Institute for Nature Conservation of Vojvo-
dina Province), so nowadays only grazing and occasional shrub removing is allowed. The grassland
community at the studied site is defined as Alopecuretum pratensis Kojić, Mrfat-Vukelić, Dajić,
Djordjević-Milošević 2003 and therefore classified as “meadows of the steppe zone dominated by
Alopecurus pratensis” (LAKUŠIĆ et al. 2005). According to CLC (2012), the most dominant land cover
type at the studied site is natural grassland, surrounded by land principally occupied by agriculture with
significant areas of natural vegetation and by broadleaved forests.

                                        2.2 Climate research
    Data regarding the expected climate conditions were obtained by applying a dynamic downscaling
technique using a coupled atmosphere-ocean regional climate model EBU-POM (DJURDJEVIC & RAJ-
KOVIC 2008, KRZIC et al. 2011) and the moderate A1B scenario (IPCC 2014) for greenhouse gas emis-
sions. The whole model simulation covers the 1951–2100 period. For initial and lateral boundary condi-
tions, data from the ECHAM5/MPI-OM model (ROECKNER et al. 2003) simulation were used.
ECHAM5 model results are available from the CERA database (http://cera-www.dkrz.de/, accessed
2016–08–29). For the surface air temperature and the daily precipitation model, bias was removed
using observed daily time series of the same variables of the normal climate period 1961–1990 obtained
from RHMS (Supplement E1), following the so-called bias correction statistical method (RUML et al.
2012). Climate data were extracted from geospatial files for the exact coordinates of the studied sites.
The parameters for the simulation were: temperature, precipitation, insolation and soil moisture content.

                              2.3 Floristic and vegetation research
     Grassland vegetation was studied at all three sites and under the different climate and environmen-
tal conditions. One permanent plot was selected per site and observed for three consecutive years (2010,
2011 and 2012). Each plot was selected in a way to represent the most dominant grassland type in the
area. The plot size was 10 m × 10 m, and all vascular plants were recorded according to the BRAUN-
BLANQUET (1965) method. Standard floristic research was conducted; species were determined accord-
ing to JÁVORKA & CSAPODY (1975), and nomenclature followed the Euro+Med PlantBase
(http://ww2.bgbm.org/EuroPlusMed/ accessed 2016–08–29). A cumulative table with relative species
cover and ecological indices is presented in Supplement E2.
     Modified Ellenberg’s indicator values of plant species were determined according to KOJIĆ et al.
(1997) and used for the calculation of Ecological Optima (EO). The Ecological Optimum for moisture
(EOm) and for temperature (EOt) were calculated following the weighted averaging method also sug-
gested by KOJIĆ et al. (1997). According to its EO, each community was positioned on a moisture and
temperature gradient using a scale suggested by the authors (Supplement E3).
     Habitat types were determined according to the EUNIS database and the Habitats of Serbia Hand-
book with descriptions and basic data (LAKUŠIĆ et al. 2005).

434
2.4 Soil properties research
Soil samples were taken from each studied plot at 20 cm depth in order to test the chemical and
physical soil properties. All analyses were conducted at the Faculty of Forestry, University of Belgrade,
according to the following methods: pH (in H2O) was measured electrometrically using a pH meter; the
sum of exchangeable bases (EBc) was determined using the KAPPEN (1929) method; the total capacity
of cation adsorption (T) and the degree of base saturation (V%) were calculated according to HISSINK
(1925); the CaCO3 content was measured with a Scheibler calcimeter; the total organic carbon content
was determined by the TYURIN (1931) method; and total nitrogen was measured by the Kjeldahl macro
method (BREMNER 1960). The analyses of the mechanical composition of the soil were performed by
the pyrophosphate B method. Soil types were determined according to the WORLD REFERENCE BASE
FOR SOIL RESOURCES (2006) following the nomenclature suggested by KNEŽEVIĆ et al. (2011).
2.5 Models for ecological simulation
Originally, VSD+ is a soil dynamic model for the estimation of soil property changes under the in-
fluence of air pollution and climate change. The VSD+ model that was used in this study for the simu-
lation of changes in species occurrences from 2010 to 2100 is a soil-vegetation model. It is a dynamic
soil chemistry model specifically made to calculate the effects of the deposition of nitrogen (N) and
sulphur (S) on soil acidification and eutrophication (REINDS et al. 2014). We used a pre-processor
model (MetHyd v1.5.1, 2010, 2013, Alterra, CCE; SLOOTWEG et al. 2010) in conjunction with the
VSD+ model for calculating daily evapotranspiration, soil moisture, percolation (runoff) and parame-
ters related to (de)nitrification and mineralisation.
The PROPS (Probability of Occurrence of Plant Species) module v.5.5.1. (Alterra, CCE; REINDS et
al. 2015) has been used for the simulation of changes in plant communities as a post process model
(VSD+PROPS). This model was developed to enable assessments of changes in plant species diversity,
which occur as a response to changes in climate and air pollution (REINDS et al. 2015). The PROPS
model estimates the occurrence probability (OP) of plant species as a function of abiotic conditions,
such as N deposition, soil pH and C:N ratio in the soil, and climatic variables such as temperature and
precipitation. The PROPS model (shortly described by REINDS et al. 2012) is based on a dataset of over
40,000 vegetation relevés with measured abiotic soil parameters from across Europe. Input variables for
the VSD+PROPS model in our study were: climate parameters (temperature, precipitation, insolation
and soil moisture content), physical and chemical soil properties and S and N depositions of the studied
vegetation plots. The model output is an aggregate indicator for species occurrence in a habitat – the
Habitat Suitability Index (HSI). In this study, besides HSI, the Bray-Curtis index is used as a measure
of dissimilarity. The HSI is defined as an arithmetic mean of the normalised/log-transformed probabili-
ties of occurrence of the species of interest (POSCH et al. 2014). While modelling the HSI, all plants
species per site were included in the analysis. The other output of the model, the Bray-Curtis index,
explains the dissimilarity in species composition (BRAY & CURTIS 1957). It was calculated by compar-
ing the reference OP (obtained from the model for the time when the relevés were taken) to the future
OP (obtained by the simulation). The relationship between observed abundance and modelled occur-
rence probabilities was analysed by Pearson’s correlation.
After the simulation, a Canonical Correspondence Analysis (CCA) was performed using Past 3.14
(HAMMER et al. 2001) software. OP (as species scores) and environmental variables were obtained as
a result of the simulation for the 2010–2100 period. In order to track changes in the communities that
will occur over time, we used scores for every tenth year in the above-mentioned period of time.
4353. Results
3.1 Climate simulation
Results from the climate simulation are synthesised in Table 2, showing the differences
between the normal observation period (1961–1990) obtained from RHMS (Supplement E1)
and the last 30 years of the simulation period (2071–2100).
For the analysed A1B scenario, the average annual temperature will increase by nearly
2.6 °С at all sites. It is projected that July will be the warmest month. According to the simu-
lation, the biggest change in temperature is projected exactly for the warmest month, July
(average increase of 7.37 °С). The precipitation amount will decrease by 55.3 mm on an
annual level (Table 2). Reference values (Supplement E1) indicate that June will be the
month with the highest amount of precipitation in both regions, with Danubian (LO, ZAS)
and Continental (PP) precipitation regimes. However, the projected values of precipitation
are quite different. The monthly distribution of precipitation will change significantly, with
low values in summer and high values in winter. Particularly, the growing season will appar-
ently become the driest season. The annual amount of precipitation in the region with Danu-
bian regime (LO, ZAS) will decrease considerably, by 50.14 mm and 47.21 mm, respective-
ly. In the region with Continental regime (PP), there will also be a marked change in the
amount of precipitation in June (-22.42 mm), but more importantly, the secondary November
maximum will disappear (Table 2). Insolation is not about to change much; it will increase
on average by 336.4 h/year. Soil moisture content will experience a slight decrease of 0.22
m3 m-3/year on average at all sites.
The increase of the mean annual temperature will affect all three sites equally (+2.6 °C).
The warmest site will remain LO, with a mean temperature of 28.9 °C during the warmest
month (July). PP will remain the coldest site (8.7 °C annual temperature), with the lowest
July temperature increase (+6.44 °C). The driest site will remain ZAS (568 mm), although
the biggest decline of precipitation in the driest month will occur at the LO site (-50.14 mm).
Table 2. Changes of climate parameters. PP – Peštersko polje, LO – Labudovo okno, ZAS – Zasavica,
Av. – average value. All results were obtained by comparing data for the reference period (1961–1990)
with data from the simulation for the period 2071–2100 according to the A1B scenario. Temperatures
were calculated as annual averages. The biggest changes of temperatures and precipitations are on
monthly average level. Precipitation, insolation and soil water changes were calculated as average of
annual sums.
Tabelle 2. Prognostizierte Klimaveränderungen nach Simulationswerten (nach dem A1B-Szenario) für
2071–2100. Die drei serbischen Untersuchungsgebiete waren: PP = Peštersko polje, LO = Labudovo
okno, ZAS = Zasavica; Av. = Mittelwert über die drei Gebiete. Die Referenzperiode umfasste den
Zeitraum von 1961–1990. Die Temperaturwerte wurden als Jahresmittel berechnet. Die größten Tempe-
ratur- und Niederschlagsänderungen zeigten die Monatsmittel. Die Veränderungen von Niederschlag,
Einstrahlung und Bodenwassers wurden als mittlere Jahressummen berechnet.
Sites Temperature Biggest temp. change Precipitation Biggest prec. change Insolation Soil water
(°C) (°C) / month (l m-2) (l m-2) / month (h/year) (m3 m-3/year)
PP ա 2.58 +6.44 /July բ 67.7 -26.08 / Nov. ա 480.4 բ 0.15
LO ա 2.55 +7.97 / July բ 52.5 -50.14 / June ա 337.6 բ 0.24
ZAS ա 2.57 +7.71 / July բ 45.8 -47.21 / June ա 191.1 բ 0.28
Av. ա 2.57 +7.37 բ 55.3 -41.38 ա 336.4 բ 0.22
436Even with a significant decrease in annual precipitation (-67.7 mm), PP will remain the
wettest site (642 mm/year). The highest increase in sunshine duration (+480 h/year) will
occur at this site, and it will have the lowest surplus in soil moisture.
3.2 Ecological optima
EOm and EOt of species were calculated for each plot. Therefore, each community was
positioned on a moisture and temperature gradient (according to Supplement E3), giving us
information about the ecological conditions of sites.
An EOm of 3.92 describes the PP plot as mesic (on the moisture gradient). EOt is 3.15,
which places this community in the mesothermic/thermophilic section. The LO plot has a
score of 2.85 for EOm and 3.27 for EOt. The community was declared submesic and meso-
thermic/thermophilic like the previous community. An EOm score of 3.05 places the ZAS
plot between the PP and the LO site. An EOt of 3.5 makes this community mesother-
mic/thermophilic as well.
It can be stated for the PP site that EO scores follow the climate data (Table 2): The
grassland at the PP site is the coldest and the wettest. As for the other two sites, permutation
occurred to a certain extent: The grassland at the LO site is the driest, and the grassland at
ZAS is the warmest (despite the climate data).
3.3 Soil properties
According to the soil data (Table 1, 3), the soil at PP is classified as Haplic Planosol (Eu-
tric) (WRB). It is alkaline with a soil pH of 8.01. The soil at the LO site is Gleyic Phaeosem
(Eutric) (WRB), also alkaline with a pH of 8.18. The ZAS soil is also Gleyic Phaeosem
(Eutric) (WRB), and it is alkaline with a soil pH of 7.78. Regarding the soil texture, the PP
site has a higher sand fraction than the other two sites. Soils at the LO and ZAS sites are
loamier.
Table 3. Physical and chemical soil properties. PP – Peštersko polje, LO – Labudovo okno,
ZAS – Zasavica. The soil was sampled at 20 cm depth. pH was determined from the H2O solution; EBc
represents the sum of exchangeable cations in the soil; T is the cation exchange capacity of the soil
(CEC); V is the base saturation of the soil; CaCO3 is the content of calcium carbonate; C is the carbon
content and C/N the carbon/nitrogen ratio. In case of active carbonate presence, the soil adsorption
complex was not measured. 0* indicates that the soil does not contain any active carbonate.
Tabelle 3. Physikalisch-chemische Bodeneigenschaften der drei serbischen Untersuchungsgebiete:
PP = Peštersko polje, LO = Labudovo okno, ZAS = Zasavica. Es wurde Boden in 20 cm Tiefe beprobt;
die pH-Werte beziehen sich auf eine wässrige Suspension; S = Summe der austauschbaren Kationen
des Bodens, T = Kationenaustauschkapazität (KAK) des Bodens, V = Basensättigung des Bodens,
CaCO3 = Kalziumkarbonatgehalt des Bodens, C = Kohlenstoffgehalt des Bodens, C/N = Kohlen-
stoff/Stickstoffverhältnis des Bodens; „-“ bedeutet: S und T wurden wegen aktiver Karbonatpräsenz
nicht gemessen; „0*“ bedeutet: Boden enthält kein aktives Karbonat.
Site Depth pH EBc T V CaCO3 C C/N Sand Silt Clay
(cm) (H2O) (cmol/kg) (%) (%) (%) (%) (%) (%)
PP 20 8.01 32.6 33.8 96.9 0* 1.8 11.3 38.1 29.5 32.4
LO 20 8.13 - - 100 11.4 2.1 11.3 80.1 15.8 4.10
ZAS 20 7.78 - - 100 4.8 7.3 8.5 7.5 61.2 31.3
4373.4 Species and vegetation changes (model simulation)
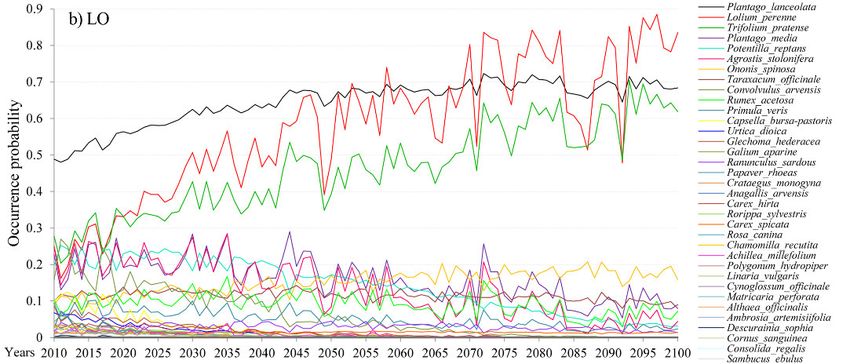
Changes of the OP of species per site are given in Figure 1a, b, c, and HSI and B-C index
are in Supplement E4. For the PP site, a very low OP is found for all species. The highest OP
is only 0.08 in 2010, and it gradually rises to 0.25 towards the last two decades of the 21st
century (Fig. 1a). The species can be divided into three groups, relative to their OP: species
that will disappear between 2040 and 2060 (e.g., Galium palustre, Veronica scutellata and
Ranunculus flammula); species with an OP that will remain on the same low level (e.g.,
Lysimachia nummularia, Rorippa sylvestris and Ranunculus sardous); and species with an
OP that will rise until the year 2100 (only Agrostis capillaris, Leontodon autumnalis and
Potentila reptans). For the LO site, values of OP are in the range from 0.01 to 0.49 in 2010.
For the majority of species, OP values decrease towards the end of the simulation period. In
the year 2100, they are all below 0.2 (Fig. 1b). The OP will rise for the following species:
Lolium perenne (0.83 in 2100), Plantago lanceolata (0.68 in 2100) and Trifolium pratense
(0.62 in 2100). At the ZAS site (Fig. 1c), only two species have a high OP at the beginning
as well as at the end of the simulation period (2010–2100), namely Dactylis glomerata (0.62
in 2010; 0.75 in 2100) and Plantago lanceolata (0.67 in 2010; 0.68 in 2100). The rest of the
species at this site have low starting OP values (below 0.25), which will further decrease
below 0.15 in 2100.
The correlation between OP and observed abundance is low: For PP it ranges from 0.32
to 0.46, for LO from 0.30 to 0.39, and for ZAS it is even negative (-0.29 to -0.05).
The minimum HSI is 0.23 (for the PP site in 2010), and the maximum is only 0.55 (for
the LO site in 2093). B-C will remain the highest at the ZAS site (0.95 in 2010; 0.84 in
2100). For the other two sites (PP and LO), B–C will decrease considerably (Supplement
E4).
Output variables from the model (as environmental variables) and OP (as species scores)
were used in CCA ordination. According to the CCA graphs (Supplements E5 a, b, c), the
only increasing parameter is temperature, while all the other parameters are expected to
decrease at all three sites. Also, the environment at the time of this research was cooler and
wetter for the grassland communities (Supplements E5a, b, c, position of 2010 site). It is
apparent that the species placed closer to the sites named 2100, 2090 and 2080 will be more
accustomed to the new conditions.
4. Discussion
Comparing and analysing data from the RHMS (Supplement E1) with the data obtained
from EBU-POM for the three sites, we found differences in temperature and precipitation
(Table 2) that correspond to trends in temperature (increasing) and precipitation (decreasing)
on a broader scale (MARIOTTI et al. 2015, DELL’AQUILA et al. 2016). However, it is im-
portant to emphasise the very high standard deviation of the precipitation data, implying
irregularity and uncertainty of precipitation itself.
The change of precipitation patterns may have a greater impact on plant communities
than the change of temperature, but not necessarily a straightforward impact (MORECROFT &
PATERSON 2006). In particular, the seasonal distribution and variability of precipitation can
be more important than its total amount (WELTZIN et al. 2003). The soil moisture content
change from our study is in accordance with the results of the simulation undertaken by
MIHAILOVIĆ et al. (2016) for the entire territory of Serbia.
438Fig. 1. Occurrence probability (OP) of species for the 2010–2100 period for a) the PP (Peštersko polje)
site, b) the LO (Labudovo okno) site and c) the ZAS (Zasavica) site obtained from the VSD+PROPS
model.
Abb. 1. Vorkommenswahrscheinlichkeit (OP) von Pflanzenarten im Zeitraum 2010–2100 auf Grundla-
ge des VSD+PROPS-Modells. Die drei serbischen Untersuchungsgebiete waren: a) PP = Peštersko
polje, b) LO = Labudovo okno, c) ZAS = Zasavica.
439Regarding the EOm of species, the PP site is categorised as mesic, meaning that its spe-
cies prefer moderate moist habitats without a dry period. The other two sites (LO and ZAS)
are submesic, with species that prefer mesic conditions, but can survive in xeric conditions
as well. Regarding the EOt, the species of all three sites belong to a mesothermic/
thermophilic ecological group, and a majority are sub-Mediterranean species. The summer
period is critical for the survival of certain ecological groups of plants. Comparing the eco-
logical groups at our sites with future climate data (Table 2), we can conclude that the sub-
mesophilic ecological group of plants at LO and ZAS should be able to overcome projected
hot and dry summers. Similarly, the mesophilic ecological group of plants at PP should
overcome the hot summer, since there is no dry period projected for this site. The precipita-
tion pattern is emphasised as the key driver of grassland changes (MORECROFT & PATERSON
2006, FRY et al. 2013), therefore species from the subxerophilic ecological group are more
desirable in grasslands. Species from the named group are represented with 28.33% at all
three studied sites (Supplement E2); that percentage should be higher in order to overcome
such climate conditions. The projected climate pattern (precipitation in the first place) will
have a negative impact on plants from the mesophilic and hydro-helophilic ecological group,
which are represented with 21.67% at all three sites.
All three sites have alkaline soils, which is typical for the Vojvodina province (LO, ZAS)
according to CIRIC et al. (2012). The very high pH value (8) and saturation with bases (96%)
at the PP site could origin from the surrounding parent material. MESIĆ et al. (2012) suggest
that the optimal C content for grasslands of similar type should be between 1 and 3%. The
PP and LO sites have a C content of around 2, which complies with their findings. Consider-
ing the C:N ratio, values at PP and LO are in agreement with those found by MESIĆ et al.
(2012) (around 11). The ZAS site stands out as an exception because of the high C content
(7.3%) and the lower C:N ratio (8.5). Those results imply that the nitrogen content in soils of
the ZAS site is also very high, possibly due to fertilisation from the surrounding arable fields
(CLC 2012). Decrease of other soil nutrients will not be significant, but in synergy with the
lack of soil moisture, it might contribute to change in grassland composition at all three sites.
It has been noticed for all three sites that species that prefer more humid conditions are at
the low bottom of the graphs (Figs. 1a, b, c) and gradually fade away. Grasses will be the
dominant functional group at all three sites. We found that the relation between OP and
abundance is weak, and generally correlations rank below 0.5 (GOMEZ 2014). Such low
correlation, especially at the ZAS site, could be explained by the high presence of undesired
species (e.g., invasive plants, non-native plants, shrubs) (ČAVLOVIĆ et al. 2012). Thus,
drought-tolerant invasive plants may extend their cover (KELEMEN et al. 2016, WESCHE et al.
2016) at the expense of declining native species.
The low HSI value also indicates that there are either unfavourable environmental condi-
tions for the development of grasslands or that untypical species were chosen for the analy-
sis. Nevertheless, simulation shows that HSI will rise towards the end of the century, imply-
ing better conditions for grasslands (Supplement E4). However, there are differences be-
tween studied sites. In contrast, the Bray-Curtis index of dissimilarity decreases over time,
meaning that the species composition is changing (some species are disappearing while the
others are expanding their population). Some authors (e.g., VARGA 1997) argue that the dry
grasslands of the lowlands of the Pannonian region are the least vulnerable in Europe with
respect to climate change, because their species are highly adapted to drought and heat.
However, a turnover is possible, with conditions becoming more Mediterranean – forest
steppe specialists and forest generalists may decrease, while Mediterranean species are pre-
440dicted to increase (KOVÁCS-LÁNG et al. 2000; THUILLER et al. 2005, WESCHE et al. 2016).
Plant species that require higher amounts of soil moisture (e.g., Galium palustre, Veronica
scutellata, Caltha palustris) are expected to decline and potentially disappear. According to
our simulation, between 2040 and 2060, species with a narrow range of tolerance, especially
towards moisture and temperature, will probably start to disappear. The species-poor sites,
such as PP, will probably become more open and ruled by only a few dominant species. The
stabilisation of the occurrence and non-occurrence (based on the OP) of the species in spe-
cies-rich grasslands, such as LO, may occur near the end of the century, assuming mowing
and grazing pressure of the same intensity.
A decline of similarity indices (e.g., B–C) under climate change and nitrogen deposition
scenarios has been confirmed in forest habitats as well (RIZZETTO et al. 2016).
An actual experiment of climate manipulation at Buxton grasslands (GRIME et al. 2008)
shows that overall composition and relative abundance of species resisted all 13 years during
the experiment. Summer droughts and soil moisture changes resulted in minor species loss
or change in species abundances.
Neither dynamical species-habitat models (such as VSD+) nor species distribution mod-
els (SDMs) include relations inside the communities of interest (with the possibility of up-
scaling). On landscape level, CZÚCZ et al. (2011) suggest the implementation of the adaptive
capacity of ecosystems as indicator framework, in compliance with SDMs or other types of
ecological studies that deal with climate change impact, adaptation and vulnerability.
Management regime has not been included in this study, but it should be part of future
research, since it was found that low intensity grazing management is necessary for main-
taining the high cover of grassland specialists (TÖRÖK et al. 2016). Land use change and
overexploitation, rather than climate change per se, establish the primary threats to the grass-
lands (GRIME et al. 2008).
5. Conclusion
According to our simulation, the temperature will increase, and precipitations will be ir-
regular and slightly decrease in the studied regions. Similar results have been obtained with
global models. Sunshine duration and soil moisture will not change drastically. Grasses (e.g.,
Agrostis capillaris, Lolium perenne, Dactylis glomerata) will be the ones to adapt the fastest
to the new environmental conditions. Plant species with high indicator values for humidity
will be the most vulnerable ones (e.g., Veronica scutellata, Rorippa sylvestris and Mentha
aquatica).
Erweiterte deutsche Zusammenfassung
Einleitung – In Serbien sind vor allem natürliche Grasländer stark gefährdet. Bislang liegen nur
sehr wenige Studien zur Auswirkung von Klimaveränderungen auf Grasländer in Serbien vor (z. B.
BELOICA et al. 2015). Zudem wurde die Biodiversität des Graslands in Südosteuropa bislang insgesamt
kaum untersucht (DENGLER et al. 2014). Das Ziel dieser Studie ist ein Beitrag zur Kenntnis, inwieweit
Pflanzengesellschaften auf veränderte Klimabedingungen reagieren.
Material und Methoden – Die Untersuchung wurden in drei Schutzgebieten in Serbien durchge-
führt; untersucht wurden drei ökologisch verschiedene Graslandgesellschaften. Die drei Untersu-
chungsgebiete waren das Peštersko polje-Special Nature Reserve (SNR), das Delibater Sande-SNR
(dessen südlicher Teil zum Gebiet Labudovo okno gehört) und das Zasavica-SNR. Zunächst wurde die
441Graslandvegetation der drei Gebiete analysiert. In jedem Gebiet wurde eine repräsentative Pflanzenge-
sellschaft ausgewählt um die ökologischen Veränderungen zu simulieren. Die ökologischen Optima der
Arten hinsichtlich Feuchte und Temperatur wurden auf Grundlage von Zeigerwerten (nach KOJIĆ et al.
1997) berechnet. Die Bodeneigenschaften wurden an den gleichen Orten bestimmt, wo die Aufnahmen
erstellt wurden. Die Namen der Pflanzenarten entsprechen der EURO+MED-Datenbank und die Habi-
tattypen EUNIS. Die Veränderungen der mittleren Temperatur und des mittleren Niederschlags nach
dem A1B-(IPCC 2014)-Szenario wurden auf Grundlage des Zeitraums 1951–2100 mit Hilfe von EBU-
POM-Klimamodellen simuliert. Die Einstrahlung und der volumetrische Bodenwassergehalt wurden
auf Grundlage des Zeitraums 1979–2100 simuliert. Die Reaktion der Pflanzen auf die Klima- und
Umweltveränderungen wurde mit Hilfe von VSD+ (Version 5.5, 2001, 2015 Alterra, CCE; MOL-
DIJKSTRA & REINDS 2017) für den Zeitraum 2010–2100 simuliert. Eine kanonische Korrespondenzana-
lyse der Pflanzengesellschaften für denselben Zeitraum wurde mit Hilfe von Past 3.14 (HAMMER et al.
2001) durchgeführt.
Ergebnisse und Diskussion – Unsere Ergebnisse auf Basis der EBU-POM-Berechnungen zeigen
für alle drei Gebiete eine Zunahme der Temperatur und Abnahme der Niederschläge; Letztere werden
nach unseren Berechnungen zudem zunehmend unregelmäßig stattfinden (Tab. 2). Nach unserer Vor-
hersage wird Juli der wärmste Monat werden, wobei unsere Simulierung für diesen wärmsten Monat
auch die stärkte Temperaturzunahme zeigt. Zudem wird die Vegetationsperiode die trockenste Zeit
werden. Auch die Einstrahlung wird nach unserer Vorhersage leicht zunehmen, während der Boden-
wassergehalt dagegen abnehmen wird. Nach einem Abgleich der ökologischen Gruppen der Pflanzen in
unseren Gebieten mit dem zukünftigen Klima (Tab. 2) kommen wir zu dem Schluss, dass die submeso-
philen Pflanzen die vorhergesagten heißen und trockenen Sommer in den beiden Gebieten Labudovo
okno und Zasavica überstehen könnten. Dies gilt auch für die ökologische Gruppe der mesophilen
Pflanzenarten im Gebiet Peštersko polje, für das unsere Simulationen keine Trockenperiode vorhersa-
gen. Dagegen werden Pflanzenarten mit engem Toleranzbereich hinsichtlich Feuchte und Temperatur
nach unseren Simulation auf Basis des VSD+-Models zwischen 2040 und 2060 wahrscheinlich ver-
schwinden (Abb. 4). Die artenarmen Flächen, wie sie im Gebiet Peštersko polje existieren, dürften in
ihrer Struktur zukünftig offener und auch zunehmend von einigen wenigen dominanten Arten be-
herrscht werden. Kosmopolitische und xerotherme Pflanzenarten werden an die hier vermutlich entste-
henden Bedingungen am besten angepasst sein. Gräser (z. B. Dactylis glomerata, Lolium perenne und
Agrostis capillaris) werden als die stabilste funktionelle Gruppe in der zukünftigen Artenzusammenset-
zung der Grasländer eine Führungsrolle einnehmen. Zudem könnten sich trockentolerante invasive
Pflanzenarten in ihrer Deckung (KELEMEN et al. 2016, WESCHE et al. 2016) auf Kosten der abnehmen-
den heimischen Arten ausbreiten. Unsere Simulation zeigte ebenfalls, dass gegen Ende des Jahrhun-
derts der Habitat Suitability Index ansteigt, was sogar bessere Bedingungen für Grasländer insgesamt
impliziert (s. Anhang E4). Umgekehrt nahm der Bray-Curtis-Ähnlichkeitsindex mit der Zeit ab, was
ebenfalls auf eine Veränderung der Artenzusammensetzung hindeutet weil einige Arten verschwinden
während andere Arten zunehmen werden. Eine nach der Simulation durchgeführte CCA (s. Anhang E5)
zeigt, dass die Temperatur als einziger Parameter ansteigen wird, während alle anderen untersuchten
Parameter abnehmen werden. Das Managementregime wurde in unserer Studie nicht berücksichtigt. Da
jedoch gezeigt wurde, dass eine extensive Beweidung für den Erhalt der Graslandspezialisten notwen-
dig ist (TÖRÖK et al. 2016), sollte das Managementregime in zukünftigen Untersuchungen berücksich-
tigt werden.
Acknowledgement
This research was part of the project ‘Studying climate change and its influence on the environment:
impacts, adaptation and mitigation’ (43007) financed by the Ministry of Education and Science of the
Republic of Serbia within the framework of integrated and interdisciplinary research for the period
2011–2017.
442Supplements
Additional supporting information may be found in the online version of this article.
Zusätzliche unterstützende Information ist in der Online-Version dieses Artikels zu finden.
Supplement E1. Mean monthly temperature (t), mean monthly sum of precipitation (p), and mean
annual temperature and annual precipitation sum obtained from RHMS for the period 1961–1990.
Anhang E1. Monatsmittel der Temperatur (t) und des Niederschlags (p) sowie Jahresmittel (Year) der
Temperatur und des Niederschlags nach Angaben des RHMS für den Zeitraum 1961–1990.
Supplement E2. Relative species percent cover and modified indicator values for the sites Zasavica
(C_ZAS), Labudovo okno (C_LO), and Peštersko polje (C_PP).
Anhang E2. Relative Prozentdeckung und modifizierte Zeigerwerte der Arten in den Gebieten Zasavi-
ca (C_ZAS), Labudovo okno (C_LO) und Peštersko polje (C_PP).
Supplement E3. Ecological optima (EO) of species regarding moisture (EOm) and temperature (EOt),
and their corresponding ecological groups according to KOJIĆ et al. (1997).
Anhang E3. Ökologische Optima der Arten bezüglich Feuchte (EOm) und Temperatur (EOt) und die
entsprechende ökologische Artengruppe nach KOJIĆ et al. (1997).
Supplement E4. Bray-Curtis index for Peštersko polje (B-C_PP), Labudovo okno (B-C_LO) and
Zasavica (B-C_ZAS); Habitat Suitability Indices for Peštersko polje (HSI_PP), Labudovo okno
(HSI_LO) and Zasavica (HSI_ZAS).
Anhang E4. Bray Curtis-Index für die Gebiete Peštersko polje (B-C_PP), Labudovo okno (B-C_LO)
und Zasavica (B-C_ZAS); Habitat-Eignungsindex für Peštersko polje (HSI_PP), Labudovo okno
(HSI_LO) und Zasavica (HSI_ZAS).
Supplement E5. Species occurrence probabilities from the VSD+PROPS model are taken as the spe-
cies scores for CCA.
Anhang E5. CCA der drei Gebiete a) PP = Peštersko polje, b) LO = Labudovo okno und c) ZAS =
Zasavica.
References
AĆIĆ, S., ŠILC, U., VRBNIČANIN, S., CUPAĆ, S., TOPISIROVIĆ, G., STAVRETOVIĆ, N. & DAJIĆ STEVA-
NOVIĆ Z. (2013): Grassland communities of Stol mountain (eastern Serbia). - Vegetation and envi-
ronmental relationships. – Arch. Biol. Sci. 65: 211–27.
BELOICA, J., ČAVLOVIĆ, D., ĐURĐEVIĆ, V., BELANOVIĆ SIMIĆ, S., OBRATOV-PETKOVIĆ, D., KADOVIĆ,
R. & BJEDOV, I. (2015): Ground vegetation composition change in beech forest and highland grass-
lands of Eastern Serbia. – Poster at the 25th Workshop CCE and 31st TF meeting of ICP on Model-
ling and Mapping in 2015 in Zagreb, Croatia.
BRAUN-BLANQUET, J. (1965): Pflanzensoziologie. Grundzüge der Vegetationskunde. 3rd ed. Springer,
Wien: 865 pp.
BRAY, J.R. & CURTIS, J.T. (1957): An ordination of the Upland Forest communities of Southern Wis-
consin. – Ecol. Monogr. 27: 325–349.
BREMNER, J. (1960): Determination of nitrogen in soil by the Kjeldahl method. – J. Agric. Sci. 55:
11–33.
ČAVLOVIĆ, D., OBRATOV-PETKOVIĆ, D., OCOKOLJIĆ, M. & ĐURĐEVIĆ, V. (2012): Climate change
impact on wetland forest plants of SNR Zasavica [In Serbian with English summary]. – Bull. Fac.
For., Univ. Belgrad. 105: 17–34.
CIRIC, V., MANOJLOVIC, M., NESIC, L. & BELIC, M. (2012): Soil dry aggregate size distribution: effects
of soil type and land use. – J. Soil Sci. Plant Nutr. 12: 689–703.
443CLC (2012): Corine land cover map. – URL: http://land.copernicus.eu/pan-european/corine-land-cover [accessed 2017–03–05]. CRAINE, J.M., OCHELTREE, T.W., NIPPERT, J.B., TOWNE, E.G., SKIBBE, A.M., KEMBEL, S.W. & FAR- GIONE, J.E. (2013): Global diversity of drought tolerance and grassland climate-change resilience. – Nat. Clim. Change 3: 63–67. CZÚCZ, B., CSECSERITS, A., BOTTA-DUKÁT, Z., KRÖEL-DULAY, G., SZABÓ, R., HORVÁTH, F. & MOL- NÁR, Z. (2011): An indicator framework for the climatic adaptive capacity of natural ecosystems. – J. Veg. Sci. 22: 711–725. DAJIĆ STEVANOVIĆ, Z., PEETERS, A., VRBNIČANIN, S., ŠOŠTARIĆ, I. & AĆIĆ, S. (2008): Long term grassland vegetation changes: Case study Nature Park Stara Planina (Serbia). – Commun. Ecol. 9: 23–31. DELL’AQUILA, A., MARIOTTI, A., BASTIN, S., CALMANTI, S., CAVICCHIA, L., DEQUE, M., DJURDJEVIC, V., DOMINGUEZ, M., GAERTNER, M. & GUALDI, S. (2016): Evaluation of simulated decadal varia- tions over the EuroMediterranean region from ENSEMBLES to Med-CORDEX. – Clim. Dyn. 2016: 1–20. DENGLER, J., JANIŠOVÁ, M., TÖRÖK, P. & WELLSTEIN, C. (2014): Biodiversity of Palaearctic grass- lands: A synthesis. – Agric. Ecosyst. Environ. 182: 1–14. DJURDJEVIC, V. & RAJKOVIC, B. (2008): Verification of a coupled atmosphere-ocean model using satellite observations over the Adriatic Sea. – Ann. Geophys. 26: 1935–1954. FRY, E.L., MANNING, P., ALLEN, D.G., HURST, A., EVERWAND, G., RIMMLER, M. & POWER, S.A. (2013): Plant functional group composition modifies the effects of precipitation change on grassland ecosystem function. – PloS ONE 8: e57027. GOMEZ, M.G.M. (2014): Impacts of nitrogen deposition and climate change on plant species diversity. – MSc Thesis in Environmental Sciences, Wageningen University. GRIME, J.P., FRIDLEY, J.D., ASKEW, A.P., THOMPSON, K., HODGSON, J.G. & BENNETT, C.R. (2008): Long-term resistance to simulated climate change in an infertile grassland. – Proc. Nat. Acad. Sci. 105: 10028–10032. HAMMER, Ø., HARPER, D.A.T. & RYAN, P.D. (2001): PAST: Paleontological statistics software pack- age for education and data analysis. – Palaeontol. Electron. 4 (1): art9. HISSINK, D.J. (1925): Base exchange in soils. – Trans. Faraday Soc. 20: 551–566. IPCC (Ed.) (2014): Climate change 2014: impacts, adaptation, and vulnerability. Part B: regional as- pects. Contribution of working group II to the fifth assessment report of the intergovernmental panel on climate change. – Cambridge University Press, Cambridge: 688 pp. JÁVORKA, S. & CSAPODY, V. (1975): Iconographia florae partis austro-orientalis Europae Centralis – Akadémiai Kiadó, Budapest: 555 pp. JONES, S.K., COLLINS, S.L., BLAIR, J.M., SMITH, M.D., & KNAPP, A.K. (2016): Altered rainfall patterns increase forb abundance and richness in native tallgrass prairie. – Sci. Rep., 6. doi:10.1038/ srep20120. KAPPEN, H. (1929): Die Bodenazidität. – Springer, Berlin: 363 pp. KELEMEN, A., VALKÓ, O., KRÖEL-DULAY, G., DEÁK, B., TÖRÖK, P., TÓTH, K., MIGLÉCZ, T. & TÓTHMÉRÉSZ, B. (2016): The invasion of common milkweed (Asclepias syriaca) in sandy old-fields – Is it a threat to the native flora? – Appl. Veg. Sci. 19: 218–224. KNEŽEVIĆ, M., ĐORĐEVIĆ, A., KOŠANIN, O., MILETIĆ, Z., GOLUBOVIĆ, S., PEKEČ, S., ŽIVOTIĆ, L.J., NIKOLIĆ, N. & ŽARKOVIĆ, M. (2011): Usklađivanje nomenklature osnovne pedološke karte sa WRB klasifikacijom (Harmonization of the nomenclature of basic soil map, with the WRB classification system) [In Serbian]. – Projekat Ministarstva životne sredine, rudarstva i prostornog planiranja i Univerziteta u Beogradu, Šumarski fakultet: 103 pp. KOJIĆ, M., POPOVIĆ, R. & KARADŽIĆ, B. (1997): Vaskularne biljke Srbije kao indikatori staništa (Vas- cular plants of Serbia, as environmental indicators) [In Serbian]. – Institut za istraživanja u poljop- rivredi „Srbija“, Institut za biološka istraživanja „Siniša Stanković“, Beograd: 160 pp. KOVÁCS-LÁNG, E., KRÖEL-DULAY, G., KERTÉSZ, M., FEKETE, G., BARTHA, S., MIKA, J., DOBI- WANTUCH, I., RÉDEI, T., RAJKAI, K. & HAHN, I. (2000): Changes in the composition of sand grass- lands along a climatic gradient in Hungary and implications for climate change. – Phytocoenologia 30: 385–407. KRZIC, A., TOSIC, I., DJURDJEVIC, V., VELJOVIC, K. & RAJKOVIC, B. (2011): Changes in some indices over Serbia according to the SRES A1B and A2 scenarios. – Clim. Res. 49: 73–86. 444
LAKUŠIĆ, D., BLAŽENČIĆ, J., RANĐELOVIĆ, V. et al. (2005): Staništa Srbije–Priručnik sa opisima i
   osnovnim podacima (Habitats of Serbia - Handbook with descriptions and basic data) [In Serbian]. –
   Inst. za botaniku i bot. bašta „Jevremovac “, Biološki fakultet, Univerzitet u Beogradu, Ministarstvo
   za nauku i zaštitu životne sredine Republike Srbije, Beograd: 632 pp.
MARIOTTI, A., PAN, Y., ZENG, N. & ALESSANDRI, A. (2015): Long-term climate change in the Mediter-
   ranean region in the midst of decadal variability. – Clim. Dyn. 44:1437–1456.
MESIĆ, M., BIRKAS, M., ZGORELEC, Z., KISIĆ, I., JURIŠIĆ, A. & ŠESTAK, I. (2012): Carbon content and
   C/N ratio in Pannonian and Mediterranean soils. - In: KISIĆ, I. & BAŠIĆ, F. (Eds.): Impact of tillage
   and fertilization on probable climate threats in Hungary and Croatia, soil vulnerability and protec-
   tion: 45–53. Szent Istvan University Press.
MIHAILOVIĆ, D.T., DREŠKOVIĆ, N., ARSENIĆ, I., ĆIRIĆ, V., DJURDJEVIĆ, V., MIMIĆ, G., PAP, I. &
   BALAŽ, I. (2016): Impact of climate change on soil thermal and moisture regimes in Serbia: An
   analysis with data from regional climate simulations under SRES-A1B. – Sci. Total Env. 571:
   398–409.
MOL-DIJKSTRA, J.P. & REINDS G.J. (2017): Technical documentation of the soil model VSD+; Status
   A.Statutory Research Tasks Unit for Nature & the Environment (WOT Natuur & Milieu), WOt-
   technical report 88. – URL: http://www.wge-cce.org/Methods_Models/Available_Models [accessed
   2017–03–29].
MORECROFT, M.D. & PATERSON, J.S. (2006): 7. Effects of temperature and precipitation changes on
   plant communities - In: MORISON, J.I.L. & MORECROFT, M.D. (Eds.): Plant growth and climate
   change: 146–164. Wiley-Blackwell.
NAVID, D. (1989): The international law of migratory species: the Ramsar Convention. – Nat. Resour.
   J. 1001–1016.
PARTON, W.J., SCURLOCK, J.M.O., OJIMA, D.S., SCHIMEL, D.S. & HALL, D.O. (1995): Impact of cli-
   mate change on grassland production and soil carbon worldwide. – Glob. Change Biol. 1: 13–22.
POSCH, M., HETTELINGH, J-P., SLOOTWEG, J. & REINDS. G.J. (2014): Deriving critical loads based on
   plant diversity targets. – In: SLOOTWEG, J., POSCH, M., HETTELINGH, J.-P. & MATHIJSSEN, L. (Eds):
   Modelling and mapping the impacts of atmospheric deposition on plant species diversity in Europe:
   CCE Status Report 2014. Report 2014–0075, RIVM: 47–53. Bilthoven, the Netherlands.
RAKONJAC, L.J., RATKNIĆ, M., VESELINOVIĆ, M. & NEVENIĆ, R. (2008): Meadow – pasture land
   vegetation in Pešter plateau [In Serbian with English summary]. – Šumarstvo 3: 163–169.
REINDS, G.J., BONTEN, L., MOL-DIJKSTRA, J., WAMELINK, W. & GOEDHART, P. (2012): Combined
   effects of air pollution and climate change on species diversity in Europe: First assessments with
   VSD+ linked to vegetation models. – In: POSCH, M., SLOOTWEG, J. & HETTELINGH, J.-P. (Eds.):
   Modelling and Mapping of Atmospherically-induced Ecosystem Impacts in Europe: CCE Status
   Report 2012, Coordination Centre for Effects, Report 2012–0193, RIVM: 49–61. Bilthoven, the
   Netherlands.
REINDS, G.J., MOL-DIJKSTRA, J., BONTEN, L., WAMELINK, W., DE VRIES, W. & POSCH, M. (2014):
   VSD+PROPS: Recent developments. – In: SLOOTWEG, J., POSCH, M., HETTELINGH, J.-P. &
   MATHIJSSEN, L. (Eds): Modelling and mapping the impacts of atmospheric deposition on plant spe-
   cies diversity in Europe: CCE Status Report 2014. Report 2014–0075, RIVM: 47–53. Bilthoven, the
   Netherlands.
REINDS, G.J., MOL-DIJKSTRA, J., BONTEN, L., WAMELINK, W., HENNEKENS, S., GOEDHART, P. &
   POSCH, M. (2015): Probability of Plant Species (PROPS) model: Latest Developments. – In:
   SLOOTWEG, J., POSCH, M. & HETTELINGH, J.-P. (Eds.): Modelling and mapping the impacts of at-
   mospheric deposition of nitrogen and sulphur: CCE Status Report 2015, Coordination Centre for Ef-
   fects, Report 2015–0193, RIVM: 55–62. Bilthoven, the Netherlands.
RIZZETTO, S., BELYAZID, S., GÉGOUT, J.C., NICOLAS, M., ALARD, D., CORCKET, E., GAUDIO, N.,
   SVERDUP, H. & PROBST, A. (2016): Modelling the impact of climate change and atmospheric N
   deposition on French forests biodiversity. – Environ. Pollut. 213: 1016–1027.
ROECKNER, E., BÄUML, G., BONAVENTURA, L. et al. (2003): The atmospheric general circulation
   model ECHAM5. Part I: Model description. – Max Planck Institute for Meteorology Rep. No. 349:
   127 pp.

                                                                                                   445
RUML, M., VUKOVIC, A., VUJADINOVIC, M., DJURDJEVIC, V., RANKOVIC-VASIC, Z., ATANACKOVIC, Z., SIVCEV, B., MARKOVIC, N., MATIJASEVIC, S. & PETROVIC, N. (2012): On the use of regional climate models: Implications of climate change for viticulture in Serbia. – Agric. For. Meteorol. 158–159: 53–62. SLOOTWEG, J., POSCH, M. & HETTELINGH, J.P. (2010): Progress in the Modelling of Critical Thresh- olds and Dynamic Modelling, including Impacts on Vegetation in Europe. – CCE Status Report 2010: 186 pp. STOSIC, M. & LAZAREVIC, D. (2009): Country pasture/forage resource profiles: Serbia and Montenegro. – URL: http://www.fao.org/ag/agp/agpc/doc/counprof/serbia/figure11_2.htm. [2017–06–15]. THUILLER, W., LAVOREL, S., ARAÚJO, M.B., SYKES, M.T., PRENTICE, I.C. & MOONEY, H.A. (2005): Climate change threats to plant diversity in Europe. – Proc. Nat. Acad. Sci. USA. 102: 8245–8250. TÖRÖK, P., VALKÓ, O., DEÁK B., KELEMEN, A., TÓTH, E. & TÓTHMÉRÉSZ, B. (2016): Managing for species composition or diversity? Pastoral and free grazing systems in alkali steppes. – Agric. Eco- syst. Environ. 234: 23–30. TYURIN, I.V. (1931): A new modification of the volumetric method of determining soil organic matter by means of chromic acid. – Pochvovedenie 26: 36–47. VARGA, Z. (1997): Dry grasslands of the Pannonian lowland: Relation of physiognomic structure and floristic composition to certain insect groups. – Phytocoenologia 27: 509–571. WELTZIN, J.F., LOIK, M.E., SCHWINNING, S. et al. (2003): Assessing the response of terrestrial ecosys- tems to potential changes in precipitation. – Bioscience 53: 941–952. WESCHE, K., AMBARLI, D., KAMP, J., TÖRÖK, P. TREIBER, J. & DENGLER, J. (2016): The Palaearctic steppe biome: A new synthesis. – Biodivers. Conserv. 25: 2197–2231. WORLD REFERENCE BASE FOR SOIL RESOURCES (2006): International soil classification system for naming soils and creating legends for soil maps. – World Soil Resources Reports No. 103. FAO, Rome: 132 pp. 446
You can also read


