STORM SURGE AND WAVES MODEL IMPROVEMENTS
←
→
Page content transcription
If your browser does not render page correctly, please read the page content below
2023 DRAFT COASTAL MASTER PLAN

STORM SURGE AND
WAVES MODEL
IMPROVEMENTS
ATTACHMENT E1

REPORT: VERSION 01
DATE: JANUARY 2021
PREPARED BY: ZACH COBELL AND HUGH ROBERTS

 COASTAL PROTECTION AND
 RESTORATION AUTHORITY
 150 TERRACE AVENUE
 BATON ROUGE, LA 70802
 WWW.COASTAL.LA.GOV
COASTAL PROTECTION AND
RESTORATION AUTHORITY
This document was developed in support of the 2023 Coastal Master Plan being prepared by the
Coastal Protection and Restoration Authority (CPRA). CPRA was established by the Louisiana
Legislature in response to Hurricanes Katrina and Rita through Act 8 of the First Extraordinary Session
of 2005. Act 8 of the First Extraordinary Session of 2005 expanded the membership, duties, and
responsibilities of CPRA and charged the new authority to develop and implement a comprehensive
coastal protection plan, consisting of a master plan (revised every six years) and annual plans. CPRA’s
mandate is to develop, implement, and enforce a comprehensive coastal protection and restoration
master plan.

CITATION
Cobell, Z. and Roberts, H., (2021). 2023 Draft Coastal Master Plan: Storm Surge and Waves Model
Improvements (Subtask 8). Version I. (p. 56). Baton Rouge, Louisiana: Coastal Protection and
Restoration Authority.

2023 DRAFT COASTAL MASTER PLAN. Storm Surge and Waves Model
Improvements 2

ACKNOWLEDGEMENTS This document was developed as part of a broader Model Improvement Plan in support of the 2023 Coastal Master Plan under the guidance of the Modeling Decision Team (MDT): Coastal Protection and Restoration Authority (CPRA) of Louisiana – Elizabeth Jarrell, Stuart Brown, Ashley Cobb, Catherine Fitzpatrick, Krista Jankowski, David Lindquist, Sam Martin, and Eric White University of New Orleans – Denise Reed This document was prepared by the 2023 Coastal Master Plan Storm Surge and Waves Team: Zach Cobell – The Water Institute of the Gulf Hugh Roberts – The Water Institute of the Gulf Elizabeth Jarrell – CPRA Sam Martin – CPRA Eric White – CPRA Angelina Freeman – CPRA The team would like to thank Max Agnew (United States Army Corps of Engineers, New Orleans District), Drs. Chris Massey and Noberto Nadal (United States Army Corps of Engineers, Engineering Research and Development Center, Coastal and Hydraulics Laboratory), and Andrew Cox (Oceanweather, Inc.) for assisting with access to data used in this report. 2023 DRAFT COASTAL MASTER PLAN. Storm Surge and Waves Model Improvements 3
EXECUTIVE SUMMARY
This attachment describes the process to update the 2023 Coastal Master Plan models to both
improve model skill in preparation for the upcoming Coastal Master Plan analysis, and create
Advanced Circulation (ADCIRC) and Simulating Waves Nearshore (SWAN model configurations that can
be used for multiple surge and wave modeling applications within Louisiana. As part of efforts to
improve the modeling for the 2023 Coastal Master Plan, exercises were undertaken to (1) simulate a
series of hurricanes and calibrate model parameters for use in Louisiana which are useful to multiple
Advanced Circulation (ADCIRC) modeling efforts statewide, (2) compute a reasonable initial condition
for offshore water levels, and (3) conduct review of the riverine flow rates for use within the Coastal
Master Plan so that they represent a statistically relevant value. To evaluate and calibrate model
parameters, the ADCIRC and Simulating Waves Nearshore (SWAN) models were used to simulate
seven historical hurricanes to analyze the performance of various parameterizations of air-sea drag
and bottom friction. A review was conducted of how each parameterization was applied in prior storm
surge modeling studies, including both those conducted throughout the country by Federal Emergency
Management Agency (FEMA) contractors and those conducted locally, to determine which
configurations showed the best performance in southern Louisiana. The seven historical hurricanes
were compared using high-water marks and time series water levels to understand how varying the
model parameters impacted both peak and transient parameters. An updated set of parameters is
recommended for use in the 2023 Coastal Master Plan. These parameters are applicable not only for
events which contain a well-defined hurricane vortex, but other events such as strong cold fronts or
prolonged wind events. Additionally, the flow rates used in the Mississippi and Atchafalaya Rivers for
synthetic hurricane events are updated. These updated flow rates are based on work conducted by
the United States Army Corps of Engineers (USACE) to select a value that provides statistical return
water levels approximate to a study which accounts for multiple flow rates being used for each
hurricane in the suite. Lastly, the offshore water level initial condition is updated from the values used
in the 2017 Coastal Master Plan. The 2017 Coastal Master Plan values were based on the post-
Katrina Interagency Performance Evaluation Taskforce (IPET) analysis, while the updated value used
for the 2023 Coastal Master Plan uses water levels recorded by the Coastwide Reference Monitoring
System (CRMS) network.

2023 DRAFT COASTAL MASTER PLAN. Storm Surge and Waves Model
Improvements 4
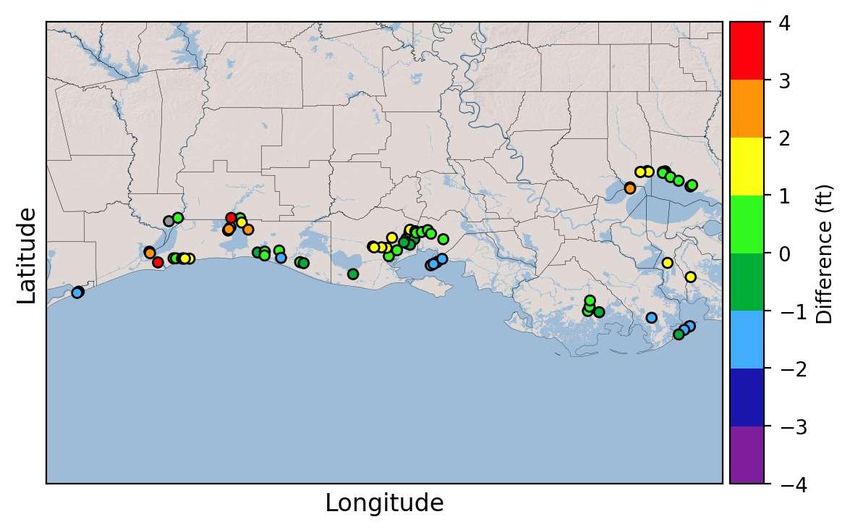
TABLE OF CONTENTS
COASTAL PROTECTION AND RESTORATION AUTHORITY ....................................... 2
CITATION ........................................................................................................ 2
ACKNOWLEDGEMENTS ...................................................................................... 3
EXECUTIVE SUMMARY ...................................................................................... 4
TABLE OF CONTENTS ........................................................................................ 5
LIST OF TABLES ............................................................................................... 6
LIST OF FIGURES ............................................................................................. 6
LIST OF ABBREVIATIONS .................................................................................. 9
1.0 INTRODUCTION ........................................................................................ 10
2.0 STORM SURGE AND WAVES MODEL PARAMETER DEVELOPMENT .................... 11
 2.1 Air-Sea Drag and Bottom Roughness Parameterization ................................................................ 11
 Air-Sea Drag Formulations ...................................................................................................................... 12
 Bottom Roughness Lower Limits............................................................................................................ 14
 2.2 Parameterization Test Space ........................................................................................................... 17
 2.3 Hurricane Katrina Screening Results .............................................................................................. 18
 2.4 Additional Storm Simulations .......................................................................................................... 24
 High-Water Marks Comparison .............................................................................................................. 29
 Timeseries Comparison .......................................................................................................................... 42
 Recommendation .................................................................................................................................... 49
3.0 INITIAL AND BOUNDARY CONDITIONS ........................................................ 50
 3.1 River Flow Rates ............................................................................................................................... 50
 3.2 Offshore Water Levels ...................................................................................................................... 51
4.0 REFERENCES ............................................................................................ 55

2023 DRAFT COASTAL MASTER PLAN. Storm Surge and Waves Model
Improvements 5
LIST OF TABLES
Table 1. Initial list of parameter sets evaluated. ................................................. 17
Table 2. Suite of historical storms used in performance evaluation. ...................... 18
Table 3. Hurricane Katrina screening analysis high-water mark comparisons. Note:
parameter sets in bold were selected for additional analysis. ............................... 23
Table 4. Modeled high-water mark comparisons for Hurricane Katrina for the selected
parameter sets. ............................................................................................. 29
Table 5. Modeled high-water mark comparisons for Hurricane Rita for the selected
parameter sets. ............................................................................................. 31
Table 6. Modeled high-water mark comparisons for Hurricane Gustav for the selected
parameter sets. ............................................................................................. 33
Table 7. Modeled high-water mark comparisons for Hurricane Ike for the selected
parameter sets. ............................................................................................. 35
Table 8. Modeled high-water mark comparisons for Hurricane Isaac for the selected
parameter sets. ............................................................................................. 37
Table 9. Aggregated high-water marks coastwide for all tested parameter sets. ..... 42
Table 10. Aggregated high-water marks in Louisiana for all tested parameter sets. 42

LIST OF FIGURES
Figure 1. Interaction between air-sea stress and bottom stress. ........................... 11
Figure 2. Garratt-type (left) and Powell-type (right) air-sea drag parameterizations.
.................................................................................................................... 13
Figure 3. Patterns of wind (A), directional spread and air-sea drag (C, D) during
Hurricane Katrina (Figure 10 in Holthuijsen 2012) showing the difference between
the directional spreading based metric (C, E) and Wu (D, F) which very closely
resembles Garratt. ......................................................................................... 14
Figure 4. Resulting bottom friction coefficient (Cd) for a Manning's n of 0.022 with
different lower limits versus water depth. .......................................................... 16
Figure 5. Hurricane Katrina track denoting central pressure (mb). ........................ 19
Figure 6. Maximum water surface elevation from the simulation of Hurricane Katrina
using parameter set 5 (ft; NAVD88 2009.55). .................................................... 20
Figure 7. Maximum wave height and direction from the simulation of Hurricane
Katrina using parameter set 5 (ft). ................................................................... 20
Figure 8. Hurricane Katrina comparison to observed high-water marks for parameter
set 5............................................................................................................. 21
Figure 9. Hurricane Katrina high-water mark regression for parameter set 5.......... 22

2023 DRAFT COASTAL MASTER PLAN. Storm Surge and Waves Model
Improvements 6

Figure 10. Storm tracks and associated central pressured used in the detailed
analysis of the select subset of model parameterizations. .................................... 24
Figure 11. Maximum water surface elevation from the simulation of Hurricane Rita
using parameter set 5 (ft, NAVD88 2009.55). .................................................... 25
Figure 12. Maximum water surface elevation from the simulation of Hurricane Gustav
using parameter set 5 (ft, NAVD88 2009.55). .................................................... 26
Figure 13. Maximum water surface elevation from the simulation of Hurricane Ike
using parameter set 5 (ft, NAVD88 2009.55). .................................................... 26
Figure 14. Maximum water surface elevation from the simulation of Hurricane Isaac
using parameter set 5 (ft, NAVD88 2009.55). .................................................... 27
Figure 15. Maximum water surface elevation from the simulation of Hurricane Nate
using parameter set 5 (ft, NAVD88 2009.55). .................................................... 28
Figure 16. Maximum water surface elevation from the simulation of Hurricane Harvey
using parameter set 5 (ft, NAVD88 2009.55). .................................................... 28
Figure 17. Hurricane Rita comparison to observed high water marks for parameter
set 5............................................................................................................. 30
Figure 18. Hurricane Gustav comparison to observed high-water marks for
parameter set 5. ............................................................................................ 32
Figure 19. Hurricane Ike comparison to observed high-water marks for parameter set
5. ................................................................................................................. 34
Figure 20. Hurricane Isaac comparison to observed high-water marks for parameter
set 5............................................................................................................. 36
Figure 21. Aggregated coastwide high-water marks for parameter set 5. .............. 38
Figure 22. Aggregated coastwide high-water mark regression for parameter set 5. 39
Figure 23. Louisiana-only aggregated high-water marks for parameter set 5. ........ 40
Figure 24. Louisiana-only aggregated high-water mark regression for parameter set
5. ................................................................................................................. 41
Figure 25. Modeled and observed water levels during Hurricane Katrina near the
IHNC Lock. Parameter set numbers in the figure refer to Table 3. ........................ 44
Figure 26. Modeled and observed water levels during Hurricane Katrina near the
IHNC Lock near the time of peak surge. Parameter set numbers in the figure refer to
Table 3. ........................................................................................................ 44
Figure 27. Hurricane Gustav modeled and observed water levels at Southwest Pass.
.................................................................................................................... 45
Figure 28. Hurricane Gustav modeled and observed water levels at Southwest Pass
near the time of peak surge. Parameter set numbers in the figure refer to Table 3. 46
Figure 29. Hurricane Ike modeled and observed water levels at Sabine Pass.
Parameter set numbers in the figure refer to Table 3. ......................................... 46
Figure 30. Hurricane Ike modeled and observed water levels at Sabine Pass near the
time of peak surge. Parameter set numbers in the figure refer to Table 3. ............. 47
Figure 31. Hurricane Nate modeled and observed water levels at Pilottown.
Parameter set numbers in the figure refer to Table 3. ......................................... 47

2023 DRAFT COASTAL MASTER PLAN. Storm Surge and Waves Model
Improvements 7
Figure 32. Hurricane Nate modeled and observed water levels at Pilottown near the
time of peak surge. Parameter set numbers in the figure refer to Table 3. ............. 48
Figure 33. Hurricane Harvey modeled and observed water levels at Calcasieu Pass.
Parameter set numbers in the figure refer to Table 3. ......................................... 48
Figure 34. Hurricane Harvey modeled and observed water levels at Calcasieu Pass
near the time of landfall. Parameter set numbers in the figure refer to Table 3. ..... 49
Figure 35. Relative sea level trend at NOAA 8729840 in Pensacola, FL. ................. 52
Figure 36.Computed mean sea level offset from NAVD88 2009.55 values at all
available stations in the CRMS network. ............................................................ 53
Figure 37. Computed mean sea level offset from NAVD88 2009.55 at coastal stations
in the CRMS network. ..................................................................................... 54

2023 DRAFT COASTAL MASTER PLAN. Storm Surge and Waves Model
Improvements 8

LIST OF ABBREVIATIONS
ADCIRC ............................................................ ADVANCED CIRCULATION MODEL
AEP .............................................................. ANNUAL EXCEEDANCE PROBABILITY
CFS………………………………………………………………………………………… CUBIC FEET PER SECOND
CPRA ................................. COASTAL PROTECTION AND RESTORATION AUTHORITY
CRMS ........................................... COASTWIDE REFERENCE MONITORING SYSTEM
FEMA ............................................... FEDERAL EMERGENCY MANAGEMENT AGENCY
GIWW ............................................................... GULF INTRACOASTAL WATERWAY
HSDRRS ..................... HURRICANE AND STORM DAMAGE RISK REDUCTION SYSTEM
IHNC ............................................................ INNER HARBOR NAVIGATION CANAL
IPET ................................. INTERAGENCY PERFORMANCE EVALUATION TASKFORCE
JPM-OS……………………………… JOINT PROBABILITY METHOD WITH OPTIMUM SAMPLING
NAVD88 ........................................... NORTH AMERICAN VERTICAL DATUM OF 1988
NOAA ........................... NATIONAL OCEANIC AND ATMOSPHERIC ADMINISTRATION
SWAN .................................................... SIMULATING WAVES NEARSHORE MODEL
USACE .............................................................. U.S. ARMY CORPS OF ENGINEERS
USACE-MVN ................ U.S. ARMY CORPS OF ENGINEERS’ NEW ORLEANS DISTRICT
USGS.......................................................................... U.S. GEOLOGICAL SURVEY

2023 DRAFT COASTAL MASTER PLAN. Storm Surge and Waves Model
Improvements 9

1.0 INTRODUCTION Over the past 20 years research related to the modeling of hurricane-driven storm surge and waves, and subsequent advancements in the understanding of the physical processes that occur during these storm events, has led to the improvement of hydrodynamic and wave numerical models such as the ADvanced CIRCulation model (ADCIRC; Luettich & Westerink, 2004). The master plan uses ADCIRC and the Simulating WAves Nearshore (SWAN) model to simulate the impact of hurricanes on present and future landscapes with and without the presence of coastal restoration and protection projects. In advance of the 2023 Coastal Master Plan, the ADCIRC storm surge model and SWAN spectral wave model have been updated to account for advancements in research and model development that have occurred since model development was completed for the 2017 Coastal Master Plan. As part of these model updates, the master plan team coordinated with surge and wave model developers to conduct model tests for applications in coastal Louisiana. This ensures that parties conducting storm surge modeling within the state of Louisiana have a common set of assumptions about the underlying physics to begin from and allows for consistency across studies. Participants include those from the following organizations: CPRA team members supporting the 2023 Coastal Master Plan, Lowermost Mississippi River Management Plan, and other studies United States Army Corps of Engineers (USACE) Engineering Research and Development Center Coastal Hydraulics Laboratory Louisiana State University USACE New Orleans District (MVN) This attachment describes the process to update the 2023 Coastal Master Plan models to both improve model skill in preparation for the upcoming master plan analysis, and create ADCIRC and SWAN model configurations that can be used for multiple surge and wave modeling applications within Louisiana. The model parameter testing process centered around extensive simulation of historical tropical storm events that made landfall in or near southern Louisiana. Several parameters were considered for analysis as part of this work. These parameters were: air-sea drag parameterization, limits for bottom roughness, river flow rate, and offshore initial water levels. The air-sea drag and bottom roughness parameters represented changes to the numerical parameters in the model, balancing the stress terms enacted by wind and the ocean floor. The analysis of river flow rates and initial water levels was completed to establish assumptions that will be applied during the 2023 Coastal Master Plan to initialize the model under conditions representative of hurricane season. 2023 DRAFT COASTAL MASTER PLAN. Storm Surge and Waves Model Improvements 10
2.0 STORM SURGE AND WAVES
MODEL PARAMETER DEVELOPMENT
The values used to parameterize the interaction of the wind with the ocean surface (air-sea drag) and
the resistance to flow caused by the seabed (bottom roughness) have been implemented in different
ways over time within the ADCIRC model. The work to develop a consistent set of parameterization
values for use in southern Louisiana, described in this document, includes the analysis of different
combinations of parameters and concludes with recommended values based on those model setups
that best replicate historical storm events.

2.1 AIR-SEA DRAG AND BOTTOM ROUGHNESS PARAMETERIZATION

The balance between air-sea drag and bottom roughness, and their associated stress vectors—air-sea
stress and bottom stress—is a critical component of accurately predicting water levels generated by
both tropical and non-tropical events, and has been a subject of particular interest in the ADCIRC
community since Hurricane Ike (2008; Hope et al., 2013). Figure 1 shows a schematic for the
interaction of the stress terms and lends insight into the importance of balancing the two parameters
as part of model setup. Understanding this balance is critical, yet the measuring of these parameters
during highly energetic events presents challenges and produces uncertainty in the parameterizations.

Figure 1. Interaction between air-sea stress and bottom stress.

2023 DRAFT COASTAL MASTER PLAN. Storm Surge and Waves Model
Improvements 11
AIR-SEA DRAG FORMULATIONS

Until 2012, the release version of the ADCIRC model code included the Garratt air-sea drag law
(Garratt, 1977) with a user-defined upper limit. The SWAN wave model uses a near-identical
formulation from Wu (1982). The Garratt air-sea drag law (1977) is shown in Equation (1) and Wu’s
formulation (1982) is shown in Equation (2).

 1 15 40
 = ( + ) (1)
 1000 20 600 10

 1 16 39
 = ( + ) (2)
 1000 20 600 10

where:

 Air-sea drag coefficient
 10 Wind speed at 10 meters above the surface

Historically, both Garratt and Wu’s formulations have been applied in ADCIRC and SWAN respectively,
using an upper limit to represent the wind speed at which the roughness of the sea surface begins to
decrease due to high wind shear. However, neither of these equations directly account for the
influence of waves on air-sea drag.

Analysis by Powell (2007) showed that air-sea drag coefficients vary dependent upon the location
relative to the center of a hurricane and the forward direction of the storm, rather than having a
uniform relationship computed throughout the storm’s wind field. Powell’s parameterization accounts
for the differences in wave and wind direction by dividing the storm into three sectors. In the front right
sector of the storm, where the counterclockwise winds of the hurricane and waves align, the drag
coefficient is lower than in the front left sector of the storm where the wind and waves travel in
opposite directions (Figure 2). This parameterized air-sea drag function was implemented into the
ADCIRC model and used for validation studies including those conducted during the 2017 Coastal
Master Plan (Dietrich et al., 2011b; Hope et al., 2013; Roberts & Cobell, 2017).

The Powell parameterization relies on the presence of a well-defined hurricane vortex within the model
domain in order to make assumptions about the direction of wave travel. Later work by Holthuijsen
(Holthuijsen et al., 2012; Figure 3) developed a parameterization that directly accounted for the
direction of wave travel by using directional spreading as a metric which can be calculated directly
using the SWAN wave model. This approach adds specificity to the air-sea interaction within the
ADCIRC and SWAN models but does require additional scrutiny as part of model testing as a

2023 DRAFT COASTAL MASTER PLAN. Storm Surge and Waves Model
Improvements 12
Holthuijsen-type approach has not yet been applied in large-scale storm surge studies.

There are multiple air-sea drag configurations that can be used to simulate hurricane storm surge. To
assess the optimal ADCIRC and SWAN model setup, multiple variations of Garratt-, Powell-, and
Holthuijsen-type air-sea drag formulations were tested for this analysis to determine which formulation
performed best through a wide range of event types for southern Louisiana. Note that SWAN always
uses Wu when ADCIRC uses either Garratt or Powell.

Figure 2. Garratt-type (left) and Powell-type (right) air-sea drag
parameterizations.

2023 DRAFT COASTAL MASTER PLAN. Storm Surge and Waves Model
Improvements 13
Figure 3. Patterns of wind (A), directional spread and air-sea drag (C, D) during
Hurricane Katrina (Figure 10 in Holthuijsen 2012) showing the difference
between the directional spreading based metric (C, E) and Wu (D, F) which very
closely resembles Garratt.

BOTTOM ROUGHNESS LOWER LIMITS

As with air-sea drag, the parametrization of bottom roughness can vary in ADCIRC. The ADCIRC model
includes the option to use multiple types of bottom friction parameterizations (i.e., Manning’s n, Chézy,
and a spatially varying but temporally constant quadratic coefficient). Manning’s n has been most
widely applied for nearshore studies and was the parameterization used in this analysis. Manning’s n
is converted to a quadratic friction coefficient for use in the governing equations using Equation (3).
The SWAN model uses a Madsen bottom friction formulation derived from the Manning’s n coefficient
specified in ADCIRC, which is converted to a friction length, , in Equation (4).

 2 (3)
 ( ) = 3
 √ℎ + η( )

2023 DRAFT COASTAL MASTER PLAN. Storm Surge and Waves Model
Improvements 14
where:

 ( ) Quadratic friction coefficient as a function of time
 Gravitational acceleration
 Manning’s n coefficient
 ℎ + η( ) Total water depth as a function of time

 1/6
 κ(ℎ+η( ))
 −[1+ ]
 ( ) = [ℎ + η( )]
 √ (4)

where:

 ( ) Roughness length as a function of time
 ℎ + η( ) Total water depth as a function of time, assumed to be equivalent to hydraulic radius
 κ Von Karman constant (0.4)
 Manning’s n coefficient
 Gravitational acceleration

Importantly, the quadratic friction coefficient applied in ADCIRC is dependent upon the cube root of
the total water depth, which indicates that friction in the depth-integrated model is much higher in
shallow areas and much lower in deep areas. Without a limit, this equation approaches zero for large
depths in deep portions of the ocean, as shown in Figure 4.

Many applications of ADCIRC, including work conducted by the Federal Emergency Management
Agency (FEMA) in Louisiana (Federal Emergency Management Agency Region Six, and the U.S. Army
Corps of Engineers, 2008), set the lower limit of bottom roughness ( ) to 0.0035. However, with this
limit on bottom roughness, the ADCIRC model required a Garratt-based air-sea drag formulation with a
drag coefficient higher than those documented in available literature to render model results that
compared well to historical observations.

More recent studies included a bottom roughness lower limit less than 0.0035 in response to a 2011
USACE analysis of Hurricane Ike, which propagated along the Louisiana-Texas shelf (Hope et al., 2013;
USACE, 2011). The Hurricane Ike analysis demonstrated that ADCIRC could not reliably replicate water
level time series pre-landfall for model setups that included a high bottom roughness limit.
Accordingly, the bottom roughness lower limits were reduced in ADCIRC and tested with varying air-sea
drag formulations. Literature suggests likely explanations for low friction conditions during high wind
events, including by Reid (1957). However, there is still active research underway in this area to
directly include the interaction of wind speed and bottom roughness within the depth-integrated
model. Building from USACE and Hope et al. studies in 2011 and 2013, the 2017 Coastal Master Plan
study (Roberts & Cobell, 2017) used a lower limit of zero for combined with a Powell-based air-sea

2023 DRAFT COASTAL MASTER PLAN. Storm Surge and Waves Model
Improvements 15
drag formulation. Similar to the USACE 2011 study, the 2017 Coastal Master Plan ADCIRC models
demonstrated a high level of model skill and were able to capture pre-storm forerunner effects for
Hurricane Ike.

Though the ADCIRC model validation conducted for the 2017 Coastal Master Plan study demonstrated
a high level of skill using a Powell-based air-sea drag formulation and a bottom roughness lower limit
of zero, the model parameters were re-examined in coordination with a broad group of ADCIRC users
for southern Louisiana to determine a setup that is suitable for the 2023 Coastal Master Plan and
other users. As described in the following section, lower limits of , ranging from zero to 0.0035
(Figure 4) were tested in combination with multiple air-sea drag configurations to assess which
formulation performed best through a wide range of event types for southern Louisiana.

Figure 4. Resulting bottom friction coefficient (C d) for a Manning's n of 0.022
with different lower limits versus water depth.

2023 DRAFT COASTAL MASTER PLAN. Storm Surge and Waves Model
Improvements 16
2.2 PARAMETERIZATION TEST SPACE

This section describes the tests completed to identify air-sea drag and bottom roughness
parameterizations that are broadly applicable for use in Louisiana. The full parameter test space,
shown in Table 1, was developed to examine a large number of air-sea drag and bottom roughness
lower limit combinations.

The full parameter test space was initially examined with a simulation of Hurricane Katrina. The model
results for Hurricane Katina were compared to observational data to narrow the full parameter space
to a subset of model parameterizations to be tested using a broader set of historical storms in Section
2.3. The set of historical storms used to test the subset of parameterizations, shown in Table 2,
includes storms with varying sizes, intensities, and landfall locations.

Table 1. Initial list of parameter sets evaluated.
 Parameter Drag Air-Sea Drag Bottom Roughness
 Set Formula Upper Limit Lower Limit
 1 Garratt 0.0020 0.000
 2 Garratt 0.0020 0.001
 3 Garratt 0.0020 0.003
 4 Garratt 0.0025 0.000
 5 Garratt 0.0025 0.001
 6 Garratt 0.0025 0.003
 7 Garratt 0.0030 0.000
 8 Garratt 0.0030 0.001
 9 Garratt 0.0030 0.003
 10 Garratt 0.0035 0.000
 11 Garratt 0.0035 0.001
 *12 Garratt 0.0035 0.003
 †13 Powell n/a 0.000
 14 Powell n/a 0.001
 15 Powell n/a 0.003
 16 Holthuijsen n/a 0.000
 17 Holthuijsen n/a 0.001
 18 Holthuijsen n/a 0.003
*FEMA 2008
†2017 Coastal Master Plan

2023 DRAFT COASTAL MASTER PLAN. Storm Surge and Waves Model
Improvements 17
Table 2. Suite of historical storms used in performance evaluation.
 Storm Year
 Katrina 2005
 Rita 2005
 Gustav 2008
 Ike 2008
 Isaac 2012
 Nate 2017
 Harvey 2017

2.3 HURRICANE KATRINA SCREENING RESULTS

Hurricane Katrina was used to screen the full parameter test space of air-sea drag and bottom
roughness parameterizations listed in Table 1.

The simulation of Hurricane Katrina began on August 7, 2005 at 00:00 UTC. The simulation was
initially forced with only astronomical tides and riverine inflows for 18-days to achieve a dynamic
steady-state condition prior to the application of hurricane winds. Simulation of wind forcing began on
August 25, 2005 00:00 UTC and continued until August 31, 2005 00:00. Following the end of the
available wind data, a single additional day of simulation was used to allow the floodwaters to begin to
recede. The storm track for Hurricane Katrina is shown in Figure 5.

High-water marks collected post-storm, which have been used in prior studies for model validation,
were used for this analysis (Dietrich et al., 2011a; Federal Emergency Management Agency Region Six
and the U.S. Army Corps of Engineers, 2008). Adjustments to the high-water marks to account for
differences in datum, converting from NAVD88 2004.65 to NAVD88 2009.55, were made to align with
the model datum using the National Oceanic and Atmospheric Administration’s (NOAA) VDatum tool
(Yang et al., 2010).

The maximum water surface elevation from the simulation of Hurricane Katrina, using parameter set 5
from Table 1 (Garratt drag formula, 0.0025 air-sea drag upper limit, 0.0010 bottom roughness lower
limit), is shown in Figure 6, and the maximum wave height is shown in Figure 7. The comparison to
observed high-water marks is shown in Figure 8 and Figure 9.

2023 DRAFT COASTAL MASTER PLAN. Storm Surge and Waves Model
Improvements 18
Table 3 includes a summary of the comparison to high-water marks for the full parameter test space
listed in Table 1.

Figure 5. Hurricane Katrina track denoting central pressure (mb).

2023 DRAFT COASTAL MASTER PLAN. Storm Surge and Waves Model
Improvements 19
Figure 6. Maximum water surface elevation from the simulation of Hurricane
Katrina using parameter set 5 (ft; NAVD88 2009.55).

Figure 7. Maximum wave height and direction from the simulation of Hurricane
Katrina using parameter set 5 (ft).

2023 DRAFT COASTAL MASTER PLAN. Storm Surge and Waves Model
Improvements 20
Figure 8. Hurricane Katrina comparison to observed high-water marks for parameter set 5.

2023 DRAFT COASTAL MASTER PLAN. Storm Surge and Waves Model Improvements 21
Figure 9. Hurricane Katrina high-water mark regression for parameter set 5.

2023 DRAFT COASTAL MASTER PLAN. Storm Surge and Waves Model
Improvements 22
Table 3. Hurricane Katrina screening analysis high-water mark comparisons.
 Note: parameter sets in bold were selected for additional analysis.
Parameter Drag Air-sea Bottom
 Slope R2 σ
 Set Formula drag Limit Friction Limit
1 Garratt 0.0020 0.000 0.90 0.91 1.78
2 Garratt 0.0020 0.001 0.88 0.91 1.80
3 Garratt 0.0020 0.003 0.81 0.93 1.77
4 Garratt 0.0025 0.000 1.02 0.91 1.75
5 Garratt 0.0025 0.001 1.00 0.92 1.70
6 Garratt 0.0025 0.003 0.91 0.92 1.61
7 Garratt 0.0030 0.000 1.12 0.92 1.75
8 Garratt 0.0030 0.001 1.10 0.92 1.94
9 Garratt 0.0030 0.003 0.99 0.93 1.58
10 Garratt 0.0035 0.000 1.19 0.92 2.52
11 Garratt 0.0035 0.001 1.17 0.92 2.38
*12 Garratt 0.0035 0.003 1.05 0.93 1.80
†13 Powell n/a 0.000 1.02 0.92 1.65
14 Powell n/a 0.001 1.00 0.92 1.63
15 Powell n/a 0.003 0.90 0.92 1.69
16 Holthuijsen n/a 0.000 0.90 0.92 1.69
17 Holthuijsen n/a 0.001 0.91 0.92 1.69
18 Holthuijsen n/a 0.003 0.83 0.93 1.59
 *FEMA 2008
 †2017 Coastal Master Plan

 Parameter sets 4, 5, 9, 12, 13, and 14 were selected for additional analysis based on the slope,
 correlation, and standard deviation values shown in Table 3. Selected parameter sets fall within a
 slope range of 0.95 to 1.05. Parameter set 12 was utilized during the 2008 FEMA study in Louisiana
 (Federal Emergency Management Agency Region Six, and the U.S. Army Corps of Engineers, 2008)
 and is representative of a legacy application of air-sea drag and bottom friction. Parameter set 13 was
 used in the 2017 Coastal Master Plan.

 Note that the above screening analysis used ADCIRC version 53.05 and the subsequent analysis
 described use version 54.01. ADCIRC version 54.01 had not been released when the Hurricane
 Katrina screening analysis was conducted but contains an update to the calculation of the effect of
 directional roughness on wind which was deemed important to include for this analysis. Additionally,
 the 2023 Coastal Master Plan production simulations will use v54.01.

 2023 DRAFT COASTAL MASTER PLAN. Storm Surge and Waves Model
 Improvements 23
2.4 ADDITIONAL STORM SIMULATIONS

The set of seven historical hurricanes shown in Table 2 and Figure 10, including Hurricane Katrina,
were used to further analyze the parameter sets 4, 5, 9, 12, 13, and 14 discussed above. Each of the
seven historical storms were simulated using the six selected parameter sets to assess model
performance compared to available observation data.

The historical hurricanes selected include storms with varying sizes, intensities, and landfall locations,
including storms that both bypassed and that made landfall in Louisiana. While the bypassing storms
may not have high-water mark data within southern Louisiana, gage networks from NOAA, United
States Geological Survey (USGS), and CRMS were available for comparing to model time series and
peak water surface elevation values for all storms.

Figure 10. Storm tracks and associated central pressured used in the detailed
analysis of the select subset of model parameterizations.

2023 DRAFT COASTAL MASTER PLAN. Storm Surge and Waves Model
Improvements 24
Hurricanes Katrina and Rita represent strong storms making landfall on the eastern and western
portions of the state, respectively. Hurricane Gustav made landfall near the central part of the coast
with moderate strength and Isaac made landfall near Barataria Bay with a slow, stalling, forward
speed and moderate strength. Hurricane Ike was a strong storm that bypassed Louisiana and made
landfall in Texas, but generated strong shore-parallel currents along the Louisiana-Texas shelf and is
particularly informative as part of timeseries comparisons for parameter testing. Hurricane Harvey also
made landfall in Texas, further southwest of Hurricane Ike’s landfall location, though Harvey had a
second landfall as a tropical storm in southwest Louisiana. Lastly, Hurricane Nate bypassed the
Mississippi River delta before making landfall in the state of Mississippi.

Historical storm simulations were set up to be representative of the conditions when the storm
occurred. River flow rates were modified using the USGS discharge gage at Baton Rouge for the
Mississippi River and USGS gage at Simmesport for the Atchafalaya River. Offshore levels were set
based upon the mean seasonal cycle recorded at Grand Isle by NOAA. Lastly, for simulations that
occurred before the construction of the Hurricane and Storm Damage Risk Reduction System
(HSDRRS) was completed, the mesh was modified to remove structures and projects that are part of
this system: the Seabrook gate; Inner Harbor Navigation Canal (IHNC) Barrier; West Closure Complex;
partial Morganza to the Gulf construction; and the Mississippi River Gulf Output Navigation Channel
Closure.

Figure 11 through Figure 16 show the peak water surface elevations for each storm for simulations
using parameter set 5. Note that Hurricane Katrina is shown in Figure 5 using ADCIRC v53.05.

Figure 11. Maximum water surface elevation from the simulation of Hurricane
Rita using parameter set 5 (ft, NAVD88 2009.55).

2023 DRAFT COASTAL MASTER PLAN. Storm Surge and Waves Model
Improvements 25
Figure 12. Maximum water surface elevation from the simulation of Hurricane
Gustav using parameter set 5 (ft, NAVD88 2009.55).

Figure 13. Maximum water surface elevation from the simulation of Hurricane Ike
using parameter set 5 (ft, NAVD88 2009.55).

2023 DRAFT COASTAL MASTER PLAN. Storm Surge and Waves Model
Improvements 26
Figure 14. Maximum water surface elevation from the simulation of Hurricane
Isaac using parameter set 5 (ft, NAVD88 2009.55).

2023 DRAFT COASTAL MASTER PLAN. Storm Surge and Waves Model
Improvements 27
Figure 15. Maximum water surface elevation from the simulation of Hurricane
Nate using parameter set 5 (ft, NAVD88 2009.55).

Figure 16. Maximum water surface elevation from the simulation of Hurricane
Harvey using parameter set 5 (ft, NAVD88 2009.55).

2023 DRAFT COASTAL MASTER PLAN. Storm Surge and Waves Model
Improvements 28
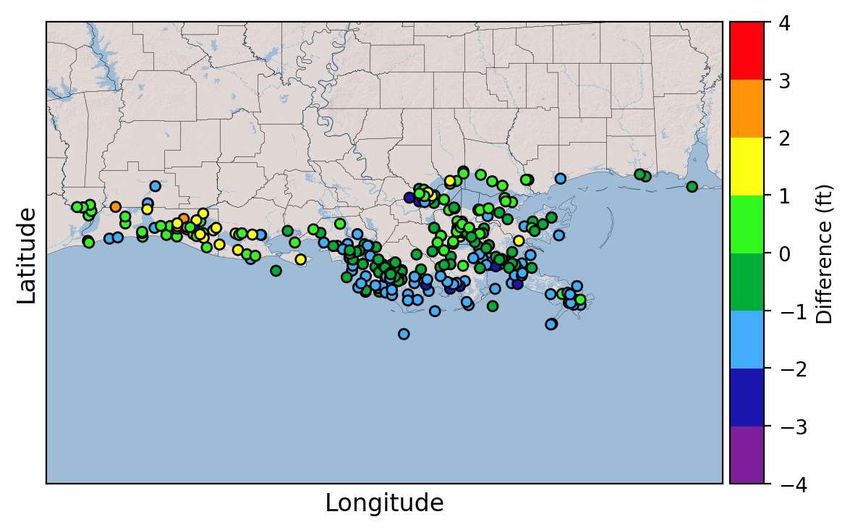
HIGH-WATER MARKS COMPARISON

The comparisons of model results to high-water marks were used to understand trends in model
performance based on variation of model parameters. Table 4 through Table 8 show the comparison
to high-water marks for the five historical storm simulations where high-water mark data were
available (Hurricanes Katrina, Rita, Gustav, Ike, Isaac). Figure 7 and Figure 17 through

Figure 20 show the comparison to high-water mark data for parameter set 5 to show the spatial
distribution of available high-water marks for each storm. The high-water marks collected for
Hurricane Harvey in Louisiana included the effects of extreme rainfall, and Hurricane Nate only had
available high-water marks in Mississippi, these storms were included only in the timeseries analysis.

Note that comparison values for Hurricane Katrina shown in Table 3 have slight differences from
those shown in Table 4 due to the change in ADCIRC code version previously mentioned.

Table 4. Modeled high-water mark comparisons for Hurricane Katrina for the
selected parameter sets.
 Air-sea Bottom
 Parameter Drag
 drag Friction Slope
 Set Formula
 Limit Limit
 4 Garratt 0.0025 0.000 1.01 0.89 1.96
 5 Garratt 0.0025 0.001 0.99 0.90 1.93
 9 Garratt 0.0030 0.003 0.98 0.91 1.79
 *12 Garratt 0.0035 0.003 1.04 0.92 1.97
 †13 Powell n/a 0.000 1.02 0.90 1.93
 14 Powell n/a 0.001 0.99 0.89 1.92
*FEMA 2008
†2017 Coastal Master Plan

2023 DRAFT COASTAL MASTER PLAN. Storm Surge and Waves Model
Improvements 29
Figure 17. Hurricane Rita comparison to observed high water marks for parameter set 5.

2023 DRAFT COASTAL MASTER PLAN. Storm Surge and Waves Model Improvements 30
Table 5. Modeled high-water mark comparisons for Hurricane Rita for the selected parameter sets .
 Air-sea Bottom
 Parameter Drag
 Drag Friction Slope
 Set Formula
 Limit Limit
 4 Garratt 0.0025 0.000 1.16 0.73 1.48
 5 Garratt 0.0025 0.001 1.05 0.74 1.29
 9 Garratt 0.0030 0.003 0.94 0.68 1.43
 *12 Garratt 0.0035 0.003 0.95 0.67 1.44
 †13 Powell n/a 0.000 1.07 0.67 1.44
 14 Powell n/a 0.001 0.97 0.65 1.37
*FEMA 2008
†2017 Coastal Master Plan

2023 DRAFT COASTAL MASTER PLAN. Storm Surge and Waves Model Improvements 31
Figure 18. Hurricane Gustav comparison to observed high-water marks for parameter set 5.

2023 DRAFT COASTAL MASTER PLAN. Storm Surge and Waves Model Improvements 32
Table 6. Modeled high-water mark comparisons for Hurricane Gustav for the
selected parameter sets.
 Air-sea Bottom
 Parameter Drag
 drag Friction Slope
 Set Formula
 Limit Limit
 4 Garratt 0.0025 0.000 1.05 0.78 0.96
 5 Garratt 0.0025 0.001 1.01 0.78 0.96
 9 Garratt 0.0030 0.003 0.94 0.78 0.92
 *12 Garratt 0.0035 0.003 0.94 0.78 0.92
 †13 Powell n/a 0.000 0.99 0.75 0.94
 14 Powell n/a 0.001 0.95 0.75 0.96
*FEMA 2008
†2017 Coastal Master Plan

2023 DRAFT COASTAL MASTER PLAN. Storm Surge and Waves Model
Improvements 33
Figure 19. Hurricane Ike comparison to observed high-water marks for parameter set 5.

2023 DRAFT COASTAL MASTER PLAN. Storm Surge and Waves Model Improvements 34
Table 7. Modeled high-water mark comparisons for Hurricane Ike for the selected parameter sets .
 Air-sea Bottom
 Parameter Drag
 drag Friction Slope
 Set Formula
 Limit Limit
 4 Garratt 0.0025 0.000 1.02 0.75 1.18
 5 Garratt 0.0025 0.001 0.93 0.78 0.97
 9 Garratt 0.0030 0.003 0.84 0.79 0.91
 *12 Garratt 0.0035 0.003 0.84 0.79 0.92
 †13 Powell n/a 0.000 0.94 0.77 0.96
 14 Powell n/a 0.001 0.87 0.76 0.93
*FEMA 2008
†2017 Coastal Master Plan

2023 DRAFT COASTAL MASTER PLAN. Storm Surge and Waves Model Improvements 35
Figure 20. Hurricane Isaac comparison to observed high-water marks for parameter set 5.

2023 DRAFT COASTAL MASTER PLAN. Storm Surge and Waves Model Improvements 36
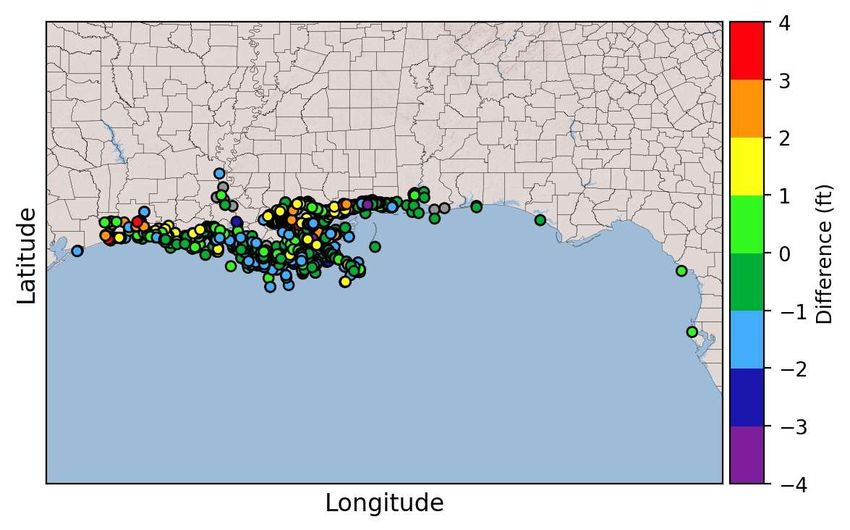
Table 8. Modeled high-water mark comparisons for Hurricane Isaac for the
selected parameter sets.
 Air-sea Bottom
 Parameter Drag
 drag Friction Slope
 Set Formula
 Limit Limit
 4 Garratt 0.0025 0.000 1.14 0.69 1.87
 5 Garratt 0.0025 0.001 1.12 0.69 1.84
 9 Garratt 0.0030 0.003 1.08 0.72 1.74
 *12 Garratt 0.0035 0.003 1.08 0.72 1.74
 †13 Powell n/a 0.000 1.04 0.68 1.63
 14 Powell n/a 0.001 1.03 0.69 1.63
*FEMA 2008
†2017 Coastal Master Plan

High-water marks across five storms were aggregated to two sets: (a) all high-water marks coastwide
and (b) high-water marks only within Louisiana.

Figure 21 and Figure 22 show the aggregated high-water marks coastwide and Figure 23 and Figure
24 show the aggregated high-water marks for Louisiana only.

2023 DRAFT COASTAL MASTER PLAN. Storm Surge and Waves Model
Improvements 37
Figure 21. Aggregated coastwide high-water marks for parameter set 5.

2023 DRAFT COASTAL MASTER PLAN. Storm Surge and Waves Model Improvements 38
Figure 22. Aggregated coastwide high-water mark regression for parameter set
5.

2023 DRAFT COASTAL MASTER PLAN. Storm Surge and Waves Model
Improvements 39
Figure 23. Louisiana-only aggregated high-water marks for parameter set 5.

2023 DRAFT COASTAL MASTER PLAN. Storm Surge and Waves Model Improvements 40
Figure 24. Louisiana-only aggregated high-water mark regression for parameter
set 5.

2023 DRAFT COASTAL MASTER PLAN. Storm Surge and Waves Model
Improvements 41
Table 9. Aggregated high-water marks coastwide for all tested parameter sets.
 Drag Air-sea Bottom Friction
 Set Slope R2 σ
 Formula drag Limit Limit
 4 Garratt 0.0025 0.000 1.04 0.93 1.59
 5 Garratt 0.0025 0.001 1.01 0.93 1.55
 9 Garratt 0.0030 0.003 0.99 0.94 1.49
 *12 Garratt 0.0035 0.003 1.03 0.94 1.59
 †13 Powell n/a 0.000 1.02 0.94 1.42
 14 Powell n/a 0.001 0.99 0.94 1.42
*FEMA 2008
†2017 Coastal Master Plan

Table 10. Aggregated high-water marks in Louisiana for all tested parameter
sets.
 Drag Air-sea Bottom Friction
 Set Slope R2 σ
 Formula drag Limit Limit
 4 Garratt 0.0025 0.000 1.08 0.81 1.53
 5 Garratt 0.0025 0.001 1.04 0.81 1.50
 9 Garratt 0.0030 0.003 0.97 0.81 1.48
 *12 Garratt 0.0035 0.003 0.98 0.81 1.47
 †13 Powell n/a 0.000 1.03 0.85 1.31
 14 Powell n/a 0.001 0.99 0.84 1.33
*FEMA 2008
†2017 Coastal Master Plan

TIMESERIES COMPARISON

In addition to comparing high-water mark locations, water level data generated by the model were also
compared to observational data, including peak storm values and trends pre- and post-storm.
Evaluation of the water surface elevation time series for the rising and falling limbs of the hydrograph
is critical to assess the model representation of important physical processes like those at play during
the forerunner that occurred prior to Hurricane Ike. This is important so that the model can be shown
to be replicating the physics rather than being purely tuned to reproducing peak elevations, where it
would be possible to generate well matched high water marks but not replicate the physical processes
well.

Figure 25 and Figure 26 show water levels during Hurricane Katrina on the north side of the IHNC

2023 DRAFT COASTAL MASTER PLAN. Storm Surge and Waves Model
Improvements 42
Lock, demonstrating surge patterns in the corridor that once connected Lake Borgne and Lake
Pontchartrain via the IHNC and Gulf Intracoastal Waterway (GIWW) during storms prior to HSDRRS
system upgrades. Garratt-based formulations are shown as solid lines and Powell formulations are
shown as dashed lines. The Garratt formulations with highest combinations of drag and bottom
friction emphasized the double-peaked hydrograph which does not appear in the data, while lower
drag formulations approached a single peak, similar to that shown in the water level observation data.
All formulations tend to show similar drainage rates after the storm has passed.

Figure 27 and Figure 28 show simulations of Hurricane Gustav and the modeled water levels at
Southwest Pass. In this case, all Garratt-based formulations overpredicted the observed water levels
while the Powell formulations underpredicted. Also, note that the formulations do not diverge until the
storm is near the coast, meaning that both tides and pre-storm winds are not overly sensitive to the
selection of air-sea drag and bottom friction formulation.

The 2011 storm surge study in Texas (USACE, 2011) was in progress when Hurricane Ike made
landfall and the modeling team undertook a validation of the storm finding that the model was unable
to replicate a forerunner surge, caused by strong shore parallel winds which propagated a geostrophic
wave along the Louisiana and Texas coasts, elevating water levels before the storm made landfall. The
USACE study demonstrated that ADCIRC parameterizations like parameter set 12 in this study did not
capture the forerunner, while parameterizations like parameter sets 4 and 5 were better able to
replicate the forerunner. Observations near Sabine Pass, shown in Figure 29 and Figure 30, capture
the initial rise in water level, or forerunner, before the storm’s landfall. While none of the model
parameterizations perfectly captured the forerunner, the models with high bottom friction coefficients
did not generate any part of the forerunner signal. The model results for parameter set 4 provided a
simulation of the forerunner that was most consistent with observations, however that parametrization
overpredicted the peak surge considerably. Model results for parameter sets 5 and 13 represented
both the forerunner and the peak surge well, with parameter set 13 most accurately capturing the
forerunner and peak surge.

Figure 31 through Figure 34 show observed and modeled time series for Hurricanes Nate and Harvey.
Both storms generated relatively low storm surge levels within Louisiana. Model outputs for the six
parameterizations for Hurricane Harvey showed relatively little separation between the modeled time
series because the winds are not as strong as other storms. However, due to much stronger winds,
modeled time series showed variation across the parameterizations for Hurricane Nate, particularly
during the peak of the storm, though the bottom friction.

2023 DRAFT COASTAL MASTER PLAN. Storm Surge and Waves Model
Improvements 43
Figure 25. Modeled and observed water levels during Hurricane Katrina near the
IHNC Lock. Parameter set numbers in the figure refer to Table 3.

Figure 26. Modeled and observed water levels during Hurricane Katrina near the
IHNC Lock near the time of peak surge. Parameter set numbers in the figure
refer to Table 3.

2023 DRAFT COASTAL MASTER PLAN. Storm Surge and Waves Model
Improvements 44
Figure 27. Hurricane Gustav modeled and observed water levels at Southwest
Pass.

2023 DRAFT COASTAL MASTER PLAN. Storm Surge and Waves Model
Improvements 45
Figure 28. Hurricane Gustav modeled and observed water levels at Southwest
Pass near the time of peak surge. Parameter set numbers in the figure refer to
Table 3.

Figure 29. Hurricane Ike modeled and observed water levels at Sabine Pass.
Parameter set numbers in the figure refer to Table 3.

2023 DRAFT COASTAL MASTER PLAN. Storm Surge and Waves Model
Improvements 46
Figure 30. Hurricane Ike modeled and observed water levels at Sabine Pass near
the time of peak surge. Parameter set numbers in the figure refer to Table 3.

Figure 31. Hurricane Nate modeled and observed water levels at Pilottown.
Parameter set numbers in the figure refer to Table 3.

2023 DRAFT COASTAL MASTER PLAN. Storm Surge and Waves Model
Improvements 47
Figure 32. Hurricane Nate modeled and observed water levels at Pilottown near
the time of peak surge. Parameter set numbers in the figure refer to Table 3.

Figure 33. Hurricane Harvey modeled and observed water levels at Calcasieu
Pass. Parameter set numbers in the figure refer to Table 3.

2023 DRAFT COASTAL MASTER PLAN. Storm Surge and Waves Model
Improvements 48
Figure 34. Hurricane Harvey modeled and observed water levels at Calcasieu
Pass near the time of landfall. Parameter set numbers in the figure refer to Table
3.

RECOMMENDATION

Two formulations demonstrate broad applicability throughout the range of historic storm events.
Parameter sets 5 and 13 show the best performance in terms of both high-water mark and time series
comparisons. Parameter set 13 was used in the 2017 Coastal Master Plan and does show the best
overall agreement between modeled and observed data. However, this formulation is specific to
hurricanes with a well-defined vortex, as it approximates wave direction relative to the center of the
storm. Accordingly, it does not provide for the simulation of other types of storm events which are of
interest throughout various studies conducted in Louisiana (i.e., non-tropical storms). Because the
ADCIRC model developed for the master plan has potential uses beyond synthetic hurricane events, it
is recommended that parameter set 5 be used so that the model configuration can be broadly
applicable to many types of events. Future studies might examine more advanced representations of
air-sea drag coefficients, such as those proposed by Holthuijsen, which may be able to consider wave-
driven processes not only during hurricanes, but other events as well. Additionally, the interaction of
three-dimensional effects on roughness values during energetic events remains an area of active
research (Reid, 1957; Tritinger, 2019), and these advancements should likewise be monitored for
inclusion in future work.

2023 DRAFT COASTAL MASTER PLAN. Storm Surge and Waves Model
Improvements 49
3.0 INITIAL AND BOUNDARY
CONDITIONS
As part of the ADCIRC model setup, the primary initial and background conditions considered are
inflows from the Mississippi and Atchafalaya Rivers and initial water levels for the Gulf of Mexico. The
river inflows establish stages along their length and account for compound fluvial and coastal effects
at their outlets which can be important for the evaluation of annual exceedance probabilities (AEPs) in
adjacent areas. For historical events, like those described in Section 2, the initial conditions are storm
specific for both the Gulf and rivers. Initial conditions are defined based on historical observations
representative of the period.

3.1 RIVER FLOW RATES

Like the 2017 Coastal Master Plan, the 2023 Coastal Master Plan ADCIRC model simulates flows
within the Mississippi and Atchafalaya Rivers to account for their impact on total water levels. The
2017 Coastal Master Plan relied upon statistical analysis from previous FEMA and USACE analyses
(Federal Emergency Management Agency Region Six, and the U.S. Army Corps of Engineers, 2008;
Roberts & Cobell, 2017). Recent analysis by USACE-MVN suggests that the use of a flow rate of
400,000 cubic feet per second (cfs) for the Mississippi River is appropriate for a study like the 2023
Coastal Master Plan (Agnew 2020, pre-publication). The USACE-MVN analysis evaluated water surface
elevation AEPs along the Mississippi River that were created based on the simulation of a full suite of
synthetic hurricanes with multiple, varying Mississippi River flow rates and the Joint Probability Method
with Optimum Sampling (JPM-OS) statistical method. A single flow rate of 400,000 cfs was identified
as suitable for planning studies because the simulation of the same full suite of synthetic hurricanes,
combined with a single flow rate of 400,000 cfs, resulted in 1% AEPs along the Mississippi River
similar to the 1% AEPs that were estimated based on the simulation of a full suite of synthetic
hurricanes with multiple, varying Mississippi River flow rates.

For the 2023 Louisiana Coastal Master Plan, the Mississippi River flow rate is set at 400,000 cfs and
the Atchafalaya River uses a corresponding flow rate of 171,500 cfs. The same flow rates are
recommended for the 2023 Coastal Master Plan production simulations.

2023 DRAFT COASTAL MASTER PLAN. Storm Surge and Waves Model
Improvements 50
3.2 OFFSHORE WATER LEVELS

The initial water levels in the ADCIRC model serve two purposes. First, they define the offset between
the model vertical datum (NAVD88 2009.55) and mean sea level. Second, they account for the offset
between mean sea level and the mean water level of the Gulf of Mexico during hurricane season,
which varies due to prevailing currents and thermal expansion.

The initial water levels used in 2012 and 2017 Coastal Master Plans are based on the FEMA analysis
in Louisiana, which used data from the post-Katrina IPET analysis (Federal Emergency Management
Agency Region Six, and the U.S. Army Corps of Engineers, 2008). The IPET analysis used a series of
benchmark stations near New Orleans to define a local mean sea level offset of 0.44 ft in NAVD88
2004.65. FEMA then used this value plus an additional 0.66ft seasonal adjustment and an additional
0.1 ft for uncertainty. The total water level offset used for both the 2012 Coastal Master Plan analysis
and the FEMA analysis was 1.2 ft NAVD88 2004.65.

For the 2017 Coastal Master Plan, the initial water level value of 1.2 ft was updated from NAVD88
2004.65 to 2009.55 using the adjustment proposed by the USACE-MVN (USACE, 2014). An
adjustment of -0.17 ft was applied for a total sea level offset of 1.03 ft NAVD88 2009.65. This value
was used in the 2017 Coastal Master Plan.

To update the initial water level from the value used in the 2017 Coastal Master Plan, multiple
approaches were considered. First, the initial water level estimate from the 2017 Coastal Master Plan
was adjusted to account for sea level rise from 2008 to 2020. Note that 2020 is the base year for the
2023 Coastal Master Plan. Second, a regional re-evaluation was completed to leverage additional
data that are available through a longer period of record for the gages used in the initial IPET analysis
and the additional gages that have come online through the CRMS networks since the original
analysis.

The first approach assumed a linear trend of 0.09 in/yr (Figure 35), and therefore to adjust between
2008 to 2020, 0.09 ft was added to the IPET value for a total adjustment of 1.12 ft NAVD88 2009.65.
The Pensacola, Florida station was used to determine the sea level rise trend because subsidence at
that station is understood to be minimal relative to subsidence rates within Louisiana, while the sea
level trends observed in Pensacola are similar to those in other areas of the Gulf. Stations within
Louisiana observe the combined effects of eustatic sea level rise and subsidence, making it difficult to
rely on those gage data in this instance.

2023 DRAFT COASTAL MASTER PLAN. Storm Surge and Waves Model
Improvements 51
You can also read