The damaging character of shallow 20th century earthquakes in the Hainaut coal area (Belgium)
←
→
Page content transcription
If your browser does not render page correctly, please read the page content below
Solid Earth, 13, 469–495, 2022
https://doi.org/10.5194/se-13-469-2022
© Author(s) 2022. This work is distributed under
the Creative Commons Attribution 4.0 License.

The damaging character of shallow 20th century earthquakes
in the Hainaut coal area (Belgium)
Thierry Camelbeeck, Koen Van Noten, Thomas Lecocq, and Marc Hendrickx
Royal Observatory of Belgium, Seismology-Gravimetry, Avenue Circulaire 3, 1180 Uccle, Belgium

Correspondence: Thierry Camelbeeck (thierry.camelbeeck@oma.be)

Received: 27 May 2021 – Discussion started: 13 July 2021
Revised: 22 November 2021 – Accepted: 26 January 2022 – Published: 9 March 2022

Abstract. The present study analyses the impact and dam-           not exceeding 1 km, suggesting a close link to mining activi-
age of shallow seismic activity that occurred from the end         ties. Many events, including the largest shallow events in the
of the 19th century until the late 20th century in the coal        coal area before 1970, occurred at depths greater than 2 km,
area of the Hainaut province in Belgium. This seismicity is        which would exclude a direct relationship with mining, but
the second-largest source of seismic hazard in north-western       still might imply a triggering causality. A similar causality
Europe after the Lower Rhine Embayment. During this pe-            can also be questioned for other events that occurred just out-
riod, five earthquakes with moment magnitudes (Mw ) around         side of the coal area since the end of the mining works.
4.0 locally caused moderate damage to buildings correspond-
ing to maximum intensity VII on the European Macroseis-
mic Scale 1998 (EMS-98). Reviewing intensity data from
the official macroseismic surveys held by the Royal Obser-         1   Introduction
vatory of Belgium (ROB), press reports and contemporary
scientific studies resulted in a comprehensive macroseismic        Moderate shallow earthquakes with moment magnitudes in
intensity dataset. Using this dataset, we created macroseis-       the range of 4.0 to 6.0 have real potential for destruction
mic maps for 28 earthquakes, established a new Hainaut in-         when they occur in populated areas. This is particularly the
tensity attenuation model and a relationship linking magni-        case in regions where the building stock is old and vulnera-
tude, epicentral intensity and focal depth. Using these rela-      ble, and contains few earthquake-resistant buildings. In seis-
tionships, we estimated the location and magnitude of pre-         mically active regions, even though Mw = 4.0 earthquakes
1985 earthquakes that occurred prior to deployment of the          can be locally damaging (Nappi et al., 2021), current hazard
modern digital Belgian seismic network. This resulted in a         is associated with the upper part of this magnitude range. In
new updated earthquake catalogue for the Hainaut area for          western Europe, Mw = 4.0 to 5.0 shallow earthquakes repre-
the 1887–1985 period, including 124 events. A comparison           sent the most probable current source of seismic risks, which
with other areas worldwide where currently similar shallow         is currently enhanced by the increase of induced seismic-
earthquake activity occurs suggests that intensity attenuation     ity by underground energetic resources (Grigoli et al., 2017;
is strong in Hainaut. This high attenuation and our analy-         Nievas et al., 2020). In western Europe, the potential for de-
sis of the cumulative effect of the Hainaut seismicity indi-       struction of shallow earthquakes is exemplified by the dam-
cate that current hazard maps overestimate ground motions          aging impact of the 11 May 2011 Lorca (Spain, Mw = 5.1;
in the Hainaut area. This reveals the need to use more ap-         Association Française de génie Parasismique, 2011), 16 Au-
propriate ground motion models in hazard issues. Another           gust 2012 Huizinge (The Netherlands, Mw = 3.6; Dost and
strong implication for earthquake hazard comes from the re-        Kraaijpoel, 2013) and 11 November 2019 Le Teil (France,
liability of the computed focal depths that helps clarifying the   Mw = 4.9; Schlupp et al., 2021) earthquakes.
hypotheses about the origin of this seismicity. Some events           In southern Belgium, Namurian to Westphalian (Upper
were very shallow and occurred near the surface up to a depth      Carboniferous) coal seams were intensively exploited in the
                                                                   19th and 20th century in la bande Houillère, i.e. a narrow,

Published by Copernicus Publications on behalf of the European Geosciences Union.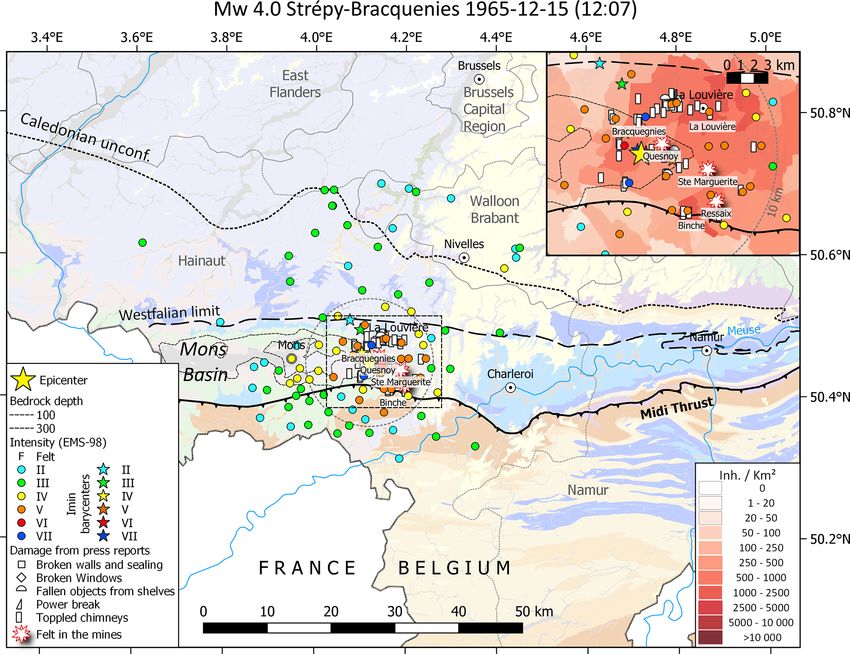
470                                      T. Camelbeeck et al.: Damaging impact of shallow Hainaut coal area earthquakes

10 to 15 km wide geological region located between the Bel-        earthquake hypocentres, the influence area of the Hainaut
gian cities of Mons in the west and Liège in the east (Fig. 1).    seismicity seems to be overextended in the hazard maps. This
This coal mining area is bordered in the south by the Midi         inconsistency resulted from the use of inappropriate ground
fault, which manifests the overthrusting of the Ardenne al-        motion prediction equations (GMPEs) in hazard assessment.
lochthon (including the Dinant fold-and-thrust belt and the           Most of the earthquake activity in the Hainaut coal area
High-Ardenne slate belt) over the Brabant parautochthon. In        occurred before the implantation of a modern digital seis-
the north, the coal mining area is limited up to the northern      mic network in Belgium, which started in 1985 (Camel-
occurrence of the Westphalian (Fig. 2), which overlies the         beeck et al., 1990). Before the establishment of the mod-
Lower Palaeozoic Brabant Massif. Mining in the coal area           ern network, only the largest earthquakes were recorded by
in the province of Hainaut (further referred to as the Hain-       seismic stations, starting in 1909. Smaller events are only
aut coal area) was focused on three basins: Borinage-Mons,         known about because they were reported by people and/or
Centre-La Louvière and Charleroi. In the Centre-La Louvière        caused slight damage. Camelbeeck (1985a, b, 1993) and
and Charleroi basins, the sedimentary cover thickness is mi-       Camelbeeck et al. (1990) evaluated the magnitude of the
nor. In the Borinage-Mons basin, Cretaceous deposits up to         largest events from seismic recordings. These studies under-
300 m thick cover the Westphalian. While no earthquakes            line the large uncertainties of earthquake locations from seis-
were reported in the Hainaut coal area in the first part of        mic phase measurements and conclude that for most events,
the 19th century, during which intense coal mining began,          the centre of the area with the largest observed intensity bet-
seismicity began in 1887 (Table 1, Fig. 2) and has continued       ter corresponds to the real epicentre than the location ob-
up to the present. This seismicity is unique in Belgium and        tained from arrival time measurements. Because of the un-
neighbouring regions as five events with Mw = 4.0 caused           certainty of focal depths, instrumental evaluations were only
locally widespread, moderate to extensive damage to build-         able to suggest that Hainaut events would certainly not ex-
ings. Before this study, the origin of this earthquake activity    ceed 7–8 km (Camelbeeck, 1990) and, to date, more accu-
was considered to be natural.                                      rate depth estimations have been lacking. Macroseismic data
   The main characteristics of seismic events in the Hainaut       are, however, a good (and the only) alternative to determine
coal area are the high epicentral intensity and the rapid in-      earthquake source parameters and tackle the context of this
tensity decay with distance, suggesting shallow focal depths       seismicity and related seismic hazard issues.
(Charlier, 1949; Van Gils, 1966; Ahorner, 1972; Van Gils and          In this paper, we collected all available macroseismic data
Zaczek, 1978). Despite the consequences of this “past” seis-       of this unique seismicity and searched for additional infor-
mic activity there is no published synthesis and specific anal-    mation, providing a complete macroseismic intensity dataset
ysis about its impact and the damage it caused. Providing an       of sufficient quality to estimate the impact and to answer the
inventory of these effects and damage would be of great inter-     questions that Hainaut seismicity have raised. First, we ex-
est in order to identify the consequences of possible similar      plain how we established the full earthquake catalogue and
future activity, not only in the Hainaut area but also else-       the corresponding intensity dataset from the available (his-
where in western Europe in areas with a similar geologi-           torical) sources of information and we provide a new earth-
cal configuration. Such an investigation is required for the       quake catalogue of Hainaut seismicity from 1887 to 1985.
analysis of the possible impact of deep geothermal projects        Second, we used the intensity dataset to develop a regional
that are currently in the test phase in the Hainaut coal area      intensity attenuation relationship valid for the Hainaut coal
(https://geothermiemons.be, last access: 1 May 2020).              area, which allows better estimation of the earthquake focal
   The Hainaut seismic activity is of great concern for seis-      depth, magnitude and epicentre location. We also compare
mic hazard assessment in the border area between France and        the new Hainaut attenuation model with intensity datasets of
Belgium. This is particularly of interest for the Eurocode-        other shallow, induced or triggered earthquakes worldwide.
8 norm application in Belgian and French building regula-          Finally, we discuss how our results should be incorporated
tions because the contribution of Hainaut seismic activity         in current seismic hazard studies. Appendix A presents the
to these hazard maps is significant (Fig. 1; Leynaud et al.,       way we evaluated intensity from the available information
2001; Martin et al., 2002; Vanneste et al., 2014; Drouet et al.,   sources. In Appendix B, a chronological description of the
2020). For the current hazard maps, two different aspects of       Hainaut seismicity is given. The macroseismic maps and a
this seismicity deserve specific research. First, the origin of    description of the sources of information concerning these
this seismicity continues to be unresolved and controversial       earthquakes are presented in detail in an Atlas in the Supple-
(Descamps, 2009; Troch, 2018a). In hazard computations,            ment (further referred to as the Atlas). Communal intensity
natural seismicity is a long-term stationary process, whereas      data points (IDPs) are provided for each earthquake in the
seismicity induced by mining works are only a past sporadic        Supplement.
phenomenon. Hence, a reinterpretation on the origin would
strongly modify its contribution to the seismic hazard. Sec-
ond, in contrast to the observed strong intensity decay of
these earthquakes, partly caused by the shallowness of the

Solid Earth, 13, 469–495, 2022                                                         https://doi.org/10.5194/se-13-469-2022
T. Camelbeeck et al.: Damaging impact of shallow Hainaut coal area earthquakes                                                           471

Figure 1. Regional seismicity and geological setting of the Hainaut coal area. The seismicity shown is the full seismic catalogue of the Royal
Observatory of Belgium (ROB). Grey dots are historical earthquakes prior to the first event in Belgium recorded by a seismic station in 1911.
The inset shows details of the SHARE hazard map (Woessner et al., 2015) for the area around Belgium. Note the pronounced higher peak
ground acceleration exceedance in the Hainaut area based on the seismicity discussed in this paper. Geology in the background based upon
http://www.onegeology.org/, last access: 1 May 2020. Reproduced with the permission of © OneGeology. All rights reserved.

2   Earthquake catalogue                                                 in the Borinage-Mons basin and caused damage to chimneys
                                                                         in Gosselies (Camelbeeck et al., 2021).
                                                                            To create the earthquake catalogue, Camelbeeck (1993)
                                                                         initially reviewed all the recordings of seismic stations in
The Hainaut earthquakes are included in the earthquake cat-              Belgium and neighbouring countries that could have reported
alogue maintained by the Royal Observatory of Belgium                    phase arrival times and amplitude measurements for earth-
(ROB; see Data availability section). The first earthquakes              quakes in Belgium. Between 1898 and 1958, the only seis-
reported in the Hainaut coal area occurred in 1887 in the lo-            mic station in Belgium was Uccle (Brussels). Its capability
cality of Havré, a few kilometres east of the city of Mons               to record local earthquakes was operational from 1909 on-
(Fig. 2), and were studied by de Munck (1887). The ab-                   wards. However, the station was only sensitive enough to de-
sence of scientific documentation before these events does               tect the largest earthquakes, and numerous felt earthquakes
not mean that small earthquakes could not have occurred                  were too small to leave a trace on the black smoked or photo
prior to these events in the Hainaut coal area. However, at              paper recordings. Hence, the ROB catalogue was extended
least since the beginning of the 19th century, it is doubtful            by including felt Hainaut earthquakes that were not recorded
that felt or damaging earthquakes would have escaped the at-             by seismic instruments before 1958. However, their reporting
tention of local authorities and the press because historical            is not homogeneous during this period. For the period be-
sources do report other 19th century earthquakes in neigh-               tween 1896 and 1936, Somville (1936) established a list in-
bouring regions and describe their impact on Hainaut. An                 cluding some events that were not recorded in Uccle but that
example is the 23 February 1828 Mw = 5.1 earthquake in                   were reported in press reports, in communications from local
central Belgium (Fig. 1) that was felt in underground mines

https://doi.org/10.5194/se-13-469-2022                                                                   Solid Earth, 13, 469–495, 2022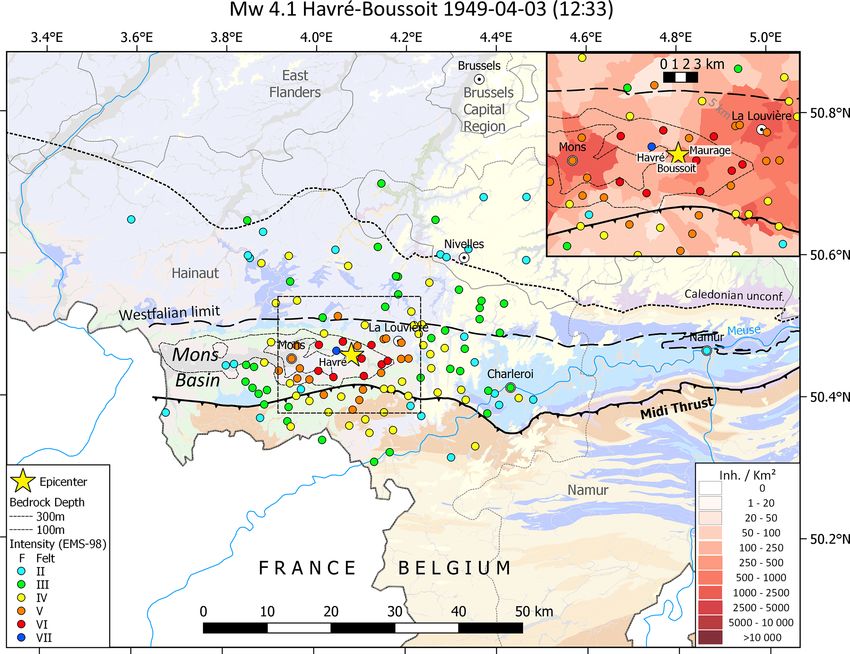
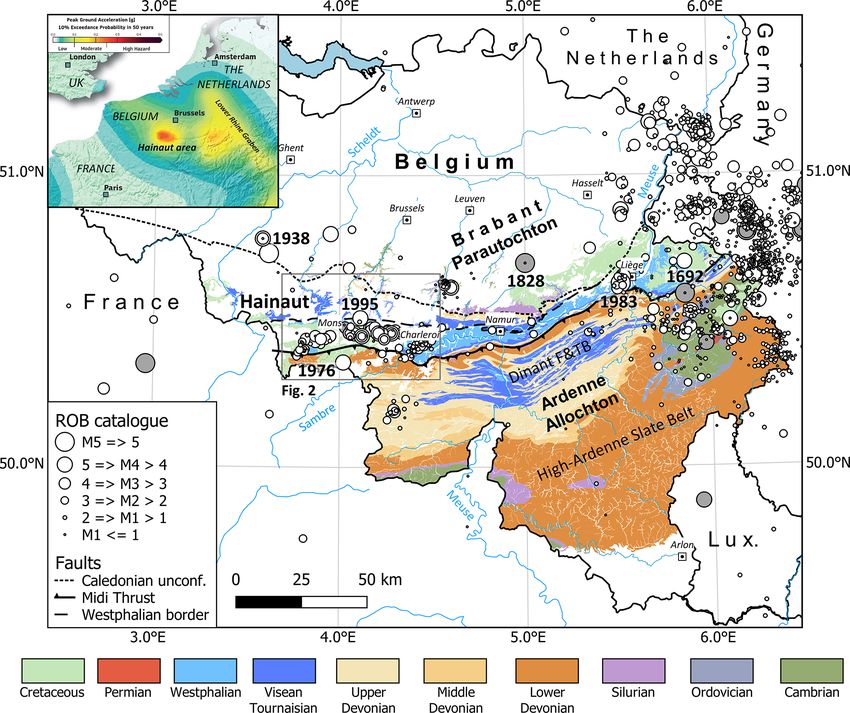
472                                        T. Camelbeeck et al.: Damaging impact of shallow Hainaut coal area earthquakes

Figure 2. Geological setting of the 1887–2020 seismicity in the Hainaut province with local geological map as background. The Borinage-
Mons, Centre-La Louvière and Charleroi basins are the main coal regions in the Hainaut province. Seismicity (up to 2020) coloured as a
function of time and sized to magnitude. Black error bars show location uncertainty. Numbers next to the largest earthquakes refer to events
in Table 1 and to macroseismic maps in the Atlas in the Supplement. Geology in the background based upon http://www.onegeology.org/.
Reproduced with the permission of © OneGeology. All rights reserved.

mining companies or by local correspondents. The catalogue              tory and in northern France, with an epicentral intensity of V
also contains non-instrumentally recorded aftershocks of the            (Fig. S31 in the Supplement).
April 1949 Havré earthquakes reported in the press, and                    Initially, we started our study using the list of Hainaut
12 earthquakes that occurred in the 1950s and that were listed          earthquakes reported in the ROB catalogue, but the new
in the Belgian activity reports of the International Union of           knowledge acquired in this study allowed us to complete this
Geodesy and Geophysics (IUGG).                                          list and improve the location reliability and to evaluate the
   After 1958 and up to 1985, adding a few additional stations          magnitude for all events. This resulted in an updated cata-
slightly improved seismic monitoring in Belgium (Camel-                 logue of 124 Hainaut earthquakes between 1887 and 1985
beeck, 1985a). The higher sensitivity of the seismometers at            (see full catalogue in the Supplement) that is now fully inte-
the permanent stations in Dourbes and Membach, operating                grated in the ROB catalogue. Since 1985, the largest events
respectively since 1958 and 1977, allowed for the detection             that have occurred in Hainaut are three ML = 2.5 earth-
of smaller, even not felt, seismic events. Hence, from 1958,            quakes, which were only weakly felt. Earthquakes of mag-
the bulletin of Belgian seismic stations has included all the           nitude below 2.0 have occurred from time to time (31 earth-
potentially felt events. The installation of a modern digital           quakes during the last 20 years), meaning that very little seis-
seismic network in 1985 has allowed for the detection and               mic energy has been released in the coal area since mining
precise location of ML > 1.0 earthquakes in the Hainaut area            activity ceased.
(Lecocq et al., 2013) and in the southern part of the Bra-
bant Massif (Van Noten et al., 2015). With the exception of
weakly felt earthquakes in 1987 in the Dour area (Camel-                3     Macroseismic information and intensity evaluation
beeck, 1988), no more events were sufficiently strong to be
felt and the seismicity stayed at a very low level in Hainaut.          3.1    Sources of information
Let us note that the Mw = 4.1 earthquake, which occurred on
20 June 1995 had its epicentre near Le Rœulx, just north of             Our study is based on macroseismic information that is de-
the coal area (Figs. 1 and 2). With a focal depth of 25 km,             rived from various sources, including published scientific
the hypocentre was located in the lower crust of the Bra-               works contemporaneous with the earthquakes, the official
bant Massif. It was felt over a large part of the Belgian terri-        macroseismic survey of the ROB, press reports, letters to the

Solid Earth, 13, 469–495, 2022                                                                https://doi.org/10.5194/se-13-469-2022
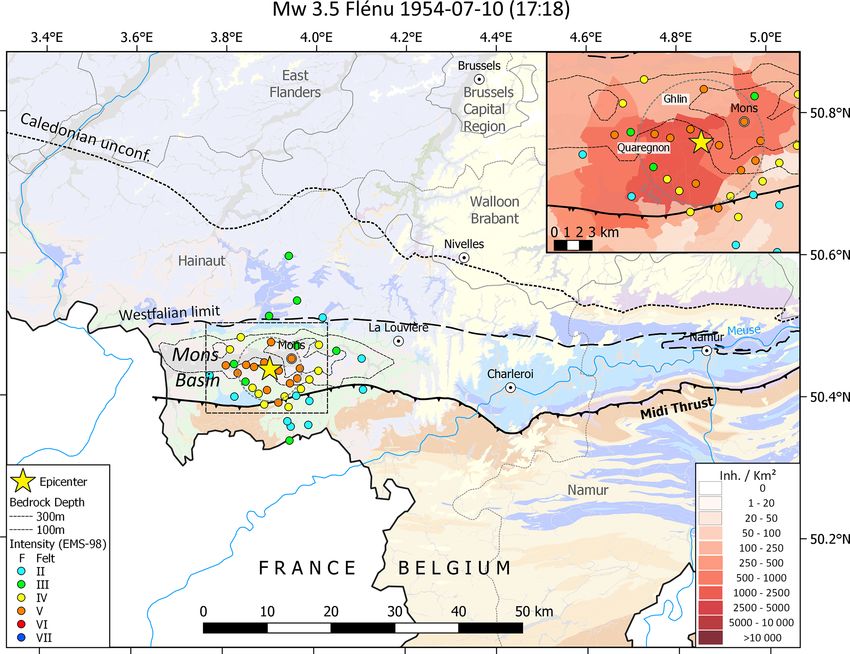
Table 1. Parameter information of 28 Hainaut coal area earthquakes that have sufficient macroseismic data to be mapped (see Atlas). See Supplement for complete explanation of
all catalogue parameters. MAP: Atlas map number; ID_E: ROB catalogue number. inq : event with official ROB macroseismic inquiry; METHOD: method to compute macroseismic
epicentre; (G. Imax (−1): barycentre of the IDPs with Imax and Imax −1 intensities; G. Perc.: barycentre of all the IDPs); ERRH: uncertainty of the reported epicentre in kilometres;
DEPTH: focal depth (km) estimated from the intensity attenuation modelling. Depths in brackets are estimated from Imax ; ERRZ: focal depths (km) using the Hainaut intensity
attenuation relationship. Errors inside the brackets are estimated from Imax ; ML : local magnitude determined from Belgian station recordings; Ms : surface-wave magnitude determined
from European station recordings using the Prague formula (Kárník, 1971); MW_m : equivalent Mw determined from macroseismic data using the empirical relationships developed
in this study; Mw : moment magnitudes determined from Camelbeeck (1985). Magnitudes in brackets are converted from ML ; IMAX: maximum observed intensity; PERC: radius of
perceptibility of the seismic event in kilometres. R3: radius of intensity III, R4: radius of intensity IV; ERRM: uncertainty of estimated magnitude; IDPs: number of IDPs. All times
https://doi.org/10.5194/se-13-469-2022
shown are UTC.
MAP ID_E DATE (yyyy-mm-dd) TIME (hh:mm:ss) REGION LAT LONG METHOD ERRH DEPTH ERRZ ML Ms Mw _m Mw IMAX PERC ERRM IDPs
S1 449 1911-04-12 16:15:– CUESMES 50.44 3.92 G. Imax (−1) 1.8 [2.4] [1.1] 3.1 4 5.4 R3 0.5 mac 22
S2 465 1911-06-01 22:51:58 RANSART 50.45 4.46 G. Imax (−1) 1.9 4.3 1.8 4.2 3.8 [3.9] 6 13.5 R4 0.3 M 53
S3 466 1911-06-03 14:35:54 GOSSELIES 50.46 4.45 G. Imax (−1) 0.6 [1.4] [0.7] 4.4 [4.0] 7 7.7 R4 0.3 M 16
S4 476 1920-01-17 03:11:04 HORNU 50.44 3.82 G. Imax (−1) 0.8 [1.6] [0.5] 3.7 [3.5] 6 5.3 R3 0.3 M 12
S5 488 1931-05-09 12:25:56 HOUDENG-AIMERIES 50.48 4.15 G. Perc. 0.9 [0.6] [0.2] 2.8 [3.0] 4_5 2.5 R3 0.3 M 5
S6 505 1936-11-05 00:41:44 GOUY-LEZ-PIETON 50.47 4.3 G. Perc. 0.9 [2.2] [0.9] 3.3 4_5 3.4 R4 0.6 mac 5
S7 517 1940-01-07 16:28:52 LA LOUVIERE 50.47 4.17 G. Imax (−1) 0.3 [1.5] [0.6] 3.5 5 5.6 R3 0.5 mac 17
S8 518 1940-01-07 20:32:44 LA LOUVIERE 50.47 4.2 G. Imax (−1) 1.9 3.1 4 4.4 R3 0.5 mac 7
S9 519 1940-01-09 03:42:07 LA LOUVIERE 50.48 4.17 G. Imax (−1) 0.2 [2.8] [1.4] 3.3 4_5 7.6 R3 0.5 mac 10
S10 534inq 1949-04-03 12:33:40 HAVRE-BOUSSOIT 50.46 4.08 G. Imax (−1) 1.8 2.2 0.8 4.6 4.3 [4.1] 7 18.0 R3 0.3 M 134
S11 538 1949-04-14 01:09:14 HAVRE-BOUSSOIT 50.46 4.07 G. Imax (−1) 3 [3.7] [1.6] 3.5 5 8.5 R3 0.5 mac 15
S12 539 1949-04-14 05:12:21 HAVRE 50.46 4.06 G. Imax (−1) 1.6 [2.4] [1.5] 3.8 [3.6] 6 9.5 R3 0.3 M 21
S13 547inq 1952-10-21 21:15:– QUAREGNON 50.43 3.88 G. Imax (−1) 2.2 [2.9] [1.9] 3.1 4 5.5 R3 0.5 mac 21
S14 548inq 1952-10-22 07:–:– FRAMERIES 50.42 3.9 G. Imax (−1) 0.8 [3.0] [1.0] 2.8 3 3.5 R3 0.4 mac 11
S15 549inq 1952-10-27 06:11:– QUAREGNON 50.43 3.87 G. Imax (−1) 2 3.5 1.2 3.5 5 11.1 R3 0.5 mac 45
S16 562inq 1954-07-10 17:18:21 FLENU 50.44 3.9 G. Imax (−1) 1.5 3.3 1.2 3.5 5 8.8 R3 0.5 mac 44
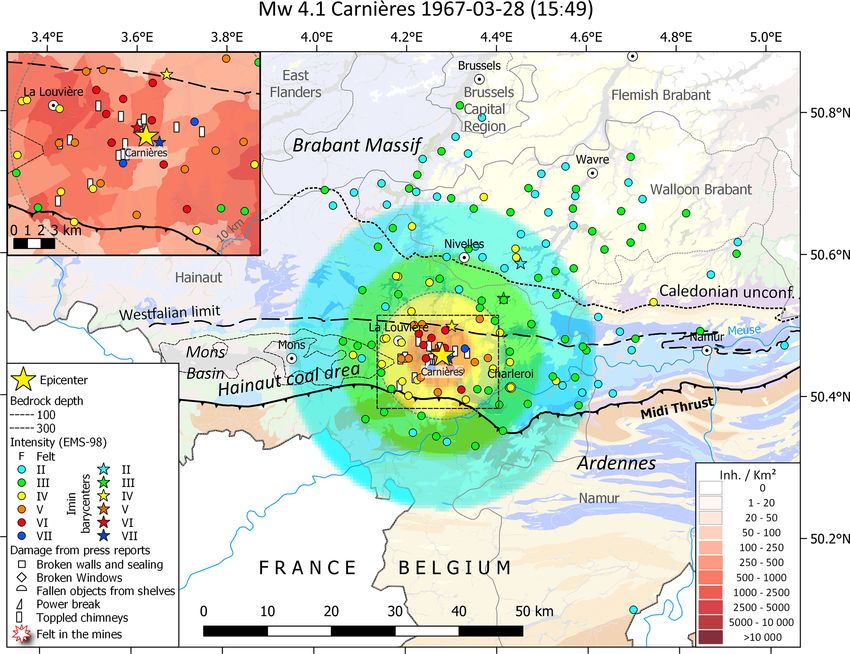
S17 582inq 1965-12-15 12:07:15 STREPY-BRACQUEGNIES 50.45 4.12 G. Imax (−1) 0.5 2.7 0.8 4.4 4 7 20.7 R3 0.3 M 99
S18 587inq 1966-01-16 00:13:19 MORLANWELZ-MARIEMONT 50.46 4.24 G. Imax (−1) 1.7 [2.6] [1.4] 2.7 [2.9] 4 7.2 R3 0.3 M 25
T. Camelbeeck et al.: Damaging impact of shallow Hainaut coal area earthquakes
S19 588inq 1966-01-16 06:51:34 MORLANWELZ-MARIEMONT 50.47 4.26 G. Imax (−1) 1.8 3.3 1.6 3.8 3.5 5 8.5 R3 0.3 M 41
S20 589inq 1966-01-16 12:32:50 MORLANWELZ-MARIEMONT 50.46 4.26 G. Imax (−1) 0.6 2.1 0.9 4.4 4 7 24.9 R3 0.3 M 120
S21 597inq 1967-03-28 15:49:25 CARNIERES 50.46 4.28 G. Imax (−1) 1.3 3 1 4.5 4.1 7 29.3 R3 0.3 M 143
S22 603inq 1968-08-12 07:26:41 LA LOUVIERE 50.46 4.21 G. Imax (−1) 1.7 2.3 1 3.7 3.6 5 6.7 R3 0.3 M 29
S23 606inq 1968-08-13 16:57:14 LA LOUVIERE 50.46 4.21 G. Imax (−1) 2 2.3 0.8 4.1 3.9 6 11.5 R3 0.3 M 59
S24 607inq 1968-09-23 04:08:13 MORLANWELZ-MARIEMONT 50.46 4.23 G. Imax (−1) 2 2.8 1.7 3 3.2 5 6.2 R3 0.3 M 25
S25 608inq 1968-09-23 05:47:16 HAINE-SAINT-PIERRE 50.47 4.22 G. Imax (−1) 1.2 [2.4] [1.1] 2.9 3 4 4.7 R3 0.3 M 25
S26 612inq 1970-11-03 08:46:00 MARCHIENNE-AU-PONT 50.41 4.41 G. Imax (−1) 1.6 2.3 1 3.9 3.6 5 9.8 R3 0.3 M 31
S27 627inq 1976-10-24 20:33:28 GIVRY 50.36 4.02 G. Imax (−1) 2.4 5.5 1.7 4.2 [3.9] 6 16.0 R3 0.3 M 95
S28 641inq 1982-09-14 19:24:35 CARNIERES 50.44 4.24 G. Imax (−1) 2 [3.5] [1.6] 3.4 [3.4] 4 6.9 R3 0.3 M 18
Solid Earth, 13, 469–495, 2022
473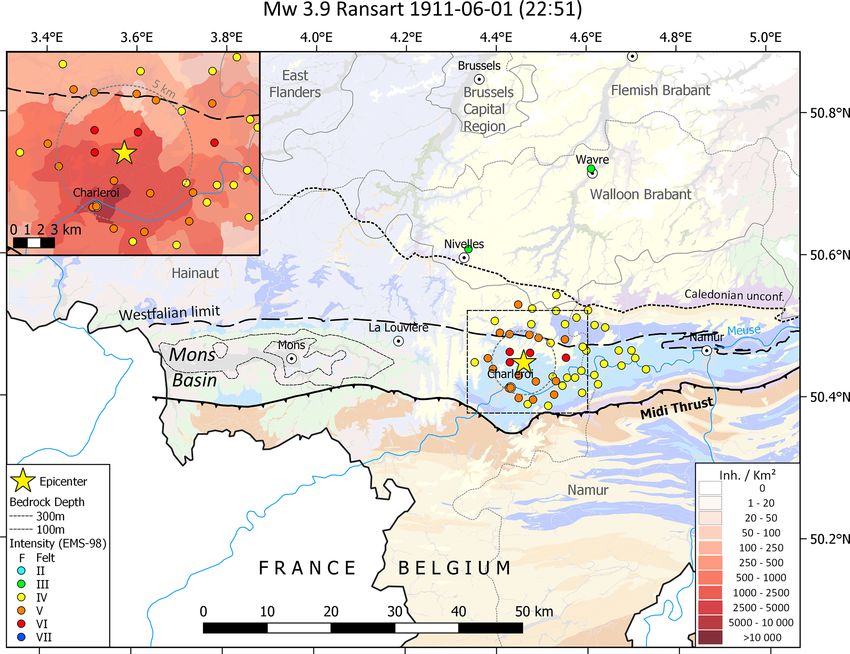
474                                       T. Camelbeeck et al.: Damaging impact of shallow Hainaut coal area earthquakes

ROB, as well as ROB, coal mining company and administra-            3.2    Intensity evaluation
tion reports. A detailed overview of these sources is provided
in the Atlas in the Supplement.                                     Based on the sources mentioned above, we re-evaluated lo-
   Scientific studies have described the effects and/or dam-        cal intensities for each earthquake at each locality. Intensity
age caused by some Hainaut earthquakes in large detail              is determined according to the EMS-98 scale, the current
(de Munck, 1887; Cornet, 1911; Cambier, 1911; Capiau,               standard in Europe. Its great advantage is the use of build-
1920; Charlier, 1949; Marlière, 1951; Van Gils, 1966). Some         ing vulnerability classes, allowing for integration of the cur-
works contain the first-hand observations of the author(s),         rent state of the building stock in the intensity determination
complemented by testimonies collected by interviewing lo-           (Grünthal et al., 1998). The background to how we evaluated
cal people, similar to what today’s Macroseismic Interven-          building vulnerability and assessed intensity is explained in
tion Group (Sira, 2015) would do.                                   Appendix A. As it was not always possible to precisely eval-
   Macroseismic surveys are indispensable to mapping earth-         uate intensity as a single integer value, we provide for each
quakes’ impact. They serve to evaluate earthquakes’ magni-          IDP two intensity values, i.e. minimum (Imin ) and maximum
tude and focal depth, intensity–distance decay and the impact       (Imax ) intensity, corresponding to the possible range of the
of the local geology on the macroseismic field (Cecić and          intensity evaluation.
Musson, 2004). Since 1932, the ROB organises a macroseis-
mic survey whenever an earthquake is felt in Belgium. For           3.3    The Hainaut intensity dataset
the Hainaut earthquakes, the surveys consisted of sending a
                                                                    Based on the intensity evaluation, we created individual files
dedicated questionnaire to the burgomasters of Belgian com-
                                                                    that contain the communal intensity data points (IDPs) for
munes up to 50 km from the epicentres asking them to care-
                                                                    each earthquake. For each of the 17 earthquakes for which
fully report earthquake observations. Between 3 April 1949
                                                                    the ROB official survey is usable to evaluate local intensities,
and 9 August 1983, 19 official ROB surveys were organised
                                                                    we composed an inquiry book presenting the English transla-
in Hainaut. 17 of them were usable for evaluating the inten-
                                                                    tion of the communal replies to the ROB questionnaire. Us-
sity for each locality (indicated with inq in Table 1) on the Eu-
                                                                    ing these books, the reader can examine the effects of each
ropean Macroseismic Scale 1998 (EMS-98; Grünthal et al.,
                                                                    earthquake at each location. The IDP files and the inquiry
1998) and to compose a macroseismic map (see Atlas). In-
                                                                    books are included in the Supplement.
tensities gathered from official surveys provided convincing
                                                                       In Table 1, we give a chronological overview of 28 earth-
results because municipalities in Belgium were small (mean
                                                                    quakes that were widely felt or caused damage in the Hain-
area size of only 19 km2 ) and numerous (2359 communes).
                                                                    aut coal area. For each of these 28 events, the impact and
After the large fusion of communes in 1977, in which Bel-
                                                                    magnitude estimation are described in Appendix B. We also
gium changed from 2359 to 596 communes (with a mean
                                                                    summarise the intensity information, the intensity barycen-
area size of 82 km2 ), macroseismic surveys of more recent
                                                                    ter and the epicentral population density of these events in
earthquakes lost the quality and resolution they once had be-
                                                                    a macroseismic map and provide these in Appendix B and
cause the new communes cover too large an area to be repre-
                                                                    in the Atlas. An example of these maps is shown in Fig. 3.
sented by only one intensity value.
                                                                    Because newspapers often report precise addresses or places
   At the end of the 19th century and beginning of the 20th
                                                                    in cities where some specific damage occurred, we geocoded
century, local and regional press reports were very beneficial
                                                                    this information and report the type of damage on the macro-
documents for seismologists in summarising earthquakes’
                                                                    seismic maps.
impact (Alexandre et al., 2007; Camelbeeck et al., 2021). In
                                                                       All this information composes a significant intensity
addition to the press information already present in the ROB
                                                                    dataset that is summarised in Table 2. This table presents the
database, we consulted the La Louvière record office collec-
                                                                    number of IDPs for each intensity unit computed by taking
tions and scanned the press archives of the State Archives
                                                                    the mean of Imin and Imax values for the different localities.
of Belgium (2021) to extend our knowledge on the Hainaut
earthquakes. The list of consulted newspapers is presented in
the Atlas.                                                          4     Intensity attenuation and focal depth estimation
   Additional information comes from letters of individuals
or small reports addressed by the coal mining companies to          Seismic intensity is an empirical measure of the severity
the ROB at the time of mining exploitation (Somville, 1936).        of ground motions generated by earthquakes. Determining
The ROB also organised field missions after the 3 April 1949        intensity inside the radius of an earthquake’s perceptibil-
[id 534] and 10 July 1954 [id 562] earthquakes to provide           ity allows for mapping of the ground motion strength and
epicentral damage reports.                                          its spatial variability. The macroseismic field directly relates
                                                                    to earthquake epicentre location, focal depth and magnitude
                                                                    and the near-field energy absorption coefficient (Ambraseys,
                                                                    1985). Hence, determining the parameters controlling seis-
                                                                    mic energy absorption offers the possibility to evaluate the

Solid Earth, 13, 469–495, 2022                                                           https://doi.org/10.5194/se-13-469-2022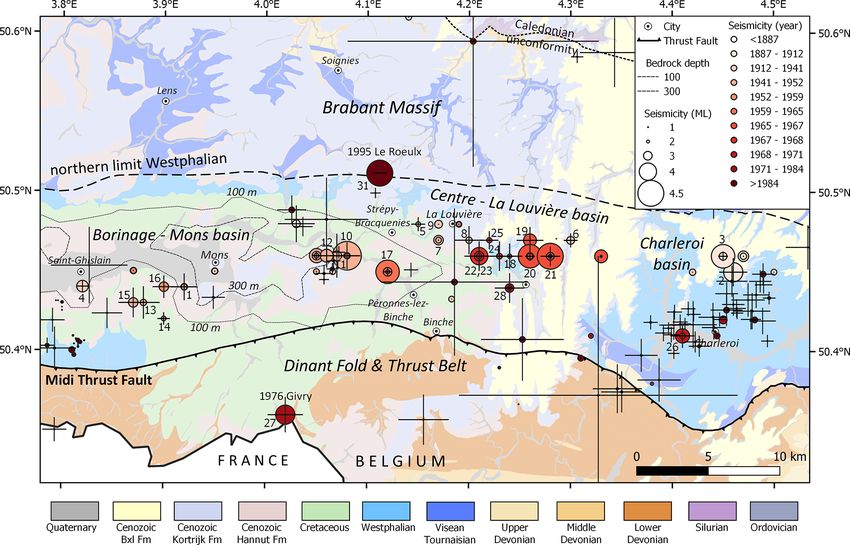
T. Camelbeeck et al.: Damaging impact of shallow Hainaut coal area earthquakes 475
Table 2. Summary of intensity (EMS-98) data for the largest earthquakes in the Hainaut coal area and which are mapped in the Atlas. MAP:
map number in Supplement. inq : earthquake with an official ROB intensity survey; ∗ : earthquake used for Hainaut intensity attenuation
modelling. Total: amount of IDPs with mean intensity of Imin and Imax .
MAP ID_E DATE (yyyy-mm-dd) F II II–III III III–IV IV IV–V V V–VI VI VI–VII VII Total
S1 449 1911-04-12 2 3 14 2 1 22
S2 465∗ 1911-06-01 2 31 14 2 4 53
S3 466 1911-06-03 11 2 1 1 1 16
S4 476 1920-01-17 9 1 2 12
S5 488 1931-05-09 4 1 5
S6 505 1936-11-05 5 5
S7 517 1940-01-07 2 6 5 3 1 17
S8 518 1940-01-07 7 7
S9 519 1940-01-09 5 2 2 1 10
S10 534inq,∗ 1949-04-03 24 3 36 1 32 8 13 6 7 2 2 134
S11 538 1949-04-14 7 6 2 15
S12 539 1949-04-14 12 2 3 2 2 21
S13 547inq 1952-10-21 2 1 12 2 4 21
S14 548inq 1952-10-22 1 1 7 1 1 11
S15 549inq 1952-10-27 6 13 4 12 2 8 45
S16 562inq,∗ ‘1954-07-10 11 7 1 9 2 12 2 44
S17 582inq,∗ 1965-12-15 23 30 6 17 19 2 2 99
S18 587inq 1966-01-16 3 1 13 4 2 2 25
S19 588inq,∗ 1966-01-16 15 1 8 2 12 1 2 41
S20 589inq,∗ 1966-01-16 37 42 2 22 1 12 3 1 120
S21 597inq,∗ 1967-03-28 40 56 3 22 1 10 9 2 143
S22 603inq,∗ 1968-08-12 6 2 1 12 8 29
S23 606inq,∗ 1968-08-13 18 9 10 17 1 4 59
S24 607inq,∗ 1968-09-23 10 4 9 1 1 25
S25 608inq 1968-09-23 13 5 2 5 25
S26 612inq,∗ 1970-11-03 6 9 3 5 8 31
S27 627inq 1976-10-24 24 24 1 33 1 10 2 95
S28 641inq 1982-09-14 1 1 8 1 7 18
Total Intensity 55 242 13 305 45 259 28 142 13 36 2 8 1148
location and magnitude of past earthquakes from their in- mic attenuation characteristics are more variable in the frac-
tensity spatial distribution (Sbarra et al., 2019; Provost and tured upper layers of the crust because of large lateral vari-
Scotti, 2020). Creating an attenuation model also gives the ations of mechanical characteristics of rocks and sediments
possibility to predict intensities for a specific earthquake with near the surface. Hence, for shallow earthquakes, it would be
given focal depth and magnitude. more appropriate to develop a new local intensity attenuation
model than to use these western and central European mod-
4.1 Methodology els. Moreover, given the large available intensity dataset for
the Hainaut coal area, it would be even more realistic (Ta-
ble 2).
Ambraseys (1985), Hinzen and Oemisch (2001), Bakun and
To develop a local Hainaut intensity attenuation model,
Scotti (2006), and Stromeyer and Grünthal (2009) devel-
we used the classical formulation developed by Kövesligethy
oped regional intensity attenuation models using earthquake
(1907) and still widely used today (e.g. Ambraseys, 1985;
datasets from western and central Europe. Except for Am-
Stromeyer and Grünthal, 2009):
braseys (1985), who used isoseismal radii, these authors
all based their models on IDP distributions. Knuts et al. s
2 + Z2
(2016) and Camelbeeck et al. (2021) successfully applied R − b∗
p
2 + Z 2 − Z , (1)
I = I0 − a · log R
these models to determine epicentral locations and mag- Z2
nitudes of historical earthquakes in Belgium. Even though
these datasets include information on very shallow earth- where I is the intensity at epicentral distance R from an
quakes, the small number of shallow events with respect earthquake source at focal depth Z and I0 is the epicentral
to deep ones makes these models less suitable for simula- intensity. a and b are parameters that respectively correspond
tion of the macroseismic field of shallow earthquakes. Seis- to the multiplication of the geometric spreading and energy
https://doi.org/10.5194/se-13-469-2022 Solid Earth, 13, 469–495, 2022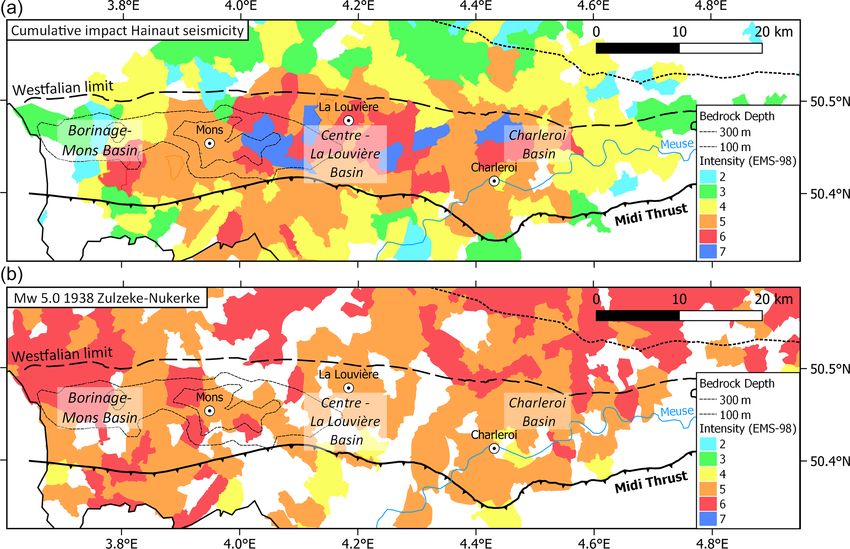
476                                         T. Camelbeeck et al.: Damaging impact of shallow Hainaut coal area earthquakes

Figure 3. Intensity information of Hainaut events is represented in macroseismic maps such as for the 1967 Mw = 4.1 (ML = 4.5) Carnières
earthquake (no. 21 in Table 1). The inset shows localities where specific damage was reported in press reports. Note the asymmetric macro-
seismic field: this event was felt more northwards within the borders of the Brabant Massif than southwards in the Ardenne, which results
in a northwards shift of the lower Imin intensity (IV, III and II) barycentres. In the background, the Hainaut intensity attenuation model
developed in this study (see Sect. 4.2) is applied to the parameters of this event. Note that this attenuation model only can be applied within
the coal area (between the Midi Thrust and Westphalian limit). Modelled Imax = VI, but locally intensity of VII was observed. See the Atlas
in the Supplement for other events. Geology in the background based upon http://www.onegeology.org/. Reproduced with the permission of
© OneGeology. All rights reserved. Times in all figures are given in UTC.

absorption factors by the proportionality factor between in-              below in this section) and its standard deviation, representing
tensity and ground motion acceleration (Ambraseys, 1985;                  the intensity variability inside the distance bins. The number
Stromeyer and Grünthal, 2009). a and b can be derived by                  of IDPs in each bin progressively increases up to a distance
fitting Eq. (1) to the IDPs of calibration earthquakes with               of 15 km from the epicentre and then abruptly decreases. Be-
a well-determined location and focal depth. Solving the pa-               yond this distance, there are only a few IDPs, which are of
rameters of Eq. (1) using intensity datasets can performed                low intensities, indicating that the earthquake was likely not
by three different approaches: (1) using intensities and epi-             felt in many localities contributing to these bins. This sug-
central distances of all individual observations; (2) using the           gests that the mean values computed from these IDPs would
mean distance and its standard deviation by intensity bin-                overestimate the mean intensity of the bins because “not felt”
ning; and (3) using the mean intensity and its standard de-               localities are not included in the computation. This exam-
viation by distance binning (used in this work).                          ple also shows the rapid intensity decrease with increasing
                                                                          distance in the coal area (Fig. 4), which for the 15 Decem-
4.2   Intensity attenuation in the Hainaut coal area                      ber 1965 earthquake corresponds to a decrease of three in-
                                                                          tensity grades over a distance range of 15 km. North of the
Figure 4 presents an example for the 15 December 1965                     Hainaut coal area, inside the borders of the Brabant Mas-
earthquake (macroseismic map in Appendix B) and shows                     sif (see e.g. Figs. 3, B2 and B4), the largest earthquakes are
how IDP epicentral distance binning is applied. For each dis-             weakly felt with intensity II to III up to a distance exceed-
tance bin of 2.5 km, the diagram reports the mean intensity               ing 40–50 km, suggesting a slower intensity attenuation than
minus I0 (determined from the IDP distribution – see further              in the coal area. South of the Hainaut coal area, the Midi

Solid Earth, 13, 469–495, 2022                                                                  https://doi.org/10.5194/se-13-469-2022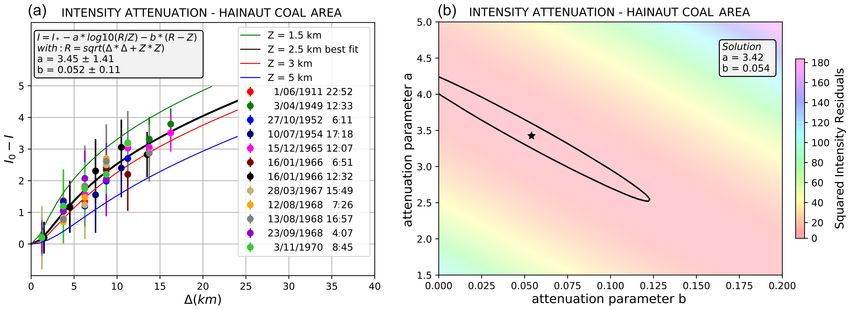
T. Camelbeeck et al.: Damaging impact of shallow Hainaut coal area earthquakes                                                      477

                                                                        earthquake (Fig. S29; Camelbeeck, 1993; Camelbeeck et al.,
                                                                        2021), which occurred in the Liège coal area, in a similar
                                                                        geological context as Hainaut.
                                                                           The main hypothesis in our fitting analysis is that intensity
                                                                        attenuation is homogeneous in the Hainaut coal area, which
                                                                        means that the parameters a and b have the same values for
                                                                        all seismic events in the area. Hence, regarding the uncer-
                                                                        tainty of the attenuation model and the data, the observed
                                                                        variations in the intensity decay with increasing distance be-
                                                                        tween the different calibration earthquakes are only associ-
                                                                        ated with a difference in focal depth. We determine parame-
                                                                        ters a and b in two steps.

                                                                         1. As focal depth is unknown for the calibration earth-
                                                                            quakes, the first step in the analysis was to evaluate their
                                                                            depth by fitting each earthquake dataset to Eq. (1) (see
Figure 4. Intensity attenuation of the 15 December 1965 Strépy-             macroseismic maps in the Atlas). As Eq. (1) has four un-
Bracquegnies earthquake expressed as mean intensity change rel-             knowns and the number of distance bins for each earth-
ative to I0 (blue dots) calculated for bins of 2.5 km (histogram).          quake does not exceed seven, we fixed the value of the
Vertical blue bars show the intensity standard deviations for each          parameter a, and inverted the equation to evaluate the at-
distance bin that expresses the intensity variability in the bin. The       tenuation parameter b, the earthquake focal depth Z and
legend reports local parameters fitting the intensity attenuation of        epicentral intensity strength I0 . We considered that b is
Eq. (1), with the a parameter fixed to 2.80.                                more dependent on the highly variable material prop-
                                                                            erties near the Earth’s surface than a, which should be
                                                                            relatively similar in Hainaut than elsewhere in Europe.
fault (Fig. 2) seems to play the role of a seismic barrier and              We adopted the value a = 2.80 of the WLQ model of
intensity decays more rapidly in the Ardenne Massif than in                 Stromeyer and Grünthal (2009). Table 3 reports the re-
the Brabant Massif, agreeing with the observation of Charlier               sults of this analysis. Our main conclusion is that all the
(1951).                                                                     studied Hainaut earthquakes have similar focal depths,
   IDPs at distances larger than 15 km should hence not be                  ranging between 1.6 and 4.0 km, with uncertainties of
used to analyse intensity attenuation in the coal area because              around 1.5 km.
(1) IDPs beyond these distances bias the mean intensity val-             2. In the second step, we considered that the 12 calibration
ues in the bins, and (2) the intensity attenuation of the coal              Hainaut earthquakes have the same focal depth, which
area differs from attenuation in the Brabant Massif and in                  is supported by the results of the first step of the anal-
the Ardenne. Hence, applying a distance range larger than                   ysis. Based on the results of the first step, we fixed the
15 km would not properly model the attenuation in the coal                  value of I0 by considering that the mean intensity of
area, but would provide an intermediate attenuation includ-                 the first distance bin of each earthquake equals I0 –0.3.
ing crustal characteristics from these three areas. We prefer               We represent this estimation of I0 with I ∗ . Then, we in-
distance binning of intensity with small bins of 2.5 to 3 km                verted the complete dataset to evaluate a, b and the focal
over intensity binning as it provides more data points, which               depth, i.e. identical for all the earthquakes, which min-
is more appropriate to invert parameters a and b of Eq. (1).                imised the residuals by using least-squares modelling.
For example, for the 15 December 1965 earthquake (Fig. 4),                  Figure 5a presents the results of this inversion, in which
the mean intensities of six distance bins within 15 km pro-                 a = 3.45 ± 1.41 and b = 0.052 ± 0.11, while the focal
vide a more robust fit with Eq. (1) than the mean distances of              depth that best fits the data is 2.5 km.
four intensity bins, covering three intensity units, would do.
   The dataset used for the attenuation modelling is relatively            The relatively small number of data and the lack of infor-
small, with 76 mean intensity values obtained by distance               mation at distances larger than 20 km cause the large uncer-
binning 12 key earthquakes. In our computation we also in-              tainties of a and b. However, these uncertainties rely on their
cluded two additional events (identified by an ∗ symbol in              relative dependence, which is well illustrated by their joint
Table 3) because, although they occurred outside the Hain-              confidence region in Fig. 5b. Figure 6 presents the intensity
aut coal area, the geological context of the felt observations          attenuation curves corresponding to the best solution and the
is similar to the earthquakes that occurred inside the Hainaut          two extreme solutions at the 0.95 confidence region for focal
coal area. These two events are the 24 October 1976 earth-              depths ranging from 1 to 6 km. The difference between these
quake (Fig. S27), which occurred a few kilometres south                 models for a given focal depth is very small for distances
of the Hainaut coal area, and the 8 November 1983 Liège                 of less than 15 km, i.e. 0.3 intensity units for a distance of

https://doi.org/10.5194/se-13-469-2022                                                               Solid Earth, 13, 469–495, 2022
478 T. Camelbeeck et al.: Damaging impact of shallow Hainaut coal area earthquakes
Figure 5. (a) Fitting the intensity dataset of 12 calibration earthquakes to Eq. (1) to determine a and b attenuation parameters and the focal
depth considering a uniform depth for all events. (b) Least-squares fitting by sampling the a and b intensity parameters space: the solution is
represented by the star, and the black ellipse shows the limits of the 0.95 confidence region.
Table 3. Depth evaluation of calibration earthquakes used for attenuation modelling. I0 : epicentral intensity; Z: depth; b: attenuation param-
eter b; step: length of distance bin in kilometres; n: number of distance bins. 1 First step of the analysis in which parameter a is held constant
at a value of 2.80; 2 second step of the analysis. ∗ Earthquake not included in the attenuation modelling but used for verifying the model.
(1)
id_earth Date (yyyy-mm-dd) Time (hh:mm) Lat (◦ N) Lon (◦ E) I0 Z (km)1 b1 I02 Z (km)2 step n
465 1911-06-01 22:52 50.46 4.46 6.15 ± 0.14 2.4 ± 0.6 0.010 ± 0.026 5.91 ± 0.48 4.3 ± 1.8 2.5 5
534 1949-04-03 12:33 50.45 4.07 7.24 ± 0.37 1.7 ± 0.8 0.064 ± 0.034 6.95 ± 0.52 2.2 ± 0.8 2.5 7
549 1952-10-27 06:11 50.44 3.90 5.29 ± 0.37 2.3 ± 1.2 0.022 ± 0.045 5.03 ± 0.41 3.5 ± 1.2 2.5 6
562 1954-07-10 17:18 50.46 3.88 5.43 ± 0.37 2.3 ± 1.1 0.060 ± 0.032 5.39 ± 0.44 3.3 ± 1.2 3 5
582 1965-12-15 12:07 50.45 4.09 6.20 ± 0.24 2.2 ± 0.7 0.046 ± 0.022 6.19 ± 0.47 2.7 ± 0.8 2.5 7
588 1966-01-16 06:51 50.46 4.23 4.86 ± 0.19 2.1 ± 0.6 0.023 ± 0.030 4.77 ± 0.56 3.3 ± 1.6 2.5 5
589 1966-01-16 12:32 50.47 4.26 6.00 ± 0.19 3.1 ± 0.9 0.150 ± 0.039 6.23 ± 0.66 2.1 ± 0.8 3.5 5
597 1967-03-28 15:49 50.45 4.27 6.68 ± 0.79 1.8 ± 1.7 0.112 ± 0.073 6.21 ± 0.47 3.0 ± 1.0 3 7
603 1968-08-12 07:26 50.45 4.21 5.33 ± 0.29 2.0 ± 0.7 0.088 ± 0.030 5.44 ± 0.70 2.3 ± 1.0 3 4
606 1968-08-13 16:57 50.46 4.23 5.81 ± 0.27 4.0 ± 1.9 0.162 ± 0.067 6.01 ± 0.54 2.3 ± 0.8 2.5 6
607 1968-09-23 04:07 50.46 4.23 4.68 ± 0.39 2.1 ± 1.4 0.048 ± 0.098 4.76 ± 0.76 2.8 ± 1.7 2.5 4
612 1970-11-03 08:45 50.40 4.41 5.16 ± 0.35 3.2 ± 2.1 0.089 ± 0.093 5.29 ± 0.63 2.3 ± 1.0 2.5 5
627∗ 1976-10-24∗ 20:33 50.36 3.98 5.08 ± 0.23 4.0 ± 1.5 0.036 ± 0.026 5.13 ± 0.38 5.5 ± 1.7 3 5
641∗ 1983-11-08∗ 00:49 50.63 5.51 7.13 ± 0.18 3.3 ± 0.9 0.044 ± 0.017 6.91 ± 0.28 5.7 ± 1.5 3 7
20 km, but becomes more important at larger distances. The central intensity of the 12 reference earthquakes in the Hain-
uncertainty of the two parameters reflects the fact that a con- aut coal area and the 1976 and 1983 Liège earthquakes. Fig-
trols the short distance behaviour and is better determined, ure 7 presents the results of this modelling for the 15 De-
while b characterises the curves at a large distance. cember 1965 earthquake. In the Atlas, the same diagram
is provided for the 13 other earthquakes. For earthquakes
4.3 Earthquake focal depth other than the 12 calibration events in Table 1, macroseis-
mic datasets are less complete and the full modelling cannot
Figure 6 reports the influence of focal depth from 1.0 to be applied. Nevertheless, the available information is suf-
6.0 km on the intensity attenuation curves. Changing the fo- ficient to correctly evaluate focal depth for most of them.
cal depth has a stronger effect on the attenuation function For each event, the input data for focal depth determina-
than the uncertainties of the attenuation parameters. This ob- tion are Imax , the maximal observed intensity, and the in-
servation indicates that focal depth can be evaluated with a tensity I and epicentral distance 1 for each observed IDP.
good accuracy using IDPs and that the differences in attenu- For each of these events, we created 250 different datasets
ation observed between the different earthquakes in the mod- by adding random noise with possible values of −0.5, 0
elling (Fig. 5a) reflect the small differences in their respec- or +0.5 to the intensity I of the IDPs, which represents
tive focal depths. Subsequently, we used the new Hainaut the uncertainty of each intensity evaluation. For each of the
attenuation model to estimate the focal depth and the epi- modelled IDPs, we searched the focal depth Z minimising
Solid Earth, 13, 469–495, 2022 https://doi.org/10.5194/se-13-469-2022T. Camelbeeck et al.: Damaging impact of shallow Hainaut coal area earthquakes 479
Figure 6. Variation of I0 −I as a function of epicentral distance cor- Figure 7. Evaluation of focal depth and epicentral intensity for the
responding to the intensity attenuation models of Fig. 5. The curves 15 December 1965 Strépy-Bracquegnies earthquake. The first seven
correspond to the best fitting solution (full lines) and the two ex- distance bins (blue) are used in the modelling. Similar diagrams are
treme solutions (dotted and dashed lines) at the 0.95 confidence re- provided in the Atlas for the 13 other earthquakes for which this
gion for focal depths ranging from 1 to 6 km. method was used.
on the approximate parameterisation of the scattering prop-
I −Imax = −3.45·log(1/Z)−0.052·(1−Z) by testing focal
erties of the crust between the coal area and the town of
depths in steps of 0.1 km over a range from 0 to 10 km. The
Dourbes, the used method furnishes a reliable ratio of the
computed mean focal depths and the sigma value of the dis-
seismic moment values between the different earthquakes.
tribution from the 250 different models for each earthquake
Denieul (2014) used the recordings of the CEA-LDG (Com-
are indicated in Table 1 inside the brackets. For some other
missariat à l’Energie Atomique, Laboratoire de Détection et
earthquakes, like the 1887 Havré and 1904 Fleurus events,
de Géophysique, France) seismic network to determine mo-
or events that occurred between 1950 and 1960, only slight
ment magnitudes of significant earthquakes in France and
damage was reported and too few IDPs are available to com-
surrounding regions that occurred from 1963 to 2013. This
pute their depth. However, from the estimations of Imax and
study determined Mw for the three earthquakes in Hainaut
the published perceptibility radius, we can still evaluate their
that occurred on 15 December 1965 at 12:07 UTC, 16 Jan-
focal depth by directly plotting the perceptibility radius as a
uary 1966 at 12:32 UTC and 28 March 1967 at 15:49 UTC
function of the observed intensity decrease, as represented in
as respectively 4.0, 4.0 and 4.1, with a 1σ uncertainty of 0.2.
Fig. 6. Results show that most of these events are very shal-
These results suggest that the moment magnitude determined
low. For these events, we indicate the estimated focal depth
from Camelbeeck (1985b) should be diminished by a con-
inside the brackets in the full catalogue in the Supplement,
stant factor of 0.3 magnitude units. This result also allows
but without any uncertainty.
for re-evaluation of the relationship between ML and Mw for
the Hainaut earthquakes furnished by Camelbeeck (1985b)
as
5 Instrumental magnitudes and magnitude determined
from macroseismic data Mw = 1.294(±0.08) + 0.610(±0.059) · ML , (2)
Camelbeeck (1985a, 1993) determined the local magnitude which is valid between ML = 2.6 and ML = 4.6.
ML of the Hainaut earthquakes between 1911 and 1985 when We reported in Table 1 the instrumental magnitude val-
the seismic measurements from at least one seismic station ues that were determined for earthquakes in the Hainaut coal
were available. For some events, it was also possible to de- area. In addition, we used Eq. (2) to estimate Mw for the
termine the surface-wave magnitude Ms using the Prague earthquakes for which only ML was determined. For those
formula of Kárník (1971). Camelbeeck (1985b) estimated events, the Mw value and its uncertainty are indicated in-
the seismic moments and Mw for 17 earthquakes that oc- side the brackets, while Mw determined from Camelbeeck
curred between 1965 and 1970 in the Hainaut coal area based (1985b) modified by Denieul (2014) are reported with their
on the coda-wave envelope measured in the paper record- uncertainty without brackets. Thanks to the fact that instru-
ings from the Belgian seismic station of Dourbes. Even if mental magnitudes were determined for a part of the earth-
the absolute value of these seismic moments was dependent quakes for which macroseismic data are available, we were
https://doi.org/10.5194/se-13-469-2022 Solid Earth, 13, 469–495, 2022480 T. Camelbeeck et al.: Damaging impact of shallow Hainaut coal area earthquakes
play a more significant role in seismic waves energy attenua-
tion from the hypocentre to the surface and that body waves
are a major part of the radiated energy to the surface, b is
fixed to 2.0 in Eq. (3).
Hence, for earthquakes shallower than 1.5 km, we deter-
mined Mw using the following relationship:
Mw = 0.948(±0.130) + 2.0 · log(h)
+ 0.346(±0.098) · Imax . (5)
In Table 1, all the earthquakes for which Mw was determined
using macroseismic information and Eq. (4) or Eq. (5) are
reported in column Mw_m .
6 Discussion
In this discussion, we emphasise four aspects of the seismic-
Figure 8. Relationship between Mw and Imax (approximation for
ity that occurred in the Hainaut coal area between the end
I0 ) determined for 12 calibration earthquakes in the Hainaut coal
area (three data points are not visible because they are superim-
of the 19th century and 1985. First, we compare the impact
posed). and intensity attenuation of the Hainaut earthquakes with the
ones of shallow earthquakes with similar magnitudes in other
regions of the world. Second, we describe the cumulative im-
able to establish relationships between earthquake magnitude pact of the Hainaut coal area seismicity and compare it to the
and macroseismic parameters. This allows for determination effects of a few larger magnitude 20th century earthquakes
of a formula for the robust evaluation of earthquake magni- on the Hainaut area, suggesting that the Hainaut seismic-
tude Mw directly from macroseismic information for events ity could be overestimated in current seismic hazard maps.
that were not recorded by seismic stations. Third, we discuss the pertinence of our new Hainaut intensity
We used the classical model (Sponheuer, 1962; Van Gils attenuation relationship in the light of the spatial resolution
and Zaczek, 1978; Ambraseys, 1985; Stromeyer et al., 2004): of our intensity dataset and the local and regional geological
configuration. Last, we underline the importance of our focal
M = a · I0 + b · log(h) + c, (3) depth determinations to discuss the causality of seismicity in
and around the Hainaut coal area.
which determines the magnitude with knowledge of the epi-
central intensity I0 and focal depth h. As the range of focal 6.1 How fast is the Hainaut attenuation?
depth in our calibration dataset of 12 earthquakes is limited
around 2.5 km (Fig. 6), it was not possible to find a reliable Our study determines that the Hainaut events were locally
relationship with focal depth. However, I0 is a parameter re- damaging when Mw was greater than 3.5, and that damage
sulting from the fitting of IDPs with Eq. (1) and hence cannot stayed spatially limited because intensity decreased fast, by
be determined for earthquakes with only few IDPs (e.g. for two grades in a range of distances from a few to a maxi-
earthquakes of the 19th or first half of 20th century or the af- mum of 7–8 km from the epicentre (Fig. 6). From the per-
tershocks of strong earthquakes). In this case, the only avail- spective of seismic hazard issues, it is relevant to evaluate
able parameter is the maximal observed intensity Imax (see whether or not this attenuation and the spatial extension of
Table 1). For this reason, we established a relationship be- damage are similar in other regions worldwide where shal-
tween Mw and Imax (Fig. 8) rather than I0 so that a specific low seismicity occurs. To tackle this question, we compare
model can be used for earthquakes with few macroseismic in Fig. 9a and b the intensity datasets of Mw = 3.5 and
observations: Mw = 4.0 earthquakes in Hainaut with shallow earthquakes
of similar magnitude induced or triggered by gas extrac-
Mw = 1.744(±0.130) + 0.346(±0.098) · Imax . (4) tion (Groningen gasfield, NL; Dost and Kraaijpoel, 2013) or
wastewater injection (Oklahoma, USA; Atkinson, 2020). We
also provide the Hainaut intensity attenuation curve in these
This relationship is certainly valid for earthquakes with fo- two diagrams. In Fig. 9c, we compare the Hainaut attenua-
cal depths in the range 1.5 to 4.0 km as the ones in our cal- tion curve with Mw = 5.0 earthquakes induced or triggered
ibration dataset and their associated seismic sequences, but by potash and salt mining (Völkerhausen, DE; Leydecker
it would overestimate the magnitude for earthquakes closer et al., 1998) or rock removal above a pre-stressed fault (Le
to the surface. Considering that geometrical spreading would Teil, FR; Schlupp et al., 2021).
Solid Earth, 13, 469–495, 2022 https://doi.org/10.5194/se-13-469-2022T. Camelbeeck et al.: Damaging impact of shallow Hainaut coal area earthquakes 481
In this analysis, we compute the mean intensity decay and
its standard deviation for hypocentral distance bins of 3 km
through the individual Hainaut datasets. The main result is
that, regardless of the magnitude, the mean intensity and the
mean plus one standard deviation of the bins for events else-
where in the world are larger than the Hainaut attenuation
relationship and most of the Hainaut bins. This is clearly vis-
ible at a large distance (Fig. 9) and is very likely associated
with the location of the Hainaut coal deposits in the frontal
zone of the Variscan tectonic belt. In this region, strong atten-
uation can be associated with the combined effect of a high
fracturing degree of the subsurface and a low Q factor asso-
ciated with the slow propagation velocity of coal deposits.
At short distance, it is difficult to differentiate a real dif-
ference in the mean value and the mean value plus 1σ of the
intensity bins for magnitudes Mw = 3.5 and Mw = 4.0. Nev-
ertheless, despite their greater focal depth, the bins of the
Huizinge earthquake (depth = 3 km) and Oklahoma events
(depth = 5 km) show similar or slightly greater values than
the ones for Hainaut events (mean depth of 2.5 km), sug-
gesting a slightly more damaging impact than in Hainaut.
Moreover, if an earthquake of magnitude Mw = 5.0 would
have occurred in Hainaut, our analysis shows that its impact
would have been smaller than the impact of the very shallow
Le Teil 2019 and Völkershausen 1989 seismic events. For
these two events, the radius in which the mean intensity is
larger than V is twice as large as the intensity V radius of the
Hainaut earthquakes.
6.2 The impact of the Hainaut seismic activity
The macroseismic maps in the Supplement present the im-
pact and the importance of damage caused by the different
earthquakes that stroke the Hainaut area between 1887 and
1985. The analysis presented in Fig. 9, in which the intensity
distribution from, among others, one and four Hainaut earth-
quakes of magnitudes Mw 3.5 (panel a) and Mw 4.0 (panel b)
respectively are shown, demonstrates the average impact of
these Hainaut events. By computing the median and 84th per-
centile (84 pct) distance for each damaging intensity unit, we
conclude that for a Mw = 3.5 event at 2.3 km depth in Hain-
aut, negligible to slight damage (starting from I = V) can be
expected up to an epicentral distance of 3 km (84 pct: 4 km).
For Mw = 4.0 events, substantial damage (I = 7) can occur
up to a median epicentral distance of 2 km (84 pct: 4 km);
moderate damage (starting from I = VI) up to 3 km (84 pct:
Figure 9. Comparison of binned (3 km) intensity–distance obser-
7 km); negligible to slight damage up to 5 km (84 pct: 8 km). vations for (a) Mw = 3.5 earthquakes in Hainaut, in Huizinge
To obtain a global view of the damaging character of the (Groningen gasfield, NL; Dost and Kraaijpoel, 2013), and in Okla-
Hainaut seismicity, we report in Fig. 10 the maximum inten- homa (USA; Atkinson, 2020), (b) Mw = 4.0 earthquakes in Hainaut
sity observed within each commune in the Hainaut coal area and in Oklahoma (US), and (c) Mw = 5.0 earthquakes in Le Teil
for all 124 events of the Hainaut seismic catalogue. Maxi- (FR; Schlupp et al., 2021), Völkershausen (DE; Leydecker et al.,
mum intensity equal to or greater than V was observed in all 1998) and Oklahoma (USA). IDPs (small grey dots), mean inten-
the localities in a 60 km long and 15–20 km wide range of the sity (coloured dots or squares) and standard deviation (bars) of the
coal area, which extends from 10 km east of the French bor- different intensity datasets are shown in comparison with the fast
der to 15 km west of the city of Charleroi. Outside the coal decay of the Hainaut intensity attenuation relationship (green line).
Z = depth in kilometres.
https://doi.org/10.5194/se-13-469-2022 Solid Earth, 13, 469–495, 2022482 T. Camelbeeck et al.: Damaging impact of shallow Hainaut coal area earthquakes area, this seismicity had no damaging impact, and only in a created by mining. Indeed, many buildings in the Hainaut few communes was intensity V observed. The area between coal area were damaged due to underground progression of Mons and Charleroi centred on La Louvière was the most coal exploitation and the progressive settling that followed. affected part, with widespread repartition of maximal inten- Troch (2018a, b) present the example of the locality of Gos- sity VI, including some localities where intensity VII was selies near Charleroi, which was completely devastated be- observed. In the Borinage-Mons basin, intensity VI was only tween the two world wars because of extensive coal produc- observed locally in a few communes in its western part. How- tion. In some areas, mine subsidence led to surfacing ground- ever, this maximal intensity may have been observed more water and increased the risk of flooding. It was necessary to than one time in some localities. evacuate the water by using pumping systems; in other cases, Apart from the Hainaut seismicity, also two other 20th wetlands, marshes, swamps, ponds and lakes appeared in the century earthquakes had a strong local impact on the Hain- affected area (Troch, 2016). The subsidence and the perma- aut coal area: the strongly damaging 11 June 1938 Zulzeke- nency of humidity in some areas caused by mining activities Nukerke Mw = 5.0 (S30) and the 20 June 1995 Mw = 4.1 are also factors affecting the resistance of buildings. Le Rœulx (S31) earthquakes in the Brabant Massif (Fig. 1). Both events occurred much deeper (20 and 25 km respec- 6.3 Intensity attenuation modelling tively) and had a totally different effect than the Hainaut earthquakes because they were widely felt. In many localities We assume in Sect. 4.2 that the spatial distribution of inten- in the coal area, intensity V was reported. Intensity VI was sity observations is adequate in number and is spatially unbi- observed mostly in the western part. Despite that the 1938 ased, which allowed for correctly quantifying the rapid inten- earthquake occurred 40 to 45 km north-west of the western sity decay with epicentral distance in the coal areas. For the extremity of the Hainaut coal area, this event caused more lo- 12 earthquakes included in the attenuation analysis, 813 IDPs cal slight damage in the Borinage-Mons basin than the max- are available (Table 2). These IDPs are mainly derived from imal cumulative impact of the Hainaut seismicity (Fig. 10b). the information provided by the ROB official survey since Outside the coal area, the impact of the 1938 earthquake is 1949. The high population density in the coal area explains even larger everywhere. Similar conclusions arise from the why, within a radius of 15–20 km, most of the local author- few original documents concerning the effects of historical ities answered the inquiry (see Fig. B1 or the Atlas). For earthquakes. Some of them had a larger impact in the coal earthquakes older than 50 years, such a density of informa- area than the individual 19th or 20th century Hainaut earth- tion provides a real opportunity to study earthquake impacts quakes. Apart from the 23 February 1828 earthquake (see because there are very few biases in azimuth and distance. Sect. 2), the earthquake that had the largest impact in the Outside the coal area, the population density is lower and area is the 18 September 1692 Mw = 6.0 earthquake, which the areas are more rural, which could explain why local au- occurred in the Belgian Ardenne (Fig. 1). This large earth- thorities took less care in answering the official inquiry and quake caused significant damage in the city of Mons where why information mainly came from the larger localities. Of many houses, churches and other buildings were damaged course, the largest Hainaut earthquakes were only weakly felt and half ruined and more than 80 people were either killed or (intensity II to III) in these areas and the answers to the in- injured (Alexandre et al., 2008). These differences in impacts quiries may provide an unrepresentative view of earthquake between the Hainaut coal area events and seismic sources effects. This under-representation not only occurs in histori- outside the Hainaut area indicate that the contribution of the cal earthquake records but is also present in online “Did You Hainaut coal area seismicity to the impact of earthquake ac- Feel It?” (DYFI) records for some parts of the world where tivity in southern Belgium and northern France during the online data collections are not broadly accessible (Hough and last 300 years (Fig. 1) is overestimated. However, inside the Martin, 2021). coal area, we have to keep in mind that the maximal intensity Hence, the most limiting factor in the information is the was reported in some localities more than one time. resolution of the distance between the IDPs. Before the com- Seismic events in the Hainaut coal area often occurred munity fusion in 1977, the size of the communes ranged be- in seismic sequences that sometimes lasted several weeks. tween 3 and 15 km2 , with a mean equivalent circular radius The repetition of shaking and waking up during the night, ranging between 1.0 and 2.0 km. Since 1977, community size and the increasing damage that sometimes led to the ruin and radius have increased and range respectively from 17 to of some houses aggravated the way this seismicity was ex- 65 km2 and from 2.3 to 4.5 km. The small dimension of the perienced by people. This was particularly true during the communes explain why the steps considered in the intensity Havré seismic sequence of April–May 1949. Moreover, as distance binning is 2.5 or 3 km, which are just at the limit the population associated this seismic activity with the min- of undersampling a range of two intensity values from the ing industry, it was at the origin of many complaints against epicentre for events with a focal depth of 1 km (Fig. 6). The this industry. To date, no study has analysed the impact of intensity averaging process in the communes induced by this these earthquakes on the population living on the Hainaut inquiry also leads to underestimation of peaks of intensity coalfield in comparison with the numerous other nuisances at local places, an unfortunate effect that is even larger for Solid Earth, 13, 469–495, 2022 https://doi.org/10.5194/se-13-469-2022
You can also read