The role of predation in mass mortality of wood lemmings (Myopus schisticolor)
←
→
Page content transcription
If your browser does not render page correctly, please read the page content below
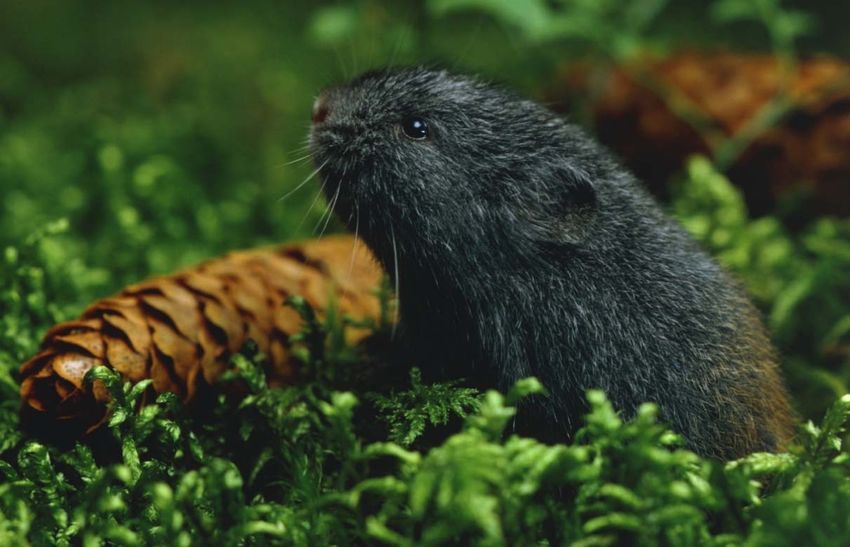
Department of Wildlife, Fish, and
  Environmental Studies

The role of predation in mass mortality of
wood lemmings (Myopus schisticolor)
Predationens roll i massdöd av skogslämlar (Myopus
schisticolor)

Björn Wallgren

Master´s thesis • 30 credits
Management of Fish and Wildlife Populations
Examensarbete/Master's thesis, 2019:7
Umeå 2019
The role of predation in mass mortality of wood lemmings
(Myopus schisticolor)
Predationens roll i massdöd av skogslämlar (Myopus schisticolor)

Björn Wallgren

Supervisor:              Frauke Ecke, Swedish University of Agricultural Sciences, Department of
                         Wildlife, Fish, and Environmental Studies
Assistant supervisor:    Magnus Magnusson, Swedish University of Agricultural Sciences,
                         Department of Wildlife, Fish, and Environmental Studies
Examiner:                Göran Spong, Swedish University of Agricultural Sciences, Department
                         of Wildlife, Fish, and Environmental Studies

Credits:                              30 credits
Level:                                Second cycle, A2E
Course title:                         Master degree thesis in Biology at the department of Wildlife,
                                      Fish, and Environmental Studies
Course code:                          EX0764
Programme/education:                  Management of Fish and Wildlife Populations
Course coordinating department:       Department of Wildlife, Fish, and Environmental Studies

Place of publication:                 Umeå
Year of publication:                  2019
Cover picture:                        Jan-Peter Lahall
Title of series:                      Examensarbete/Master's thesis
Part number:                          2019:7
Online publication:                   https://stud.epsilon.slu.se

Keywords:                             wood lemming, Myopus schisticolor, outbreak, predation,
                                      predator, mass mortality

  Swedish University of Agricultural Sciences
  Faculty of Forest Sciences
  Department of Wildlife, Fish, and Environmental Studies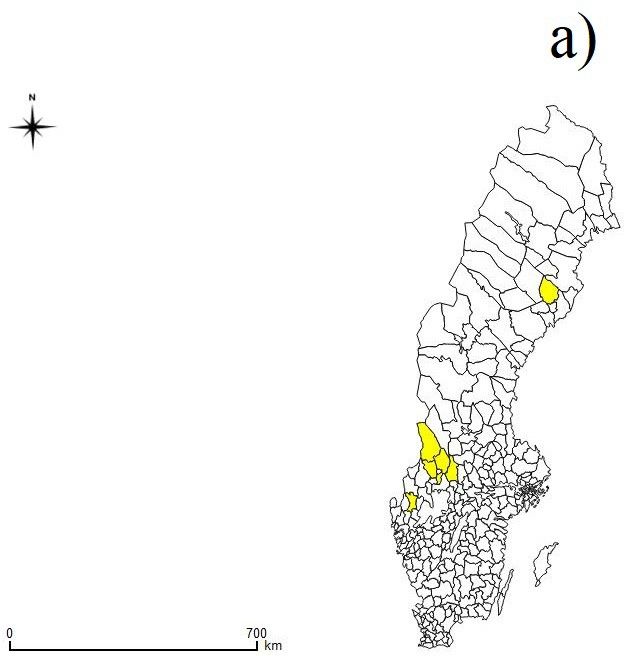
Abstract
The wood lemming (Myopus schisticolor) is known for its skewed
sex-ratio and unpredictable population outbreaks followed by mass
mortality. Both mammalian and avian predators include the wood
lemming in their diet, but the role of predation in the population
dynamics and mass mortality of wood lemmings is unclear. To test
the predation hypothesis, I dissected 158 wood lemmings found-dead
during population outbreaks in 2014 and 2017 in the county of
Värmland, Sweden, and looked for injuries and haemorrhages. For
comparison, I also included 55 wood lemmings that were snap-
trapped in 1995 - 2014 in Sweden. The most common injury in found-
dead specimens was large holes and the most common location of
injuries was the chest and the head. Predators killed 40 % of the wood
lemmings examined and injured 33 % after their death. The male ratio
before and during the outbreaks varied from 10 - 36 %. It must be
stated that it is possible that an unknown number were predated and
completely consumed and therefore not included in this study. Of the
wood lemmings found and killed by predators in 2014 and 2017
combined, 87 % were females and 13 % males. Among the wood
lemmings snap-trapped in 1995 - 2014 there were 73 % females and
27 % males. Further analyses suggest that predators did not select for
larger wood lemmings and that predation varied temporally. Predation
increased from July until September and most predation occurred
from late July until early August, a trend that coincided with the
increase in found-dead wood lemmings.

Since 60 % of wood lemmings did not die from predation, predation
can be refuted as the main cause of mass mortality. Future studies
should therefore focus on testing alternative hypotheses of the mass
mortality of wood lemmings including the disease, stress and food
shortage hypotheses. Even though predation was not the cause of
mass mortality, it affected a high proportion of wood lemmings. A
future study should therefore aim to identify which predators that kill
wood lemmings.

Keywords: wood lemming, Myopus schisticolor, outbreak, predation,
predator, mass mortality
Table of contents

Introduction ....................................................................................................................................................... 7
   Population cycles and mass mortality ........................................................................................................... 7
   The wood lemming........................................................................................................................................ 9
   Aim of project ............................................................................................................................................. 11
Material & Methods ........................................................................................................................................ 12
   Sampling and trapping of wood lemmings.................................................................................................. 12
   Dissections .................................................................................................................................................. 13
   Data selection .............................................................................................................................................. 14
   Statistical analysis ....................................................................................................................................... 15
Results ............................................................................................................................................................. 16
   Predation as cause of mass mortality .......................................................................................................... 16
   Weight of injured and non-injured specimens ............................................................................................ 20
   Sex differences in predation ........................................................................................................................ 22
   Sex-ratio in outbreak and non-outbreak years ............................................................................................. 24
   Temporal differences in predation .............................................................................................................. 25
   Type and position of predator damage ........................................................................................................ 29
Discussion ....................................................................................................................................................... 30
   Predation as cause of mass mortality .......................................................................................................... 30
   Weight of injured and non-injured specimens ............................................................................................ 33
   Temporal differences in predation .............................................................................................................. 34
   Sex differences in predation ........................................................................................................................ 34
   Sex-ratio in outbreak and non-outbreak years ............................................................................................. 35
   Difference in predation over time in days across years ............................................................................... 36
   Type and position of predator damage ........................................................................................................ 36
Conclusions ..................................................................................................................................................... 38
Acknowledgements ......................................................................................................................................... 38
References ....................................................................................................................................................... 39

                                                                                         6
Introduction
Population cycles and mass mortality
Some populations of small rodents undergo large fluctuations in density
throughout time (Krebs & Myers, 1974). According to the same authors
there can be plenty of animals during some years while in other years the
rodents can be almost absent from the same area. For some populations,
these peak and low phases in density occur with a regular interval, also
known as a cycle, but in other populations the cycles might be completely
absent (Krebs & Myers, 1974). Hanski et al. (1991) reported that the cycles
increase from around three years in length in the south-central parts of
Fennoscandia up to four years in the northern parts.
The drivers behind these cycles are not fully understood but several
hypotheses have been developed to explain the enigma of population
cycles. Krebs & Myers (1974) list several factors that could potentially
influence the existence of these cycles including food, predation, weather,
stress, behaviour and genetics. Further, Elton (1931) mentioned diseases as
a factor regulating the numbers of wild animals. These factors can be
categorized as extrinsic (food, predation and weather) and intrinsic (stress,
behaviour and genetics) (Hansson & Henttonen, 1985). Microparasites such
as viruses and bacteria can be seen as extrinsic factors (Hansson &
Henttonen, 1988). If it’s the extrinsic, intrinsic or a combination of these
factors that drive vole cycles is still being discussed. Turchin & Hanski
(2001) suggest that predation, food and maternal effects are more likely to
explain these cycles with predation being the most likely out of the three.
According to Fey et al. (2015) events causing mass mortality are made up
of demographic catastrophes able to affect all life stages at the same time
and can quickly remove a large part of a population which occurs over a
7short time period compared to the generation time of the organism. One
example of a mass mortality event (MME) occurred in Kazakhstan in 2015
where over 200,000 saiga antelopes (Saiga tatarica tatarica) died during a
time period of three weeks (Kock et al., 2018). According to the same
authors the cause of death was haemorrhagic septicemia caused by the
bacteria Pasteurella multocida type B. It was also found that there was
unusually high relative humidity and temperature in the days before the
MME and that this unusual humidity and temperature could have
contributed to the MME (Kock et al., 2018). Based on this information the
drivers of this MME seem to be a combination of two extrinsic factors,
weather and disease (Kock et al., 2018). Another example of an MME
occurred on Kinkazan Island in northern Japan in 1984 where carcasses of
293 sika deer (Cervus nippon) were found from late March until mid April,
comprising 43 % of the population (Takatsuki et al., 1994). According to
the same authors the drivers of this MME seem to be a combination of two
extrinsic factors, weather and food. The winter preceding this mass
mortality was unusually cold with deep snow which made the deer lose
their fat reserves when moving through it. Then they gathered in high
density at lower altitude with less deep snow, consumed the most nutritious
food, were upon depletion forced to forage on less nutritional items, and
therefore suffered from malnutrition before dying (Takatsuki et al., 1994).
A third and final example of an MME affected Swainson's hawks (Buteo
swainsoni) in Argentina between 1995 and 1996 (Goldstein et al., 1999).
According to the same authors farmers used an insecticide called
monocrotophos to protect their crops and the hawks were affected when
feeding on grasshoppers and caterpillars in these fields. Monocrotophos
was responsible for the death of over 4,000 hawks (Goldstein et al., 1999).
As demonstrated by these three examples, mass mortality events seem
mostly caused by extrinsic factors, usually a combination of several factors
such as weather and food or weather and disease.
The predation hypothesis assumes predators cause population cycles
(Krebs, 1996). Further, the mere risk of predation can affect the behaviour
of the prey by altering for example sociality, mating and foraging (Lima,
1998). These behavioural changes can be seen as a defensive trait, also
known as a “trait-mediated interaction”, which can be adopted in the
presence of a predator (Preisser et al., 2005). Predators can be divided into
two groups. There are generalist predators which change their preferred
prey species depending on what they can find and there are specialist
predators which are relying more on a specific group of animals or even a
8specific species (Hansson, 1987). Besides the preferred kind of prey,
predators can further be divided by their mobility in search of prey;
nomadic and resident predators where nomadic predators can leave areas in
search for prey and resident predators stay in a certain area (Andersson &
Erlinge, 1977). Based on these groups, predators can be divided into
resident specialists, resident generalists and nomadic specialists (Andersson
& Erlinge, 1977). Predators specific for small rodents in the boreal zone
were summarized into these categories by Hanski et al. (2001). According
to the same authors the least weasel (Mustela nivalis) and the stout
(Mustela erminea) are resident specialists. Furthermore, representatives of
resident generalists include red fox (Vulpes vulpes), badger (Meles meles),
domestic cat (Felis catus), polecat (Mustela putorius), pine marten (Martes
martes), common buzzard (Buteo buteo) and tawny owl (Strix aluco).
Finally, nomadic specialists include short-eared owls (Asio flammeus),
long-eared owls (Asio otus), hawk owls (Surnia ulula), Tengmalm’s owls
(Aegolius funereus), kestrels (Falco tinnunculus), rough-legged hawks
(Buteo lagopus) and long- tailed skuas (Stercorarius longicaudus) (Hanski
et al., 2001). Hanski et al. (1991) report that the number of generalist
predators and avian predators are higher in the southern parts of
Fennoscandia than in the northern parts. Besides predators there is a
possibility that small insectivores, like the common shrew (Sorex araneus),
would seize the opportunity and predate on the young of wood lemmings if
found unattended and there is a lack of other food items. For example
common shrews may be predators of the pups of bank voles (Myodes
glareolus) and during periods of low food availability they can be
aggressive towards the pups (Lisenjohann et al., 2011).
The wood lemming
The wood lemming (Myopus schisticolor) belongs to the order Rodentia
(Fedorov et al., 1995) and the family Cricetidae (Henttonen, 2016). The
geographical range of the wood lemming stretches from Norway in the west
all the way to Kamchatka in the east and includes the majority of the
coniferous forest zone of Eurasia (Fedorov et al., 1995). Wood lemmings
prefer spruce forests with a thick layer of mosses (Eskelinen, 2002). One
reason for the preferred choice of habitat of the wood lemming is likely its
specific diet. Unlike other small rodents, the wood lemming feeds primarily
on mosses (Eskelinen, 2002). According to the same author, wood
lemmings prefer the mosses Dicranum spp. and Polytrichum spp.
Furthermore, a small degree of grass can occasionally be included in the
9diet and also stems and leaves from for example European bilberry
(Vaccinium myrtillus) (Eskelinen, 2002).
Wood lemmings have been reported to migrate (Eskelinen, 1997). These
migrations occur when there are plenty of lemmings and they can then be
found in areas that do not include their preferred habitat (Eskelinen, 1997).
According to the same author, migrations in Finland in 1989 started in early
August and stopped in late September or early October. The wood lemming
undergoes cyclic changes in density in some areas. In eastern Finland
Eskelinen et al. (2004) found that the cycle has a time interval of three
years. The cycle of the field vole (Microtus agrestis) was synchronized
with the cycle of the wood lemmings in eastern Finland (Eskelinen et al.,
2004). Despite these findings in eastern Finland, no cycle was found among
wood lemmings in western Finland (Eskelinen et al., 2004).
The wood lemming has an average gestation period of 25 days (Ilmén &
Lahti, 1968). Females have been observed to reach sexual maturity as early
as 22 days of age, but males reach it later, earliest after 44 days (Ilmén &
Lahti, 1968). The average litter size in captivity is three offspring
(Cheprakov, 2000) but there is evidence that some females have up to seven
young (Ilmén & Lahti, 1968). Wood lemmings can reach up to 49.7 g,
which was recorded for a male individual raised in captivity by Ilmén &
Lahti (1968). Andreassen & Bondrup-Nielsen (1991) used radio telemetry
to measure the home range size of wood lemmings in Norway. They found
that males have a significantly larger home range size than females. The
mean home range size for males was 2,144 m2, with the largest home range
being 4,247 m2, and for females it was 285 m2, with the largest home range
being 635 m2 (Andreassen & Bondrup-Nielsen, 1991). Further, the same
authors also found that males are more active than females. The mean
distance moved during a day for a male wood lemming was 217 m and the
same distance for a female wood lemming was 21 m (Andreassen &
Bondrup-Nielsen, 1991). Mironov et al. (2003) studied the budget of daily
activity in four captive wood lemmings in Russia. The results showed that
wood lemmings spend the majority of the day (42.5 %) sleeping, followed
by spending time in shelters (18.9 %), running in running wheels (18.2 %),
other activity (13.0 %) and feeding (7.3 %).
Wood lemmings constantly posses a skewed sex-ratio where there are more
females than males (Fredga et al., 1977). For example, Eskelinen (2004)
found that in one Finnish population the proportion of males varied
10between 15 - 29 %. This skewed sex-ratio can be linked to a genetic
mutation on the female chromosomes. According to Fredga et al. (1977)
there are three types of female sex chromosomes: XX, X*Y and X*X
where X* carries the mutation. Females with XX have an offspring ratio of
1:1. Females with X*X have an offspring ratio of 3:1 where daughters are
in majority and XY females produce no sons (Fredga et al., 1977).
There is a variety of predators that include wood lemmings in their diet.
Pulliainen & Ollinmäki (1996) studied the winter food niche of the pine
marten (Martes martes) in northern Finland. Between the winter of 1986/87
and 1991/92 the remnants of wood lemmings were found in 10 % of the
scats although the numbers varied among years depending on the
availability of animals (Pulliainen & Ollimäki, 1996). Obuch & Bangjord
(2016) studied the diet of the Eurasian eagle owl (Bubo bubo) in Central
Norway. The same authors analyzed the scats of the Eurasian eagle owl and
found remnants of 25 wood lemmings in the mountainous area of Central
Norway during a period of eight years. Støvern (2012) studied the diet of
the Eurasian kestrel (Falco tinnunculus) in south eastern Norway. The same
author used video monitoring at the nests of six breeding pairs to see what
prey species were delivered to the nests. Støvern (2012) found 32 wood
lemmings delivered to the nests in the breeding season of 2011, which
made them the second most common species delivered, outnumbered only
by field voles. Nybo & Sonerud (1990) found remnants of wood lemmings
in the scats of hawk owls (Surnia ulula) in south eastern Norway.
Aim of project
Based on the information that predators do include wood lemmings in their
diet my project focused on the predation-hypothesis, i.e. that predation
causes mass mortality of wood lemmings. The first and main aim was to
investigate to which extent wood lemmings during outbreak years are
attacked by predators and if predation varies among sexes of wood
lemmings. Specifically, I tested if predators are the main cause of death or
if they take wood lemmings after their death.
Secondly, I tested if there is a difference in weight between injured and
non-injured wood lemmings for both sexes combined and each sex
separately. Thirdly, I studied temporal differences in predation with focus
on differences among months as well as differences among days. Fourth, I
compared the sex-ratio between outbreak and non-outbreak years as well as
11the sex-ratio for snap-trapped specimens. Fifth, since the sex ratio of wood
lemmings in outbreak years is biased towards females, I also tested if the
sex-ratio of predator-killed wood lemmings followed the same trend. Due
to the larger home range of males compared to females, males could be
more vulnerable to predation if moving more in open terrain within this
home area, which would result in a comparatively high proportion of
predator-killed males. Finally, I tried to identify the predators involved, by
studying the position of damage on the body and the shape of damage.
Material & Methods
Sampling and trapping of wood lemmings
A total of 213 wood lemmings (Myopus schisticolor) were included in my
study. Of these 30 were snap-trapped in the Vindeln area, county of
Västerbotten, during 1995 - 2014. The remaining 183 specimens were
found on a number of locations in the county of Värmland in 2014 and
2017. Of these, 158 were found-dead and 25 were snap-trapped. Specimens
were found in July, August and September in 2014 and only in September
in 2017. In 2014, 59 of the specimens were found in Gustavsfors, on the
border between county of Värmland and county of Västra Götaland. The
remaining specimens in 2014 were all found in the county of Värmland but
in different areas. Most were found in the municipality of Torsby followed
by the municipality of Filipstad and Hagfors. In 2017, 75 of the specimens
were found near Lennartsfors, county of Värmland, close to the Norwegian
border. The remaining eight specimens in 2017 were found in Glaskogens
nature reserve, county of Värmland.
The specimens from the Vindeln area were included in the project to
investigate if the sex-ratio differed in specimens during outbreak and non-
outbreak years. Based on the areas where specimens were found a map was
made using QGIS to visualize the sites on a national scale (Fig. 1a). Since
the position of the found specimens were recorded with the x and y co-
ordinates, these specific sites could be visualized on a more locally
produced map in this case including the county of Värmland (Fig. 1b).
12Fig. 1. Geographic location of the sampling sites a) in municipalities included in the
study (yellow polygons) and b) in the county of Värmland where wood lemmings were
found-dead during population outbreaks in 2014 and 2017 (black dots).
Dissections
After sampling, all wood lemmings in this study were stored in -20 °C
freezers. Before dissection, the specimens were taken out of the freezer to
thaw in room temperature for about one hour depending on the size of the
specimens. Once defrosted the limbs of the animals were stretched
perpendicular to the body axis and the feet were fixed with needles on a
linoleum to simplify the work. The linoleum was put in a fume hood for the
entire process to avoid possible pathogen transmission. Lab coats and
rubber gloves were used during the process for safety reasons.
When in place, another student started to open the stomach using tweezers,
scalpel and scissors. After opening the specimen, all organs were taken out
including the heart, lungs, kidney, adrenal gland and spleen. The intestines
were also removed. When this was done, I started to look for signs of
predation. Within a different initial project, the specimens from 2014 had
their heads separated from the bodies. For the other specimens, the heads
were removed with scissors to simplify the process. When looking at the
body, the chest was usually removed from the back part by breaking of the
spine with tweezers. Then the two body parts were dragged out and
removed from the skin to make it easier to detect any possible injuries. The
skin, body and head were thoroughly searched for signs of injury. Any
deviations from the normal state, such as bleedings, marks, scars, cracks
and holes were photographed and added to the dissection protocol. The
protocol included the ID for each specimen, the date for the dissection,
weight, sex, a code for the position of the injuries on the body (head, upper
or lower chest and back), a sketch depicting the exact position of the injury
13if present, the side of the body on which the injury was found and the shape
of the injury. Further, it was recorded if there were any haemorrhages
found, photograph ID and comments on the injuries. I also recorded if a
specimen was found dead or trapped, year, month and date when found,
name of locality, coordinates, comments on the place found and name of
the person who found the specimen. After completion, all body parts
belonging to the specimen were again stored in the freezer. For disinfection,
the tools used were put in a VirkonTM solution overnight, then burned off
with a candle and washed with soap and water before being used for
another specimen.
Data selection
To test the hypotheses that wood lemmings are attacked and/or killed by
predators during outbreak years, I excluded all specimens that had been
snap-trapped in the Värmland dataset. For found-dead specimens, I applied
three categories depending on if the lemmings had no injuries “N”, if they
had injuries and haemorrhages and therefore were taken by predators “P” or
if they had injuries but no haemorrhages which implied that they were
injured by predators after their death “NP”.
To test the hypothesis regarding difference in weight between injured and
non-injured specimens I excluded all the specimens with unknown sex as
well as specimens that had been snap-trapped. Finally, specimens that were
missing their head or any other significant body part were excluded because
this would negatively affect the weight. Following these exclusions, the
dataset consisted of 131 specimens from Värmland, including both sexes.
The category “P” includes specimens killed by predators and the category
"N" includes specimens that died from other reasons than predation.
Regarding the hypothesis of temporal differences in predation I excluded
all specimens with unknown sex and specimens that had been snap-trapped
in the Värmland dataset. This resulted in a dataset containing 148
specimens. To easier detect differences in the proportion of animals
suffering from predation, each month was investigated separately in the two
outbreak years.
To test the hypothesis regarding sex differences in predation rate I excluded
all specimens with unknown sex as well as all snap-trapped specimens. The
rate of predation was determined for September 2017 including a) both
14sexes, b) females only, c) males only, September 2014 including d) both
sexes, e) females only, f) males only, August 2014 including g) both sexes,
h) females only, i) males only and finally July 2014 including j) both sexes,
k) females only and l) males only.
To test the hypothesis that the sex-ratio differs between outbreak and non-
outbreak years, I excluded all specimens with unknown sex. The sex-ratio
was determined a) across all years combined, b) 2014 only, c) 2017 only, d)
for specimens that died from others reasons than predation 2014 and 2017
combined, e) 2014 only, f) 2017 only), g) that died from predation in 2014
and 2017 combined, h) 2014 only, i) 2017 only, j) that had been snap-
trapped in 1995- 2014, k) 2014 only and l) 1995 - 2007 in the Vindeln area.
To investigate the hypothesis regarding difference in predation over time in
days across years, I excluded all snap-trapped specimens in the Värmland
dataset. This resulted in a dataset of 82 specimens in 2017 and 76
specimens in 2014.
To test the hypothesis regarding the proportion of damage per shape and
per position, I excluded all specimens that had not been killed by predators
or that had been taken by predators after their death. This resulted in a
dataset of 63 specimens for 2014 and 2017 combined. The shapes were
divided into point-shaped holes, larger holes, cracks, crushed parts, broken
parts or missing parts as well as blood stains. The positions were divided
into: head, upper chest, lower chest, upper back and lower back.
Statistical analysis
To test if wood lemmings were killed by predators or if lemmings were
taken after their death a non-parametric Pearson's chi-square test for count
data was used. The same test was also used to test if the predation differed
between months for both years combined and for both sexes combined. A
chi-square test was used to test if wood lemmings were killed by predation
or died for other reasons for each month during both years. Further, the
same test was used to look at the proportion of damage per shape and the
proportion of damage per position on the wood lemming. A Mann-Whitney
U test was used to test if wood lemmings killed and not killed by predators
differed in weight for both sexes combined and each sex separately,
respectively.
15All data from the dissection protocol was stored in a file in Microsoft Excel. The analyses were done using the statistical software R and R-studio (R Core Team, 2018). Graphs produced in R were partly modified using Adobe Acrobat Pro DC (Adobe Acrobat Pro DC, 2018). Results Predation as cause of mass mortality For 2014 and 2017 combined 63 (40 %) wood lemmings were killed by predators, 52 (33 %) animals were injured by predators after their death and 43 (27 %) had no injuries (Fig. 2a). For each of the separate years, predators killed 40 % (30 in 2014 and 23 in 2017) of the wood lemmings. In 2014, the number of animals injured by predators after their death was 23 (30 %; Fig. 2b) and the number of animals without injuries was also 23 (30 %; Fig. 2b). In 2017 a total of 29 (36 %) animals were injured by predators after their death and 20 (24 %) had no injuries (Fig. 2c). Significantly more wood lemmings were killed by other causes than by predators for the years combined (χ2 = 6.48, p
Fig. 2. Number of Myopus schisticolor specimens (%) without injury (N), injured by
predators after their death (NP) or killed by predators (P) in a) 2014 and 2017 combined (n
= 158), b) 2014 (n = 76) and c) 2017 (n = 82).

Specimens from 2014 were found in July, August and September. In
September, a total of three specimens were found of which one died from

                                            17
predation and two of other causes. There was no significant difference
between wood lemmings killed by predators and those that died from other
causes than predation (χ2 = 0.33, p >0.05) (Fig. 3a). In August, a total of 47
specimens were found, 18 (38 %) died from predation and 29 (62 %) from
other causes. There was no significant difference between wood lemmings
killed by predators and those that died from other causes than predation (χ2
= 2.57, p >0.05) (Fig. 3b). In July, a total of 18 specimens were found, 10
(56 %) died from predation and eight (44 %) from other causes. In this
month, there was no significant difference between wood lemmings killed
by predators and those that died by other causes than predation (χ2 = 0.22, p
>0.05) (Fig. 3c).
All 80 specimens from 2017 were found in September. Of these, 33 (41 %)
died from predation and 47 (59 %) of other causes. In September, there was
no significant difference between wood lemmings killed by predators and
those that died from other causes than predation (χ2 = 2.45, p >0.05) (Fig.
3d).
18Fig. 3. Number of Myopus schisticolor specimens (%) killed by predation (P) or that died
from other causes than predation (N) including both sexes in a) September 2014 (n = 3), b)
August 2014 (n = 47), c) July 2014 (n = 18) and d) September 2017 (n = 80).
19Weight of injured and non-injured specimens
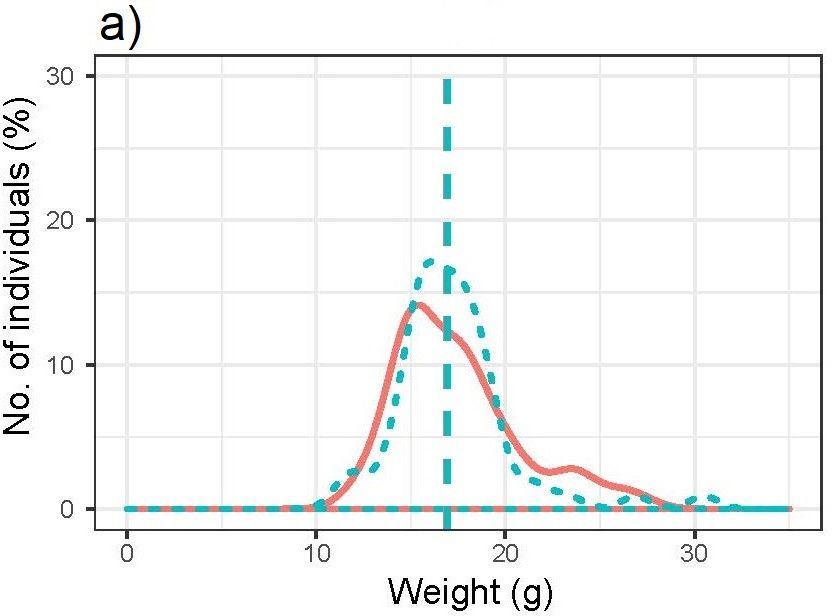
Wood lemmings killed and not killed, respectively, by predators did not
differ in weight (median weight, killed = 16.95g, median weight, not killed
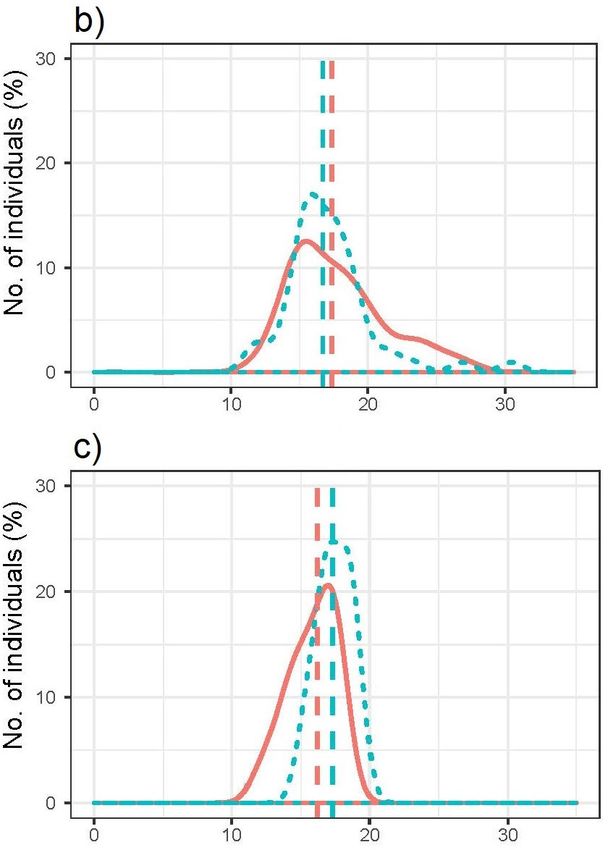
= 16.90g, U = 2117, p >0.05) when combining both sexes (Fig. 4a). Female
wood lemmings killed and not killed, respectively, by predators did not
differ in weight (median weight, killed = 16.70g, median weight, not killed
= 17.35g, U = 1647, p >0.05; Fig. 4b). Male wood lemmings killed and not
killed, respectively, by predators did not differ in weight either (median
weight, killed = 17.3g, median weight, not killed = 16.2g, U = 22.5, p
>0.05; Fig. 4c).
20Fig. 4. Weight distribution of Myopus schisticolor specimens found-dead in Värmland in
2014 and 2017 and killed by predators (red solid line) and not killed by predators (blue
dashed line), respectively, for a) both sexes (n = 131), b) females (n = 111) and c) males (n
= 20). The dashed vertical lines of each colour represent the median weight of each
category.
21Sex differences in predation
In September 2017, there were 69 females of which 28 (41 %) died from
predation and 41 (59 %) of other causes (Fig. 5a). In the same period there
were 11 males of which five (45 %) died from predation and six (55 %) of
other causes (Fig. 5b). In September 2014, there were two females of which
one died from predation and one of other causes (Fig. 5c). In the same
period, there was one male and that one died from other causes than
predation (Fig. 5d).
In August 2014, there were 38 females of which 16 (42 %) died from
predation and 22 (58 %) from other causes (Fig. 5e). In the same period
there were nine males of which two (22 %) died from predation and seven
(78 %) from other causes (Fig. 5f). In July 2014, there were 16 females of
which nine (56 %) died from predation and seven (44 %) from other causes
(Fig. 5g). In the same period there were two males of which one died from
predation and one from other causes (Fig. 5h).
22Fig. 5. Number of Myopus schisticolor specimens (%) found-dead and killed by predation
(P) or that died from other causes than predation (N). September 2017 includes a) females,
only (n = 69) and b) males, only (n = 11). September 2014 includes c) females, only (n =
2) and d) males, only (n = 1). August 2014 includes e) females, only (n = 38) and f) males,
only (n = 9). July 2014 includes g) females, only (n = 16) and h) males, only (n = 2).
23Sex-ratio in outbreak and non-outbreak years
In total, there were 174 specimens found-dead and snap-trapped in 2014
and 2017 combined of which 143 (82 %) were females and 31 (18 %)
males (Fig. 6a). In 2014, there were 94 specimens of which 74 (79 %) were
females and 20 (21 %) males (Fig. 6b). In 2017, there were 80 specimens of
which 69 (86 %) were females and 11 (14 %) males (Fig. 6c).
Of the 113 specimens that died from other causes than predation in 2014
and 2017, 90 (80 %) were females and 23 (20 %) males (Fig. 6d). In 2014,
of the 66 specimens that died from other causes than predation, 49 (74 %)
were females and 17 (26 %) males (Fig. 6e). Of the 47 specimens found-
dead in 2017 and that died from other causes than predation, 41 (87 %)
were females and six (13 %) males (Fig. 6f).
Of the 62 specimens that died from predation in 2014 and 2017 combined,
54 (87 %) were females and eight (13 %) males (Fig. 6g). In 2014, there
were 29 specimens that died from predation and of these 26 (90 %) were
females and three (10 %) males (Fig. 6h). In 2017, there were 33 specimens
that died from predation and of these 28 (85 %) were females and five (15
%) males (Fig. 6i).
Of the 55 specimens that were snap-trapped in 1995 – 2014 in Värmland
and Vindeln combined, 40 (73 %) were females and 15 (27 %) males (Fig.
6j). In 2014, there were 25 animals that had been snap-trapped in Värmland
and Vindeln combined and of these 16 (64 %) were females and nine (36
%) males (Fig. 6k). In 1995 – 2007 there were 30 animals that had been
snap-trapped in Vindeln with 24 (80 %) being females and six (20 %) males
(Fig. 6l). There was no significant difference between the sex-ratio of
specimens snap-trapped in the outbreak year of 2014 and those snap-
trapped during the non-outbreak years of 1995 - 2007 (χ2 = 1.04, p >0.05).
24Fig. 6. Number of Myopus schisticolor specimens (%) divided by females (F) and males
(M) in a) 2014 and 2017 combined (n = 174), b) 2014 (n = 94), c) 2017 (n = 80), that died
from other reasons than predation in d) 2014 and 2017 combined (n = 113), e) 2014 (n =
66), f) 2017 (n = 47), that died from predation in g) 2014 and 2017 combined (n = 62), h)
2014 (n = 29), i) 2017 (n = 33), that had been snap-trapped in j) 1995 – 2014 (n = 55), k)
2014 (n = 25) and l) 1995 – 2007 (n = 30).
Temporal differences in predation
In 2014 and 2017 combined and including both sexes, July generated the
lowest number of predator-killed wood lemmings (10; 7 %), September the
highest (34; 23 %) with August in between (18; 12 %). I observed the same
trend for animals that died from other causes than predation, with July
25including eight (5 %), August 29 (20 %) and September 49 animals (33 %).
The number of predator-killed specimens and specimens that died due to
other reasons than predation did not differ among months (χ2 = 1.66, p
>0.05; Fig. 7a).
At the sex level, there were in total 125 females found-dead. July generated
the lowest number of predator-killed female wood lemmings (9; 7 %),
September the highest (29; 23 %) with August in between (16; 12 %). The
same trend was true for animals that died from other causes than predation,
with July including seven (6 %), August 22 (18 %) and September 42
animals (34 %) (Fig. 7b). In the same period there were 23 males. July
generated the lowest number of predator-killed male wood lemmings (1;
4%), September the highest (5; 23 %) with August in between (2; 9 %). The
same trend was true for animals that died from other causes than predation,
with July including one (4 %), August seven (30 %) and September seven
animals (30 %) (Fig. 7c).
26Fig. 7. Number of Myopus schisticolor specimens (%) found-dead and killed by predators
(P) and those that died from other causes (N) in July (7), August (8) and September (9)
including a) both sexes (n = 148), b) females (n = 125) and c) males (n = 23).
In 2017 all specimens were found in September and predation peaked in the
second half of the month. There were 82 specimens found during this time
27(Fig. 8a). In 2014, specimens were found in July, August and September
and there was a peak in predation in early August. There were 76
specimens found during this time (Fig. 8b).
Fig. 8. Number of Myopus schisticolor specimens (%) found-dead without injury (white
bar), killed by predators (black bar) and injured by predators after their death (grey bar),
respectively, across days in a) September 2017 (n = 82) and b) 2014 (n = 76). In 2014,
days 1 – 31 are in July, days 32 – 62 in August and days 63 – 92 in September.
28Type and position of predator damage Of the found-dead specimens, there were 22 (35 %) with holes, 18 (29 %) with a stain, 17 (27 %) with a broken body part, 10 (16 %) with a crushed head, nine (14 %) with a crack in the head, seven (11 %) with a missing body part and five (8 %) with point shaped holes (Fig. 9). The total number of specimens included here (n = 63) is exceeded by the total number of injuries (88) because the specimens could have several different kinds of injuries. There was a significant difference in the number of observed shapes of injuries caused by predators (χ2 = 19.55, p
between the different positions of the injuries caused by predators (χ2 =
62.02, p
several factors. One explanation could be that there are no dietary studies of
other predators carried out in areas that occupy wood lemmings or these
studies took place in years with very low densities of wood lemmings.
Predators do eat wood lemmings but consume them instantly or hide them
where we cannot find them. Finally, predators do not include wood
lemmings in their diet and prefer other prey species. This last assumption
seems to be true for most owl species. According to Eskelinen et al. (2004),
wood lemmings are an alternative prey species for all owls residing in areas
where wood lemmings can be found. However, I still found evidence that
owls do include wood lemmings in their diet (Nybo & Sonerud, 1990;
Obuch & Bangjord, 2016). Perhaps this is more a question of availability, it
there are plenty of wood lemmings easily accessible owls will predate on
them even if it's not their preferred prey species. Nybo & Sonerud (1990)
found that roughly 5 % of all prey items consumed by hawk owls in June
were wood lemmings and Obuch & Bangjord (2016) found 25 (0.06 %)
wood lemmings in the diet of the Eurasian eagle owl. In the same studies
the percentage of field voles was 80 % (Nybo & Sonerud, 1990) and 41 %
(Obuch & Bangjord, 2016), respectively, which suggests that field voles
seem to be preferred over wood lemmings for these two predators. Had
there been a lower amount of field voles available perhaps the predators
would have switched and focused more on alternative species such as wood
lemmings instead. This is not always possible since wood lemmings are
very rare, except in outbreak years. This becomes obvious when looking at
the number of wood lemmings collected in the Vindeln area during 1979 -
2017 within the National Monitoring Programme of small rodents. In this
period there were a total of 394 wood lemmings collected compared to over
14,000 bank voles (Ecke & Hörnfeldt, 2018). Although wood lemmings are
not a dominating part of the diet of hawk owls and Eurasian eagle owls,
their predation can have large effects on the population of wood lemmings,
especially if its male specimens being killed considering the already
skewed sex-ratio.

The fact that 40 % of the wood lemmings in this study were killed by
predators could be explained by the amount of predators in the study area
and which species of predators residing in the study area. Weasels for
example are specialist predators preying mainly upon rodents (Erlinge,
1975). When there are many rodents in an area there are also many weasels
(Erlinge, 1974). This means that during the outbreak years of 2014 and
2017 when there were many wood lemmings, there could also have been
many weasels in the area which could have caused the higher percentage of
predation. Other predators are classified as generalists and therefore not
dependent on rodent prey alone to reproduce. Some of these include foxes
and martens. These can also prey upon rodents when easily found

                                     31
(Andersson & Erlinge, 1977). Since martens are known to include wood
lemmings in their diet (Pulliainen & Ollinmäki, 1996) this could also have
contributed to the predation percentage in my thesis. There are also
nomadic species which leave their area if there is not enough food
resources (Andersson & Erlinge, 1977). If such nomads were to settle in an
area with more food abundance this could increase the predation on the
prey species residing in that area. This could mean that if more nomads
entered the study area in 2014 and 2017 when wood lemmings were
plentiful, this could also have caused increased predation. To be able to
know the density of predators in an area a proper census needs to be
conducted. This was not done within this thesis. It would be meaningful to
study predators and their numerical responses to wood lemming outbreaks.
The second aim of this thesis was to investigate if predators are the cause of
death or if they take wood lemmings after their death. As seen before, 63
(40 %) specimens could be classified as killed by predators and 52 (33 %)
were injured by predators after their death. So there seems to be a trend
towards that predators do actually kill wood lemmings rather than taking
them after their death. It is likely that the actual number of wood lemmings
killed by predators is much higher since some predators probably consume
their prey instantly or move them somewhere else where we cannot find
them.
The third aim of my thesis was to investigate if predation is that common
that it might be the main cause of death. In this case predators killed 40 %
of the wood lemmings and 60 % (33 % injured after death and 27 %
without injuries) have died from other reasons. This implies that predation
is not the main cause of death in this case. The National Veterinary Institute
in Sweden (SVA) performed a necropsy on 25 found-dead wood lemmings
in July and August 2014 to find out the cause of death (Bröjer et al., 2014).
They did not find any sign of disease and the cause of death was trauma
caused by bite wounds from predators (Bröjer et al., 2014).
Other possible causes of death could be disease, stress or starvation. Skarén
(1981) kept 19 wood lemmings in an enclosure of which 17 died from
Listeria monocytogenes. Another disease that could have a lethal effect on
small rodents is the Borna disease virus (BDV) where infection can be fatal
for animals due to a chronic progressive meningoencephalomyelitis
(Kinnunen et al., 2007). The same authors detected antibodies in one tundra
vole or root vole (Microtus oeconomus) and two bank voles in Finland. If
antibodies are detected in small rodents in Finland it is possible that the
virus is present in Sweden as well and could have a lethal effect on wood
lemmings.
32Due to the very specific diet of the wood lemmings, there might be a
shortage of food when densities are high. Under such conditions they might
suffer from malnutrition, impairing their condition and therefore increasing
susceptibility for both disease and predation. When there is a shortage of
food there might be more intra-specific competition for the remaining food
resources, possibly leading to aggressive interactions and injuries that could
get infected or make them easier targets for predators. Wood lemmings
might also migrate in search of food as reported by Eskelinen (1997). When
doing so they might end up in habitats without their preferred food leading
to starvation. They might also cross roads and get hit by cars and trains.
Further, when migrating they can fall from bridges and into canals and die
(Eskelinen, 1997). Another reason for these migrations, a part from lack of
food, might be lack of space (Eskelinen, 1997). Home areas of wood
lemmings are small with an average male home area being 2,144 m2 and
the females being 285 m2 (Andreassen & Bondrup-Nielsen, 1991) but in
high densities large areas are required to satisfy all the specimens. Further,
migrating wood lemmings could be at greater risk of predation. There
might not be as many hiding spots in the new areas and moving in open
habitats could increase the risk of avian predation. Metzgar (1967) tested
the predation from screech owls (Otus asio) on white-footed mice
(Peromyscus leucopus). One group of the mice were accustomed to the
environment and the other were new. The owls caught 13 mice in total and
11 of these were from the group of mice not accustomed to the area
(Metzgar, 1967). The results could possibly be the same for wood
lemmings, that they suffer a higher risk of predation when migrating into
new habitats. Stress can also be a source of starvation. The presence of a
predator is stressful for prey species like wood lemmings. Ylönen et al.
(2006) showed that the odour of weasels affected the foraging behaviour of
bank voles where foraging was significantly lower for bank voles subjected
to the odour. If there is plenty of predators in an area, wood lemmings
might be too scared to forage and therefore starve.
Weight of injured and non-injured specimens
The average weight of the specimens included in this study was under 17 g
which can be seen as low considering that adults may reach a weight of
almost 50 g (Ilmén & Lahti, 1968). This low weight could be an indication
that there were mostly juveniles found dead. If there were mostly juveniles
killed in the study this can be linked to the kind of predators residing in the
study area. If juveniles spend most time in nests and burrows they should
not be attacked by avian predators. Other predators like the weasel can
enter nests and therefore take juveniles there (Andersson & Erlinge, 1977).
Foxes can dig up burrows and therefore gain access to the juveniles
33residing in there (Andersson & Erlinge, 1977). If there were a lot of weasels
and foxes in the study area this could be one explanation why there were
many juvenile and likely dispersing wood lemmings found dead. Since
foxes are larger than weasels they also need to consume more prey
(Andersson & Erlinge, 1977). If they learn that juvenile wood lemmings are
an easily accessible food source they might focus on this when plentiful as
in an outbreak year.
Another explanation for the low weight of the specimens can be due to the
density of wood lemmings. More wood lemmings implies less food and
more competition implies that some might starve and therefore not grow
normally therefore having a lower weight than normal for their age. It is
also a possibility that the specimens were infected with a disease making
them weaker and therefore not foraging in a normal way and making them
an easier target for predators. Juvenile specimens might also be an easier
target for predators due to lack of experience. Adults might be more
vigilant when moving in open areas while juveniles might not realize the
danger.
Temporal differences in predation
The total amount of wood lemmings killed by predators increased from July
to September. The higher number of predator-killed wood lemmings in
September could be explained by several factors. The amount of wood
lemmings found-dead increased from July to September. If there are more
prey available generalist predators may use this food source more. There is
also a possibility that more nomadic predators entered the area during this
time due to the increasing amount of available prey (Andersson & Erlinge,
1977). The number of weasels is related to the number of rodents (Erlinge,
1974). Hence, as the amount of wood lemmings increased so could the
amount of weasels and therefore also predation.
However, the amount of wood lemmings that died from other causes than
predation also increased from July to September. This could be due to
increased competition over limited food resources followed by malnutrition
and starvation. There is also the possibility of an outbreak of a disease
killing specimens.
Sex differences in predation
In 2017 a higher percentage of males died from predation than females.
One reason for this slightly higher male predation could be due to the
males' mobility. According to Andreassen & Bondrup-Nielsen (1991) male
34wood lemmings move on average 217 m during a day compared to females
21 m. Because of their higher mobility, they are more likely to suffer more
from avian predation (Andersson & Erlinge, 1977). In September 2014, the
results were the opposite with more females being killed than males,
however based on low sample size (two females and one male). Low
sample size in September 2014 could have been caused by predation in
earlier months reducing the density of wood lemmings and because of the
lower density, generalist predators might have switched to other more
common prey and nomadic predators might have left the area in search of
other food sources.
In August 2014 more females died from predation than males. There were
more wood lemmings found-dead in August 2014 compared to September
2014 and because of the skewed sex-ratio there were also more females
available for predators than males thus explaining the results. Predation in
2014 peaked in August, therefore reducing the total number of specimens
left for predators in September when there were not many wood lemmings
killed by predators. In July 2014 the trend was the same as in August and
September with more females being killed by predators than males. There
were less specimens found-dead in July than in August possibly meaning
that the population was still growing and there were not that many
predators in the area. When the population increased even more in August,
more predators could have switched to wood lemmings and then switched
to other prey in September when numbers went down again. The fact that
the predation decreased from August 2014 until September 2014 could be
due to nomadic predators leaving the area as the amount of wood lemmings
decreased or that the amount of weasels decreased with decreasing number
of wood lemmings. Another explanation for the low number of wood
lemmings found-dead in September 2014 could be migration. When
densities are high, wood lemmings might leave their home range in search
of food. Eskelinen (1997) found that the migration of wood lemmings in
Finland started in the first half of August and peaking in the end of August
or the beginning of September. If the wood lemmings in the study area
engaged in the same behavior, this could explain the low number of
specimens found-dead in September 2014.
Sex-ratio in outbreak and non-outbreak years
Eskelinen (2004) found that the ratio of males in a population varied
between 15 - 29 %. Overall, this seems to be the case in my thesis as well
(10 - 36 %) apart from specimens killed by predation in 2014 (10 % males)
and for specimens snap-trapped in 2014 (36 % males). The low number of
males taken by predators in 2014 could again partly be explained by the
35skewed sex-ratio (54 females and eight males). Traps do not select for sex
and since males are more mobile Andreassen & Bondrup-Nielsen (1991)
suggested a bias from snap-traps on the sex-ratio of males where they
would expect a higher proportion of males in snap-traps. My results support
their suggestion with (36 % males snap-trapped 1995 - 2014) compared to
the sex-ratio of males found-dead (18 % in 2014 and 2017 combined).
Andreassen & Bondrup-Nielsen (1991) found that the sex-ratio of wood
lemmings caught in traps were 67 % females and 33 % males. This was
slightly more skewed than in the overall result here for all years with snap-
trapped specimens. In the outbreak year of 2014 the sex-ratio of snap-
trapped wood lemmings was 64 % females and 36 % males. In the non-
outbreak years of 1995 - 2007 the sex-ratio was 80 % females and 20 %
males. This means that the sex-ratio was less skewed in outbreaks years
compared to non-outbreak years of wood lemmings caught in snap-traps.
This might seem a bit controversial since the skewed sex-ratio might be the
reason for the high number of wood lemmings in outbreak years but it was
not significant when I tested it so it only gives indication of this pattern.
Difference in predation over time in days across years
In 2017 predation was stable at a low level and peaked in mid September.
After this peak there were multiple dates with high rates of predation. The
reason for this could be that one or several nomadic predators entered the
area at that time. The pattern in 2014 where predation increased in late July
and early August could be related to the total number of wood lemmings
found then. It would appear that the population was building up in July (18
specimens found-dead), peaking in August (47) and then declining in
September (3). Most predation occurred within a period of 2.5 weeks in
2014 (24th of July - 9th of August) although there was one case in late
September as well. As mentioned before this could be due to weasel
numbers following the numbers of wood lemmings as well as nomadic
predators entering the area at high wood lemming numbers and leaving
when numbers decreased.
Type and position of predator damage
The most common type of injury was larger holes and the least common
was point-shaped holes. Point-shaped holes are likely caused by different
predatory birds grabbing their prey with their talons and therefore I
interpret the results as if predation from avian species were not common for
the wood lemmings in my thesis due to the low amount of point-shaped
holes. The larger holes are more likely caused by mammalian predators
36such as weasels, stouts and foxes. Since there are photographs and
descriptions of all the injuries identified here it would be interesting to
compare these to the usual types of injuries inflicted by a specific kind of
predator to try to identify which predator caused which type of injury.
Unfortunately, there was not enough resources to include this aspect in my
thesis. This could be an interesting idea for future projects within this topic
since there is evidence that both mammalian and avian predators include
wood lemmings in their diet (Pulliainen & Ollinmäki, 1996; Støvern, 2012;
Nybo & Sonerud, 1990; Obuch & Bangjord, 2016). One helpful tool to
identify the predators involved could be to use environmental DNA
(eDNA). Nichols et al. (2012) used eDNA to identify which species of
herbivores that had been browsing at plants. If predator saliva is found at
the wood lemmings this method might unveil which predators are involved
in the predation.
Injuries on both sides of the chest was most common, closely followed by
the head with a large gap to both sides of the back. This makes sense since
the chest contains many vital organs and it would be easy to cause lethal
injuries in this area as well as on the head. Based on the most common
locations of the injuries, one could infer which predator killed the
specimens. Allen (1938) observed a New York weasel (Mustela frenata
noveboracensis) attacking a chipmunk (Tamias striatus). The weasel bit the
chipmunk at the back of the head and bit through the skull (Allen, 1938).
Byrne et al. (1978) observed the long-tailed weasel (Mustela frenata)
killing Richardson's ground squirrels (Citellus richardsoni) and observed
that the weasel used two different killing techniques. The first one was
biting the neck and the second one was biting the throat and thus
suffocating the prey (Byrne et al., 1978). Heidt (1972) states that the least
weasel kills its prey by biting the neck and biting through the skull or the
throat thus resembling the techniques used by the other subspecies of
weasels mentioned here.
Avian predators have different hunting techniques than mammalian
predators. Ogden (1974) states that the short-tailed hawk (Buteo
brachyurus) strike their prey from above with their talons. Csermely et al.
(1998) observed Eurasian kestrels catching mice and rats. The kestrels
landed on the preys back and held them down with their talons. After
gripping, the kestrel usually struck the prey with its beak on the head.
Although rare, some prey had talon wounds. These were very small holes in
skin and not considered as serious. The biting killed some of the mice but
the main cause of death was suffocation when the kestrel was holding the
prey with its talons (Csermely et al., 1998). This information could explain
why point-shaped holes was the least common type of injury since the
37You can also read