Towards understanding the characteristics of new particle formation in the Eastern Mediterranean
←
→
Page content transcription
If your browser does not render page correctly, please read the page content below
Atmos. Chem. Phys., 21, 9223–9251, 2021
https://doi.org/10.5194/acp-21-9223-2021
© Author(s) 2021. This work is distributed under
the Creative Commons Attribution 4.0 License.

Towards understanding the characteristics of new particle
formation in the Eastern Mediterranean
Rima Baalbaki1 , Michael Pikridas2 , Tuija Jokinen1 , Tiia Laurila1 , Lubna Dada1,a,b , Spyros Bezantakos2 ,
Lauri Ahonen1 , Kimmo Neitola1,2 , Anne Maisser2 , Elie Bimenyimana2 , Aliki Christodoulou2,3 , Florin Unga2 ,
Chrysanthos Savvides4 , Katrianne Lehtipalo1,5 , Juha Kangasluoma1 , George Biskos2 , Tuukka Petäjä1 ,
Veli-Matti Kerminen1 , Jean Sciare2 , and Markku Kulmala1
1 Institutefor Atmospheric and Earth System Research (INAR)/Physics, Faculty of Science, University of Helsinki,
P.O. Box 64, Helsinki, 00014, Finland
2 Climate & Atmosphere Research Centre (CARE-C), The Cyprus Institute, P.O. Box 27456, Nicosia, 1645, Cyprus
3 SAGE – Département Sciences de L’Atmosphère et Génie de L’Environnement, IMT Lille Douai, Université de Lille,

59000, Lille, France
4 Ministry of Labour, Welfare and Social Insurance, Department of Labour Inspection (DLI), Nicosia, Cyprus
5 Atmospheric Composition Research Unit, Finnish Meteorological Institute, P.O. Box 503, Helsinki, 00101, Finland
a now at: EPFL, School of Architecture, Civil and Environmental Engineering, Sion, 1951, Switzerland
b now at: Laboratory of Atmospheric Chemistry, Paul Scherrer Institute, Villigen, 5232, Switzerland

Correspondence: Rima Baalbaki (rima.baalbaki@helsinki.fi)

Received: 12 October 2020 – Discussion started: 18 November 2020
Revised: 23 April 2021 – Accepted: 4 May 2021 – Published: 16 June 2021

Abstract. To quantify the contribution of new particle forma-     urban environments, although our site is a rural one. Meteo-
tion (NPF) to ultrafine particle number and cloud condensa-       rological variables and trace gases played a role in explaining
tion nuclei (CCN) budgets, one has to understand the mech-        the intra-monthly variability of NPF events, but they did not
anisms that govern NPF in different environments and its          explain why summer months had the least NPF frequency.
temporal extent. Here, we study NPF in Cyprus, an Eastern         Similarly, pre-existing aerosol loading did not explain the ob-
Mediterranean country located at the crossroads of three con-     served seasonality. The months with the least NPF frequency
tinents and affected by diverse air masses originating from       were associated with higher H2 SO4 concentrations but lower
continental, maritime, and desert-dust source areas. We per-      NO2 concentrations, which is an indicator of anthropogenic
formed 1-year continuous measurements of aerosol particles        influence. Air masses arriving from the Middle East were not
down to ∼ 1 nm in diameter for the first time in the East-        observed during these months, which could suggest that pre-
ern Mediterranean and Middle East (EMME) region. These            cursor vapors important for nucleation and growth are trans-
measurements were complemented with trace gas data, mete-         ported to our site from the Middle East. Further comprehen-
orological variables, and retroplume analysis. We show that       sive measurements of precursor vapors are required to prove
NPF is a very frequent phenomenon at this site and has higher     this hypothesis.
frequencies of occurrence during spring and autumn. NPF
events were both of local and regional origin, and the local
events occurred frequently during the month with the lowest
NPF frequency. Some NPF events exhibited multiple onsets,         1   Introduction
while others exhibited apparent particle shrinkage in size.
Additionally, NPF events were observed during the nighttime       Atmospheric new particle formation (NPF) is the process by
and during episodes of high desert-dust loadings. Particle for-   which oxidized precursor gases initially form molecular clus-
mation rates and growth rates were comparable to those in         ters that then further grow in size by multi-component con-
                                                                  densation (Kulmala et al., 2014). A multitude of research

Published by Copernicus Publications on behalf of the European Geosciences Union.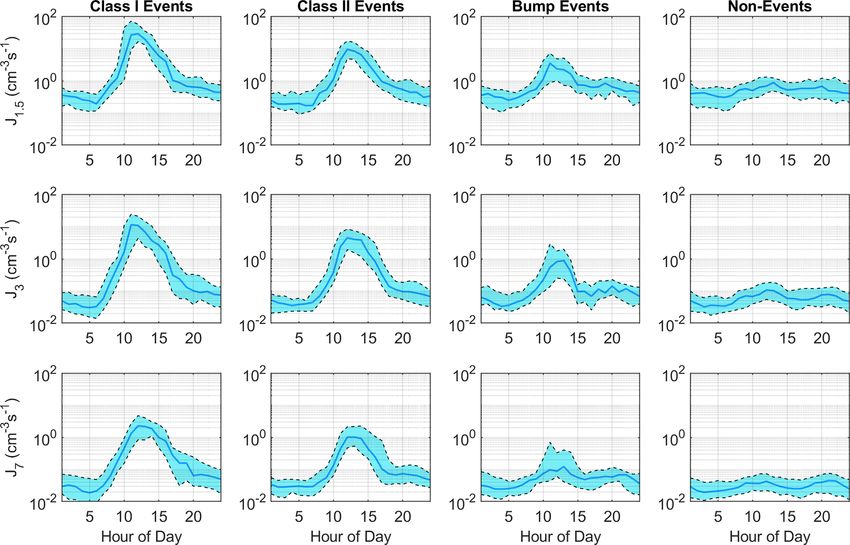
9224                              R. Baalbaki et al.: Towards understanding the characteristics of new particle formation

studies have focused on this phenomenon over the past              et al., 2020; Kopanakis et al., 2013). The seasonal cycle has
2 decades, because it is a large source of the global aerosol      a typical maximum during spring (Kalkavouras et al., 2020;
particle number and cloud condensation nuclei (CCN) load           Kopanakis et al., 2013; Kalivitis et al., 2019; Pikridas et al.,
(Gordon et al., 2017; Merikanto et al., 2009; Pierce and           2012), even though in some urban background sites the high-
Adams, 2009; Wang and Penner, 2009; Yu and Luo, 2009;              est frequency was observed during summer (Hussein et al.,
Kerminen et al., 2012; Spracklen et al., 2006, 2008). Owing        2020; Hamed et al., 2007). NPF was associated with a high
to the complex nature and nonlinearity of atmospheric pro-         increase in nucleation mode particles in most of the studies.
cesses, studies on NPF in the literature include atmospheric       For instance, Carnerero et al. (2018) showed that the impact
observations (e.g., Kulmala et al., 2013; Ehn et al., 2014;        of NPF on ultrafine particles is much higher than that of traf-
Bianchi et al., 2016; Yao et al., 2018; Williamson et al., 2019;   fic near the highly polluted city center of Madrid. The con-
Baccarini et al., 2020; Dall’Osto et al., 2018), chamber ex-       densation sink, which is a measure of the pre-existing aerosol
periments (e.g., Sipilä et al., 2010; Tröstl et al., 2016; Wang    surface area, was reported to be lower during NPF events in
et al., 2020; Lehtipalo et al., 2016; Kirkby et al., 2011), and    Po Valley, Corsica, and Crete (Hamed et al., 2007; Berland
theoretical computational studies (e.g., Kurtén et al., 2008;      et al., 2017; Pikridas et al., 2012), while NPF proceeded un-
Riipinen et al., 2011; Olenius and Riipinen, 2017). The col-       der both clean and polluted conditions in Barcelona (Cu-
lective scientific outcome from these studies is essential to      sack et al., 2013), Marseille, and Athens (Petäjä et al., 2007).
understand the mechanisms and characteristics of NPF (Ker-         The effect of meteorological conditions on NPF occurrence
minen et al., 2018; Lee et al., 2019; Chu et al., 2019) and        varied among studies. Simultaneous NPF events were ob-
how it affects the global climate (e.g., Spracklen et al., 2006;   served in several stations, illustrating that the spatial extent
Gordon et al., 2017).                                              of NPF events can vary from tens of kilometers (Carnerero et
   The frequency, strength, and spatiotemporal extent of NPF       al., 2018) to several hundred kilometers (Kalkavouras et al.,
are mainly governed by three factors: the prevailing meteo-        2017, 2020; Berland et al., 2017; Rose et al., 2015; Casquero-
rological conditions, the availability of gaseous precursors,      Vera et al., 2020). In the Po Valley, the production of CCN
and the pre-existing concentrations of aerosol particles (Ker-     from NPF was estimated to be comparable to that originat-
minen et al., 2018; Lee et al., 2019; Nieminen et al., 2018).      ing from primary sources (Laaksonen et al., 2005). Similarly,
These atmospheric conditions differ in space and time. At-         NPF was associated with a strong increase in CCN concen-
mospheric conditions are distinct over the Mediterranean           trations in Finokalia and Santorini (Kalkavouras et al., 2017,
basin, especially over the Eastern Mediterranean and Middle        2019; Kalivitis et al., 2015). However, the impact of the in-
East (EMME). This region has been identified as a hotspot          creased CCN concentrations on cloud droplet number was
for atmospheric and climate change research (Lelieveld et          shown to be limited by water availability (Kalkavouras et
al., 2016; Giorgi and Lionello, 2008). It is surrounded by         al., 2017). In Cyprus, mainly in Paphos, Gong et al. (2019)
three continents and is affected by continental, maritime,         observed several NPF events where newly formed particles
and desert-dust pollution sources (Lelieveld et al., 2002).        grew into the CCN size range, with NPF events being ob-
The surrounding complex orography of the Mediterranean             served on 9 out of 27 measurement days during April 2017
affects atmospheric dynamics and boundary layer processes          (Brilke et al., 2020). At a more inland site, NPF was observed
on different scales (Kostopoulou and Jones, 2007a, b). Fur-        on 14 out of 20 d of measurements in March 2015 (Debevec
ther, the dry and hot weather throughout most of the year,         et al., 2018). Since these studies were less than a month long,
with strongly increasing heat extremes, enables intense pho-       further comprehensive measurements are required to unveil
tochemistry (Lelieveld et al., 2016).                              the role of NPF in the atmospheric processes taking place in
   NPF studies over the Mediterranean have focused on the          the EMME region.
northwestern basin (Petäjä et al., 2007; Cusack et al., 2013;         The aim of this study is to characterize the seasonal cy-
Berland et al., 2017; Carnerero et al., 2018; Rose et al.,         cle of new particle formation events in the less represented
2015; Brines et al., 2015; Hamed et al., 2007; Laaksonen et        area of the EMME region. Our measurements were con-
al., 2005; Casquero-Vera et al., 2020), whereas NPF studies        ducted at a rural background site on the island of Cyprus,
in the eastern basin have been conducted mainly in Greece          which lies at the crossroads of three continents in the Eastern
(Petäjä et al., 2007; Berland et al., 2017; Kalivitis et al.,      Mediterranean. We report the first long-term analysis of par-
2015, 2019; Pikridas et al., 2012; Kalkavouras et al., 2019,       ticle number size distribution in the area down to sizes where
2020; Kopanakis et al., 2013; Siakavaras et al., 2016; Kalka-      the initial formation occurs. We further explore the role of
vouras et al., 2017) and very recently in Cyprus (Brilke et        sulfuric acid, which is one of the key gas-phase precursors
al., 2020; Debevec et al., 2018) and Jordan (Hussein et al.,       for cluster formation, and other atmospheric variables in ini-
2020). These studies include both short-term campaigns and         tiating NPF at this site.
long-term observation.
   Based on long-term measurements, the annual frequency
of NPF over the Mediterranean varies between 10 % and
36 % (Hussein et al., 2020; Kalivitis et al., 2019; Kalkavouras

Atmos. Chem. Phys., 21, 9223–9251, 2021                                              https://doi.org/10.5194/acp-21-9223-2021
R. Baalbaki et al.: Towards understanding the characteristics of new particle formation                                     9225

2     Materials and methods                                       cle sizer (SMPS, model TSI 3080; Wang and Flagan, 1990).
                                                                  The first two instruments were operated at the site for a pe-
2.1     Measurement site                                          riod of 1 year from 27 January 2018 to 26 January 2019,
                                                                  while the SMPS measurement period was from 27 January
Cyprus is an island country in the Eastern Mediterranean.         to 1 November 2018. The monthly availability of data from
It is the third most populous island in the Mediterranean         each instrument is shown in Table S1.
Sea and the third largest in size with an area of 9251 km2           The A11 nCNC is composed of a particle size magnifier
(Fig. 1). The measurements reported in this work were car-        (PSM; Airmodus A10) and a condensation particle counter
ried out at the Agia Marina Xyliatos station of the Cyprus        (CPC; Airmodus A20). The overall length of the inlet sam-
Atmospheric Observatory (CAO-AMX; Sciare, 2016), which            pling tube was 60 cm. The PSM was operated in a scan-
is a rural background station that operates under the co-         ning saturator flow mode between 0.1 and 1.3 L min−1 , cor-
operative program for monitoring and evaluation of the long-      responding to a cutoff diameter range of approximately 1.1
range transmission of air pollutants in Europe (EMEP) and         to 2.5 nm. It was equipped with an inlet system that performs
the European Research Infrastructure for the observation of       background (zero) measurements three times a day at ran-
Aerosols, Clouds and Trace gases Research Infrastructure          dom time intervals and a core sampling piece for minimizing
(ACTRIS) networks, while at the same time it is a desig-          line losses of sub-3 nm particles (Fig. S1). The duration of the
nated regional Global Atmospheric Watch (GAW) station.            background measurements was set to 12 min, which is equiv-
The station (35.038692◦ N, 33.057850◦ E) is located close to      alent to three full size scans. From June 2018 onwards, the
the villages of Agia Marina (∼ 630 inhabitants) and Xyliatos      nCNC was additionally equipped with a diluter to reduce the
(∼ 150 inhabitants) and has an elevation of 532 m above sea       humidity of the sampled air. This procedure was necessary
level. The site is surrounded by vegetation, mainly oak and       because the water content of the air at the measurement site
pine trees and Maquis shrubland, as it lies at the northeastern   was too high. The water present in the sample air was mixed
foothills of the Troodos Mountains. Agriculture areas sur-        with butanol inside the CPC of the nCNC and rendered it
round the site from the north direction and are approximately     measuring zeros. Further information about the diluter de-
4 km away. The nearest main urban agglomeration is at least       sign, its operation, and effect on the data can be found in the
35 km away. Therefore, it is not directly affected by any ma-     Supplement Sect. S2.2.
jor local pollution source, excluding some limited traffic to        The NAIS is a mobility spectrometer designed to deter-
reach the nearby Forestry Department premises.                    mine the number size distribution of ions in the mobility di-
   The weather at CAO-AMX is characterized by hot, dry            ameter range of 0.8–42 nm, as well as total (naturally charged
summers and mild, rainy winters. The daily mean tempera-          and neutral) aerosol particles in the mobility diameter range
ture is ∼ 19 ◦ C and ranges between 1 and 36 ◦ C, the daily       of ∼ 2–42 nm. The instrument operates at a flow rate of
mean relative humidity is ∼ 55 % and ranges between 13 %          ∼ 54 L min−1 . The length of the NAIS sampling tube was
and 82 %, and the daily mean ozone level is ∼ 48 ppb and          65 cm, with an inner diameter of 30 mm.
ranges between 26 and 77 ppb (Kleanthous et al., 2014). The          The SMPS used in this study was composed of a TSI
most common (> 65 % occurrence) wind pattern reaching             3081 long differential mobility analyzer (DMA) and a TSI
the site is the northerly “Etesian” winds transporting pol-       3025a CPC. It was operated to measure the aerosol particle
lutants from both Europe and Turkey, but winds are more           size distribution between 15 and 740 nm. The aerosol and
frequently arriving from the mainland of Turkey (Pikridas et      sheath flows were checked weekly and were set to 0.3 and
al., 2018). The remaining air masses originate from northern      3 L min−1 , respectively. The SMPS was sampling using an
Africa, the Middle East, and westerly air masses that spend       80 cm long vertical inlet. Drying was achieved using a short
several days above the sea before reaching Cyprus. The vari-      Nafion dryer, and charge neutralization was achieved by a
able air mass origins at CAO-AMX from three different con-        GRIMM 5522-A, americium-241, bipolar neutralizer.
tinents allow for a representative description of NPF pro-
cesses for the EMME region as a whole.                            2.2.2   Ancillary measurements

2.2     Instrumentation                                           Complementary meteorological data (temperature, relative
                                                                  humidity, solar radiation, rainfall, pressure, wind speed, and
2.2.1    Aerosol particle number size distribution                wind direction) were measured with a time resolution of
                                                                  5 min at an elevation of 10 m from the ground in the nearby
The particle number size distribution between 1 and 700 nm        village of Xyliatos (35.0140917◦ N, 33.0492028◦ E), located
was determined by combining data from three instru-               2.85 km from the measurement site. Air pollutants (ozone,
ments: an Airmodus A11 Nano condensation nucleus counter          carbon monoxide, nitrogen oxides, sulfur oxide, PM10 , and
(nCNC) system (Vanhanen et al., 2011), a neutral cluster and      PM2.5 ) were measured at the colocated EMEP station ∼ 20 m
air ion spectrometer (NAIS, model 1; Manninen et al., 2016;       from the main measurement container, and these data had
Mirme and Mirme, 2013), and a scanning mobility parti-            a time resolution of 1 h. Additional details about the set-

https://doi.org/10.5194/acp-21-9223-2021                                           Atmos. Chem. Phys., 21, 9223–9251, 2021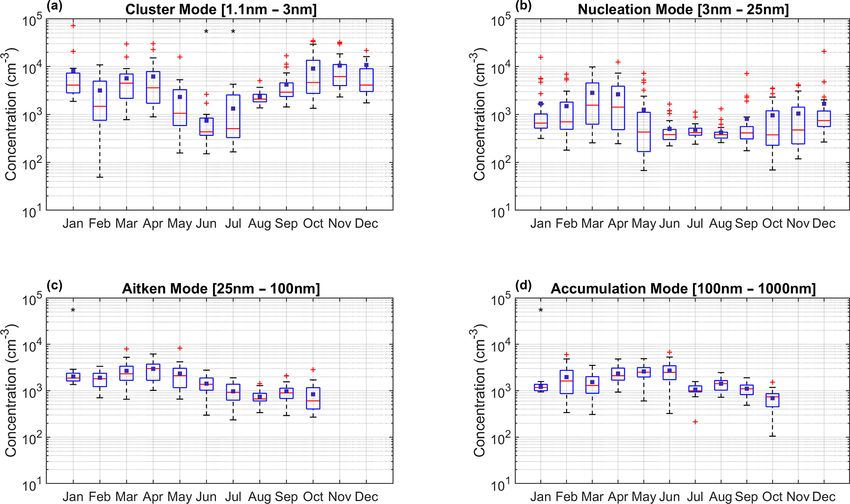
9226                                R. Baalbaki et al.: Towards understanding the characteristics of new particle formation

Figure 1. Maps of the Mediterranean region and Cyprus. (a) Location of Cyprus in the Mediterranean region. (b) Location of the measure-
ment site (CAO-AMX) in Cyprus. (c) Location of the measurement site (CAO-AMX) pointed out by the blue location marker with respect
to the villages of Agia Marina and Xyliatos. The geographic borders of the villages are marked by the yellow lines. The maps were retrieved
from Google (© 2020 Google, TerraMetrics).

ups and the instruments used can be found in Kleanthous et              ley and Kennedy equation for laminar flow (Gormley and
al. (2014) and Pikridas et al. (2018).                                  Kennedy, 1948). It is essential to note that the flow through
                                                                        the sampling inlet of the NAIS actually lies in the transient
2.3    Data handling                                                    regime (Re = 2376); however, the penetration efficiency us-
                                                                        ing this inlet was comparable for laminar flow and turbulent
nCNC. The scanning nCNC data were inverted into a size                  flow (calculated using the equation of turbulent inertial depo-
distribution with the kernel inversion method presented by              sition from Brockmann, 2011); thus, we used the correction
Lehtipalo et al. (2014), but using customized kernels which             based on laminar flow (Fig. S4).
follow the instrument-specific detection efficiency calibra-               SMPS. The data from the SMPS were inverted using TSI’s
tion curves. The following diameters were used in the in-               Aerosol Instrument Manager software (AIM, version 9.0).
version: 1.1, 1.3, 1.5, and 2.4 nm. The choice of the inver-            Afterwards, line loss correction was applied using the Gorm-
sion method was made after a comprehensive comparison be-               ley and Kennedy equation. Additional corrections based on
tween the kernel method and the expectation and minimiza-               laboratory calibrations were also applied to account for the
tion (EM) method (Cai et al., 2018; Chan et al., 2020). Addi-           CPC detection efficiency curves.
tional details about the comparability of the two methods and              Full particle size distribution (PSD). The data from the
the utilized inversion parameters are presented in Sect. S2.3.          three particle sizing instruments were used to reconstruct the
After inversion, the data were further corrected for line losses        full particle size distribution with a temporal resolution of
using the method suggested by Fu et al. (2019) for the sam-             5 min between 1.1 and 736 nm (nCNC: 1.1 to 2.4 nm; NAIS
pling line downstream of the core sampling inlet and using              particle mode: 2.4 to 30 nm; SMPS: 30 to 736 nm). How-
the Gormley and Kennedy equation for the line losses inside             ever, the SMPS measured dry aerosol particle number dis-
the 6 cm long core sampling piece (Gormley and Kennedy,                 tributions, which can differ from the ambient aerosol particle
1948).                                                                  number size distribution. Thus, we back-calculated the distri-
   NAIS. The NAIS data were inverted with the instrument-               bution of the SMPS at ambient conditions from the dry dis-
specific algorithm (done by the NAIS SPECTOPS software).                tribution using the hygroscopicity model of Petters and Krei-
The data were later corrected for line losses using the Gorm-

Atmos. Chem. Phys., 21, 9223–9251, 2021                                                    https://doi.org/10.5194/acp-21-9223-2021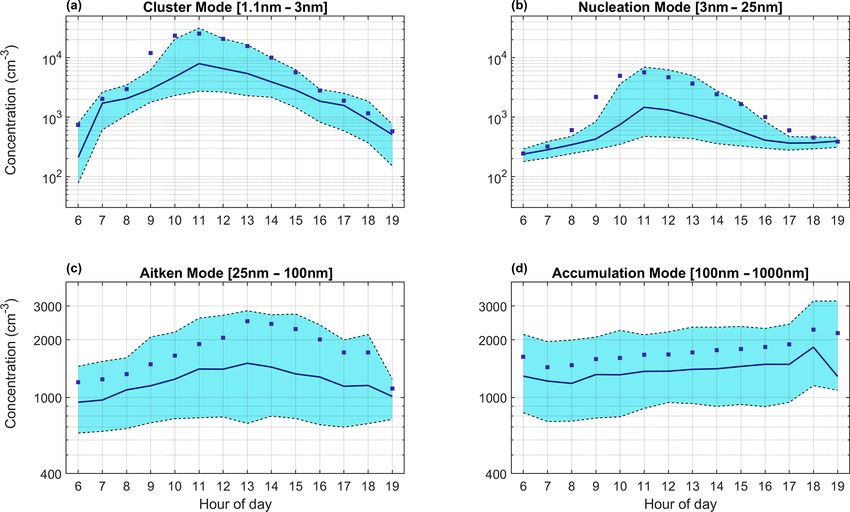
R. Baalbaki et al.: Towards understanding the characteristics of new particle formation                                      9227

denweis (2007) and mean κ values. Additional information           2.5   NPF-specific parameters
about these calculations and its effect on sink calculations
are presented in Sect. S4. The SMPS distribution at ambient        Condensation sink (CS) is a loss term for condensable va-
conditions was reconstructed up to 1500 nm. This does not          pors used to describe their loss rate by condensation to pre-
imply that the measurement range was extended to 1500 nm           existing aerosol surface. This term was first introduced by
but rather that now we account for particles that were orig-       Kulmala et al. (2001), and it is derived based on condensing
inally of sizes up to 1500 nm but were dried to sizes below        vapor mass flux to the particles in the continuum regime and
736 nm in the SMPS sampling line. Additionally, since the          applying the transitional correction factor (βm ) proposed by
NAIS is known to overestimate concentrations in the particle       Fuchs and Sutugin (1971):
mode, the overlapping measurement range with the SMPS                         X                    X
was used to further correct the NAIS data, assuming that the       CS = 4π D βmi ri Ni = 2π D βmi dpi Ni ,                   (1)
                                                                                i                    i
NAIS overestimate concentrations uniformly over the whole
measurement range, which is a reasonable assumption for            where r, dp , and N are the particle radius, diameter, and num-
old NAIS models based on calibration results (Gagné et al.,        ber concentration, respectively, in the size class i, and D is
2011; Kangasluoma et al., 2020). Finally, the PSD data were        the diffusion coefficient of the condensing vapor calculated
run through a 2D median filtering algorithm with a 3-by-           as recommended by Fuller et al. (1966):
3 neighborhood window. Moreover, the data were manually                                            q
checked for the success of the outlier and noise removal tech-                         0.001T 1.75 MH1SO + M1air
                                                                                                         2 4
niques.                                                            D (H2 SO4 , air) =       p             √         ,           (2)
   Complementary data. Gas and meteorology data sets were                                P ( 3 VH2 SO4 + 3 Vair )2
run through an outlier removal algorithm and filtered for er-
                                                                   where T is the temperature, M is the molar mass, P is the
roneous samples. The outlier detection method was based on
                                                                   atmospheric pressure, and V is the diffusion volume. Here,
removing data points that are more than 3 standard deviations
                                                                   CS was calculated assuming that sulfuric acid is the main
from a moving median (Davies and Gather, 1993; Pearson et
                                                                   condensing vapor.
al., 2016).
                                                                       Coagulation sink (CoagS) is a loss term for freshly formed
2.4   Event classification                                         particles used to describe their loss rate by Brownian coagu-
                                                                   lation to pre-existing aerosol surface (Kulmala et al., 2001).
The reconstructed full particle size distribution daily plots      It is calculated as
were used to categorize measurement days into NPF event                         X
days, non-event days, and undefined days based on a clas-          CoagS dp =          Kij Nj ,                                (3)
                                                                                    j
sification that combines the schemes reported in literature
(Dal Maso et al., 2005; Hirsikko et al., 2007; Manninen et         where Kij is the Fuchs form of the Brownian coagulation
al., 2010; Kulmala et al., 2012). The classification of events     coefficient (Fuchs, 1964; Seinfeld and Pandis, 2012).
utilizing PSD data that extends below 10 nm, which is a typ-          Apparent growth rate (GR) is the rate of change in the di-
ical measurement limit for most SMPS systems, improves             ameter, dp , that represents the growing-particle population.
the event classification and allows for better identification of   It was calculated here using the NAIS data for negatively
event days that would otherwise be classified as undefined         charged ions, positively charged ions, and total particles
or non-events if only PSDs above 10 nm were used (Leino            (charged + neutral) by the appearance time method (Lehti-
et al., 2016; Dada et al., 2018; Brilke et al., 2020). In addi-    palo et al., 2014). First, the time to reach 50 % of the max-
tion, spectra of total particles (both neutral and charged) are    imum concentration is determined, and then the growth rate
usually easier to visually classify than those corresponding       is derived as the slope of the linear fit between the diameters
to charged particles (measured by the ion mode of NAIS),           and time:
because atmospheric nucleation is dominated by neutral pro-
cesses (Kontkanen et al., 2013; Kulmala et al., 2013; Wagner              ddp   1dp
                                                                   GR =       =     .                                          (4)
et al., 2017). Furthermore, the concentration of the growing               dt    dt
mode in the charged spectra is lower for the smaller particle      We calculated GR at three different size ranges: between 1.5
sizes and increases with diameter as the probability of clus-      and 3 nm (GR1.5–3 ), between 3 and 7 nm (GR3–7 ), and be-
ter ions attaching to the growing neutral particles increases      tween 7 and 20 nm (GR7–20 ).
(Gonser et al., 2014). Thus, it could be visually difficult to        Event start and end times were determined based on the
determine if particle nucleation starts from the smallest sizes    time evolution of the 2–4 nm particles, which is the size range
when looking at the charged spectra only. In contrast, one         suggested by Dada et al. (2018). Using this size range, we
should not neglect to look at the charged spectra, because         are able to capture the early stages of the event, which is
these might show sign preference or ion-induced nucleation         unachievable if the measured PSD starts from bigger sizes.
events (Rose et al., 2018).                                        Thus, computed event start and end times might differ across

https://doi.org/10.5194/acp-21-9223-2021                                            Atmos. Chem. Phys., 21, 9223–9251, 2021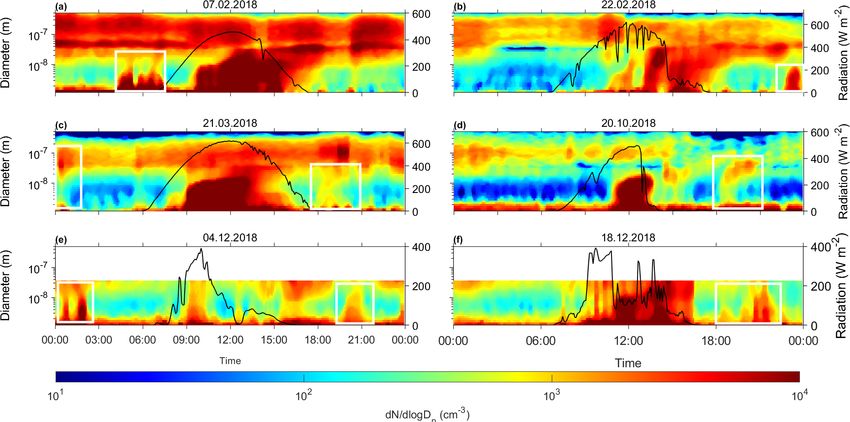
9228 R. Baalbaki et al.: Towards understanding the characteristics of new particle formation
studies depending on the instrument used. An event start is existing particles (condensation sink) but also includes loss
determined by an increase in the 2–4 nm particle concentra- of H2 SO4 via atmospheric clustering starting from H2 SO4
tion above the nighttime level which lasts for at least an hour. dimer formation.
An event end time is determined when the 2–4 nm particle
concentration decreases to background levels. In case of mul- 2.7 Air mass origin analysis
tiple events within a 1 d window, the event start and end times
were taken from the start of the first event and the end of the Air mass origins for the entire measurement period were
last event, respectively. modeled using the Lagrangian particle dispersion model
Particle formation rate (J ) is the rate at which aerosol par- FLEXPART (FLEXible PARTicle dispersion model, version
ticles of certain size are formed in the atmosphere. It quan- 8.23) in a backward mode (Stohl et al., 2005), with meteo-
tifies the intensity of the NPF events, and it is calculated by rological (0.5◦ × 0.5◦ , 6 h starting from midnight UTC) Na-
rearranging the equation describing the time evolution of the tional Center for Atmospheric Research (NCAR, ds 0.94)
particle number concentration (Kulmala et al., 2012). dp in data as input. We used “species 1” (tracer), which does not in-
this equation refers to the smaller limit of the size bin used clude wet or dry deposition and assumes an infinite lifetime
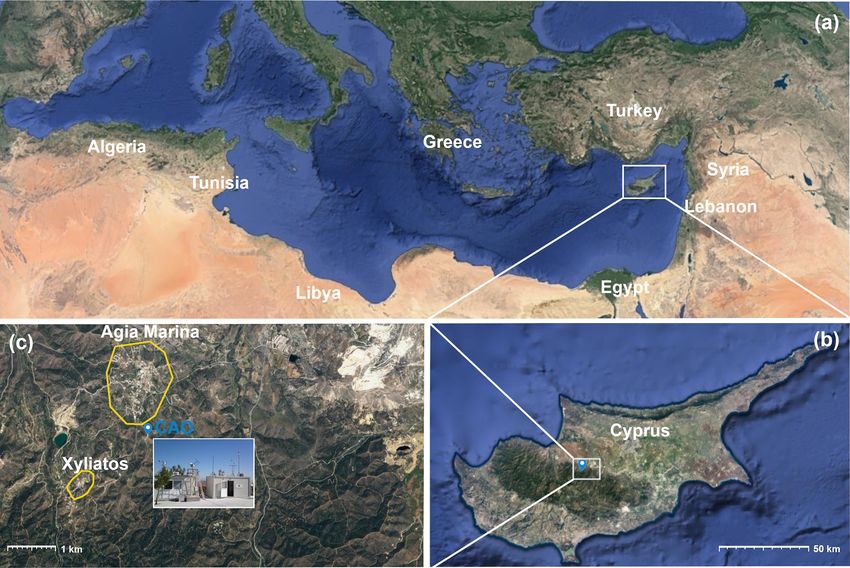
in the calculation of the formation rate. We calculated J at for the particles, as the tracer released to model the retro-
three sizes: 1.5 nm (J1.5 ), 3 nm (J3 ), and 7 nm (J7 ); the upper plumes. Retroplumes replace simple back-trajectory calcu-
size limits used were 3, 7, and 20 nm, respectively. GR was lations in the interpretation of atmospheric trace substance
calculated as the mean of the three GR measurements (neg- measurements, and were traced back in time for 5 d using
ative ions, positive ions, and total particles) and was consid- CAO-AMX as the receptor site. Air masses were categorized
ered constant within the event start and end times. Outside into source regions based on the potential emission sensitiv-
the event times and during non-events, the GR term was con- ity (PES) for the lowest 1 km above ground level (a.g.l.), fol-
sidered equal to zero. lowing the classification method of Pikridas et al. (2010). In
general, a retroplume was attributed to a region in the case
dNdp GR that this had a PES value above 0.9 ns kg−1 . The classifi-
J dp = + CoagSNdp + Nd (5)
dt 1dp p cation scheme of the source regions took into consideration
The first term on the right-hand side of Eq. (5) represents dominant air mass paths shown by Pikridas et al. (2018) and
the time evolution of particle number concentration Ndp , the the different sources of PM with characteristic chemical fin-
second term represents the coagulation losses due to larger gerprint. As a result, the predominant northerly air masses
aerosol particles, and the third term represents the condensa- were categorized into “Europe” and “NW Asia” (namely,
tional growth to sizes bigger than the considered size range. Turkey), assuming different emissions related to SO2 . “N.
Africa” and “SW Asia” are both source areas of dust parti-
2.6 Sulfuric acid proxy cles but with distinct emission levels, with the former being
associated with more elevated concentrations. The “Asia sec-
Sulfuric acid is one of the key gas-phase compounds iden- tor” was distinguished to point out that air masses from this
tified to contribute to new particle formation (e.g., Weber et specific source region scarcely reach the receptor site, while
al., 1996; Sipilä et al., 2010). As direct measurements of sul- the source region “Local” refers to stagnant conditions. Last,
furic acid are challenging, a suite of proxies for the sulfuric the “Marine” sector is associated with the lowest levels of
acid concentrations are derived that facilitate the calculation ambient PM. In total, seven source regions were identified
of gas-phase sulfuric acid from ancillary observations (Dada similar to the ones presented by Pikridas et al. (2018), except
et al., 2020; Mikkonen et al., 2011; Petäjä et al., 2009; Lu that in our analysis the “West Turkey” sector was merged to
et al., 2019; Weber et al., 1997). In this study, the sulfuric the NW Asia sector.
acid proxy was calculated using the new method by Dada
et al. (2020) for a rural site, which was developed based on 2.8 Identification of days with high dust loading
observations from the same site of this study:
Measurement dates with high dust loading were identified
CS using the VI-PM1 online method proposed by Drinovec et
[H2 SO4 ]rural = −
2 × 2 × 10−9 al. (2020). This method couples a high-flow virtual impactor
(VI) sampler, which concentrates coarse particles, with an
h CS
2 aerosol absorption photometer. More details about the calcu-
+ −9
lations and a list of the identified dust days can be found in
2 × 2 × 10 Sect. S5.
[SO2 ] i1
−9 2
+ −9
9 × 10 × GlobRad . (6)
2 × 10
This proxy not only considers the formation of H2 SO4 from
SO2 via OH oxidation and the loss of H2 SO4 onto pre-
Atmos. Chem. Phys., 21, 9223–9251, 2021 https://doi.org/10.5194/acp-21-9223-2021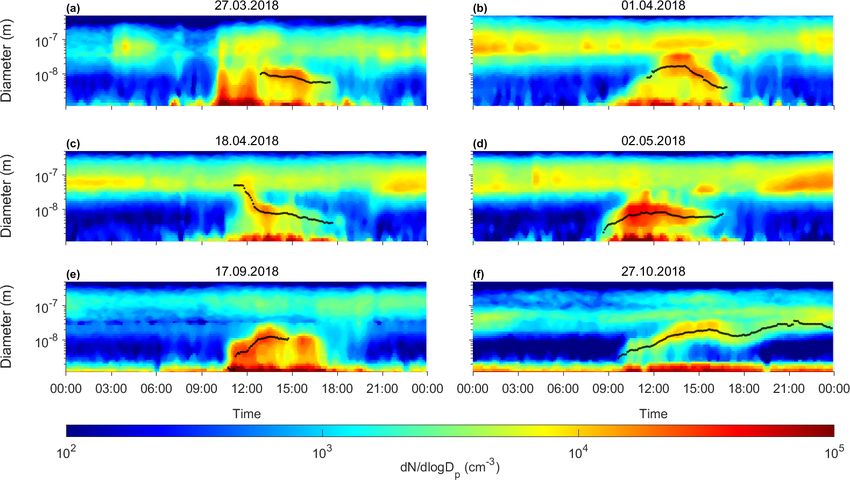
R. Baalbaki et al.: Towards understanding the characteristics of new particle formation                                        9229

3     Results and discussion                                        either suggest more growth from NPF to Aitken sizes or
                                                                    higher emission and transportation of primary particles dur-
In the course of identifying NPF events, the PSD spectrum           ing spring. The accumulation mode had its maximum dur-
is usually analyzed, mainly at sizes below 25 nm where one          ing the warm months, except during July which did not fol-
can detect the emergence of new aerosol particles, and then         low the pattern of other months. Previous long-term mea-
the particle growth to larger sizes is followed. Since little       surements of PM2.5 at this site have a similar pattern with
is known about particle number size distributions from the          higher concentrations during the warm period of the year and
EMME region, we will first present the seasonal and diur-           minimum during winter (Pikridas et al., 2018). This maxi-
nal variability of particle number concentration in different       mum during the summer is mainly explained by the enhanced
PSD modes (Sect. 3.1). Then, we will identify and charac-           transport of polluted air masses from the northern sector,
terize NPF events (Sect. 3.2). Following that, we will quan-        combined with the lack of precipitation and overall dry con-
tify and analyze relevant parameters that describe NPF events       ditions during Eastern Mediterranean summer (Pikridas et
(Sect. 3.3) and use those parameters, together with meteoro-        al., 2018). Lastly, it is worth mentioning that during Febru-
logical variables, to understand why and when NPF occurs            ary the concentrations of particles in all modes did not follow
at our site (Sect. 3.4). We further present a regression and        the overall trend. It exhibited lower concentrations of cluster,
a classification analysis (Sect. 3.5). All the data in this arti-   nucleation, and Aitken mode particles and higher concentra-
cle are presented in local time (UTC+3 from 25 March to             tion of accumulation mode particles than the before-and-after
28 October 2018 and UTC+2 during the rest of the cam-               months.
paign). Unless otherwise indicated, we mainly focus on day-            The diurnal variation (at radiation > 50 W m−2 ) of the
time data having global radiation > 50 W m−2 as this is the         cluster and nucleation mode particles exhibited a clear cycle,
time period relevant for most NPF events, but we also briefly       with the highest values recorded between 09:00 and 15:00 LT
mention some nighttime events. For reference, the monthly           and the maximum at 11:00 LT (Fig. 3a and b). There was a
range of day hours having global radiation > 50 W m−2 is            slight time difference between the appearance of the clus-
presented in Fig. S6.                                               ter mode particles and that of the nucleation mode particles
                                                                    which could only be seen in the 5 min data. The Aitken mode
3.1    Seasonal and diurnal variability of number                   had a less distinct diurnal cycle, having the peak at later hours
       concentration in different modes                             of the day, which might indicate that these particles have pos-
                                                                    sibly grown from the cluster and nucleation modes (Fig. 3c).
Figure 2 presents the monthly percentiles boxplots (25th,           The accumulation mode, on the other hand, did not exhibit
50th, and 75th) and the mean averages of the cluster mode           any clear diurnal cycle, which might suggest that these parti-
(∼ 1–3 nm), nucleation mode (3–25 nm), Aitken mode (25–             cles are not emitted or produced from any local source but are
100 nm), and accumulation mode (100–1000 nm) particle               rather transported over a long range. They can be aged pri-
number concentrations computed from daily data with global          mary particles or particles originating from NPF taken place
radiation > 50 W m−2 (daytime conditions). A clear seasonal         1–3 d earlier in arriving air masses (Fig. 3d).
pattern is depicted which is distinct across the different parti-
cle modes. The cluster mode particles had two peaks, one            3.2   General character of the NPF events
in spring and another in autumn with a clear drop during
the summer. The monthly boxplots also show high variabil-           New particle formation has been detected to occur in a va-
ity in daily concentrations throughout most months, except          riety of environments within the troposphere (Kerminen et
August and September. This variability seems highest during         al., 2018; Lee et al., 2019; Nieminen et al., 2018). Typically,
February. The nucleation mode particles were also highest           the appearance of clusters is detected in the morning hours
during the spring and lowest during the summer. The au-             followed by subsequent growth. The occurrence of new par-
tumn concentrations did not exhibit another peak but were           ticle formation events is determined by examining the time
rather similar to the summer concentrations in terms of me-         evolution of the aerosol number size distributions (e.g., Kul-
dian values, but they exhibited higher variability. The cluster     mala et al., 2012). Throughout the 1-year measurement cam-
and nucleation mode concentrations can be directly linked to        paign (365 d), we identified 207 event days (56.7 %), 119
the NPF activity, especially in sites where direct emissions        non-event days (32.6 %), 31 undefined days (8.5 %), and 8
of particles having these size ranges are minimal, which is         no-data days (2.2 %) mainly due to power cuts at the station
the case for our site. While the high concentration of clus-        (Fig. 4). The annual-median NPF frequency at CAO-AMX
ter mode particles during spring was associated with high           calculated without accounting for days with no data amounts
concentration of nucleation mode particles, this did not hold       to 58 %, which belongs to the high end of the global NPF fre-
for autumn, which might indicate that condensable vapors            quency distribution (Nieminen et al., 2018), with the highest
were not as available to grow the particles to nucleation size.     frequency being measured in South Africa (86 %; Hirsikko
The Aitken mode exhibited higher concentrations during the          et al., 2012). High frequency of NPF occurrence is also ob-
spring months followed by a decreasing pattern, which could         served for Saudi Arabia (73 %; Hakala et al., 2019).

https://doi.org/10.5194/acp-21-9223-2021                                             Atmos. Chem. Phys., 21, 9223–9251, 2021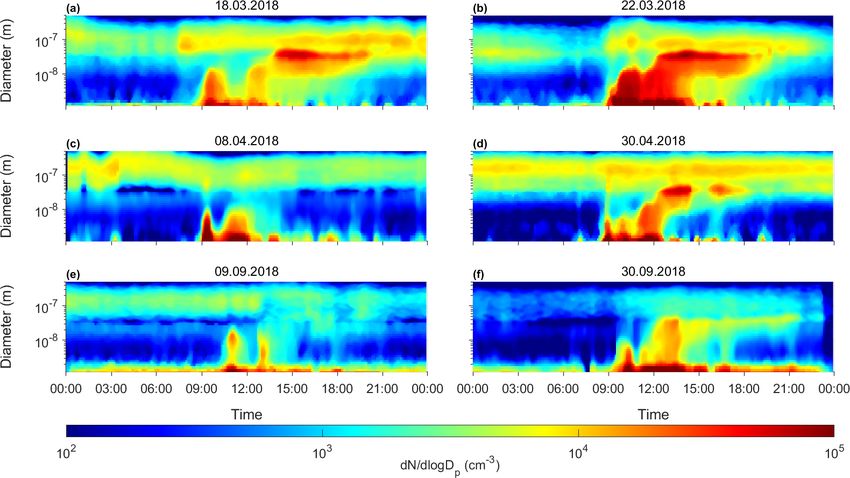
9230                                 R. Baalbaki et al.: Towards understanding the characteristics of new particle formation

Figure 2. Monthly variation (at radiation > 50 W m−2 ) of particle number concentration of (a) cluster mode, (b) nucleation mode, (c) Aitken
mode, and (d) accumulation mode presented by boxplots. The central red marks indicate the median, the small blue squares indicate the
mean, and the bottom and top edges of the boxes indicate the 25th and 75th percentiles, respectively. The whiskers extend to the most
extreme data points not considered outliers, and the outliers are plotted individually using the “+” symbols. Data presented have daily time
resolution. Month designated with “∗ ” symbols have less than 20 d of data. Note that SMPS measurements were not available in November
and December.

Figure 3. The diurnal cycle (at radiation > 50 W m−2 ) of particle number concentration of cluster mode (a), nucleation mode (b), Aitken
mode (c), and accumulation mode (d). The shaded areas with dashed black boundaries represent the 25th and 75th percentile limits, while
the solid line represents the median and the squares indicate the mean. Notice the difference in the y scale between the top and bottom plots.

Atmos. Chem. Phys., 21, 9223–9251, 2021                                                     https://doi.org/10.5194/acp-21-9223-2021
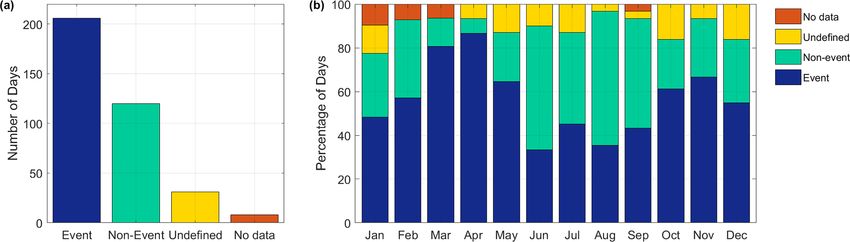
R. Baalbaki et al.: Towards understanding the characteristics of new particle formation                                          9231

Figure 4. Classification of NPF events presented (a) annually and (b) monthly.

   NPF took place throughout the year, but it had a clear sea-         al., 2017), “hump events” (Vakkari et al., 2011; Yli-Juuti et
sonal pattern with a broad spring maximum, less pronounced             al., 2009), “suppressed events” (Chen et al., 2017), “station-
autumn maximum, and slightly lower frequencies during                  ary NPF events” (Größ et al., 2018), or “weak NPF events”
other times of the year. The months with the highest NPF               (Lee et al., 2020). The fraction of these events was highest
frequencies were March and April, while June and August                during the month with the lowest NPF frequency (mainly
had the lowest frequencies. This seasonal pattern of NPF fre-          during summer), which could imply that during these months
quency is very similar to that recorded at the Finokalia atmo-         a lesser amount of condensing vapors was present to grow the
spheric observation station in Crete (Kalivitis et al., 2019),         particles to bigger sizes or extend the event duration (Fig. 5).
which is a nearby Eastern Mediterranean site having similar               The NPF events started almost always from the sub-3 nm
synoptic conditions. Nonetheless, monthly NPF frequency at             range at CAO-AMX. The apparent growth reached a diame-
Finokalia ranged between ∼ 17 % and 42 %, which is sub-                ter of 20 nm on 25 % of event days (Fig. 6a); thus, it could
stantially lower than the range reported here (33 %–86 %).             have been difficult to identify those days if we have re-
The higher NPF frequency at CAO-AMX could partially be                 lied solely on SMPS measurements which suffer from high
due to the use of PSD data that starts from the ∼ 1 nm size            losses and low counting statistics in the sub-10 nm size range
range, which facilitates NPF classification especially during          (Brilke et al., 2020; Kangasluoma et al., 2020; Wiedensohler
days when the particle growth does not pass the 10 nm size             et al., 2012). Additionally, it was difficult to distinguish the
or does not continue for several hours. We compared the NPF            growing mode at sizes above 50 nm, mainly because of the
classification using SMPS data only and using full PSD for             pre-existing aerosols and fluctuating air masses. This implies
time periods when SMPS data were available, and we at-                 that particles growing from NPF might have been able to
tained 30 % less event days classified. Another factor that            grow to bigger sizes, but their identification from the PSD
could contribute to the higher NPF frequency is the surround-          spectrum was not possible. The median event duration was
ing forest nature which emits VOCs that oxidize in the at-             ∼ 5.4 h (Fig. 6b). The events typically started 2 to 4 h after
mosphere and contribute to particle growth (Riipinen et al.,           sunrise and ended 7 to 11 h after sunrise (Fig. 6c), similar to
2011).                                                                 what was observed by Dada et al. (2018).
   We further separated the NPF event days into class I or                Another feature of NPF events observed at CAO-AMX
class II events or into the so-called “bump” events (Manni-            was the occurrence of two or three consecutive daytime
nen et al., 2010). The calendar of event classification is pre-        nucleation events (Fig. 7). These multiple events occurred
sented in Fig. S7, and examples of event types are given in            on ∼ 20 % of the recorded event days. Similar observations
Fig. S8. Class I events differ from class II events not by the         were reported in South Africa, and they were mainly at-
strength of the event but rather by the ability to calculate the       tributed to changes in air masses, interruptions by clouds,
particle growth rate for such event, meaning that the growing          and boundary layer dynamics as well as their relation to the
mode diameter or concentration does not fluctuate strongly.            amount of vapors present (Hirsikko et al., 2013). Salma and
Bump events are NPF events where a burst of nucleation                 Németh (2019) have also showed that NPF events with broad
mode particles is seen, but the particles do not usually grow          or multiple onsets are abundant in the urban environment of
past the ∼ 10 nm size, and the duration of these events is typ-        Budapest, Hungary.
ically short. The calculation of growth rates for these events            We also observed events with a decreasing mode diame-
is sometimes problematic because the growth happens very               ter, sometimes referred to as shrinkage events. These events
fast (in less than 15 min), and it cannot be captured by the           were mainly observed in the NAIS ion mode, while some of
time resolution of the measuring instrument. In the literature,        them were also observed in both ion and total particle spectra
these events have been called “bursting events” (Dall’Osto et          (Fig. 8). These types of events have been observed in multi-

https://doi.org/10.5194/acp-21-9223-2021                                                Atmos. Chem. Phys., 21, 9223–9251, 2021
9232                                R. Baalbaki et al.: Towards understanding the characteristics of new particle formation

Figure 5. Monthly percentage of the classes of event days.

Figure 6. Percentage histograms showing the frequency distribution of (a) NPF events growing to a certain diameter, (b) NPF event duration,
and (c) the event start and end times from sunrise.

ple environments and are usually attributed to particle evapo-          time clustering events that do not usually grow past 5 nm
ration triggered by elevated temperatures, size-dependent di-           have been attributed to the formation of large, highly oxy-
lution caused by wind, or boundary layer development mix-               genated organic molecules (HOMs), mainly from monoter-
ing, or changes in air masses bringing small particles to the           pene oxidation (Lehtipalo et al., 2011; Rose et al., 2018;
measurement site (Alonso-Blanco et al., 2017; Backman et                Bianchi et al., 2019). In the French Landes forest, nocturnal
al., 2012; Cusack et al., 2013; Hakala et al., 2019; Kivekäs            NPF events with clear growth up to 100 nm were attributed
et al., 2016; Salma et al., 2016b; Skrabalova et al., 2015;             to monoterpene oxidation under stratified atmospheric con-
Tsagkogeorgas et al., 2017; Yao et al., 2010; Young et al.,             ditions (Kammer et al., 2018). Monoterpene concentrations
2013; Zhang et al., 2016; Carnerero et al., 2018).                      reported at the Landes forest reached up to 25 ppb, whereas
   We spotted a few events with nighttime clustering, which             those measured in the boreal forest were below 2 ppb. Con-
could reflect a chemistry that does not depend on photo-                current measurements of biogenic volatile organic com-
oxidation (Fig. 9). These events occurred mainly during the             pounds (BVOCs) were not available in this study, but the
cold months associated with high cluster mode concentra-                average concentration of monoterpenes during March 2015,
tion. Nighttime events have been observed in other Mediter-             which is a month with high biogenic activity, was reported
ranean studies as well (Carnerero et al., 2018; Kopanakis et            to be 0.236 ± 0.294 ppb with a maximum up to 4.5 ppb (De-
al., 2013; Kalivitis et al., 2012). In a boreal forest, night-          bevec et al., 2018).

Atmos. Chem. Phys., 21, 9223–9251, 2021                                                    https://doi.org/10.5194/acp-21-9223-2021
R. Baalbaki et al.: Towards understanding the characteristics of new particle formation                                         9233

Figure 7. Examples of days with multiple nucleation events: (a) 18 March 2018, (b) 22 March 2018, (c) 8 April 2019, (d) 30 April 2018,
(e) 9 September 2018, and (f) 30 September 2018.

Figure 8. Example of days showing a decreasing mode diameter: (a) 27 March 2018, (b) 1 April 2018, (c) 18 April 2018, (d) 2 May 2018,
(e) 17 September 2018, and (f) 27 October 2018 in local time. The mode diameter is plotted as black circular markers.

   Lastly, the EMME region is characterized by a high load-          non-events, 2 undefined days, and 2 no-data days were iden-
ing of dust which contributes to around 34 % (∼ 10 µgm−3 )           tified. Figure 10 shows the temporal variation of PM10–2.5 ,
of the annual PM10 levels (Pikridas et al., 2018). In this           PM2.5 , and particle number size distribution measured dur-
study, 50 d with high dust loading (Table S3) was identified         ing three of the dust episodes with ±5 d window before and
based on ground measurements of mineral dust concentra-              after the dust episode. NPF took place at high dust loadings,
tions (Sect. S5). Among these dates, 37 NPF event days, 9            and there is no obvious threshold for the dust loading above

https://doi.org/10.5194/acp-21-9223-2021                                               Atmos. Chem. Phys., 21, 9223–9251, 2021
9234                                R. Baalbaki et al.: Towards understanding the characteristics of new particle formation

Figure 9. Examples of days with nighttime clustering and growth marked with white rectangles: (a) 7 February 2018, (b) 22 February 2018,
(c) 21 March 2018, (d) 20 October 2018, (e) 4 December 2018, and (f) 18 December 2018. The black line is the solar radiation (W m−2 ),
which can be read from the right axis. Note the difference in the color scale used in this figure in comparison to Figs. 7 and 8.

which NPF does not occur. In addition, the formation rates
(Fig. S9) and growth rates (Fig. S10) between NPF event
days not affected by high dust loading and NPF event days
affected by high dust loadings seem to be comparable. J7
was slightly higher on days affected by high dust loading,
but this could be related to the lower number of dust cases
compared with the non-dust cases. High dust loadings can
affect NPF in opposing ways. On the one hand, it can sup-
press photochemical processes by scavenging reactive gases
and condensable vapors (De Reus et al., 2000; Ndour et al.,
2009). On the other hand, it can provide particles that can
act as a site for heterogeneous photochemistry promoting the
formation of gaseous OH radicals, which initiate the conver-
sion of SO2 to H2 SO4 (Dupart et al., 2012; Nie et al., 2014).
However, a clear association between high dust loading and
NPF was not found from the data set presented here.

3.3    NPF-specific parameters

In this section we analyze two parameters that describe the           Figure 10. Temporal variations of aerosols during dust episodes
strength of NPF: particle formation rates (J ) and particle ap-       with 5 d before and 5 d after the dust episode. (a) Time series
parent growth rates (GR).                                             of particle size distribution, PM10–2.5 , and PM2.5 between 1 and
   Particle formation rates. The particle formation rates for         15 February 2018 (dust episode: 6 to 10 February). (b) Time se-
1.5, 3, and 7 nm particles (J1.5 , J3 , and J7 , respectively) were   ries of particle size distribution, PM10–2.5 , and PM2.5 between
                                                                      15 March and 2 April 2018 (dust episode: 20 to 28 March). (c) Time
calculated when SMPS measurements were available (until
                                                                      series of particle size distribution, PM10–2.5 , and PM2.5 between
2 November), and they are presented in Fig. 11. J1.5 was the
                                                                      26 April and 15 May 2018 (dust episode: 26 to 27 April and 1 to
highest during the spring: March had the highest median J1.5 ,        7 May).
while April had more events with extreme J1.5 values as ex-
pressed by the higher mean. In contrast, J3 and J7 did not
exhibit a clear seasonality, but their values were in general

Atmos. Chem. Phys., 21, 9223–9251, 2021                                                  https://doi.org/10.5194/acp-21-9223-2021
R. Baalbaki et al.: Towards understanding the characteristics of new particle formation 9235 higher during the spring. The diurnal cycle for the formation other studies, the ion mode GR reported here is on the higher rates was more pronounced during the class I events than dur- range of GRs measured at 12 European sites (Manninen et ing the class II or bump events, and the peak median hourly al., 2010 cf. Fig. S11). The high growth rates reported here value was highest during class I events (Fig. 12). The me- could be associated with the high fraction of bump events. dian peak of J1.5 and J3 during the class I events and bump As discussed in Sect. 3.3, these events are characterized by a events occurred between 11:00 and 12:00 LT, whereas for J7 burst of particles within a short period of time, which would the peak occurred between 12:00 and 14:00 LT. For the class translate to higher growth rates. II events, the corresponding peaks occurred about 1 h later. To place the formation rates in a global perspective, we com- 3.4 The driving atmospheric parameters of the NPF pare J3 from this study to other studies (Table 1), because it events is the most commonly reported value in literature. The stud- ies in Table 1 were selected on the basis of having 1 year To explain the occurrence of NPF at CAO-AMX, we investi- or more of measurement data. J3 values determined in this gated the effect of the following variables: CS, meteorologi- study were higher than those measured at semi-pristine rural cal conditions (temperature, solar radiation, pressure, relative areas (Värrio, Hyytiälä, and Tomsk), lower than those mea- humidity, wind speed and wind direction), trace gas concen- sured in a megacity (Beijing), and higher than those values trations (NOx , SO2 , CO, and O3 ), air mass origin, and sulfu- reported at urban and rural sites affected by urban pollution ric acid concentrations. (Budapest, Helsinki, Vavihill, and Po Valley). The median of CS at CAO-AMX, for the periods that Apparent growth rates. We report size-segregated growth SMPS measurements were available, was 7.9 × 10⁻³ s−1 rates between 1.5 and 3 nm (GR1.5–3 ), between 3 and (25th–75th percentiles = 5.2 × 10⁻³ –13.9 × 10⁻³ ), while 7 nm (GR3–7 ), and between 7 and 20 nm (GR7–20 ) as the mean was 10.7 × 10⁻³ s−1 ± 8.2 × 10⁻³ s−1 (computed recommended by Kulmala et al. (2012) for negatively from daily median values). These values lie within the range charged ions, positively charged ions, and total particles of coastal (Kalivitis et al., 2019) and urban environments (charged + neutral), respectively (Fig. 13). The growth rates (Salma et al., 2016a; Jun et al., 2014). They are higher than of total particles were higher than those of the charged frac- the values reported for forests and semi-pristine environ- tion, which is in agreement with earlier studies showing en- ments (Dal Maso et al., 2002; Dada et al., 2017) and lower hanced growth rates in the neutral channel at diameters below than the values reported for highly polluted cities (Wu et al., 15 nm (Gonser et al., 2014; Manninen et al., 2009; Rohan Ja- 2007). The average diurnal cycle of the size-segregated CS yaratne et al., 2016). This behavior has been explained by for the whole measurement period shows that particles above Gonser et al. (2014), who provided a conceptual model of 50 nm were the main contributors to the CS, even though par- the influence of cluster ion recombination and attachment at ticles down to ∼ 3 nm could also exhibit a high CS (Fig. S12). different stages of particle nucleation and growth. The sea- Thus, nucleating aerosols can largely contribute to the avail- sonal behavior of the growth rates was also distinct. In the able aerosol surface area. The NPF frequency typically de- sub-3 nm range, the growth rates of the negative ions had creases with an increasing CS (Pikridas et al., 2012; Salma similar median values across the year except during July, et al., 2016a; Dada et al., 2017; Dai et al., 2017; Hakala et which had higher growth rates, whereas the positive ions had al., 2019; Hussein et al., 2020). However, NPF has been ob- a notable increase in the growth rates in the summer months. served in polluted environments at exceptionally high values The difference in the growth rates at these cluster sizes sug- of CS, indicating that inefficient cluster scavenging or en- gests that the ion-induced NPF processes are more impor- hanced cluster growth (or a combination of both) drives NPF tant in the positive channel. In the 3–7 nm size range, there regardless of the high load of pre-existing particles (Yao et was no clear seasonal pattern except that June had the high- al., 2018; Kulmala et al., 2017). In our study, we did not est growth rates in the negative and positive mode, while the find a clear relation between CS and the monthly NPF oc- month exhibiting the highest growth rates in the total particle currence, and NPF did not necessarily occur at low values of mode were February and June. In the 7–20 nm size range, the CS (Fig. 14). To further explore the effect of CS on NPF, we growth rates exhibited a clear seasonality in all channels with checked whether the NPF event days had lower CS before a peak in February and another broad peak during the sum- the onset of nucleation (period from midnight to morning) in mer months. The GR increased with an increasing particle comparison to non-event days, but we did not find any appar- size, which is a typical feature in the sub-20 nm size range, ent association (Fig. S13). A possible explanation for why because condensational growth is more favorable as the par- CS is not systematically lower on NPF event days could be ticle size increases and the Kelvin effect decreases (Manni- similar to that observed at some mountain sites where the nen et al., 2010). The median growth rates in the three size sources of NPF precursors and their sinks (i.e., CS) share ranges (calculated from the daily means of the three chan- the same origin; thus, CS is not necessarily a limiting factor nels) were 3.7, 9.2, and 11.7 nm h−1 . These GRs are higher (Sellegri et al., 2019). than those reported for a rural boreal environment (1.9, 3.8, Next, we inspected the effect of meteorological variables and 4.3 nm h−1 ) (Yli-Juuti et al., 2011). In comparison to (Fig. 15) on the occurrence of NPF. By considering the data https://doi.org/10.5194/acp-21-9223-2021 Atmos. Chem. Phys., 21, 9223–9251, 2021
9236                                 R. Baalbaki et al.: Towards understanding the characteristics of new particle formation

Figure 11. Monthly variation of particle formation rates during NPF events: (a) J1.5 , (b) J3 and (c) J7 . The central marks indicate the median,
the small blue squares indicate the mean, and the bottom and top edges of the boxes indicate the 25th and 75th percentiles, respectively. The
whiskers extend to the most extreme data points not considered outliers, and the outliers are plotted individually using the “+” symbols.
The numbers above the boxplot represent the number of data points within each boxplot. Data presented have daily time resolution. Daily J
values were calculated by taking the mean of hourly values within event duration times.

Figure 12. Diurnal variation of J1.5 (top), J3 (middle), and J7 (bottom) during class I, class II, bump events, and non-events. Shaded areas
represent the 25th and 75th percentile bounds, while the solid lines represent the median.

Atmos. Chem. Phys., 21, 9223–9251, 2021                                                       https://doi.org/10.5194/acp-21-9223-2021
R. Baalbaki et al.: Towards understanding the characteristics of new particle formation                                                          9237

Table 1. Comparison of formation rates from long-term measurements at various sites including this study.

    Site                         Type                                 Period                      J3                    Reference
                                                                                  Mean ± SD     Median      Min–max
    CAO-AMX, Cyprus              Rural                                2018–2019   6.42 ± 8.47     4.19      0.04–82.5   This study
    Vavihill, Sweden             Rural                                2001–2004           4.3     1.89                  Kristensson et al. (2008)
    Hyytiälä, Finland            Rural                                1996–2004           0.8       0.6      0.06–5.0   Dal Maso et al. (2007)
    Värriö, Finland              Rural                                1996–2004           0.2       0.1                 Dal Maso et al. (2007)
    Tomsk, Russia                Rural                                2005–2006           0.4       0.4      0.04–1.1   Dal Maso et al. (2008)
    Beijing, China               Urban clean                          2004–2005   22.3 ± 15.1     18.7       4.4–81.4   Wu et al. (2007)
                                 Urban polluted                                     16.2 ± 12      9.9       3.3–51.7
    St. Louis, USA               Urban                                2001–2003      17 ± 20           9                Qian et al. (2007)
    Po Valley, Italy             Rural w. urban influence             2002–2005         5.89      3.31     0.24–36.89   Hamed et al. (2007)
    Budapest, Hungary            Urban                                2008–2009    4.2 ± 2.5a      4.2a    1.65–12.5a   Salma et al. (2011)
    Helsinki, Finland            Urban                                1997–2006           2b     1.09b     0.63–2.87b   Hussein et al. (2008)
    Zeppelin, Norway             Arctic                               2016–2018                             0.02–1.62   Lee et al. (2020)
  a data represent 6–25 nm range. b calculated from monthly values.

from all the months together, NPF events took place over                            Intra-monthly, NPF events occurred at higher global radia-
a wide range of meteorological conditions. Higher temper-                           tion during the winter and autumn months, whereas in spring
atures seemed to be favorable for intra-monthly NPF oc-                             (except April) and summer months radiation did not seem
currence; however, the higher temperatures from June to                             to be a limiting factor for NPF (Fig. 15b). Inter-monthly,
September did not coincide with higher NPF frequencies                              the month with the highest solar radiation did not coincide
(Fig. 15a). The effect of temperature on NPF has been stud-                         with the highest occurrence of NPF. Regarding ambient rel-
ied extensively in chamber experiments, with a general con-                         ative humidity (RH), NPF events tend to occur at lower RH
sensus that lower temperatures favor nucleation at the kinetic                      in both clean and polluted environments (Kerminen et al.,
regime and thus enhance NPF in inorganic systems like the                           2018). However, high RH values do not necessarily suppress
sulfuric acid–ammonia system (Lee et al., 2019). However,                           NPF (Salma and Németh, 2019), which agrees with our ob-
in organic systems where highly oxygenated organic com-                             servations (Fig. 15c). In terms of the surface air pressure,
pounds (HOMs) are the main NPF species, temperature plays                           intra-monthly NPF was on average observed on days with
a double role. On the one hand, the Gibbs free-energy bar-                          higher pressures, and the inter-monthly NPF occurrence was
rier is reduced at lower temperatures, favoring the conden-                         the lowest during the month with the lowest surface pressure
sation of less oxidized vapors that would not condense at                           (Fig. 15d). With respect to wind speed, high wind speeds did
higher temperatures. On the other hand, lower temperatures                          not seem to prevent NPF, but event days occurred mostly un-
lead to decreased auto-oxidation reaction rates and reduced                         der low wind speeds (Fig. S14). In terms of wind direction,
yields of HOMs. Recent studies have shown that the former                           NPF occurred mainly when the wind was blowing from the
effect compensates for the latter effect, having an overall in-                     west to east sector but with a frequency of occurrence which
crease in nucleation and growth rates at lower temperatures                         is higher in north to easterly winds (Figs. S14, S15, and
(Stolzenburg et al., 2018; Simon et al., 2020; Ye et al., 2019).                    S16). The north-to-easterly direction is the direction where
While these mechanisms are clear in chamber studies, the sit-                       the main agglomerations and livestock farming lands are sit-
uation becomes more complicated in the atmosphere because                           uated. These local sources could be enhancing the occurrence
of the complexity of the atmosphere–biosphere system hav-                           of NPF, but no direct relation was found between the north-
ing simultaneous temperature-dependent processes that can                           to-easterly wind direction and specific event types (Fig. S16).
enhance or suppress NPF, making current atmospheric ob-                             However, NPF class I events did not occur when the wind
servations inconsistent on the role of temperature on NPF                           was originating from the southeast to southwest sector.
(Kerminen et al., 2018). Solar radiation is regarded as one                            The EMME region is among the regions with the high-
of the most important factors affecting NPF (Jokinen et al.,                        est background of trace gases and aerosol concentrations in
2017). Its intensity is relatively high in Cyprus all year round.                   the Northern Hemisphere (Lelieveld et al., 2002). Here, we

https://doi.org/10.5194/acp-21-9223-2021                                                               Atmos. Chem. Phys., 21, 9223–9251, 2021
You can also read