An efficient vector based CRISPR/ Cas9 system in an Oreochromis mossambicus cell line using endogenous promoters - Nature
←
→
Page content transcription
If your browser does not render page correctly, please read the page content below
www.nature.com/scientificreports
OPEN An efficient vector‑based CRISPR/
Cas9 system in an Oreochromis
mossambicus cell line using
endogenous promoters
Jens Hamar & Dietmar Kültz*
CRISPR/Cas9 gene editing is effective in manipulating genetic loci in mammalian cell cultures and
whole fish but efficient platforms applicable to fish cell lines are currently limited. Our initial attempts
to employ this technology in fish cell lines using heterologous promoters or a ribonucleoprotein
approach failed to indicate genomic alteration at targeted sites in a tilapia brain cell line (OmB).
For potential use in a DNA vector approach, endogenous tilapia beta Actin (OmBAct), EF1 alpha
(OmEF1a), and U6 (TU6) promoters were isolated. The strongest candidate promoter determined
by EGFP reporter assay, OmEF1a, was used to drive constitutive Cas9 expression in a modified OmB
cell line (Cas9-OmB1). Cas9-OmB1 cell transfection with vectors expressing gRNAs driven by the TU6
promoter achieved mutational efficiencies as high as 81% following hygromycin selection. Mutations
were not detected using human and zebrafish U6 promoters demonstrating the phylogenetic
proximity of U6 promoters as critical when used for gRNA expression. Sequence alteration to
TU6 improved mutation rate and cloning efficiency. In conclusion, we report new tools for ectopic
expression and a highly efficient, economical system for manipulation of genomic loci and evaluation
of their causal relationship with adaptive cellular phenotypes by CRISPR/Cas9 gene editing in fish cells.
Use of fish in physiology studies is widespread with purposes ranging from production enhancement of eco-
nomically important species to models of basic vertebrate biology. Many of these studies have expanded into the
use of cell cultures and there are now many fish cell lines available derived from various species and t issues1,2,
including an Oreochromis mossambicus brain cell line (OmB) generated in our lab3. Cell cultures have been used
as early as 1 9104 as a simplified model to study molecular mechanisms and have been key in many important
biological and medical discoveries since t hen5–7. Their use has many advantages including the ability to isolate
cells from the influence of systemic factors such as hormones, facilitated control over the extracellular environ-
ment, proficient manipulation of intracellular systems through transfection of ectopic molecules (i.e. DNA, RNA,
protein), minimization of genetic heterogeneity, and reduction in the costs and ethical concerns associated with
the use of whole animals.
Targeted genetic manipulation of cell cultures has been an effective tool in deciphering specific functions of
cellular components, which is enabled by applying CRISPR/Cas9 gene editing systems to cell culture m odels8,9.
Compared to other gene targeting methods such as TALENS or Zinc fingers that require complex assembly
of many DNA binding domain coding sequences into a v ector10,11, the Cas9 nuclease can be directed to a spe-
cific locus of the genome by merely changing the 5′ terminal ~ 20 bp of a 90 bp RNA molecule (guide RNA or
gRNA) to be complementary to the target region adjacent to a genomic NGG Protospacer Adjacent Motif (PAM)
sequence12.
Utilization of this powerful tool has great potential to benefit cost-efficient and high-throughput mechanistic
studies in fish cell lines. Implementation of CRISPR/Cas9 has been achieved in mammalian cell lines and in fish
embryos, with consistent success in a wide variety of species such as zebrafish13–16, medaka17, killifish, carp18,
salmon19, anchovy20, catfish21, and the economically important Oreochromis species22. Methods for CRISPR/Cas9
gene editing in some fish cell lines have been p ioneered23,24 but only reported for a few lines and taxa so far. The
methods employed with fish embryos utilized microinjection of either RNA or gRNA/Cas9 protein ribonucleo-
protein (RNP) complexes. Microinjection is a suitable technique for the large cell size of the egg but not practical
for high through-put application in cultured cells. A corresponding CRISPR/Cas9 system that works reliably and
Biochemical Evolution Laboratory, Department of Animal Science, University of California, Davis, CA 95616, USA.
*
email: dkueltz@ucdavis.edu
Scientific Reports | (2021) 11:7854 | https://doi.org/10.1038/s41598-021-87068-3 1
Vol.:(0123456789)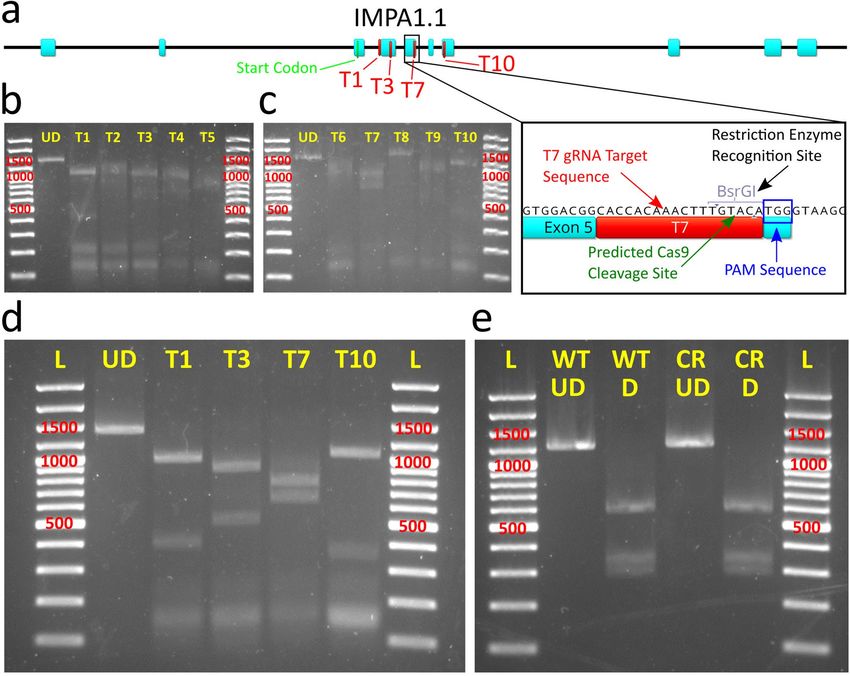
www.nature.com/scientificreports/
can be adopted in a high-throughput manner to enable efficient testing of causal relationships between many
targets identified in systems biology approaches (transcriptomics or proteomics) and specific environmental
contexts would be an invaluable complement to its use in fish embryos.
Using OmB cells, multiple attempts using DNA expression vector CRISPR/Cas9 delivery methods were made
in our laboratory, all of which failed to yield evidence of sequence alteration at the targeted sites. Although no
edits were observed, this work demonstrated efficient transfection of these constructs by using selectable mark-
ers and the ability to isolate transfected cells by growth on selective media. Consequently, we suspected that
failure to observe CRISPR/Cas9 cleavage by this method was due to insufficient expression of the Cas9 enzyme
by the polymerase II promoter, insufficient gRNA expression by the polymerase III U6 promoter, or both. These
attempts used either the mammalian or zebrafish promoters for Cas9 and gRNA expression. However, Tilapia
(percomorpha), are phylogenetically distant from zebrafish (otomorpha) and tetrapod vertebrates (tetrapoda-
morpha)25–27, which may render the aforementioned promoters ineffective in cells derived from tilapia and other
distantly related species.
Consequently, subsequent attempts should be precluded by evaluation of a set of known strong promoters
including conventionally available viral and composite promoters, and multiple endogenous promoters known
to be among the most efficient within their respective systems such as beta-Actin and elongation factor 1 (EF1)
alpha. Other potential improvements that can be employed to increase editing efficiency in a vector-based system
is constitutive expression of Cas9 and selectable marker systems built into the DNA vector. Constitutive Cas9
expression through genomic integration allows time for accumulation and nuclear localization of Cas9 in addi-
tion to significantly reducing the vector size for subsequent transfection of the gRNA expressing constructs and
permits testing many targets in a highly efficient manner. Selection systems allow for enrichment of cells that have
at least obtained and are expressing the vector increasing the likelihood of isolating cells with targeted gene edits.
Another means to circumvent poor expression is to transfect cells directly with gRNA/Cas9 ribonucleopro-
tein complexes (RNPs). This approach can achieve high editing efficiency in cultured cells without relying on
cellular mechanisms to recognize and produce the required CRISPR/Cas9 components from ectopic encoding
molecules (ie DNA or RNA)28.
In this work we sought to establish a highly efficient, high-throughput, and economical CRISPR/Cas9 gene
editing system for the OmB cell line by testing direct transfection of gRNA/Cas9 RNPs and optimizing critical
aspects of a DNAvector delivery approach.
Results
Lipid‑based transfection of in vitro validated RNPs did not yield detectable gene edits in OmB
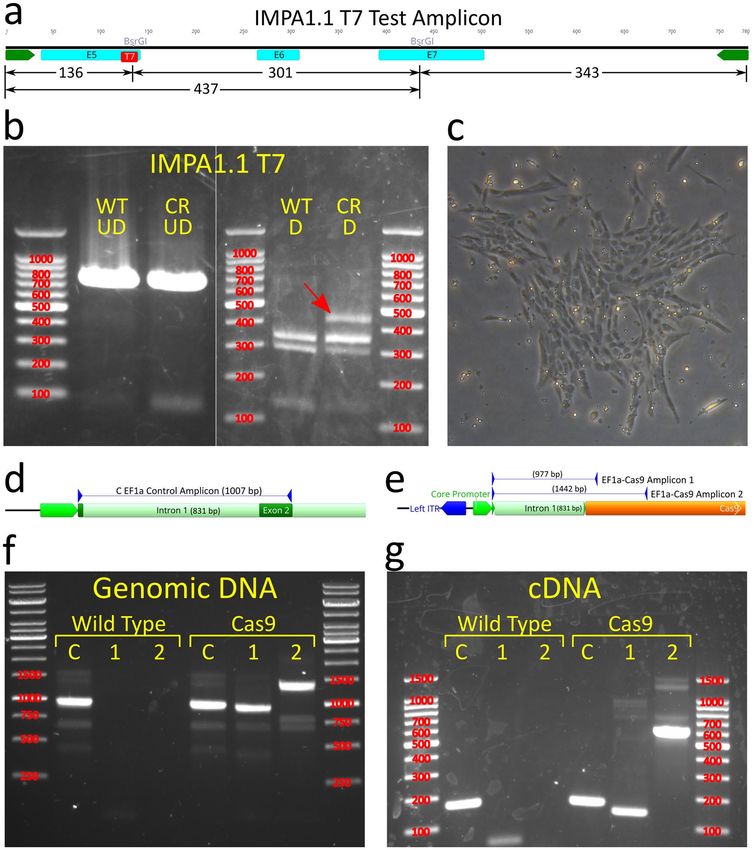
cells. We chose the inositol monophosphatase 1.1 (IMPA1.1) gene as the target for optimization of gRNAs by
in vitro cleavage assay. Of ten targets (T) within or adjacent to exons of the IMPA1.1 coding sequence (Fig. 1a–c)
screened by in vitro cleavage assay, four targets (T1, T3, T7, and T10) showed the most thorough cleavage of the
1392 bp test amplicon containing all targets (Fig. 1d). Transfection of Cas9/gRNA RNPs using these targets was
performed on wild-type OmB cells using a lipid-based transfection system specifically designed for delivery of
Cas9/gRNA RNPs. PCR amplification of a 1392 bp amplicon containing the targeted region was performed on
DNA harvested five days post transfection. Restriction site mutation (RSM) analysis, in which the occurrence of
gene editing is evaluated by whether or not a restriction site overlapping with the potential Cas9 cleavage site is
still able to be cleaved by the corresponding restriction enzyme, of the T7 amplicon was performed with BsrGI
(Fig. 1e). RSM of the T7 treatment amplicon digested thoroughly by BsrGI yielded the identical expected band
pattern (748 bp, 343 bp, and 301 bp) as the equivalent amplicon from control cells (Fig. 1e) indicating com-
plete BsrGI digestion and lack of CRISPR induced mutation of the BsrGI restriction site. All target sequences
and primers used for PCR amplification of test amplicons in the RNP experiments are listed in Supplementary
Table S1.
Endogenous O. mossambicus promoters show greatest potential for maximal Cas9 expression
in OmB cells. To maximize Cas9 expression from a DNA expression construct we cloned and screened a
set of candidate Polymerase II promoters with documented strong expression in some fish or other vertebrate
cells. These promoters include CAG (hybrid promoter consisting of CMV enhancer, chicken beta-Actin pro-
moter, and rabbit beta-Globin intron), CMV (cytomegalovirus), SV40 (simian vacuolating virus 40), and the
zebrafish ubi promoter29 (Zubi). Moreover, two O. mossambicus endogenous promoters, Beta-Actin (OmBAct)
and EF1 alpha (OmEF1a) were cloned by PCR of genomic DNA (Fig. 2a) and sequenced (GenBank accession
nos. MT791223 and MT791222 respectively). Expression strength of each promoter was compared by quanti-
tation of relative enhanced green fluorescent protein (EGFP) fluorescent intensity (Fig. 2b) of cells transiently
transfected with EGFP expression constructs driven by each of the promoters (n = 2 per promoter, SE = 2.1e + 07,
α = 0.05). The O. mossambicus endogenous promoters showed the highest fluorescent intensity per cell with
OmEF1a being significantly greater than CAG (> twofold, p = 0.0485) and SV40 (six-fold, p = 0.0077 respec-
tively). Although not significant, the OmEF1a promoter gave higher fluorescence than the OmBAct promoter
(1.53e + 08 vs 1.50e + 08). Qualitative visual assessment of the images was consistent with the quantitative data
(Fig. 2c). Additionally, due to its more compact size (1039 bp vs 1643 bp) and lower frequency of common
restriction enzyme sites, the OmEF1a promoter was selected for expression of Cas9. It was cloned into the
OmEF1aCas9P2APuroSB Sleeping Beauty transposon vector (Fig. 2d) upstream of a single coding sequence
including Cas9 and puromycin resistance genes separated by the P2A self-cleaving peptide. This construct was
co-transfected into OmB cells with the Sleeping Beauty transposase expression plasmid. After three days of 2 µg/
ml puromycin treatment all un-transfected control cells had detached from the culture plate, but about 10% of
Scientific Reports | (2021) 11:7854 | https://doi.org/10.1038/s41598-021-87068-3 2
Vol:.(1234567890)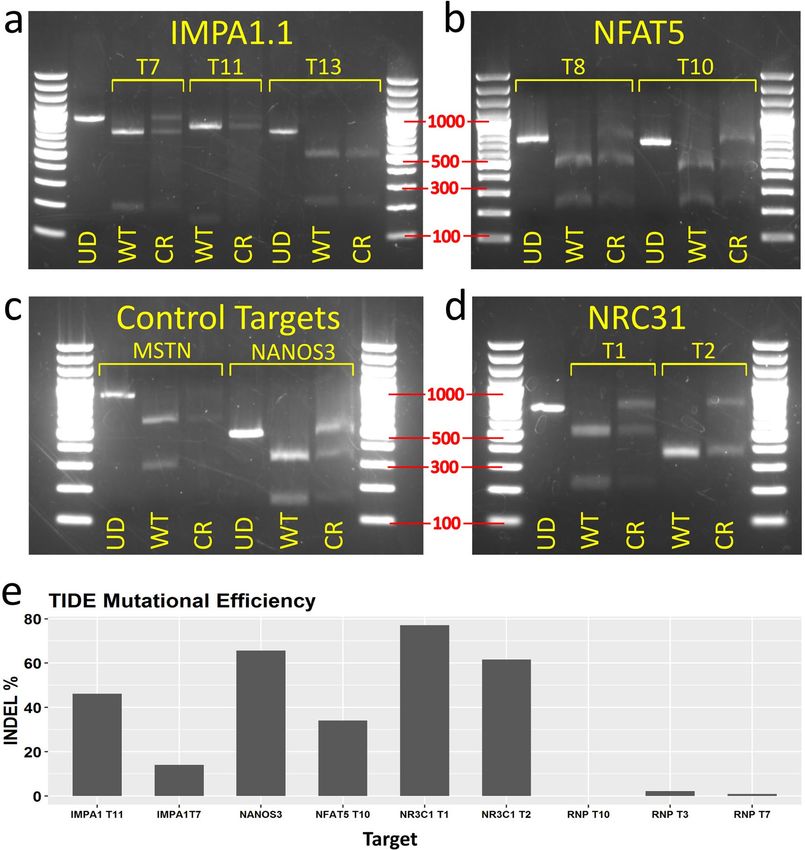
www.nature.com/scientificreports/
Figure 1. In vitro cleavage assay and OmB cell line gene targeting of IMPA1.1 using Cas9/gRNA RNPs.
(a) Gene map of Oreochromis IMPA1.1 showing selected gRNA target sites and expanded view of T7 site
containing BsrGI restriction site used for analysis of Cas9 cleavage. (b–e) Agarose gel images with marker sizes
(base pairs or bp) labeled in red (b and c) of initial in vitro cleavage assay screen of ten target sites (T1-T10) and
reference un-digested substrate amplicon (UD); (d) Follow up confirmatory in vitro cleavage assay results of the
apparent most efficient cleaving gRNAs from the initial screen showing complete cleavage of substrate amplicon
into expected fragments and (e) RSM analysis in which the BsrGI digested amplicon from IMPA1.1 T7 CRISPR
treated cells (CR D) shows the exact same band pattern as the BsrGI digested wild-type amplicon (WT D)
indicating no detectable mutation at the target site. The un-digested amplicons were included for reference (WT
UD = wild-type un-digested, CR UD = CRISPR treated un-digested). The gel images in this figure have been
significantly cropped to conserve space and increase focus on relevant bands. Full-length gels are presented in
Supplementary Figure S1. Gene map and sequence images were generated using Geneious 11.0.3 (Biomatters,
https://www.geneious.com). Image editing and assembly into complete figures was performed using Inkscape
0.92 (https://www.inkscape.org).
the transfected cells persisted and proceeded to proliferate in the selection media indicating stable genomic
integration of the transgene.
Identification of tilapia U6 promoters that contain vertebrate U6 consensus core ele‑
ments. Because the endogenous OmBAct and OmEF1a promoters were substantially stronger in driving
EGFP expression than commonly used heterologous polymerase II promoters, we presumed an endogenous O.
mossambicus polymerase III promoter (i.e. U6) would be superior for driving gRNA expression than commonly
used human or zebrafish U6 promoters. NCBI Blast searches of known fish U6 genes including promoters and
approximately 100 bp of the transcribed region against the NCBI O. niloticus reference genome (taxid: 8128)
yielded four unique candidate U6 promoters designated as TU6_1 (LOC112847594), TU6_2 (LOC112846585),
TU6_3 (LOC112848092), and TU6_4 (LOC112841904). TU6_1, found by BLAST of a medaka U6 (taxid: 8090,
LOC111948268), contained a well-defined TATA box at position − 31 to − 23 from the transcription start site
(TSS + 1) (Fig. 3a). Moreover, sequence alignments of the four candidate tilapia U6 promoters against each other
Scientific Reports | (2021) 11:7854 | https://doi.org/10.1038/s41598-021-87068-3 3
Vol.:(0123456789)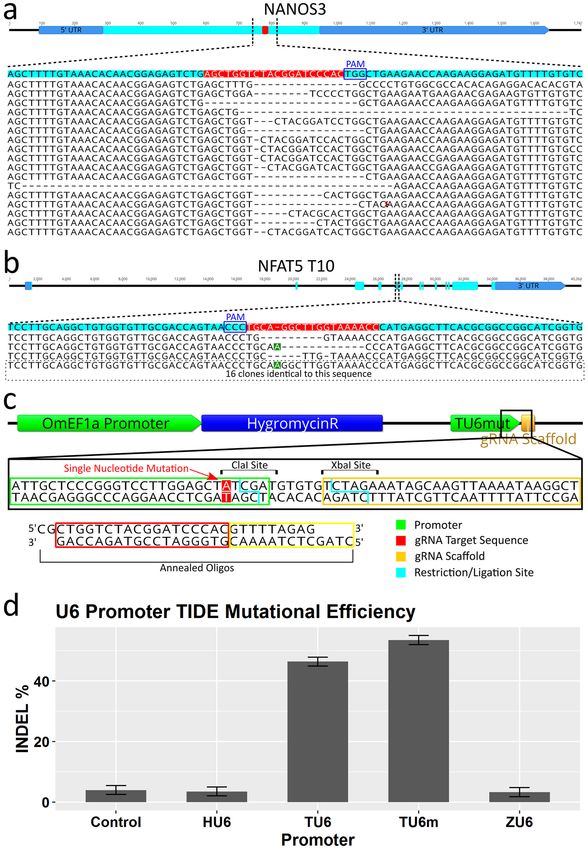
www.nature.com/scientificreports/
Figure 2. Isolation and selection of Polymerase II promoter for Cas9 expression in transposon plasmid vector.
(a) PCR isolation of O. mossambicus endogenous promoters illustrated for EF1 alpha. The PCR amplicon
spans ~ 150 bp upstream of the transcription start site, exon 1, intron 1, and part of exon 2 to the endogenous
start codon. (b) Comparison of relative expression strength of candidate promoters for Cas9 quantified by
fluorescent intensity of enhanced green fluorescent protein (EGFP). Data shown represent means ± SE (n = 2
per promoter) (c) Micrographs showing EGFP expression in OmB cells (green) from SV40, CMV, and OmEF1a
EGFP vectors representative of those used for quantitative analysis (d) Plasmid map of transposon vector
(OmEF1aCas9P2APuroSB) for generation of Cas9 cell line including OmEF1a promoter upstream of Cas9 and
puromycin resistance coding sequences (separated by the P2A self-cleaving peptide sequence) in between the
two Sleeping Beauty transposon internal terminal repeats (ITRs). Gene and vector maps were generated using
Geneious 11.0.3 (Biomatters, https://www.geneious.com). Bar plot was generated using Rstudio 1.1.456 (https://
rstudio.com). Image editing and assembly into complete figures was performed using Inkscape 0.92 (https://
www.inkscape.org).
identified regions of high identity between TU6_1 and TU6_4 (Fig. 3b) including a PSE like sequence with
60% pairwise identity to the vertebrate consensus proximal sequence element (PSE) s equence30 between posi-
tions − 46 and − 76, a SphI postoctamer homology (SPH) like sequence with 73.8% identity to the consensus
SPH element31 between positions − 233 and − 254, and a novel highly conserved sequence with 89.7% pairwise
identity between the two promoters between positions − 285 and − 314, which we named the tilapia U6 con-
sensus sequence 1 (TU6C1). Compared to the other three candidate tilapia U6 promoters, TU6_1 contained
the most identifiable known U6 regulatory elements and was selected to drive gRNA expression in an initial
pilot experiment. Using PCR, the TU6_1 (designated as TU6 from this point forward) promoter was isolated
from genomic DNA and sequenced (GenBank accession no. MT762368). The TU6 amplicon was subsequently
cloned upstream of the same IMPA1.1 T7 gRNA sequence (as a primer extension) used in the RNP experi-
ment described above (Fig. 3c). This TU6-IMPA1.1-T7 construct was then cloned into the base plasmid vector
(gRNAscaffHygroR) including the gRNA scaffold sequence a hygromycin resistance gene driven by the OmEF1a
promoter to generate the final TU6 gRNA expression vector (Fig. 3c bottom).
Mutagenesis of IMPA1.1 by CRISPR in stable Cas9‑OmB cells expressing gRNA from a tilapia
U6 promoter. The TU6 IMPA1.1 T7 gRNA vector was transfected into the presumed Cas9 expressing puro-
mycin selected OmB cells (see above) followed by hygromycin B selection for 6 days. PCR targeting 780 bp of the
Scientific Reports | (2021) 11:7854 | https://doi.org/10.1038/s41598-021-87068-3 4
Vol:.(1234567890)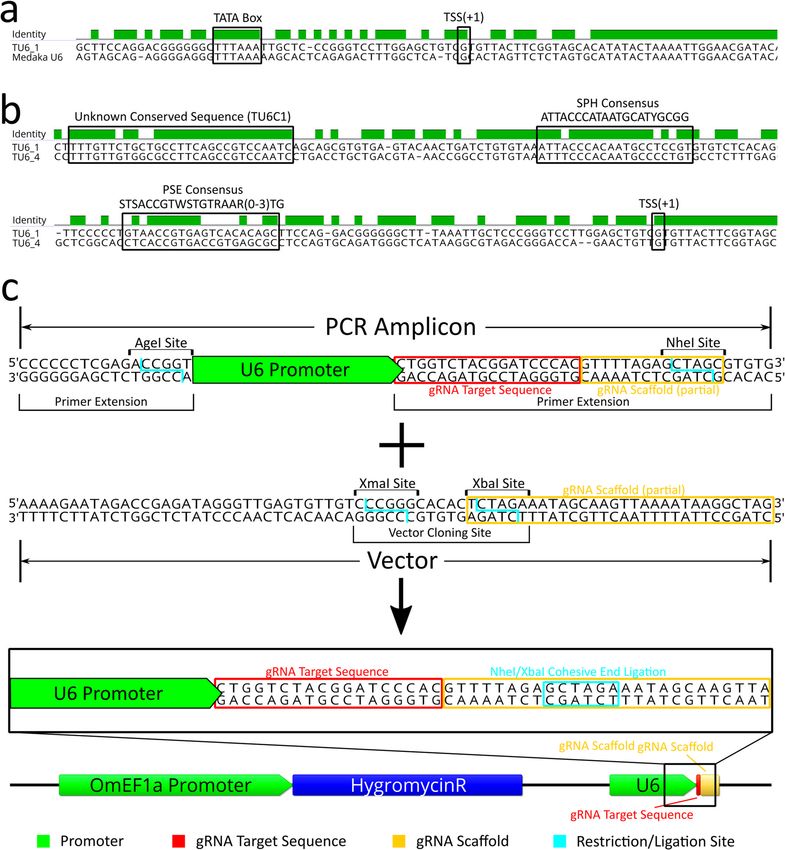
www.nature.com/scientificreports/
Figure 3. Identification/characterization of O. mossambicus U6 promoter by BLAST/sequence alignment and
cloning into gRNA expression vector. (a) Sequence alignment of the tilapia U6 and the Medaka U6 template used
to identify it by BLAST search shows a highly conserved transcribed region and the TATA Box (− 31 to − 23 from
transcription start site, TSS). (b) Sequence alignment of two candidate tilapia U6 promoters (1 and 4) identified
by BLAST searches. Presumptive important U6 regulatory elements are highlighted, including a sequences that
are similar to the vertebrate consensus PSE, vertebrate consensus SPH, and an unknown sequence that is highly
conserved in the two tilapia U6 promoters (designated as TU6C1). (c) Schematic of the initial cloning strategy used
to generate the U6 gRNA expression vectors. The base vector contains the gRNA scaffold sequence (yellow box)
in which the 9th bp was changed from a G to a T to form a XbaI restriction site. Wild-type TU6, HU6, and ZU6
cassettes were generated by PCR amplification of the U6 promoter in which an extension of the reverse primer
includes the gRNA target sequence (red box) and the 5′ thirteen bases of the gRNA scaffold modified to form a
NheI restriction site. Ligation of the amplicon into the vector by NheI/XbaI complimentary cohesive ends (blue
box) forms the complete gRNA scaffold sequence of the final vector. DNA sequence alignments, sequence images,
and vector map were generated using Geneious 11.0.3 (Biomatters, https://www.geneious.com). Image editing and
assembly into complete figures was performed using Inkscape 0.92 (https://www.inkscape.org).
Scientific Reports | (2021) 11:7854 | https://doi.org/10.1038/s41598-021-87068-3 5
Vol.:(0123456789)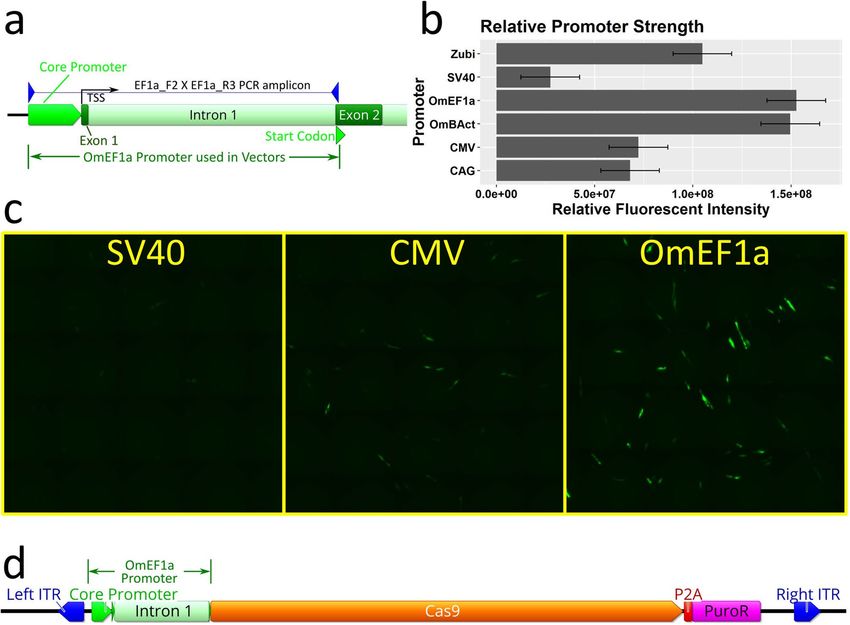
www.nature.com/scientificreports/
Figure 4. Pilot test of Cas9 expressing cells with isolation and validation of clonal Cas9 OmB cell line. (a and b) The first trial using
TU6 gRNA vector with IMPA1.1 T7 target sequence transfected into puromycin selected Cas9 expressing cells. (a) Schematic of
the PCR generated test amplicon used to evaluate mutational efficiency at the IMPA1.1 T7 target including locations of the BsrGI
restriction sites and predicted fragment lengths that would result from BsrGI digestion. (b) Agarose gels (marker sizes in bp labeled
in red) of RSM analysis on IMPA1.1 T7. Left gel consists of un-digested test amplicons from wild-type (WT UD) and T7 CRISPR
targeted (CR UD) cells. Right gel consists of BsrGI digested test amplicons from wild-type (WT D) and T7 CRISPR targeted cells
(CR D) showing residual fragment length of ~ 437 bp (red arrow) indicative of incomplete digestion of BsrGI restriction site and
alteration of the T7 target sequence by Cas9 cleavage. (c) Phase contrast image of colony formation of OmEF1aCas9P2ApuroSB vector
transfected, puromycin selected OmB cells. (d and e) Schematic of primer design for endogenous EF1 alpha control (d) and OmEF1a-
Cas9 transgene (e) verification PCR reactions of presumed Cas9-OmB cell line. (f and g) Agarose gels of PCR amplicons (marker sizes
in bp labeled in red) verifying genomic integration from genomic DNA template (f) and mRNA expression from cDNA template (g)
of Cas9. Expected EF1 alpha positive control amplicon (C) was observed from both wild-type and presumptive Cas9 OmB cells from
both DNA (1007 bp) and cDNA (176 bp) templates. Both of the two expected OmEF1a/Cas9 expression cassette amplicons (1 & 2)
were only observed from the Cas9 OmB cells from both DNA (977 bp and 1442 bp) and cDNA (146 bp and 611 bp) templates. The
gel images in this figure have been significantly cropped to conserve space and increase focus on relevant bands. Full-length gels are
presented in Supplementary Figure S1. Gene and vector maps were generated using Geneious 11.0.3 (Biomatters, https://www.genei
ous.com). Image editing and assembly into complete figures was performed using Inkscape 0.92 (https://www.inkscape.org).
Scientific Reports | (2021) 11:7854 | https://doi.org/10.1038/s41598-021-87068-3 6
Vol:.(1234567890)www.nature.com/scientificreports/
IMPA1.1 T7 targeted region was performed on DNA harvested from the remaining cells and un-treated control
cells. The PCR amplicons were subjected to RSM analysis using BsrGI with an expected band pattern of 136 bp,
301 bp, and 343 bp of fully digested amplicon (Fig. 4a). All of these bands were present in the gel resolving the
products of the BsrGI digests for both PCR amplicons (Fig. 4b). However, an additional clear band of ~ 437 bp
was present in the digest from the CRISPR treated cells representing the fragment generated if the BsrGI restric-
tion site within the gRNA target sequence (between the 136 and 301 bp fragments) is mutated, indicating partial
successful gene editing .
Generation and validation of a clonal Cas9 OmB cell line. To obtain a clonal Cas9 OmB cell line
with a more consistent phenotype and limit variability between comparisons in high-throughput downstream
studies, colonies derived from single cells plated at low density (Fig. 4c) were isolated by passage into separate
culture dishes. For the next phase of gRNA target testing, one clonal colony was selected and propagated due to
morphology and proliferation phenotypes comparable to the founder OmB cell line and maintenance of robust
puromycin resistance. To verify genomic presence and expression of the OmEF1aCas9 transgene, PCR was per-
formed on genomic DNA and cDNA obtained from both wild-type OmB cells and the candidate Cas9 OmB
clonal line. Three primer pairs were used on genomic DNA and cDNA for both cell types for a total of 12 reac-
tions. All primer pairs were designed to flank the intron of the OmEF1a promoter with common forward primer
in exon 1 of the promoter, a control reverse primer targeting the endogenous EF1 alpha exon 2 (Fig. 4d), and two
different reverse primers in the Cas9 coding sequence (Fig. 4e). Expression of the genes would be indicated by a
shorter amplicon using the same primer pairs on the cDNA from removal of the 831 bp intron between exons 1
and 2 of the OmEF1a promoter. The expected control amplicons had expected sizes of 1007 bp (endogenous EF1
alpha) and 176 bp (genomic DNA and cDNA) and were obtained for both wild type and Cas9 OmB cells. The
two transgene target amplicons for genomic DNA (977 bp and 1442 bp) and cDNA (146 bp and 611 bp) were
obtained only for the templates derived from Cas9 OmB cells verifyng both genomic integration (Fig. 4f) and
active transcription of the EF1aCas9P2A-Puro expression cassette (Fig. 4g).
Clonal Cas9‑OmB1 cells permit efficient high‑throughput in vivo testing of multiple tar‑
gets. To test the effectiveness and robustness of the clonal Cas9 OmB cell line (Cas9-OmB1), we manually
designed 14 total gRNA sequences (Table 1), all containing a restriction enzyme site overlapping the potential
Cas9 cleavage site. Of these, eight gRNAs target genes of interest included IMPA1.1 (T7, T11, T12, and T13 tar-
get sites) and nuclear factor of activated T cells 5 (NFAT5 T1, T7, T8, and T10 target sites). The other six target
genes that are all presumed to be nonessential to OmB cells including glucocorticoid receptor (NR3C1 T1 and
T2), myostatin (MSTN T1 and T2), and two genes with previously validated gRNAs for tilapia from other labs,
WT1A32 and NANOS322. Each target sequence was cloned downstream of the TU6 promoter into the gRNA
expression vector and transfected into Cas9-OmB1 cells followed by hygromycin B selection as described above.
PCR of hygromycin selected cells for gRNAs IMPA1.1 T12, NFAT5 T1, NFAT5 T7, MSTN T2, and WT1A failed
to yield an amplicon of the expected size and, therefore, these targets were excluded from further analysis (details
of RSM reactions and expected band sizes are available in Supplementary Table S2).
Gel electrophoresis of restriction digests showed that IMPA1.1 T7, all NFAT5, all NR3C1, and the NANOS3
target amplicons yielded notable undigested bands indicating modification of the restriction enzyme recognition
sequence (Fig. 5a–d). The IMPA1.1 T11 and T13 targets yielded little detectable full-length bands indicating near
complete digestion and inefficient gene targeting. Not enough substrate DNA was available for the MSTN target
to obtain clear bands and the results for this target are, thus, inclusive. Sanger sequencing was also performed
on the PCR amplicons from the treated cells and equivalent wild-type control amplicons. To obtain percent
indel mutation frequencies, chromatogram sequence files were loaded to the online quantitative assessment of
genome editing TIDE (Tracking of Indels by Decomposition) webtool. This was also performed on test PCR
amplicons from the IMPA1.1 targeting RNP treated cells (see previous section) for comparison. For the gRNA
vector treated cells only the NR3C1 T1, NR3C1 T2, IMPA1.1 T7, IMPA1.1 T11, NANOS3, and NFAT5 T10
targets yielded sufficient quality reads for analysis for which the indel % values were 77.1, 61.6, 14.1, 46.1, 65.7,
and 34.1 respectively. The indel % values obtained from the IMPA1.1 RNPs cells were 2.2, 0.9, and 0.0 for T3,
T7, and T10 respectively (Fig. 5e). Note the common target between the two approaches (IMPA1.1 T7), 14.1%
using the vector method versus 0.9% using the RNP method. The average value for gRNA vector targeted cells
(49.8%) was significantly greater than the average value from the RNP treated cells (1.03%, p value = 0.0096).
Verification of mutagenesis of NANOS3 and NFAT5 genes and characterization of indel proper‑
ties. Sequence analysis of individual mutation events was performed to confirm the observations from RSM
are due to mutations of the target sequence, obtain quantitative information on the frequency of mutation in the
form of indels (insertion or deletion of genomic sequence that occurs when a cell repairs breaks in DNA), and
obtain qualitative information on the typical mutations that can occur. NFAT5 T10 and NANOS3 PCR amplicons
from gRNA expression plasmid treated Cas9 cells were cloned into pBluescript II SK( +) vectors, transformed into
competent E. coli followed by PCR and sequencing of the plasmids from clonal bacterial colonies. For NANOS3,
21 of the 24 E. coli clones analyzed yielded a band of sufficient sequence match to be identified as the targeted
amplicon. Of these, 17 sequences showed alteration of the target site while 4 were identical to wildtype (Fig. 6a).
Most alterations were deletions ranging in size from 1 to 50 bp. For NFAT5, 19 of the 24 E. coli clones analyzed
yielded a band of sufficient sequence match to be identified as the targeted amplicon. Of these, only 3 sequences
showed alteration of the target site while 16 were identical to wildtype (Fig. 6b). Compared to the O. niloticus ref-
erence sequence, a consistent additional T nucleotide (position 5 from the gRNA scaffold in the target sequence)
Scientific Reports | (2021) 11:7854 | https://doi.org/10.1038/s41598-021-87068-3 7
Vol.:(0123456789)www.nature.com/scientificreports/
Test amplicon primers 5′ to 3′
Gene target Target sequence 5′ to 3′ Forward Reverse Size (bp)
IMPA1.1 T7 CACCACAAACTTTGTACA
GTAGCTTCATTTGACGTA
IMPA1.1 T11 AAGCAAAATGGAAGATCCA ACTCGTCGACATTGTTGCAT 867
CCTCC
IMPA1.1 T12 GGGTCTCTTAAAGAGGAATT
IMPA1.1 T13 GTGACGACGAACCCATTC TGCAGATTCCCATTTGTGGC CCCGATAGCTCAGCAACACT 705
NFAT5 T1 ATGCCTCTTCTCTGACCA
TGGCCTGCTCAACTTTTGTC AGTTGCCTCAAGGTGCTACA 1099
NFAT5 T7 TACCCCTCGTCAAAGGCC
NFAT5 T8 CTGCAGCTCTGATGAACCT ATGTACTGCAGCAAACCCCA GTGAACACAGTCCAGACCCC 708
NFAT5 T10 GGTTTTACCAAGCCTGCA CAGAGCCCAGGAATGACAGG AGGTGCAGTGTTAACTTGGGT 651
NR3C1 T1 ATAGACGGTCCAGAGCCCC
CTACACTGAAAGCCCCGAGG ATTGGTCACACTGCTGCCAT 709
NR3C1 T2 ACATCACCCAGTCCTCCA
MSTN T1 CAAATCTCCCGGCTTATAC TGAGACATGGTGTTTGGGCA CGCTTGTCCAAATGCAGGTG 858
MSTN T2 GCAAGATCCCCTCCATGG TCAGCAACCGTTCATGGAGG CAGCTGTGTTTTTCCGAGCC 938
NANOS3 GCTGGTCTACGGATCCCAC GCAAACGAACCAAAGCATGC AATTGATGCAAAACCCGCCG 466
WT1A GGGTTGCTGAACATCCTGGT CCAGAGAAGGAGCACGTCAG CCCACCACCATGATGCAGAT 549
Table 1. Target sequences, primer pairs used to generate test amplicons by PCR, and sizes of un-digested test
amplicons used in RSM analysis of diverse gRNA target testing of the Cas9-OmB1 cell line.
was detected in the O. mossambicus PCR amplicons. Therefore, the gRNA used for NFAT5 T10 had a single base
pair mismatch between the substrate genomic DNA, which likely contributed to the lower efficiency of this target.
Improved gRNA vector construction proficiency by modification of the TU6 promoter. To
facilitate more rapid and economical production of gRNA expression vectors, the TU6 promoter was modified
to accommodate direct cloning of annealed oligos containing new target sequences (Fig. 6c). This was achieved
by a single nucleotide change adjacent to the TSS generating a ClaI resitriction site. This mutated version of
the TU6 (TU6m) was included in the base vector upstream of the modified XbaI site containing gRNA scaf-
fold sequence. This resulted in reduced time and resources used to generate a gRNA vector with a new target
sequence by elimination of the PCR step used in the previous cloning strategy.
Confirmation of superiority of endogenous tilapia U6 Promoters for gRNA expression in OmB
cells. To evaluate what influence the specific U6 promoter had on the efficiency of CRISPR/Cas9 induced
gene edits in this system, the human and zebrafish U6 promoters (HU6 and ZU6 respectively) from previous
work, TU6, and TU6m from this report were cloned upstream of a common gRNA sequence (NANOS3). Cas9-
OmB1 cells were treated with the gRNA expression plasmids followed by hygromycin selection and PCR as
described previously in replicates of four for each U6 type. The control was a gRNA expression plasmid with no
target sequence or U6 transfected into Cas9 OmB cells. The NANOS3 gRNA sequence was chosen for this analy-
sis because of the high mutation rate observed in previous analysis and thus a wide dynamic range to measure
differences in mutation frequency between different promoters. This time Sanger sequencing was performed
directly on the original PCR amplicon from the treated cells. Mutation efficiencies were quantified using the
TIDE webtool33. TIDE analysis of NANOS3 target amplicon chromatograms yielded mean indel efficiencies of
3.98, 3.48, 3.27, 46.40, and 53.52 percent for the control, HU6, ZU6, TU6, and TU6m, respectively (Fig. 6d).
The TU6 and TU6m target efficiencies were significantly greater than all others (n = 4 per promoter, SE = 2.09,
α = 0.05, p value < 0.001, Tukey multiple comparison statistical analysis). The TU6m was significantly greater
than the TU6 (p value = 0.0271). The control, HU6, and ZU6 efficiencies were not statistically different from each
other (p value > 0.996) indicating no or negligible editing obtained by use of these promoters.
Discussion
In this work we developed an efficient CRISPR/Cas9 system for the OmB tilapia cell line. We identified inadequate
expression strength in OmB cells when using heterologous promoters as the cause of previous failures to achieve
detectable gene edits. The first attempt to circumvent this issue was direct transfection of gRNA/Cas9 protein
RNP complexes. Since the efficiency of RNPs was in-vitro validated, the lack of observed gene edits indicated
poor delivery using the transfection reagent method described. Due to previous success with DNA transfection
and plasmid based antibiotic selection in OmB cells, a DNA expression vector method of CRISPR/Cas9 delivery
was the most practical platform to pursue. Other factors, in addition to high transfection efficiency in OmB cells,
make DNA vectors an attractive platform to implement CRISPR/Cas9 gene targeting. Even if alternative modes
of delivery of RNPs (e.g. electroporation) elevate transfection efficiency to equal or greater than that achieved
with DNA transfection, the plasmid based delivery system has the distinct advantage of being able to select for
only the cells that have acquired all the CRISPR/Cas9 components through antibiotic/resistance gene systems,
thus compensating for any deficiencies in delivery. This approach significantly reduces the amount of clonal
screening to find the desired gene edits. It also eliminates the need for time consuming in vitro transcription or
purchase of expensive synthetic RNA or Cas9 protein.
Scientific Reports | (2021) 11:7854 | https://doi.org/10.1038/s41598-021-87068-3 8
Vol:.(1234567890)www.nature.com/scientificreports/
Figure 5. Mutation analysis from TU6 gRNA expression vector transfected Cas9 OmB cell line treated cells
testing multiple targets of different genes. (a–d) Agarose gel electrophoresis of RSM analysis of TU6 gRNA
expression vector treated Cas9-OmB1 cells targeting diverse loci (marker sizes in bp labeled in red). Except
IMPA1.1 T13 and MSTN, nearly all targets showed clear residual undigested amplicon from CRISPR treated
cells (CR) relative to equivalent digested amplicon from un-treated OmB cells (WT) indicating at least some
successful Cas9 cleavage. For each target, an un-digested control amplicon was included for reference (UD).
(a) IMPA1.1 targets T7 and T11 shared the same un-digested control (far left lane). (b) NFAT5, the two targets
regions were amplified by different primer pairs and thus have separate un-digested controls. (c) Presumed non-
essential gene control targets. Clear residual un-digested amplicon from NANOS3 target but lack of conclusive
results from MSTN target due to low quantity of DNA. (d) The NR3C1 targets T1 and T2 shared the same
un-digested control (far left lane). (e) TIDE indel analysis of amplicons from TU6 vector treated Cas9-OmB cells
and from previous IMPA1.1 targeting Cas9/gRNA RNP treated cells. Note the common target between the two
approaches (IMPA1.1 T7), 14.1% from the vector versus 0.9% from the RNP methods. Bar plot was generated
using Rstudio 1.1.456 (https://rstudio.com). Image editing and assembly into complete figures was performed
using Inkscape 0.92 (https://www.inkscape.org).
Success of the DNA vector method is dependent on sufficient promoter strength in the cell line being used.
Identification of the most appropriate Pol II promoter was initiated by evaluating a set of rational options for screen-
ing. Several viral and engineered Pol II promoter options exist such as the SV40, CMV, and CAG which are among
the most universally used promoters across diverse vertebrate taxa and have shown effective expression in fish
cells34–36, which render them reasonable options for this application. Successful CRISPR/Cas9 gene editing in fish
cells lines was reported using the CAG promoter (as part of the pX458 vector) in Grass Carp (Ctenopharyngodon
Scientific Reports | (2021) 11:7854 | https://doi.org/10.1038/s41598-021-87068-3 9
Vol.:(0123456789)www.nature.com/scientificreports/
Figure 6. CRISPR/Cas9 editing confirmation and efficiency comparisons of different U6 promoters by analysis
of NANOS3 gRNA target. (a and b) Sequencing results of individual alleles from plasmid sub-cloned test
amplicons. (a) For the NANOS3 target, 17 out of 21 amplicons (81%) were altered at the target site (4 wild-type
sequences not shown). (b) For the NFAT5 T10 target, 3 out of 19 amplicons (16%) were altered at the target site.
The remaining 16 sequences were identical to the O. niloticus reference sequence except for an extra nucleotide
(an A when reading the gene sequence 5′ to 3′, a T when reading the gRNA sequence 5′ to 3′) 5 base pairs from
the PAM sequence (highlighted in green). (c) Alternate cloning strategy for changing gRNA target sequence in
expression vector illustrated. Utilizes a mutated TU6 (TU6m) in which a single nucleotide was changed adjacent
to the TSS generating a ClaI restriction site. The TU6m is included in the base vector in which new gRNA target
sequences can be added by annealed oligos. (d) Mutational efficiency quantified by TIDE indel% analysis of four
different U6 promoters using the same gRNA target (NANOS3) showing superior editing obtained from both
versions of the tilapia U6 promoters (over fivefold over all others). The Human and Zebrafish U6 promoters
were not statistically significant from the no U6 control. Gene maps and DNA sequence images were generated
using Geneious 11.0.3 (Biomatters, https://www.geneious.com). Bar plot was generated using Rstudio version
1.1.456 (https://rstudio.com). Image editing and assembly into complete figures was performed using Inkscape
version 0.92 (https://www.inkscape.org).
Scientific Reports | (2021) 11:7854 | https://doi.org/10.1038/s41598-021-87068-3 10
Vol:.(1234567890)www.nature.com/scientificreports/
idellus) cells37 and the CMV promoter in a species salmon (CHSE) cell line23 for transient and constitutive Cas9
expression, respectively. However, the relative expression strength of these heterologous promoters in fish cells can
vary greatly with species38 and cell type39,40 and their use , thus, produces uncertain outcomes in novel cell lines.
Strong species-specific endogenous promoters such as beta-actin and EF1-alpha represent viable alterna-
tives that can equal or exceed SV40, CMV or CAG in promoting expression in some cells41. Fish beta-actin has
shown superior expression strength over conventional promoters such as CMV, for example in Fathead Min-
now (Pimephales promelas) cells42. However, the relative effectiveness of these promoters can be unpredictable
as seen in Japanese Flounder (Paralichthys olivaceus) cells, in which CMV has been reported as stronger than
endogenous beta-actin43. Also, the tilapia beta-actin promoter outperformed the equivalent carp beta-actin
promoter in reporter gene expression in tilapia c ells44, supporting species specificity as an important factor for
promoter efficiency. Considering this uncertainty of Pol II promoter function in a given fish cell type, evaluation
of potential Pol II promoters represents a prudent optimization step before investing in downstream applications.
In this study, we used fluorescent microscopic analysis of OmB cells transfected with different candidate promot-
ers driving EGFP expression vectors to assist with the Pol II promoter selection. The SV40 promoter showed
nearly negligible expression in this study. Moreover, the CMV and CAG promoters were notably, although not
significantly, weaker than the two endogenous tilapia promoters.
Another consideration, in cases of stable integration of transgenes, endogenous promoters such as EF1-alpha
are known to sustain expression longer than viral promoters such as CMV which have a tendency to be silenced
over time45. The OmEF1a promoter (1039 bp) is more compact and showed slightly higher EGFP reporter
intensity than the OmBAct promoter (1643 bp). Therefore, OmEF1a represented the strongest choice for Cas9
expression in this project. Based on these factors, the OmEF1a promoter is likely to have improved the editing
efficiency, but since the difference in promoter strength was moderate (just over two-fold greater than CMV and
CAG) it did not constitute the primary cause for the success of this system over our previous attempts.
Optimized expression of the gRNA component represented an equally valuable node to improve CRISPR/
Cas9 gene editing efficiency in fish cells. Numerous studies have demonstrated efficient CRISPR/Cas9 gene edit-
ing through the use of a human U6 promoter in mammalian c ells8,46 and at least some level of effectiveness in
phylogenetically distant cell cultures, such as c hicken47, mouse48, and even carp c ells37. However, a species-specific
U6 promoter can have significantly greater expression as seen in a study comparing human U6 to chicken U6
promoters by quantitative RT-PCR. Such a comparison revealed a four-fold greater RNA abundance in a chicken
fibroblast cell line when using the chicken U6 promoter compared to the human U6 p romoter49.
A limited number of teleost U6 promoters have been isolated and characterized for small gRNA expression in fish
cells. Confirmed expression from a pufferfish (Takifugu rubripes) U6 promoter was achieved in cell lines of different
fish species, grunt (Haemulon sciurus) and salmon (Oncorhynchus tshawytscha), and found to be more effective than
mouse U6 promoter in driving shRNA based knock-down50. Evidence supporting the expression of zebrafish U6
promoters (including the one utilized in this study) in tilapia (Oreochromis spec.) cells has been obtained by northern
blot analysis51. Our work has isolated an additional fish U6 promoter, the O. mossambicus TU6, and demonstrated its
superior effectiveness in driving sufficient gRNA expression to achieve reliable CRISPR/Cas9 gene editing in OmB cells.
Despite this wide variety in the effectiveness of different U6 promoters, a systematic comparison of phylo-
genetically diverse U6 promoters in the context of CRISPR/Cas9 gene editing had not been reported for fish
cell lines. The direct comparison of the efficiencies of candidate U6 promoters in the present study resulted in
the identification of the TU6 and TU6mut promoters as efficient tools for transcription of small RNAs in tilapia
cells. Furthermore, our systematic comparison of U6 promoter efficiencies highlights the critical importance
of a suitable polymerase III promoter for efficient gRNA expression. The lack of gene edits (indicated by TIDE
analysis) resulting from the use of gRNA expression constructs driven by HU6 and ZU6 heterologous promoters
explains the failure of our previous attempts to perform gene editing in OmB cells and establishes the U6 pro-
moter as a critical element of gene targeting systems in fish cell lines. Despite reports of interspecies U6 promoter
function, the expression levels for both the human and zebrafish U6 promoters were insufficient to achieve even
low levels of Cas9 induced gene editing in OmB cells. Collectively, our experiments demonstrate the necessity
of identification and validation of an efficient polymerase III promoter for DNA vector gRNA expression based
approaches for CRISPR/Cas9 gene targeting in a given cell line model. Our work further illustrates that phylo-
genetic proximity represents a key consideration in selecting promoters for gRNA transcription.
In addition to optimizing promoter strengths, we incorporated stable genomic integration of the Cas9 gene
into the cell line to elevate Cas9 protein levels available for gene editing at the targeted sites. This approach pro-
vides more time for Cas9 protein to accumulate and localize to the nucleus. Direct comparisons have shown supe-
rior gene editing efficiency in cells stably expressing Cas9 over transient expression of Cas9, e.g. in Drosphila52
and human53 cell lines. Stable Cas9 expression has also been reported for the very few fish cell lines that have
been successfully gene edited using CRISPR/Cas9. The first reported success of CRISPR/Cas9 in fish cell culture
was achieved using stable genomic integration of Cas9 into the Chinook Salmon Embryo (CHSE) cell l ine23 and
was subsequently used to generate a targeted gene knock-out cell l ine54.
The effectiveness of the new CRISPR/Cas9 gene editing system generated in this study was evaluated using
multiple targets and by multiple means of mutational analysis. These means included RSM, sequencing of indi-
vidual cloned amplicons and TIDE analysis of the PCR reaction Sanger sequencing reads, which provided key
information on the potential overall mutation rate and the relative frequency of specific types of mutations that
occur. The RSM analysis was used strictly for method development purposes as it was a rapid way to visually
indicate the presence or absence of mutations. However, this method limits gRNA target selection to the fraction
of candidate sequences that have a restriction site overlapping with the potential Cas9 cleavage site and provides
little information on the frequency and type of mutations.
The approach of sequencing the cloned amplicons, which can be employed on any target, provided more
quantitative data and, as seen with the NANOS3 target, indicated that a mutation efficiency of at least 81% is
Scientific Reports | (2021) 11:7854 | https://doi.org/10.1038/s41598-021-87068-3 11
Vol.:(0123456789)www.nature.com/scientificreports/
possible with our system. This number is likely an under-estimate as the amplicon was gel extracted, which biased
for fragments with lengths that are similar to that of the un-mutated wildtype while Sanger sequencing revealed
individual amplicons with large deletions of up to 50 bp. Larger deletions or insertions would have been missed
because of the bias towards expected wild-type length during gel extraction and, therefore, a subset of gene edits
may not be accounted for in the determination of overall mutation efficiency. Our results inform future studies by
demonstrating the existence of large deletions, which should be accounted for by increasing the width of bands
that are gel-extracted and prepared for Sanger sequencing in future studies. Despite possibly underestimating
gene editing efficiency in this study, the Sanger sequencing method provided a wealth of information with esti-
mates of mutation frequency and identification of specific sequence changes resulting from mutagenesis. This
approach represents the strongest confirmation of the presence and specific nature of mutations. However, it is
also the most labor intensive and not appropriate for high-throughput screening of candidate gRNAs.
TIDE mutation detection analysis represents an appropriate compromise as it can be performed on any target
using a sequencing read of a PCR amplicon directly from the genomic DNA without the need of cloning individual
mutants. The TIDE results of this study were consistent with the qualitative restriction site mutation analysis and
clonal sequencing detection results, which demonstrates that TIDE represents a reliable and high-throughput
approach to evaluate specific gRNA efficiency. With the NANOS3 target, TIDE analysis yielded a smaller mutation
estimate than the sequencing of mutant clones (~ 65.7% vs 81% respectively). This discrepancy between analyses is
important to take into consideration as the actual mutation rate in cells induced by CRISPR/Cas9 gene editing may
be higher than estimates obtained from TIDE. Further replicates are needed to see if this relationship is consistent.
Our study establishes an efficient system for generating and analyzing CRISPR/Cas9 induced mutations. This
technology can be utilized to investigate molecular mechanisms of interest and causality of gene-environment
interactions in the OmB cell model. However, despite the significant advantages of the DNA vector method
presented here, some limitations of this type of approach must be considered in the experimental design and
interpretation of results to minimize their impact. One concern associated with constitutive expression of Cas9 in
cell lines is the potential for erroneous side effects on cellular growth and phenotype that can occur from exces-
sive stress on protein production/turnover mechanisms or non-physiological interactions with sustained high
levels of a foreign protein55. Nevertheless, in our study no noticeable differences in growth or morphology were
observed between the new Cas9 OmB cell line and the parent cell line from which it was derived. It is important,
however, to include appropriate controls to account for this issue and understand the limitations of phenotype
interpretations. Follow up experiments utilizing CRISPR/Cas9 methods with less side effects to confirm results
obtained from stable Cas9 cell lines may be warranted. Despite the disadvantages, stable Cas9 cell lines have
been effectively used to identify genes responsible for specific phenotypes in other vertebrate cell lines54,56 and
are a valuable model of choice for initial high-throughput screens to identify the most suitable targets. Using this
approach, key information such as cellular phenotype and gRNA efficiency can be obtained in a high-throughput
manner to inform subsequent experiments that validate specific targets are associated with phenotypes of interest.
Prolonged expression of Cas9 and gRNAs as in this plasmid based system can also result in increased off-
target effects57. This side-effect was clearly demonstrated by the sequencing results from the NFAT5 T10 target
in which an editing efficiency of 15.7% was observed despite a single-nucleotide difference between the gRNA
and the substrate DNA. Selection of gRNA target sequences with the fewest potential off-target cleavage sites
is one way to minimize this effect. However, without in-depth analysis of whole genome sequencing, off-target
effects cannot be completely predicted or quantified. Among experimental controls that account for potential
off-target effects, using multiple target sequences on the same gene represents one way to support that effects
are limited to the targeted gene if a consistent phenotype is observed.
Direct delivery of pre-complexed gRNA/Cas9 RNPs is a preferred method to minimize side effects attributed to
the prolonged presence of active Cas9. This would be a suitable approach for development of clonal knock-out cell
lines and subsequent analysis of phenotypes associated with the manipulated locus. Although no detected edits at
the targeted loci were observed using RNPs, we only attempted one RNP delivery method and thus should not be
dismissed. Other RNP delivery methods exist including electroporation which was demonstrated as an efficient
tool in fish cells. This method achieved efficient results in Medaka (Oryzias latipes) cell lines while not relying on
species-specific promoters and circumventing inefficient RNA/protein complex transfection p rocedures24. How-
ever, this approach required electroporation, careful optimization of cell type-specific electroporation parameters
and equipment, in vitro production or purchase of gRNA, and purchase of Cas9 protein making it less practical for
low-cost, high-throughput projects. A practical workflow for the OmB cell line would be to use the vector approach
described here in high-throughput screening of candidate gRNAs for mutational efficiency and preliminary phe-
notype information. From this, gRNAs could still be selected and used with more invested RNP based CRISPR/
Cas9 gene editing in cell lines and embryos for more in-depth phenotype analyses. Electroporation or other
delivery methods may need to be explored to support efficient delivery of RNP complexes into the OmB cell line.
In summary, we report a robust, efficient, and economical approach that uses novel promoters and an expres-
sion plasmid optimized for economical and efficient screening of gRNAs and phenotypes for CRISPR/Cas9
gene targeting in fish cell lines. This approach is well-suited for high-throughput screening of targets that cause
phenotypes of interest while relying on only having to vary small, target-specific DNA oligos at very low cost.
Our approach reduces the amount of screening of cells with desired gene edits by utilizing antibiotic selection. It
requires only basic cell culture and DNA cloning methods without the need for complicated vector production
such as lentiviral systems or specialized equipment for electroporation or microinjection.
Materials and methods
Primers and oligonucleotides. All DNA primers and oligos mentioned in the materials and methods sec-
tion are listed in Table 2. Additional oligos not mentioned in the main text are listed in Supplementary Table S3.
Scientific Reports | (2021) 11:7854 | https://doi.org/10.1038/s41598-021-87068-3 12
Vol:.(1234567890)www.nature.com/scientificreports/
Name Sequence 5′ to 3′
ActinProm_F1 CCCCCGTCGACGTGAGTGACGCCGGACCAATC
ActinProm_R1 CCCCCTCTAGACCATGTCATCCCAGTTGGTCACAAT
Ef1a_F2 CCCCCGGTACCGTTGCAGGGTTTCATTCGGC
Ef1a_R3 CCCCCTCATGATTTTAGTTTCTGTGGCCAAGATT
EF1aCas9RT_F GCCGTGAAAACCCAGAAACA
EF1aCas9RT_R CGGAATTGTCGGGGTTCAGA
EF1aCas9RT_R3 AGTCGTCTGTAATCACTGCCC
EF1aX2RT_R CGGCTTCCTTCTCAAACTTC
EF1aX2RT_R2 CAGCGGCTTCCTTCTCAAAC
HU6(AgeI)_F CACACACCGGTAAGGTCGGGCAGGAAGAG
HU6_Nanos3gRNA(NheI)_R CCCCCGCTAGCTCTAAAACGTGGGATCCGTAGACCAGCGGTGTTTCGTCCTTTCCACA
Nanos3target CGCTGGTCTACGGATCCCACGTTTTAGAG
Nanos3targetCompl CTAGCTCTAAAACGTGGGATCCGTAGACCAG
TU6_1_F CTGAAGTATACTATGTGCCGAAT
TU6_1_Fb CCCCCCTCGAGACCGGTCTGAAGTATACTATGTGCCGAAT
TU6_1_R AACACGACAGCTCCAAGGAC
TU6_ClaI_XbaI_R GGGTCCTTGGAGCTATCGATGTGTGTCTAGAGTGTG
ZU6_F1 CCCCCCTCGAGACCGGTATGCGTCTTTTGTTCTGGTCATC
ZU6_Nanos3gRNA(NheI)_R CACACGCTAGCTCTAAAACGTGGGATCCGTAGACCAGCGAACCAAGAGCTGGAGGGA
Table 2. Sequences of all primers and oligos mentioned in the materials and methods.
In vitro cleavage assay and transfection with gRNA/Cas9 ribonucleoprotein complexes. Guide
RNAs were in vitro transcribed using New England Biolabs HiScribe T7 High Yield RNA Synthesis kit (cat #
E2040S) according to manufacturer’s protocol. PCR amplicons were produced using a forward primer with
the T7 promoter sequence (TAATACGACTCACTATAGG) as a 5′ extension followed by the target sequences
listed in Supplementary Table S1 and a 3′ binding region to the gRNA scaffold (GTTTTAGAGCTAGAAATA
GCAAG). Approximately 400 ng gRNAs were complexed with 500 ng PNA Bio Cas9 protein (cat # CP01-50)
and incubated with 100 ng of a 1392 bp test amplicon produced using IMPA1RegStart_F and IMPA1X1RAR
primers. Four selected RNPs (2.5 µg Cas9/1.2 µg gRNA) were transfected into 35 mm wells of 90% confluent
OmB cells (one 6-well plate well per target) using Invitrogen Lipofectamine CRISPRMAX transfection reagent
system (ref #MAX00001) according to manufacturer’s protocol. Genomic DNA was harvested 5 days post trans-
fection using Invitrogen Purelink Genomic DNA Mini Kit (cat # K1820-01). Test amplicons and expected cleav-
age products (by either Cas9 or restriction enzyme) for in vitro cleavage assay, RSM, and TIDE analysis were
PCR amplified using primers listed in Supplementary Table S1.
EGFP fluorescence microscope evaluation of promoter strength. The endogenous O. mossam-
bicus promoters were PCR amplified from genomic DNA using ActinProm_F1 and ActinProm_R1 primers
(modeled after those used in Hwang et al.44 for original isolation of the equivalent promoter in O. niloticus) for
OmBAct and EF1a_F2 and EF1a_R3 primers for OmEF1a. The CAG, CMV, SV40, and Zubi promoters were
obtained from pSpCas9(BB)-2A-Puro (Addgene # 48139), pCS2-nCas9n (Addgene # 47929), pBABE-hygro-
hTERT (Addgene # 1773), and pENTR5′_ubi:loxP-EGFP-loxP (Addgene #27322) plasmids, respectively. Pro-
spective polymerase II promoters were cloned into the base EGFP expression vector (EGFP_SV40PA, See Sup-
plementary Fig. S2) using standard restriction enzyme cloning techniques. The constructs were transfected into
separate wells of a 12-well plate. A tile scan of the center 10% of each well was imaged after 18 h with a Leica
DMi8 microscope using the GFP filter cube and an exposure time of 250 ms. LASX software (Leica) was used to
calculate fluorescent intensity per cell.
Selection of gRNA target sequences. Sequences were manually designed to be within exons in the 5
prime half of the coding sequence but 3 prime of the start codon by scanning specific annotated genes of the
O. niloticus reference genome (taxid: 8128). For all gRNAs beyond the RNP experiment, only candidate target
sequences containing a restriction enzyme recognition site overlapping the predicted Cas9 cleavage site were
selected to facilitate an additional downstream analysis of Cas9 target cleavage.
Identification of O. mossambicus U6 promoter. NCBI nucleotide blast searches using known fish U6
promoters, including approximately 100 bp of the transcribed region, were performed against the O. niloticus
reference genome to identify candidate tilapia U6 genes. The query fish promoters included Medaka (geneID
LOC111948268), Fugu (geneID LOC115246710) from Zenke and K im50 and zebrafish U6-2 (described in Boo-
nanuntanasarn et al.58). Sequence alignments using Geneious 11.0.3 (Biomatters, https://www.geneious.com) of
the known U6 genes against the candidate tilapia U6 genes and the candidate tilapia U6 genes against each other
Scientific Reports | (2021) 11:7854 | https://doi.org/10.1038/s41598-021-87068-3 13
Vol.:(0123456789)You can also read