Arctic glaciers and ice caps through the Holocene: a circumpolar synthesis of lake-based reconstructions - CP
←
→
Page content transcription
If your browser does not render page correctly, please read the page content below
Clim. Past, 18, 579–606, 2022
https://doi.org/10.5194/cp-18-579-2022
© Author(s) 2022. This work is distributed under
the Creative Commons Attribution 4.0 License.

Arctic glaciers and ice caps through the Holocene:
a circumpolar synthesis of lake-based reconstructions
Laura J. Larocca and Yarrow Axford
Department of Earth and Planetary Sciences, Northwestern University, 2145 Sheridan Road, Evanston, IL 60208, USA

Correspondence: Laura J. Larocca (lauralarocca2021@u.northwestern.edu)

Received: 16 July 2021 – Discussion started: 2 August 2021
Revised: 25 January 2022 – Accepted: 27 February 2022 – Published: 30 March 2022

Abstract. The recent retreat of nearly all glaciers and ice      as topography and to other climatic forcings and feedback
caps (GICs) located in Arctic regions is one of the most         mechanisms, perhaps driving periods of increased regional
clear and visible signs of ongoing climate change. This pa-      cooling. Today, the direction of orbital forcing continues to
per synthesizes published records of Holocene GIC fluctu-        favor GIC expansion; however, the rapid retreat of nearly all
ations from lake archives, placing their recent retreat into a   Arctic GICs underscores the current dominance of anthro-
longer-term context. Our compilation includes 66 lake-based      pogenic forcing on GIC mass balance. Our review finds that
GIC records (plus one non-lake-based record from the Rus-        in the first half of the Holocene, most of the Arctic’s small
sian Arctic) from seven Arctic regions: Alaska, Baffin Island    GICs became significantly reduced or melted away com-
in northeastern Canada, Greenland, Iceland, the Scandina-        pletely in response to summer temperatures that, on average,
vian peninsula, Svalbard, and the Russian high Arctic. For       were only moderately warmer than today. In comparison, fu-
each region and for the full Arctic, we summarize evidence       ture projections of temperature change in the Arctic far ex-
for when GICs were smaller than today or absent altogether,      ceed estimated early Holocene values in most locations, por-
indicating warmer-than-present summers, and evidence for         tending the eventual loss of most of the Arctic’s small GICs.
when GICs regrew in lake catchments, indicating summer
cooling. Consistent with orbitally driven high boreal sum-
mer insolation in the early Holocene, the full Arctic com-
pilation suggests that the majority (50 % or more) of studied    1   Introduction
GICs were smaller than present or absent by ∼ 10 ka. We find
the highest percentage (> 90 %) of Arctic GICs smaller than      Globally, mass loss from glaciers and ice caps (GICs) is
present or absent in the middle Holocene at ∼ 7–6 ka, proba-     accelerating (Hugonnet et al., 2021). Between 2000 and
bly reflecting more spatially ubiquitous and consistent sum-     2019, GICs worldwide lost a mass of 267 ± 16 Gt yr−1 ,
mer warmth during this period than in the early Holocene.        which is equivalent to 21 ± 3 % of the observed sea-level rise
Following this interval of widespread warmth, our compi-         (Hugonnet et al., 2021). Notably, the roughly 50 000 GICs
lation shows that GICs across the Arctic began to regrow         located in Arctic regions accounted for ∼ 70 % of this recent
and summers began to cool by ∼ 6 ka. Together, the Arctic        loss (Hugonnet et al., 2021, Table 1; Vaughan et al., 2013).
records also suggest two periods of enhanced GIC growth in       By the end of the century, mean surface air temperature in
the middle to late Holocene from ∼ 4.5–3 and after ∼ 2 ka.       the Arctic is expected to warm by 2.2–8.3 ◦ C – a rate that
The regional records show variability in the timing of GIC re-   is amplified relative to the global mean (Collins et al., 2013,
growth within and between regions, suggesting that the Arc-      temperature anomalies relative to the 1986–2005 reference
tic did not cool synchronously despite the smooth and hemi-      period). Accordingly, regionally differentiated global-scale
spherically symmetric decline in Northern Hemisphere sum-        projections of GIC mass change find Arctic GICs to be the
mer insolation. In agreement with other studies, this implies    largest contributors to forecasted global ice volume loss by
a combined response to glacier-specific characteristics such     2100 (Radić and Hock, 2011; Radić et al., 2014). The con-
                                                                 tinued wastage of Arctic GICs is expected to have a myriad

Published by Copernicus Publications on behalf of the European Geosciences Union.
580                                 L. J. Larocca and Y. Axford: An Arctic synthesis of Holocene lake-based glacier records

of sociocultural and economic ramifications for Arctic com-           Recent observations have confirmed that GICs respond
munities, including major alterations to hydrological sys-         sensitively and quickly on decadal timescales, primarily to
tems at a local scale, potentially affecting water availability,   changes in summer temperature and, to a lesser extent, ac-
quality, and downstream aquatic ecosystems (Huntington et          cumulation season precipitation (Oerlemans, 2005; Koerner,
al., 2019; IPCC, 2007).                                            2005; Bjørk et al., 2012). Sediment records from glacial lakes
   The current and projected rapid changes to the Arctic           offer invaluable continuous archives of GIC variations over
cryosphere are even more striking when considered within           the Holocene, recording their presence and absence on the
a longer-term context (e.g., Kaufman et al., 2009; Fisher          landscape and in some cases more subtle variations in GIC
et al., 2012; Miller et al., 2013). GIC fluctuations over the      size over time. Records of GIC fluctuations from lake sedi-
Holocene have been reconstructed using a mix of discontin-         ments can be considered a relatively straightforward qualita-
uous and continuous proxies including the mapping and dat-         tive proxy for summer temperature. GICs’ exceptional sen-
ing of glacial moraines, lichenometry and tree ring records,       sitivity to modest summer temperature changes make their
and proglacial lake and speleothem records (Solomina et            individual archives important indicators of regional climate
al., 2015). Overall, these records indicate that many Arctic       and their combined archives an important gauge of broad,
GICs were small or had completely melted away in the early         large-scale climate trends through the Holocene (Kelly and
to middle Holocene in response to orbitally forced summer          Lowell, 2009; Solomina et al., 2015). Here, we synthesize
warmth in the Northern Hemisphere (Solomina et al., 2015).         published lake-based GIC records (n = 66, plus one non-
These records also show that many of the GICs melting away         lake-based record from Franz Josef Land, included due to a
today reformed during the middle to late Holocene as sum-          dearth of records from the Russian Arctic) to assess regional-
mer temperature cooled from the insolation-driven Holocene         and Arctic-scale summer temperature trends through the
maximum (McKay et al., 2018; Solomina et al., 2015). Re-           Holocene. Our review covers seven geographical regions
cent anthropogenically driven warming has sharply reversed         above 58◦ N from which such records are available: Alaska,
this long-term, insolation-driven, cooling trend and GIC ex-       Baffin Island (Canada), Greenland, Iceland, the Scandina-
pansion, and it is expected to cut short the life spans of Arc-    vian peninsula, Svalbard, and the Russian high Arctic. For
tic GICs that in many cases have existed for several thousand      each region, we summarize evidence for when GICs were
years.                                                             smaller than today or absent altogether, documenting the
   While relatively widely studied, many questions linger          timing of warmer-than-present summer conditions. In addi-
about Holocene climate. Globally, climate simulations and          tion, we summarize evidence of GIC regrowth in lake catch-
proxy reconstructions fundamentally disagree on the over-          ments, documenting summer cooling and, specifically, when
all direction of mean annual temperature trends through the        equilibrium-line altitudes (ELAs) first lowered to intersect
Holocene, a significant data–model discrepancy coined the          the local topography.
Holocene temperature conundrum (Liu et al., 2014). Further-           Our review focuses on the following questions. (1) What
more, to date, there have been few published multi-proxy           are the regional and broad Arctic trends in Holocene GIC
syntheses of Holocene climate specific to the Arctic, and          fluctuations gleaned from lake-based records? (2) When do
most have been focused on sub-regions or narrower time pe-         lake-based GIC records indicate (a minimum bound on) the
riods (e.g., Kaufman et al., 2004, 2009; Kaplan and Wolfe,         onset of warmer-than-present summers in each region and
2006; Briner et al., 2016; McKay et al., 2018; Axford et           Arctic-wide? (3) When do lake-based GIC records indicate
al., 2021). Although chiefly driven by symmetrical orbital         the subsequent onset of GIC regrowth, and by inference sum-
forcing, synthesis studies of temperature-sensitive proxy data     mer cooling, in each region and Arctic-wide?
suggest that the timing and magnitude of the Holocene Ther-
mal Maximum (HTM) were spatially and temporally asym-
metrical across the Arctic (e.g., Kaufman et al., 2004; Ka-        2   Data and approach
plan and Wolfe, 2006; Briner et al., 2016). Likewise, the
onset and rate of summer cooling in the Arctic in the mid-         Arctic regions host roughly 50 000 GICs that account for
dle to late Holocene did not occur concomitantly (McKay            nearly 60 % of the global total glacierized area (Vaughan
et al., 2018). These syntheses reaffirm the notion that the        et al., 2013, Table 4.2). Very few extant GICs have multi-
Arctic does not behave as a distinct climatological unit and       decadal in situ mass balance measurements (Zemp et
that the climatic responses to insolation and other forcings       al., 2009). Similarly, prior to historical time, knowledge of
through the Holocene were complex (McKay et al., 2018).            Holocene GIC fluctuations is sparse, partly because recent
An improved understanding of the regional and Arctic-wide          advances have erased much of the geomorphic evidence of
patterns of multi-millennial Holocene temperature changes          their earlier histories. However, glacial lake records offer
may elucidate the driving factors that control regional cli-       valuable insight into past GIC variations and their sensitiv-
mates and thus help anticipate the local-scale consequences        ity to climate changes. We compiled all published Holocene
of future Arctic warming.                                          lake-based GIC records from the Arctic, which we define
                                                                   as land area above 58◦ N. The records report local GIC

Clim. Past, 18, 579–606, 2022                                                         https://doi.org/10.5194/cp-18-579-2022
L. J. Larocca and Y. Axford: An Arctic synthesis of Holocene lake-based glacier records                                       581

fluctuations through the Holocene reconstructed via analy-         than present) in the early to middle Holocene and when the
sis of lacustrine sediments from downstream glacial lakes          lake subsequently became glacially influenced again (indi-
(e.g., Karlén, 1976, 1981; Leonard, 1985, 1986; Karlén and         cating GIC regrowth and summer cooling) in the middle to
Matthews, 1992). Erosion at the ice–bed interface produces         late Holocene.
rock flour, which is transported to downstream lakes via              The interpretation of individual glacial lake records is de-
proglacial meltwater streams (Dahl et al., 2003). Typically,       pendent upon the configuration of glaciers within the catch-
several geochemical and physical properties of sediment are        ments. In our review, we identified three common glacier–
measured (e.g., magnetic susceptibility, major element abun-       lake systems (Fig. 2). In some studies chains of proglacial
dance, grain size, color, organic matter content, and dry bulk     lakes are used instead of a singular downstream lake. The
density) and used to distinguish glacial and non-glacial sed-      most common system (glacier–lake system 1; Fig. 2, left
iments, as well as to infer glacier activity over time. In         panel) allows for continuous reconstruction of GIC fluctua-
general, intervals dominated by minerogenic, fine-grained          tions over time, including GIC presence, absence, and poten-
(sandy and/or silty clay) sediment are interpreted as reflective   tially more subtle variations in size. Sediment records from
of glacier presence in a lake catchment, whereas intervals in      glacier–lake systems 2 and 3 are considered threshold “on–
which the sediment is higher in organic material (gyttja) are      off” type records wherein the glacier or ice cap must breach
interpreted as periods when the glacier was reduced in size        a topographic boundary to input glacial sediments into the
relative to today or no glacier in the catchment. In some stud-    lake. In glacier–lake system 2 (Fig. 2, middle panel), the
ies, sediments from nearby non-glacial control lakes are also      present-day glacier is behind the topographic boundary and
analyzed to clarify the glacial signal (Dahl et al., 2003). We     glacial sediments will only be deposited when the glacier
interpret periods in which GICs are reported as smaller than       was larger than present. Thus, organic-rich sediment deposi-
present or absent altogether as indicative of summer temper-       tion can be indicative of a glacier at present-day size, smaller
atures warmer than present. In addition, we suggest that the       than present, or absent altogether. Additional evidence be-
lake-based GIC evidence presented here represents a mini-          yond the lake record is needed to distinguish between these
mum bound on the onset of warmer-than-present summers              three glacier states. Finally, in glacier–lake system 3 (Fig. 2,
for several reasons. First, many of the lake records do not ex-    right panel), the present-day glacier is within the lake catch-
tend through the entire Holocene, are limited by the record’s      ment, beyond a topographic boundary, and presently inputs
length, and may not contain the onset of warmth. For in-           glacial sediments to the lake. In this case, organic-rich sed-
stance, GIC absence from the start of a lake record can only       iment deposition can be indicative of a glacier smaller than
place a minimum bound on the onset of warmer-than-present          present (and outside the lake’s watershed) or absent. Again,
conditions. Second, although relatively quick to respond, it       additional evidence is needed to distinguish between these
takes some time for GICs to adjust and reach equilibrium or        two glacier states.
to melt away completely following a shift in climate.                 All ages that delimit GIC fluctuations are stated from the
   In total we compiled 66 lake-based records of Holocene          original publications, including original calibrations and any
GIC variations from seven regions: Alaska (n = 6), Baffin          marine reservoir corrections, and are reported as thousands
Island in northeastern Canada (n = 5), Greenland (n = 22),         of years before 1950 CE (i.e., ka). Uncalibrated 14 C ages
Iceland (n = 5), the Scandinavian peninsula (n = 20), Sval-        in original publications were calibrated and reported here
bard (n = 7), and the Russian high Arctic (n = 2) (Fig. 1).        as the median probability using CALIB version 8.2 and the
We excluded ambiguous records (that do not clearly define          IntCal20 calibration curve (Reimer et al., 2020; Stuiver et
when GICs were smaller than present or absent or when              al., 2021) for terrestrial samples and the Marine20 calibra-
they regrew) and records with poor age control and included        tion curve (Heaton et al., 2020) for marine samples. We sub-
one non-lake-based study from the Russian Arctic (due to           divide the Holocene with the early, middle, and late Holocene
the dearth of published glacial lake records there). We note       beginning at 11.7, 8.2, and 4.2 ka, respectively. To represent
that roughly two-thirds of the available lake-based records        the lake-based evidence we took a binary approach and de-
are from Greenland and Scandinavia, while other regions            fined GIC status in 100-year intervals from 12–0 ka: 0 is
(notably the Russian Arctic, Canadian Arctic, and Alaska)          glacially influenced, and 1 indicates a smaller-than-present
have less coverage. We used regional divisions defined by          or absent glacier or ice cap. A small subset of the origi-
the Randolph Glacier Inventory (RGI6.0; RGI Consortium,            nal published studies reconstruct more nuanced information
2017) but considered the Ural Mountains area to be part of         on glacier variations (such as when GICs were larger than
the Russian Arctic (the Ural Mountains area is defined as          present or their equilibrium-line altitude – ELA – over time);
part of North Asia in RGI6.0). We also note that in Canada,        however, to summarize across all records, we use the most
all available lake-based records appropriate for our synthe-       common and robust evidence: glacier presence versus ab-
sis are located within the region defined as Arctic Canada         sence (or smaller than present) in each watershed. We cal-
South in the RGI. For each lake record we documented when          culated the percent of GICs that were absent or smaller than
GICs were smaller than present or had melted away com-             present in 100-year intervals from 12–0 ka for each region
pletely (indicating that summer temperatures were warmer           and Arctic-wide (Figs. 3–10). Given that the resolutions of

https://doi.org/10.5194/cp-18-579-2022                                                           Clim. Past, 18, 579–606, 2022

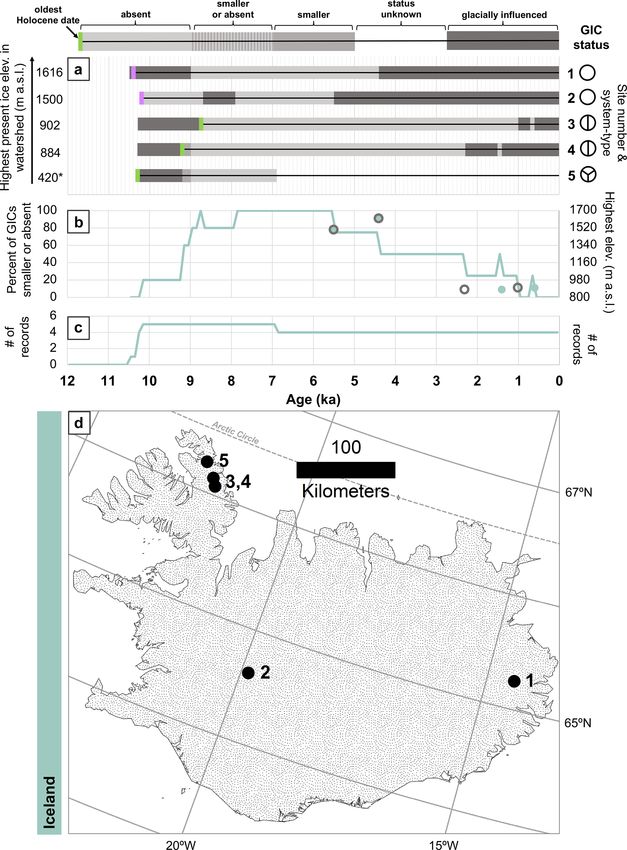
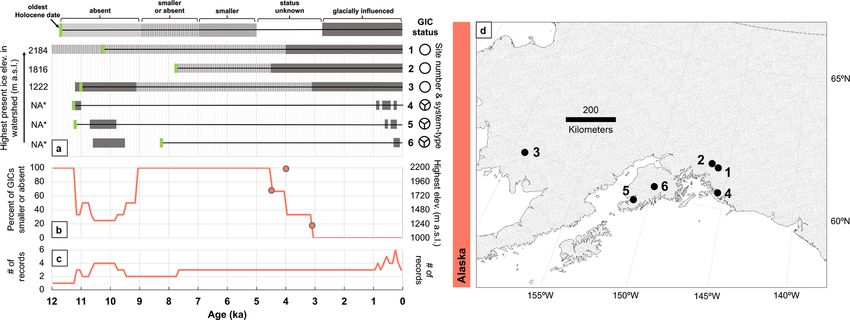
582                                  L. J. Larocca and Y. Axford: An Arctic synthesis of Holocene lake-based glacier records

Figure 1. Map of Holocene lake-based GIC records used in this study. From west to east are 1. Alaska (n = 6), 2. Arctic Canada (Baffin
Island, northeastern Canada; n = 5), 3. Greenland (n = 22), 4. Iceland (n = 5), 5. Scandinavia (n = 20), 6. Svalbard (n = 6), and 7. the
Russian Arctic (n = 2, plus one non-lake record). Gray polygons show areas with no lake-based GIC records. For a list of included studies,
see Table S1 in the Supplement.

the chronologies are typically greater than the response time          Global Land Ice Measurements from Space (GLIMS) dataset
of a small mountain glacier or ice cap to a climate pertur-            (Raup et al., 2007), and the ArcticDEM 32 m resolution mo-
bation, we follow Solomina et al. (2015) and do not ad-                saic product (Porter et al., 2018) was used to derive all eleva-
just for GIC response time as it can be considered negli-              tion measurements.
gible relative to the uncertainty of most reported ages. We
round the timing of all reported GIC evidence to the near-
est 100-year interval in our analyses. In addition to docu-            3     Regional and circumpolar compilations of
menting the timing of GIC variations, and to further investi-                Holocene GIC records
gate geographic patterns and controls of glacier fluctuations,
we measured GIC elevation and the approximate steady-state             3.1    Alaska
ELA using geospatial methods for each study location. For              Alaska is located in northwestern North America and is
the ELA estimates, we utilized a toolbox developed for au-             bounded by the Gulf of Alaska to the south, the Bering Sea
tomated calculation of GIC ELAs (Pellitero et al., 2015). We           to the west, and the Arctic Ocean to the north. The climate
used the accumulation–area ratio method (AAR) with an as-              of Alaska varies from maritime along the southern coast,
sumed AAR value of 0.67 (a common value for high-latitude              to transitional–continental in the interior, and Arctic in the
mountain glaciers in equilibrium) (Gross et al., 1976; Braith-         north. GICs cover about 75 000 km2 , or ∼ 5 % of Alaska
waite and Muller, 1980). We note that the current extents              (Calkin, 1988). The most extensive ice complexes are in the
of the GICs are likely not in equilibrium with present cli-            south along the margins peripheral to the Gulf of Alaska,
mate, and thus the actual ELA is likely higher in elevation in         the main source of precipitation to the region (Calkin, 1988;
most cases. Present-day GIC extents were derived from the              Kaufman and Manley, 2004; Barclay et al., 2009).

Clim. Past, 18, 579–606, 2022                                                               https://doi.org/10.5194/cp-18-579-2022
L. J. Larocca and Y. Axford: An Arctic synthesis of Holocene lake-based glacier records                                                   583

Figure 2. Schematic of common glacier–lake systems and resulting lake sediment stratigraphies. Left panel: the entire glacier resides
within the lake’s catchment and glacial meltwater enters the lake at present. Lake sediment records glacier presence (A: fine-grained, gray
minerogenic-rich sediment), absence (C: brown organic-rich sediment), and potentially more subtle variations in glacier size over time (e.g.,
B: an intermediate sediment type). Middle and right panels: classic “threshold lake” settings in which overtopping of and/or retreat behind a
topographic threshold creates an “on–off” signal. In system type 2, the glacier is not currently in the lake’s catchment and glacial meltwater
does not enter the lake at present. Lake sediments can record when the glacier was larger than present and crossed the topographic threshold
(B: fine-grained, gray minerogenic-rich sediment), as well as when the glacier was at its present-day size, smaller, or absent and thus behind
the topographic threshold (A and C: brown organic-rich sediment). In this setting, whether a glacier was at present-day size (2A), smaller
than present, or absent (2C) may be indistinguishable from the sediment record. In system type 3, glacial meltwater enters the lake at present.
Lake sediments record glacier presence at present-day size (A: fine-grained, gray minerogenic-rich sediment) and when the glacier was either
absent or smaller than present and retracted behind the topographic threshold or exited the lake’s watershed (B and C: brown organic-rich
sediment). In this setting, retracted glacier size (3B) may be indistinguishable in the lake sediment record from glacier absence (3C).

   Six lake-based Holocene GIC records are available from                 ter from Sheridan Glacier entered the lake between roughly
south–central and southwestern Alaska (Fig. 3). McKay and                 ∼ 11.2 and 11, at ∼ 0.8, from ∼ 0.7–0.4, and from ∼ 0.3–
Kaufman (2009) present two lake records in the Chugach                    0.2 ka (Zander et al., 2013). In southern Alaska, in the Kenai
Mountains area in south–central Alaska (Fig. 3, records 1 and             Mountains, a record from Emerald Lake indicates that Grew-
2). The record from Greyling Lake (Fig. 3, record 1) suggests             ingk Glacier overtopped the topographic divide and deliv-
general warmth, diminished, if not entirely ablated, glaciers             ered glacial sediments to the lake between ∼ 10.7 and 9.8 ka
between ∼ 12.2 and 4 ka, and glacier regrowth in the catch-               and from ∼ 0.6–0.2 ka, except for between ∼ 0.5 and 0.4 ka
ment at ∼ 4 ka (McKay and Kaufman, 2009). The record                      when organic-rich sediment was deposited, indicating that
from Hallet Lake (Fig. 3, record 2) suggests smaller-than-                the glacier was behind the divide for a short time (LaBrecque
present or absent glaciers from at least ∼ 7.8 ka (the base of            and Kaufman, 2016; Fig. 3, record 5). Finally, a record from
the core) and glacier regrowth at ∼ 4.5 ka (McKay and Kauf-               Goat Lake suggests that North Goat Glacier thickened to the
man, 2009). In the northeastern Ahklun Mountains in south-                threshold of the basin and discharged meltwater directly into
western Alaska, a record from Waskey Lake (Fig. 3, record 3)              the lake from ∼ 10.6 to 9.5 ka and between ∼ 0.3 and 0.1 ka
indicates that glaciers lingered until ∼ 9.1 ka, perhaps un-              (Daigle and Kaufman, 2009; Fig. 3, record 6).
der conditions of abundant winter accumulation (Levy et                      In summary, GICs first became smaller or absent alto-
al., 2004). Between ∼ 9.1 and 3.1 ka glaciers were less ex-               gether in Alaska between ∼ 12.2 and 7.8 ka. Combined, the
tensive than present and may have melted away entirely.                   available lake-based records from Alaska suggest that 100 %
Glaciers were reactivated and increased their meltwater dis-              of GICs were smaller than present or absent between ∼ 12
charge into the lake at ∼ 3.1 ka (Levy et al., 2004).                     and 11.2 ka (one record) and between ∼ 9.1 and 4.5 ka. GICs
   The following three records are from threshold lakes that              regrew between ∼ 4.5 and 3.1 ka. A review of Holocene
do not receive glacial meltwater at present, so glacial meltwa-           glacier fluctuations in Alaska suggests that land-based GICs
ter input is indicative of glaciers more extensive than today.            were retracted during the early to middle Holocene and that
Zander et al. (2013) present a Holocene record of Sheridan                neoglaciation began in some areas by ∼ 4 ka, with more ma-
Glacier from Cabin Lake at the base of the Chugach Moun-                  jor advances by ∼ 3 ka (Barclay et al., 2009).
tains (Fig. 3, record 4). The record indicates that meltwa-

https://doi.org/10.5194/cp-18-579-2022                                                                    Clim. Past, 18, 579–606, 2022
584                                   L. J. Larocca and Y. Axford: An Arctic synthesis of Holocene lake-based glacier records

Figure 3. Holocene lake-based GIC records from Alaska. (a) Shaded bars show a schematic view of GIC fluctuations reconstructed from lake
sediments between 12 and 0 ka. Dark gray bars denote glacially influenced sediment, medium gray bars denote GICs smaller than present but
not absent, and light gray bars denote GIC absence. Striped bars denote GICs smaller than present or absent (where these two states cannot be
distinguished from one another), and blank sections denote times when glacier or ice cap status is unknown or unclear. Colored bars indicate
the oldest reported Holocene age in each record (green: 14 C-dated plant or aquatic macrofossil, yellow: paleomagnetic secular variation –
PSV, blue: 14 C-dated marine macrofossil, pink: bulk sediment, purple: tephra, black: other). Values on the left show each watershed’s highest
present ice elevation in meters above sea level (m a.s.l.). (b) The line shows the percent of this region’s studied GICs smaller than present
or absent from 12 to 0 ka. Open dots show the timing of earliest GIC regrowth and solid dots the timing of sustained GIC regrowth in the
middle to late Holocene versus each watershed’s highest present ice elevation. (c) The number of records from this region from 12 to 0 ka and
(d) study locations. Sites are as follows: 1. McKay and Kaufman (2009) (Greyling Lake, unnamed glaciers); 2. McKay and Kaufman (2009)
(Hallet Lake, unnamed glaciers); 3. Levy et al. (2004) (Waskey Lake, unnamed glaciers); 4. Zander et al. (2013) (Cabin Lake, Sheridan
Glacier); 5. LaBrecque and Kaufman (2016) (Emerald Lake, Grewingk Glacier); 6. Daigle and Kaufman (2009) (Goat Lake, North Goat
Glacier). We note that the oldest radiocarbon age from Greyling Lake is pre-Holocene. We report the oldest Holocene age. ∗ Lake records 4,
5, and 6 are considered threshold records and do not receive glacial meltwater at present. Thus, the non-glacial–glacial transitions may not
precisely represent the timing of the glacier’s response to climate forcings.

3.2   Arctic Canada (Baffin Island, northeastern Canada)                 al. (2010) present Holocene records from two proglacial
                                                                         lakes (Longspur and Big Round lakes; Fig. 4, records 1
The Canadian Arctic Archipelago lies north of Canada’s con-              and 3) and two threshold lakes (Yougloo and Igloo Door
tinental mainland and is bounded in the east by Baffin Bay               lakes; Fig. 4, records 4 and 5). The Big Round Lake record
and the Davis Strait and in the north by the Arctic Ocean.               (Fig. 4, record 3) suggests that Kuuktannaq Glacier was
The climate of the archipelago’s largest island, Baffin Island,          present in the lake’s catchment from at least ∼ 10–6 ka and
is influenced by the interplay between the cold, low-salinity            from ∼ 2 ka to the present. Minimum glacier extent is re-
Baffin Current running south along the western side of Baf-              ported between ∼ 6 and 2 ka (Thomas et al., 2010). The
fin Bay and the relatively warm subarctic waters of the West             record from Igloo Door Lake (Fig. 4, record 5) suggests that
Greenland Current, which transport heat to the Baffin Bay                Kuuktannaq Glacier did not cross the topographic threshold,
region, affecting sea-ice conditions and terrestrial climate.            causing silt-laden glacial meltwater to be diverted into the
Mean annual temperatures range from −15 ◦ C in northern                  lake basin, until ∼ 1.1 ka. Similarly, the Yougloo Lake record
Baffin Island to −5 ◦ C in the south, while mean July tempera-           (Fig. 4, record 4) suggests very little glacial input through-
tures are ∼ 4 ◦ C in coastal areas and generally warmer inland           out the Holocene, until Kuuktannaq Glacier advanced across
(ESWG, 1995). Precipitation is generally ∼ 200–300 mm an-                a topographic threshold sometime after ∼ 1.7 ka (Thomas
nually (ESWG, 1995). The island currently hosts the Barnes               et al., 2010). Thus, the late Holocene advance of Kuuktan-
Ice Cap in central Baffin Island and Penny Ice Cap, located              naq Glacier was the most extensive since at least ∼ 10.2–
∼ 300 km south (both remnants of the Laurentide Ice Sheet),              10.1 ka (the basal ages from Yougloo and Igloo Door lakes).
as well as numerous small mountain GICs located along the                Finally, the record from proglacial lake, Longspur (Fig. 4,
eastern mountains.                                                       record 1), which at present receives meltwater from five
   Five lake-based records of Holocene GIC variability are               glaciers that terminate 1 km or less from the lake, suggests
available from Arctic Canada, all of which are located on                minerogenic sediment input throughout the Holocene, im-
Baffin Island. On northeastern Baffin Island, Thomas et

Clim. Past, 18, 579–606, 2022                                                                  https://doi.org/10.5194/cp-18-579-2022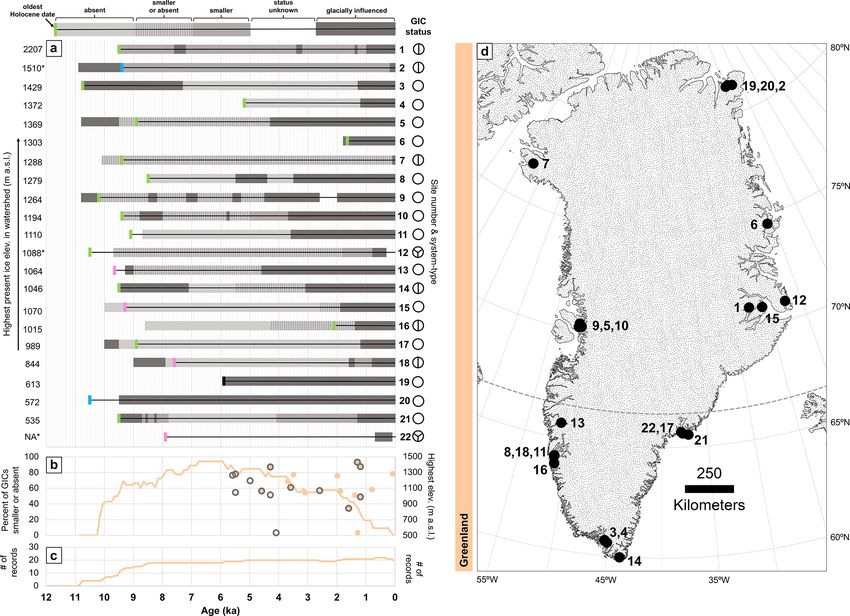
L. J. Larocca and Y. Axford: An Arctic synthesis of Holocene lake-based glacier records                                            585

plying that alpine glaciers persisted from at least ∼ 9.2 ka
(based on the age model from the shallow core site) (Thomas
et al., 2010). If or when the glaciers were smaller is not
reported. On Cumberland Peninsula, the easternmost point
on Baffin Island, a Holocene record of Caribou Glacier
from Donard Lake shows organic-rich gyttja deposition un-
til ∼ 9.5 ka, clastic laminae between ∼ 9.5 and 8.6 ka, a re-
turn to organic-rich sedimentation between ∼ 8.6 and 5.7 ka,
and clastic deposition from ∼ 5.7 ka to present (Moore et
al., 2001; Miller et al., 2005; Fig. 4, record 2). Glacially de-
rived sediments from this record indicate time periods when
Caribou Glacier had thickened enough to breach the col sep-
arating it from the valley of Donard Lake, which greatly in-
creased the lake’s catchment size to cause delivery of glacial
sediment (Moore et al., 2001; Miller et al., 2005). We exclude
two lake records from our summary due to unclear interpreta-
tions and/or uncertain chronologies: Lake Jake from Miller et
al. (2005) and Tasikutaaq Lake from Lemmen et al. (1988).
For a broad review of mountain glacier fluctuations in the
Canadian Arctic and Baffin Island more specifically (includ-
ing a discussion of non-lake-based proxies), we refer readers
to Briner et al. (2016) Sect. 4.5 and Briner et al. (2009), re-
spectively.
    In summary, GICs first became smaller or absent alto-
gether on east–central Baffin Island in the early to middle
Holocene between ∼ 10.2 and 6 ka. At least 80 % of the lake-
based records from Arctic Canada indicate that GICs were
smaller than present or absent between ∼ 10.2–10 and ∼ 5.9–
5.7 ka, and at least 60 % were smaller than present or ab-
sent between ∼ 10.2 and 9.5 ka and between ∼ 8.6 and 2 ka
(though we note that there are few records available from the
region, covering a very small geographic area). The earliest
GIC regrowth occurred in southern Baffin Island at ∼ 5.7 ka
on peaks roughly ∼ 1400 m a.s.l. and between ∼ 2 and 1.1 ka        Figure 4. Holocene lake-based GIC records from Arctic Canada
in the northeast on peaks ∼ 1150 m a.s.l. and below. A review      (Baffin Island, northeastern Canada). Panel descriptions, symbols,
                                                                   and colors are the same as in Fig. 3. Sites are as follows: 1. Thomas
of the latest Pleistocene and Holocene glaciation of Baffin
                                                                   et al. (2010) (Longspur Lake, unnamed glaciers); 2. Moore et
Island suggests that at least some alpine GICs survived the
                                                                   al. (2001), Miller et al. (2005) (Donard Lake, Caribou Glacier);
warmer-than-present early HTM and that GICs advanced be-           3. Thomas et al. (2010) (Big Round Lake, Kuuktannaq Glacier);
ginning in some places as early as ∼ 6 ka (although most do        4. Thomas et al. (2010) (Yougloo Lake, Kuuktannaq Glacier);
not record positions for near the Little Ice Age, or LIA, until    5. Thomas et al. (2010) (Igloo Door Lake, Kuuktannaq Glacier).
∼ 3.5–2.5 ka) (Briner et al., 2009).                               We note that the oldest radiocarbon age from Donard Lake is pre-
                                                                   Holocene. We report the oldest Holocene age.
3.3   Greenland

Greenland is over 2 million km2 in area, extending from ∼ 59       inland, especially high in the very south (reaching up to ∼
to 83◦ N between the Atlantic and Arctic oceans. GICs cover        3000 mm yr−1 ) and on the eastern coast, and low in the north
almost 90 000 km2 of the land outlying the Greenland Ice           (in Thule annual accumulated precipitation is ∼ 132 mm)
Sheet (GrIS). The periphery of the vast island hosts a wide        (Cappelen, 2001, 2020).
range of modern climates. In Nuuk (Greenland’s capital in             A total of 22 lake-based records of Holocene GIC vari-
the southwest), average summer air temperature is ∼ 5.8 ◦ C,       ability are available from Greenland. Beginning in the south
and average annual air temperature is −1.4 ◦ C. For contrast,      near Kap Farvel, a record from Quvnerit Lake suggests that
in Thule (in northwestern Greenland) summer air tempera-           glaciers were present in the catchment in the early Holocene
ture is ∼ 4.2 ◦ C and annual air temperature is −10.9 ◦ C (Cap-    and into the mid-Holocene between at least ∼ 9.5 and 7.1 ka
pelen, 2020; reported air temperature is the 1981–2010 av-         (Larocca et al., 2020a; Fig. 5, record 14). From ∼ 7.1–5.5 ka
erage). Precipitation is generally higher on the coasts than       glaciers were absent from the lake’s catchment and likely

https://doi.org/10.5194/cp-18-579-2022                                                             Clim. Past, 18, 579–606, 2022
586                                 L. J. Larocca and Y. Axford: An Arctic synthesis of Holocene lake-based glacier records

melted away entirely. Between ∼ 5.5 and 3.1 glaciers were          advance at ∼ 9 ka, glaciers experienced net recession until
smaller than present or absent. Minerogenic sediment in-           ∼ 4.6 ka (Schweinsberg et al., 2018; Fig. 5, record 13). The
put into the lake, implying glacier presence, occurred from        onset of the Neoglacial is recorded in the Crash Lake sed-
∼ 3.1 ka to present (Larocca et al., 2020a). Roughly ∼ 95 km       iments at ∼ 4.6 ka, followed by increasing glacier size and
to the northwest, a record from Uunartoq Lake suggests that        several intervals of glacier advances. Larsen et al. (2021b)
glaciers likely melted away completely sometime prior to           present a Holocene record of Apusiikajik Glacier from two
∼ 5.2 ka and remained absent from the catchment until they         threshold lakes (Lakes XC1423 and XC1424) in southeastern
regrew at ∼ 1.2 ka (Larocca et al., 2020a; Fig. 5, record 4).      Greenland at roughly 63◦ N. The lakes do not receive glacial
Less than 20 km NW, the record from Alakariqssoq Lake              meltwater at present as the glacier retreated out of the catch-
suggests that glaciers were present in the lake catchment          ment sometime prior to 1932 CE. The lake records show that
from at least ∼ 10.75 to ∼ 7.3 ka (Larocca et al., 2020a;          Apusiikajik Glacier receded out of the lake catchments by
Fig. 5, record 3). Glaciers were likely absent altogether be-      ∼ 9.6 ka and remained smaller than its LIA extent until a
tween ∼ 7.3 and ∼ 1.3 ka. Sustained regrowth of glaciers in        readvance in the late Holocene. However, the timing of the
Alakariqssoq’s catchment occurred at ∼ 1.3 ka (Larocca et          readvance is not well constrained, as ages below the silty clay
al., 2020a).                                                       suggest glacial meltwater input from ∼ 0.5 or 0.2 ka (Larsen
   On Ammassalik Island, ∼ 100 km south of the Arctic Cir-         et al., 2021b). Thus, we do not include this record in our com-
cle on the coast of southeastern Greenland, van der Bilt           pilation.
et al. (2018) present a Holocene record of Ymer Glacier               Near Nuuk, Larsen et al. (2017) present records of
from Ymer Lake. The record indicates the onset of lake             Holocene GIC variability from three lakes fed by GICs with
sedimentation at ∼ 10 ka and that the lake catchment re-           different elevation ranges (Fig. 5, records 8, 11, and 18).
mained glaciated until ∼ 9.5 ka (Fig. 5, record 17). Cessa-        The Badesø Lake record (Fig. 5, record 8), which today is
tion of glacial input occurred at ∼ 9.5 ka and glaciers are        fed by the highest-altitude glaciers, indicates that after the
reported to have reformed in the catchment after ∼ 1.2 ka          lake’s isolation from the sea at ∼ 8.5 ka, glacier ice was ab-
(van der Bilt et al., 2018). Just NW of Ymer Lake, a new           sent from the catchment until ∼ 5.5 ka. Renewed ice growth
proglacial lake record from Smaragd Sø indicates that Mit-         and meltwater influx began again at ∼ 5.5 ka and contin-
tivakkat Glacier was probably smaller than present from at         ued to present, except for a short period of glacier absence
least ∼ 7.9 ka (and possibly as early as ∼ 11.4 ka) to 0.7 ka      between ∼ 4.4 and 3.5 ka (Larsen et al., 2017). The record
(Larsen et al., 2021a; Fig. 5, record 22). Radiocarbon dating      from Langesø Lake (Fig. 5, record 11) suggests that from the
of plants and reindeer antlers adjacent to the glacier place       lake’s isolation at ∼ 8.7 ka and until 3.6 ka, organic-rich gyt-
bounds on when the site was ice-free or overrun by ice (for        tja was deposited, indicating that all glacier ice had melted
study details see Knudsen et al., 2008) and furthermore in-        in the catchment. Glacier regrowth began at ∼ 3.6 ka and
dicate that the glacier began to expand sometime between           meltwater input continued to present (Larsen et al., 2017).
∼ 1.4 and 0.7 ka, when Mittivakkat Glacier advanced to-            The record from Lake IS21 (i.e., Fig. 5, record 18), which
wards its maximum LIA extent (Larsen et al., 2021a). Aerial        is currently fed by the relatively low-elevation Qasigiann-
photographs show that the glacier retreated out of the catch-      guit Ice Cap, indicates that the lake formed before ∼ 9 ka
ment again prior to 1933 CE (Larsen et al., 2021a). However,       and that glacial meltwater input occurred until ∼ 7.9 ka. Be-
since Smaragd Sø is glacially fed only when the Mittivakkat        tween ∼ 7.9 and 1.6 ka, the ice cap had completely melted
Glacier is at an advanced position, the lake record is not op-     away. Renewed ice growth began at ∼ 1.6 ka, and a period
timal for recording Holocene glacier variations and can only       of reduced meltwater input is reported between ∼ 1.4 and
be used to determine when the glacier was at a maximum             0.8 ka (Larsen et al., 2017). Around 50 km south of Nuuk,
position (Larsen et al., 2021a). Thus, we only include the         near Buksefjord, a record from Pers Lake suggests that from
glacier’s most recent advance in our compilation. Nearby, a        the time the lake emerged from the sea at ∼ 8.6 ka, glaciers
9.5 ka record from Kulusuk Lake on Kulusuk Island suggests         were absent from the catchment until ∼ 4.3 ka (Larocca et
that glaciers delivered meltwater to the lake until ∼ 8.7 ka       al., 2020b; Fig. 5, record 16). After ∼ 4.3 ka the GICs were
(Balascio et al., 2015; Fig. 5, record 21). At ∼ 8.7 ka, signif-   either smaller than present or completely absent at times until
icant retreat of the Kulusuk glaciers is reported, which was       ∼ 1.4 ka, at which time the GICs persistently remained in the
interrupted by two glacier advances at ∼ 8.5 and ∼ 8.2 ka.         catchment until present (Larocca et al., 2020b). We exclude a
Between ∼ 7.8 and 4.1 ka, high organic content implies that        second lake record (Lake T3) from this study from our sum-
the glaciers likely melted away completely. From ∼ 4.1 ka,         mary due to poor age constraints. However, the record sug-
a series of episodic advances followed by periods of retreat       gests that following emergence of Lake T3 between ∼ 8.4
occurred, which were superimposed on a gradual trend to-           and 7.5 ka, the lake received continuous glacial meltwater
ward larger glacier size. After ∼ 1.3 ka, the Kulusuk glaciers     input (although reduced for an extended period of unknown
stabilized and reached a greater size (Balascio et al., 2015).     age and duration) through the remainder of the Holocene, im-
At a similar latitude but on Greenland’s southwest coast,          plying that some high-elevation GICs may have survived the
sediments from proglacial Crash Lake suggest that after an         HTM.

Clim. Past, 18, 579–606, 2022                                                          https://doi.org/10.5194/cp-18-579-2022
L. J. Larocca and Y. Axford: An Arctic synthesis of Holocene lake-based glacier records                                                      587

Figure 5. Holocene lake-based GIC records from Greenland. Panel descriptions, symbols, and colors are the same as in Fig. 3. Sites
are as follows: 1. Medford et al. (2021) (Rapids and Bunny lakes, Renland Ice Cap); 2. Larsen et al. (2019) (Lake T3 and T8, Flade
Isblink Ice Cap); 3. Larocca et al. (2020a) (Alakariqssoq Lake, unnamed glaciers); 4. Larocca et al. (2020a) (Uunartoq Lake, unnamed
glaciers); 5. Schweinsberg et al. (2019) (Pauiaivik Lake, Sermikassak Glacier); 6. Adamson et al. (2019) (Madsen Lake, Slettebreen Ice Cap);
7. Axford et al. (2019) (Deltasø Lake, North Ice Cap); 8. Larsen et al. (2017) (Badesø Lake, RGI40–05.07196 and RGI40–05.07208 glaciers);
9. Schweinsberg et al. (2019) (Saqqap Tasersua Lake, Qangattaq Ice Cap); 10. Schweinsberg et al. (2017) (Sikuiui Lake, Qangattaq Ice Cap);
11. Larsen et al. (2017) (Langesø Lake, RGI40–05.07196 glacier); 12. Lowell et al. (2013) (Bone Lake, Istorvet Ice Cap); 13. Schweinsberg
et al. (2018) (Crash Lake, unnamed glacier); 14. Larocca et al. (2020a) (Quvnerit Lake, unnamed glaciers); 15. Levy et al. (2014) (Two Move
Lake, Bregne Ice Cap); 16. Larocca et al. (2020b) (Pers Lake, unnamed glaciers); 17. van der Bilt et al. (2018) (Ymer Lake, Ymer Glacier);
18. Larsen et al. (2017) (Lake IS21, Qasigiannguit Ice Cap); 19. Larsen et al. (2019) (Lake T4, ice cap 1); 20. Larsen et al. (2019) (Lake T2
and T6, ice cap 2); 21. Balascio et al. (2015) (Kulusuk Lake, Kulusuk glaciers); 22. Larsen et al. (2021a) (Smaragd Sø, Mittivakkat Glacier).
∗ We report the highest present ice elevation of Flade Isblink Ice Cap and Istorvet Ice Cap (i.e., studies 2 and 12) rather than the highest
ice elevation inside the lake’s watersheds. We also note that studies 12 and 22 are considered threshold records; the lakes does not receive
meltwater from the glacier or ice cap at present, and the oldest reported date from study 12 is from a nearby lake, Snowbank Lake. Study 6
(i.e., Adamson et al., 2019) is a short record and only records a minimum bound on glacier regrowth in the late Holocene. Schweinsberg et
al. (2017) report that the thin minerogenic-rich layer seen in the Sikuiui Lake record at ∼ 5.7 ka “may represent a brief glacier advance”.
Thus, because of this uncertainty, we report the earliest regrowth of the Qangattaq Ice Cap at ∼ 5 ka. Finally, we note that the oldest age from
Lake T4 (i.e., study 19; Larsen et al., 2019) is an isolation age based on correlation between the lake’s elevation and a local relative sea-level
curve.

   On the peninsula of Liverpool Land in central East Green-               ∼ 9.7 and 0.8 ka). Since the lake does not receive glacial in-
land, Lowell et al. (2013) present a Holocene record of Is-                put today, it can only be concluded that the ice cap was at a
torvet Ice Cap from Bone Lake (Fig. 5, record 12). The                     size similar to or smaller than at present; however, the study
record indicates that Istorvet Ice Cap did not feed meltwa-                suggests that during the middle and late Holocene, Istorvet
ter into the lake throughout most of the Holocene (between                 Ice Cap was likely small. Following this, the most exten-

https://doi.org/10.5194/cp-18-579-2022                                                                       Clim. Past, 18, 579–606, 2022
588                                 L. J. Larocca and Y. Axford: An Arctic synthesis of Holocene lake-based glacier records

sive advance during the Holocene occurred from 1150 CE            son et al., 2019; Fig. 5, record 6). In northwestern Greenland,
to at least 1660 CE (Lowell et al., 2013). In the Scoresby        a record from Deltasø Lake indicates that North Ice Cap was
Sund region of central East Greenland, Levy et al. (2014)         smaller than present or absent through most of the Holocene
report a record of Bregne Ice Cap from Two Move Lake              from at least ∼ 10.1 to ∼ 1850 CE when the ice cap reached
(Fig. 5, record 15). Between ∼ 10 and 2.6 ka, the lake en-        its present-day size (Axford et al., 2019; Fig. 5, record 7).
vironment was dominated by biological production, imply-          Just north of North Ice Cap, Søndergaard et al. (2019) in-
ing no glaciogenic input. The regrowth of Bregne Ice Cap          fer the glacial history of outlet glaciers of the Greenland Ice
during the late Holocene is first reported at ∼ 2.6 ka, while     Sheet and the local ice cap, Qaanaaq Ice Cap, via analysis of
sustained ice expansion is reported at ∼ 1.9 ka, after which a    lake cores from proglacial lake, Lake Q3, geomorphological
late Holocene maximum was reached by ∼ 0.74 ka (Levy et           mapping, 10 Be exposure dating, and 14 C dating of reworked
al., 2014). Medford et al. (2021) present a ∼ 12 ka record of     marine mollusks and subfossil plants. The lake record sug-
SW Renland Ice Cap from Rapids and Bunny lakes (Fig. 5,           gests continued glacial meltwater input from its formation
record 1). The lake records suggest that deglaciation began       at ∼ 7.2 ka until present (Søndergaard et al., 2019). How-
as early as ∼ 12.7 ka and that by ∼ 9.5 ka the ice cap had re-    ever, since the record cannot distinguish if the sediment de-
treated behind its present-day extent. The ice cap remained       posited in Lake Q3 originates from the Greenland Ice Sheet,
smaller than present during most of the Holocene; however,        the Qaanaaq Ice Cap, or both, and our study focuses only
periodic inputs of inorganic sediments to the lakes suggest re-   on glaciers and ice caps distinct from the ice sheets, we do
peated fluctuations of Renland Ice Cap, particularly between      not include this record in our compilation. Finally, in Find-
∼ 7.6–7.2 and ∼ 3.4–3.2 ka, the onset of neoglaciation. A         erup Land, northern Greenland, Larsen et al. (2019) present
brief episode of glacier expansion is noted at ∼ 1.3 ka, fol-     five proglacial lake records of Holocene GIC activity that
lowed by the onset of significant late Holocene glaciation        demonstrate that GICs in Finderup Land survived the HTM,
shortly after ∼ 1.05 ka.                                          possibly due to increased precipitation via a reduction in sea-
   Schweinsberg et al. (2017, 2019) present three Holocene        ice extent and/or increased poleward moisture transport. The
records of glacier variability on Nuussuaq, West Greenland        record from Lakes T3 and T8 (Fig. 5, record 2) suggest that
(Fig. 5; records 5, 9, and 10). The Pauiaivik Lake record         Flade Isblink Ice Cap survived the HTM but was smaller
suggests that Sermikassak Glacier was smaller or absent be-       than present between ∼ 9.4 and 0.2 ka (Larsen et al., 2019).
tween ∼ 9.5 and 4.3 ka (Schweinsberg et al., 2019; Fig. 5,        The record from Lake T4 indicates that ice cap 1 delivered
record 5). Mineral-rich sediments are reported throughout the     glacial meltwater to the lake from at least ∼ 5.9 ka, the esti-
last ∼ 4.3 kyr, implying glacier presence in the lake’s catch-    mated time of the lake’s isolation (Larsen et al., 2019; Fig. 5,
ment (Schweinsberg et al., 2019). The record from Saqqap          record 19). Likewise, the records from Lakes T2 and T6 show
Tasersua Lake (Fig. 5, record 9) suggests that Qangattaq          that ice cap 2 delivered meltwater through the Holocene from
Ice Cap was active in the catchment until roughly ∼ 10.2 ka       at least ∼ 9.5 ka, the estimated time of isolation (Larsen et
(Schweinsberg et al., 2019). Between ∼ 10.2 and 4.5 ka, the       al., 2019; Fig. 5, record 20).
record suggests that the ice cap was mostly either reduced           In summary, GICs first became smaller or absent alto-
or not active in the catchment. However, some glacier ac-         gether in Greenland in the early to middle Holocene between
tivity is reported before ∼ 8.5 ka, though the ice cap’s rela-    ∼ 10.2 and 7.1 ka. Combined, of the available lake-based
tive size is not reported. Periods of enhanced glacier activ-     records from Greenland, at least 75 % suggest that GICs
ity are reported between ∼ 8.5–8.2, ∼ 7.2–6.8, and ∼ 5.6–         were smaller than present or absent between ∼ 8 and 3.7 ka.
5.3 ka. There is a gap in the downcore proxy data; how-           The highest percentage (∼ 94 %) of GICs either smaller than
ever, enhanced glacier activity commenced again in the late       present or absent occurred in the middle Holocene between
Holocene sometime between ∼ 3 and 2 ka (Schweinsberg              ∼ 6.8 and 5.9 ka. Glaciers first began to regrow in lake catch-
et al., 2019). We note that we report interpretations from        ments after ∼ 5.7 ka. The largest decreases in the percent-
Fig. 10 in Schweinsberg et al. (2019). The Sikuiui Lake           age of smaller or absent GICs occurred between roughly ∼ 4
record (Fig. 5, record 10) suggests that Qangattaq Ice Cap        and 3 ka and especially between ∼ 2 and 1 ka. A review of
was either reduced or not active in the catchment between         the fluctuations of local glaciers during latest Pleistocene and
∼ 9.4 and 3.8 ka, except for mineral-rich strata between ∼ 8.8    Holocene suggests that during the HTM, most local glaciers
and 8 ka and around ∼ 5.7 ka that may represent brief glacier     in Greenland were smaller than present and may have dis-
advances. The onset of the Neoglacial and regrowth of the         appeared completely and that generally GICs grew to their
ice cap is reported at ∼ 5 ka, with more substantial snow-line    maximum Holocene extents during historical time (Kelly and
lowering and expansion at ∼ 3.7 ka, followed by other ex-         Lowell, 2009).
pansion phases at ∼ 2.9, 1.7, and 1.4 ka, as well as during
the LIA (Schweinsberg et al., 2017, 2019).                        3.4   Iceland
   In northeastern Greenland, a late Holocene record of Slet-
tebreen Ice Cap from Madsen Lake suggests that the ice cap        Located just below the Arctic circle, Iceland sits in the North
was present in the catchment since at least ∼ 1.8 ka (Adam-       Atlantic and is situated at the border between warm and cold

Clim. Past, 18, 579–606, 2022                                                         https://doi.org/10.5194/cp-18-579-2022
L. J. Larocca and Y. Axford: An Arctic synthesis of Holocene lake-based glacier records                                             589

ocean currents, creating a steep climate gradient across the
island (Einarsson, 1984; Geirsdóttir et al., 2009). Iceland’s
climate is maritime with cool summers and mild winters
(Einarsson, 1984). It is moderated by the Irminger current,
composed of warm, saline waters which wrap around the
island’s southwest coast, as well as cold and low-salinity
waters via a branch of the East Greenland Current, which
flows in a southeasterly direction around Iceland’s north-
ern coast (Björnsson and Pálsson, 2008). About 11 % of the
∼ 100 000 km2 island is covered by glaciers, and the largest
ice caps sit in the southern and central highlands (Björns-
son and Pálsson, 2008). Mean temperature is generally close
to 0 ◦ C in the winter and is ∼ 10 ◦ C in the summer (Ólafs-
son et al., 2007). Precipitation is generally controlled by both
orography and prevailing winds, and it is annually highest on
Iceland’s south and southeast coast and lowest in the inland
northern regions (Björnsson and Pálsson, 2008; Anderson et
al., 2019).
   In Iceland, five lake-based records of Holocene GIC fluc-
tuations are available (Fig. 6). Three records lie in the West-
fjords region. The northernmost record (i.e., Harning et
al., 2016a; Fig. 6, record 5) from Skorarvatn Lake shows
that the northern margin of Drangajökull Ice Cap reached
a size comparable to its present limit by ∼ 10.3 ka. The ice
cap is interpreted to have been ∼ 20 % smaller than present
by ∼ 9.2 ka and likely melted away by ∼ 9 ka, as local
peak warmth is reported between ∼ 9 and 6.9 ka (Harning
et al., 2016a). A record of SE Drangajökull Ice Cap from
Tröllkonuvatn Lake (i.e., Harning et al., 2016a, b; Fig. 6,        Figure 6. Holocene lake-based GIC records from Iceland. Panel
record 3) suggests that the ice cap was present in the lake’s      descriptions, symbols, and colors are the same as in Fig. 3. Sites
catchment between ∼ 10.3 and 8.75 ka and was absent be-            are as follows: 1. Striberger et al. (2012) (Lake Lögurinn, Ey-
tween ∼ 8.75 and 1 ka. From ∼ 1 ka, the ice cap was present,       jabakkajökull Glacier); 2. Larsen et al. (2012) (Lake Hvítárvatn,
except for a short non-glacial interval between ∼ 0.7 and          Langjökull Ice Cap); 3. Harning et al. (2016a, b) (Tröllkonuvatn
0.55 ka (Harning et al., 2016a, b). From the same two studies,     Lake, Drangajökull Ice Cap); 4. Harning et al. (2016a, b) (Efra–
a record from Efra–Eyvindarfjarðarvatn Lake (i.e., Harning         Eyvindarfjarðarvatn Lake, Drangajökull Ice Cap); 5. Harning et
et al., 2016a, b; Fig. 6, record 4) suggests that SE Dranga-       al. (2016a) (Skorarvatn Lake, Drangajökull Ice Cap). We note that
                                                                   records 3, 4, and 5 are considered threshold lake records. Thus, the
jökull Ice Cap was present in the lake’s catchment between
                                                                   non-glacial–glacial transitions may not precisely represent the tim-
∼ 10.3 and 9.2 ka and was absent from at least ∼ 9–2.3 ka.
                                                                   ing of the ice cap’s response to climate forcings. ∗ At present, Sko-
After ∼ 2.3 ka, the ice cap remained in the lake’s catchment,      rarvatn Lake is outside the Drangajökull Ice Cap’s drainage area and
except for a short non-glacial interval between ∼ 1.5 and          420 m a.s.l. is the reported catchment threshold for receiving glacial
1.4 ka (Harning et al., 2016a, b). Additional evidence of the      sediments.
Holocene history of Drangajökull Ice Cap from seven thresh-
old lakes is presented by Schomacker et al. (2016). We ex-
clude these records from our summary because six of the            similar to or smaller than today by ∼ 10.2 ka, whereas the
lakes do not receive meltwater from the ice cap today, mak-        southeastern part of the ice cap was larger than today until
ing it difficult to constrain when the ice cap was smaller than    ∼ 7.8–7.2 ka (Schomacker et al., 2016).
present, and the record from the seventh, Lake Skeifuvatn,            In south–central Iceland, two studies from Lake Hvítár-
which does receive meltwater from Drangajökull’s south-            vatn, located on the eastern margin of Langjökull, the
ern margin, did not contain any dateable material. However,        second-largest ice cap in Iceland, show a nearly identical
in contrast to the previously mentioned studies (i.e., Fig. 6,     Holocene history (i.e., Black, 2008; Larsen et al., 2012). Ev-
records 3, 4, and 5), the main conclusion is that the Dranga-      idence from diatom assemblages, as well as physical and
jökull Ice Cap probably survived the HTM and was present           chemical proxies, suggests that Langjökull largely disap-
through the entire Holocene, perhaps due to increased win-         peared from at least ∼ 10.2 to 8.7 and from 7.35–5.5 ka
ter precipitation (Schomacker et al., 2016). The lake records      (Black, 2008). The record suggests that Langjökull was then
also suggest that the northern part of the ice cap was at a size   present in the catchment from ∼ 5.5 ka (Black, 2008; we

https://doi.org/10.5194/cp-18-579-2022                                                              Clim. Past, 18, 579–606, 2022
590 L. J. Larocca and Y. Axford: An Arctic synthesis of Holocene lake-based glacier records
do not include this record in our compilation as it is un- of modern climates. In general, the region’s climate is heav-
published). Similarly, Larsen et al. (2012) report that fol- ily influenced by several oceanic and atmospheric processes,
lowing regional deglaciation, summer temperatures were al- in particular by the advection of heat and moisture to the
ready high enough that mountain GICs had melted away, and North Atlantic region, the position of the polar front, and
thus no ice is reported in Lake Hvítárvatn’s catchment from the winter index of the North Atlantic Oscillation (Moros et
∼ 10.2–8.7 ka (Fig. 6, record 2). The record suggests that al., 2004; Oien et al., 2020; Bakke et al., 2005c). Southern
this early Holocene warmth was interrupted by two pulses Scandinavia is temperate, with a strong west-to-east gradient
of cooling and possibly glacier growth between ∼ 8.7 and from a maritime to continental climate, while northern Scan-
7.9 ka. Following this, ice-free conditions in the watershed dinavia is characterized by a subpolar to polar climate (Oien
and high within-lake productivity occurred during the HTM et al., 2020). Precipitation generally decreases moving inland
between ∼ 7.9 and 5.5 ka. The inception and expansion of with distance from the coast, with the southern coastal areas
Langjökull Ice Cap began at ∼ 5.5 ka (Larsen et al., 2012). In receiving the highest amount of winter precipitation (Oien et
eastern Iceland, a ∼ 10.5 ka record from Lake Lögurinn sug- al., 2020).
gests that Eyjabakkajökull, a surge-type outlet glacier of the The Scandinavian peninsula is relatively data-rich, with
Vatnajökull Ice Cap, receded rapidly during the final phase of 20 Holocene lake-based records of GIC variability avail-
the last deglaciation (Striberger et al., 2012; Fig. 6, record 1). able covering a broad north–south transect in Norway and
Glacial meltwater input ceased by ∼ 9 ka and returned at Sweden (Fig. 7). Moving from north to south, the northern-
∼ 4.4 ka, suggesting an almost 5 kyr long glacier-free period most study (i.e., Wittmeier et al., 2015; Fig. 7, record 20)
during the early and mid-Holocene (Striberger et al., 2012). presents a record of glacier activity from the northern out-
In summary, GICs first became smaller or absent alto- let of the Langfjordjøkelen Ice Cap via a chain of three
gether in Iceland in the early Holocene between ∼ 10.2 and downstream lakes. Following deglaciation of the valley of
8.75 ka. Between 80 % and 100 % of the lake-based records Sør–Tverrfjorddalen (∼ 10 ka), the ice cap was reduced
from Iceland indicate that GICs were smaller than present or absent until 4.1 ka, when Langfjordjøkelen Ice Cap re-
or absent from ∼ 9–5.5 ka (Fig. 6b). In eastern and western formed. An exception occurred at ∼ 8.2 ka when minero-
Iceland, GICs regrew on relatively high-elevation peaks be- genic input abruptly increased, possibly reflecting a reform-
tween ∼ 5.5 and 4.4 ka and on the lower-elevation peaks in ing glacier (Wittmeier et al., 2015). Roughly 80 km south-
the Westfjords region between ∼ 2.3 and 1 ka (Fig. 6a, b, west pro-glacial Lake Aspvatnet was isolated from the sea
and d). We refer readers to Geirsdóttir et al. (2019) for an ∼ 10.3 ka (i.e., Bakke et al., 2005a; Fig. 7, record 17). The
in-depth discussion of neoglaciation and glacier inception in lake record suggests that the glacier Lenangsbreene was
Iceland. A review summarizing records of Holocene glacial present between ∼ 9.8 and 8.9 ka and absent between ∼ 8.8
and climate evolution suggests that by ∼ 10.3 ka, the main and 3.8 ka. After 3.8 ka, the record shows continuous in-
ice sheet was in rapid retreat across the highlands of Iceland put of glacier–meltwater-derived sediments to Lake Aspvat-
and that the local HTM was reached after 8 ka, with land net, indicating sustained glacier presence in the catchment
temperatures estimated to be ∼ 3 ◦ C higher than the 1951– (Bakke et al., 2005a). In northern Sweden, Snowball and
1990 reference period, implying ice-free conditions in the Sandgren (1996) present a record derived from three lake
early to mid-Holocene (Geirsdóttir et al., 2009). The review basins (Fig. 7, record 16), which suggest that Kårsa Glacier
also notes that many marine and lacustrine records indicate likely disappeared during the early and mid-Holocene and
a substantial summer temperature depression between ∼ 8.5 reformed ∼ 3.3 ka. Just over 20 km southwest, a record from
and 8 ka and that the onset of Neoglacial cooling occurred Vuolep Allakasjaure Lake (i.e., Rosqvist et al., 2004; Fig. 7,
after ∼ 6 ka, with increased glacier activity between ∼ 4.5 record 18) suggests that the area was ice-free and vegetated
and 4 ka, which intensified further between ∼ 3 and 2.5 ka at ∼ 9.7 ka and that a glacier was present in the lake’s catch-
(Geirsdóttir et al., 2009). A more recent composite record ment during the last 5000 years. In northern Norway, sedi-
of Holocene environmental change and ice cap activity in ment cores from the distal-fed glacial lakes Vestre and Aus-
Iceland shows peak summer warmth by ∼ 7.9 ka until 5.5 ka tre Kjennsvatnet (i.e., Bakke et al., 2010; Fig. 7, record 10)
(the onset of neoglaciation) and subsequent cold perturba- suggest that the ELA of the glacier Austre Okstindbreen was
tions at ∼ 4.3–4 and ∼ 3.1–2.8 ka (Geirsdóttir et al., 2013). at its highest during the entire Holocene between ∼ 7 and
After 2 ka, summer cooling is reported between ∼ 1.4 and 4.9 ka, but possibly survived the HTM. Expanded ice cover is
1 ka, followed by a more severe drop in summer temperature reported in the catchment from ∼ 4.9 ka, but the glacier was
after 0.7 ka that culminated between ∼ 0.5 and 0.2 ka (Geirs- generally small from ∼ 3.95 until 1.3 ka (Bakke et al., 2010).
dóttir et al., 2013). We exclude the late Holocene portion of this record be-
cause the precise timing of when the glacier was smaller than
3.5 Scandinavia
present is unclear.
In southern Norway, a group of 12 lake-based GIC records
Located between ∼ 57 and 71◦ N, the Scandinavian penin- are located in the vicinity of Jostedalsbreen, the largest
sula stretches over a large latitudinal area and hosts a range glacier in mainland Europe. Moving from the coast inland,
Clim. Past, 18, 579–606, 2022 https://doi.org/10.5194/cp-18-579-2022You can also read