Burning in southwestern Brazilian - Philip M. Fearnside
←
→
Page content transcription
If your browser does not render page correctly, please read the page content below
The text that follows is a PREPRINT.
O texto que segue é um PREPRINT.

Please cite as:
Favor citar como:

    da Silva, S.S., I.S. de Oliveira, T.F. Morello,
        L.O. Anderson, A. Karlokoski, P.M.
        Brando, A.W.F. de Melo, J.G. da Costa,
        F.S.C. Souza, I.S. de Souza, E.N. de
        Souza, M.P. Pereira, M.R.N. de Almeida,
        A. Alencar, L.E.O.C. Aragão, I.F. Brown,
        P.M.L.A. Graça & P.M. Fearnside. 2021.
         Burning in southwestern Brazilian
         Amazonia, 2016-2019. Journal of Environmental
         Management https://doi.org/10.1016/j.jenvman.2021.112189 (in press).

ISSN: 0301-4797
DOI: 10.1016/j.jenvman.2021.112189
Copyright: Elsevier

The original publication will be available at:
O trabalho original estará disponível em:
https://doi.org/10.1016/j.jenvman.2021.112189
https://www.journals.elsevier.com/journal-of-environmental-
management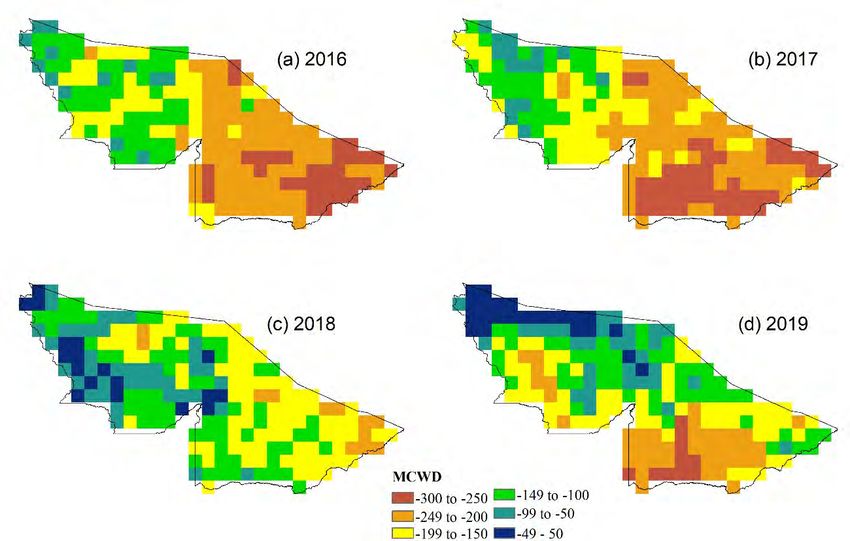
1

 1   Burning in southwestern Brazilian Amazonia, 2016-2019
 2
 3
 4   Abstract
 5   Fire is one of the most powerful modifiers of the Amazonian landscape and knowledge
 6   about its drivers is needed for planning control and suppression. A plethora of factors
 7   may play a role in the annual dynamics of fire frequency, spanning the biophysical,
 8   climatic, socioeconomic and institutional dimensions. To uncover the main forces
 9   currently at play, we investigated the area burned in both forested and deforested areas
10   in the outstanding case of Brazil’s state of Acre, in southwestern Amazonia. We
11   mapped burn scars in already-deforested areas and intact forest based on satellite images
12   from the Landsat series analysed between 2016 and 2019. The mapped burnings in
13   already-deforested areas totalled 550,251 ha. In addition, we mapped three forest fires
14   totalling 34,084 ha. Fire and deforestation were highly correlated, and the latter
15   occurred mainly in federal government lands, with protected areas showing
16   unprecedented forest fire levels in 2019. These results indicate that Acre state is under
17   increased fire risk even during average rainfall years. The record fires of 2019 may
18   continue if Brazil’s ongoing softening of environmental regulations and enforcement is
19   maintained. Acre and other Amazonian states must act quickly to avoid an upsurge of
20   social and economic losses in the coming years.
21
22   Keywords: Amazon; fires; deforestation; droughts, Acre, El Niño
23
24
25   1. Introduction
26          Amazon fires are associated almost exclusively with human activities (Barlow et
27   al., 2019). These fires vary across space and time with changes in land use and cover.
28   These changes are driven by complex interactions among factors such as governance (or
29   lack thereof), international trade, the domestic land market and local climate (Barlow et
30   al., 2019; Tasker and Arima, 2016). During unusually dry and hot years, accidental and
31   illegal fires tend to escape from agricultural fields into standing old-growth, secondary
32   and degraded forests. Although fires affect large areas of the Amazon, there is high
33   variability in fire activity across the Basin (Aragão et al., 2007). This is partially
34   explained by regional heterogeneity in the economic and biophysical factors that drive
35   fires and in the regulatory measures that constrain fires. Understanding how fire activity
36   has changed spatially and temporally across the Amazon is useful for improving fire
37   policy effectiveness, including both prevention and suppression of forest fires.
38          Although periods of high precipitation seasonally dampen fire activity, droughts
39   are becoming common in the region (Jiménez-Muñoz et al., 2016). Forest fires burn
40   larger areas during droughts, especially when deforestation rates are high (Aragão et al.,
41   2008). One study estimated that if deforestation continues to claim Amazon forests, up
42   to 16% of southern Amazonian forests may burn in the near future (Brando et al., 2020).
43   Projections for the end of the century in a land-use scenario with high forest
44   fragmentation indicate that increase by up to 73.2%, mainly in the southern portion of
45   the Amazon (Fonseca et al., 2019).
46          Fires are used as a tool for eliminating the felled trees in recently deforested areas,
47   in clearing secondary forest or in renewing pasture (Barlow et al., 2019; Dias Filho,
48   2011). When these fires escape from control in years of extreme drought, such as 2005,
49   2007, 2010 and 2015/2016, they can cause large-scale forest fires (Alencar et al., 2015;
50   Anderson et al., 2015; Morton et al., 2013; Silva et al., 2018). Even when there were
2

51   reductions in deforestation fires, there was still enough burning activity to generate
52   large-scale forest fires during drought years (Aragão et al., 2018). Recent informal
53   statements by politicians at the federal and state levels attest to the reduction of
54   enforcement investment, which appears to have led to a significant increase in
55   deforestation and fires in the Amazon (Thomaz et al., 2020). This process culminated
56   with the 2019 Amazon fire crisis (Barlow et al., 2019), leading to a presidential decree
57   prohibiting fires and allowing the use of the army for law enforcement (Brazil, 2019).
58   However, this did not reduce burning and contributed to further weakening of IBAMA,
59   the federal environmental agency (Ferrante and Fearnside, 2020; OC, 2020). Weakening
60   environmental regulations and agencies leads to an increase in the area burned in
61   association with the return of high rates of deforestation in the Amazon, as was
62   observed during the first 6-months of 2020 (INPE, 2020a).
63          Acre, which is in the 5th position in the deforestation ranking of Brazil’s nine
64   Amazonian states, has a solid history of forest conservation, for which it was granted
65   the first jurisdictional REDD+ program in the world (Acre, 2013). This important
66   leadership is being threatened by a substantial increase in deforestation and fires since
67   2007 (INPE, 2020b), where the Action Plan for Prevention and Control of Deforestation
68   in Amazonia has not prevented the resumption of deforestation in Acre in recent years
69   (Figure 1). The state is located in the southwestern Brazilian Amazon, and more than
70   84% of its ~ 164,000-km2 area is under old-growth forests (INPE, 2020c), with 46% of
71   the forest area protected by conservation units (Acre, 2010). In recent years, the advance
72   of the agricultural frontier in the “arc of deforestation” (Fearnside, 2005), makes Acre a
73   focus for land speculation, contributing to a significant increase in deforestation. Acre
74   was the epicenter of two recent mega-droughts, in 2005 and 2010 (Lewis et al., 2011).
75   The state is among the ten poorest of Brazil, with approximately 40% of its citizens
76   below the poverty threshold (IBGE, 2019), but much of the deforestation is done by
77   wealthy ranchers. This scenario of deforestation, droughts and the weakening of public
78   policies, contributes to inefficient environmental management that leads to socio-
79   economic and environmental conflicts with exacerbation of inequality and increases
80   burning by rural actors.

                           1250
     Deforestation (km2)

                           1000
                                                              Phase1 -PPCDAmazonia                      Phase1 -PPCDAcre                                 Phase2 -PPCDAcre
                           750
                                                                                                                                                  Phase4 -PPCD
                           500                                                                   Phase2 -PPCD Phase3 -PPCD                        Amazonia
                                                                                                 Amazonia     Amazonia
                           250                                                                          REDD
                             0
                                  2000
                                         2001
                                                2002
                                                       2003
                                                              2004
                                                                     2005
                                                                            2006
                                                                                   2007
                                                                                          2008
                                                                                                 2009
                                                                                                        2010
                                                                                                               2011
                                                                                                                      2012
                                                                                                                             2013
                                                                                                                                    2014
                                                                                                                                           2015
                                                                                                                                                  2016
                                                                                                                                                         2017
                                                                                                                                                                2018
                                                                                                                                                                       2019
                                                                                                                                                                              2020

81
82   Fig. 1 Annual deforestation rates PRODES / INPE in the State of Acre indicating
83   Action Plan for Prevention and Control of Deforestation in Amazonia (MMA, 2016)
84   and State of Acre and jurisdictional REDD + program (Acre, 2018) .
85
86          To understand the dynamics of fire, it is essential to analyze its spatial and
87   temporal distributions and also to disentangle forest fires from burning in already-
88   deforested areas. The main type of near real-time satellite data available for this purpose
89   is the so called “hot pixels,” which indicate the location at which fires occur but do not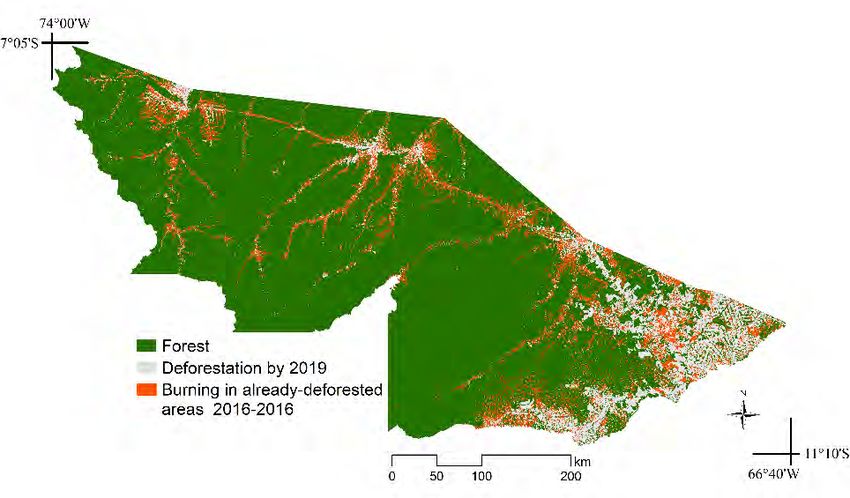
3

 90   allow estimation of the areal extent of the burns. Global remote-sensing products for
 91   burned areas are also available, but these underestimate fire-affected areas in dense
 92   tropical forests (Anderson et al., 2017; Pessôa et al., 2020), and detailed maps have only
 93   been produced for restricted spatial domains and/or time periods (Alencar et al., 2015;
 94   Anderson et al., 2015). Other estimates have spatial resolution that does not allow
 95   detecting the dynamics of small fires (INPE, 2020d; Morton et al., 2013).
 96          In order to provide novel information on fire dynamics in the southwestern
 97   Amazon, which is a region that has recently been impacted by severe droughts and
 98   where there is a paucity of information on fire use, we investigated the interconnection
 99   between deforestation, agricultural burning and forest fires. We also explored the
100   relationships of these phenomena with climate.
101
102   2. Methods
103   2.1. Study area
104         Acre State has an area of 16,423,979 ha and is located in the southwestern part of
105   the Brazilian Legal Amazon (Figure 2a). According to the Köppen classification
106   system, local climate is Af (without dry season) and Am (monsoon), with average
107   annual temperatures between 22 ºC and 26 ºC and annual precipitation between 2200
108   mm and 2500 mm. By 2019, the state had 2,259,990 ha (14%) of its territory deforested
109   (INPE, 2020c). Data from the TerraClass project show that deforested areas in Acre are
110   normally occupied by cattle pasture (67%) and secondary forests (areas abandoned after
111   use for agriculture or pasture) (EMBRAPA, 2017). Acre experienced extreme-drought
112   events in 1998, 2005, 2010 and 2016, with maximum cumulative water deficits of up to
113   300 mm (Aragão et al., 2007; Silva et al., 2018).
114
115   2.2. Mapping of burning in already-deforested areas
116         In this study, burning in already-deforested areas was defined as fire scars in areas
117   without native forest that are covered by pasture, agriculture or bare ground in areas of
118   recently deforested native or secondary vegetation. The burned areas mapping were
119   based on supervised classification of Landsat 8 Operational Land Imager (OLI) satellite
120   images from 2016 to 2019. Three images per year were used for the 14 scenes covering
121   the state of Acre to encompass the entire burning season, from July to September
122   (Supplementary Material, Table S1). The choice of several images to represent the year
123   is due to the rapid disappearance of the scars from the fires, which occurs between three
124   to four weeks after the fire event.
125         We used the supervised minimum-distance classification method with cloud
126   processing on the Google Earth Engine based on reflectance information from the
127   Landsat 2, 3, 4, 5 and 6 spectral bands. This classifier calculates the spectral distance
128   between the measurement vector for the candidate pixel and the average for each class
129   signature. The classifier compares the Euclidean distance between the value for each
130   pixel and the average for each cluster. Four classes were used: intact forest, water,
131   deforestation and burn scar, with at least 20 samples per class.
132         After the supervised classification, the minimum mapped area was defined as 0.5
133   ha, representing five contiguous pixels. Areas smaller than this size were excluded from
134   the analysis because they have less reliability due to the spatial resolution of the sensor.
135   The burn-scar mapping was audited by manual adjustment or elimination of area that
136   presented confusion with other targets, such as water bodies or deforestation. The audit
137   was carried out by a team of four people, with the last stage being carried out by a
138   specialist in the fire dynamics of Amazonian landscapes and in remote sensing.
4

139         The validation of the mapping of burn scars was based on field points and random
140   points. Twenty nine field points were collected between August 2nd and 28th 2019 along
141   federal highway BR 364. The random points were distributed between unburned and
142   burned areas, totaling 1000 and 1500 points, respectively. These points were verified by
143   experienced interpreters (Figure 2b). Assessment of the overall accuracy of the
144   classification and estimation of errors of omission and commission were performed
145   using an error matrix as proposed by Anderson et al. (2017).
146
147   2.3. Mapping of forest fires
148         Forest fires were defined in this study as those in which the crowns of the trees
149   were directly or indirectly affected by fire to the point that they cause a detectable
150   impact on the optical satellite images, representing the scar left by the fire (Silva et al.,
151   2018). These mapping procedures represent a continuity of the study performed by
152   Silva et al. (2018) and are based on image processing of the Landsat series using the
153   mixing model produced by CLASlite software. This software uses a spectral-mixing
154   model associated with a robust spectral library to generate the following fractions:
155   photosynthetically active vegetation, non-photosynthetic vegetation and soil. The dates
156   of the images used for processing are from September to December (Supplementary
157   Material, Table S2).
158
159   2.4. Analysis of the spatio-temporal patterns of burning in already-deforested areas
160          For the study period (2016 to 2019), the total burning in already-deforested areas
161   was quantified by year and by recurrence. For each year, we quantified the size of the
162   mapped areas of fire using seven classes: (0.5 - 2, 2 - 5, 5 - 10, 10-25, 25-50, 50-100,
163   ≥100 ha). These analyses allow us to understand the magnitude and patterns of burning
164   in already-deforested areas.
165          To uncover factors correlated with burnings, we categorized data according to
166   land-tenure categories such as settlement projects, undesignated public land, private
167   properties, conservation units and indigenous land) (Acre, 2010). We applied analysis
168   of variance with Levene’s test and a post-hoc Tukey's test to evaluate the null-difference
169   hypothesis between the means for burning in already-deforested areas and in new
170   deforestation. This analysis helps clarify the use of fire to advance deforestation in areas
171   in different land-tenure categories.
172          The relationship between deforestation and burning in already-deforested areas
173   was assessed using data from the PRODES Project (INPE, 2020c). The “PRODES
174   year” used for deforestation estimates refers to the period from August 1st of the
175   previous year to July 31st of the nominal year (i.e., “2019” refers to August 1 2018 to
176   July 31, 2019). Based on these data, we performed three analyses: (I) quantification of
177   the proportion of the total annual area of fires that came from the new annual
178   deforestation, for example, we account for the burned area that occurred in the 2019
179   PRODES year that was not detected as deforestation by PRODES 2018/2019, (II)
180   quantification of the proportion of the total annual area of fires that came from the
181   management of deforested areas consolidated in previous years, for example, burned in
182   2019 that had been detected as deforestation by PRODES 2018/2019, (III) analysis of
183   the correlation between annual burning in already-deforested areas and annual
184   deforestation for the same PRODES year using the municipal boundaries (IBGE, 2016)
185   as the sample unit. The Spearman correlation test was used for this analysis.
186          The relationship between droughts and burning in already-deforested areas was
187   assessed using monthly precipitation estimates based on satellite data from TRMM
188   (Tropical Rainfall Measuring Mission v7, 3B43). For this study three climatic regions
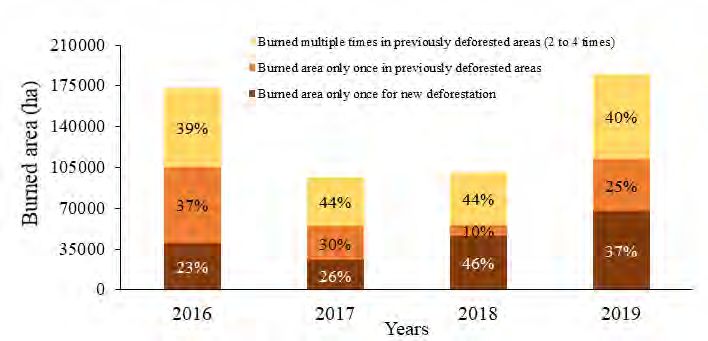
5

189   were defined based on the mean values of maximum cumulative water deficit (MCWD):
190   Aragão et al. (2007) for the 1998–2005 period: the eastern, central and western regions
191   (Figure 2a). Drought intensity was measured as the MCWD between the months of June
192   and September. We applied the Spearman test for correlation significance. We tested the
193   hypothesis of a null correlation between water deficit and fire extent in order to evaluate
194   the evidence that drought acted as an influential factor on fires. This test addresses the
195   fact that anthropogenic forces were not the exclusive source of the fires detected, and
196   the significance of weather influence remains an open question for the period in the
197   literature (Aragão et al., 2018; Barlow et al., 2019).

198
199   Fig. 2 Location of the study area showing the three climatic regions in Acre (a) and the
200   distribution of burned mapping validation points (b).
201
202   2.5. Analysis of the spatio-temporal patterns of forest fire
203          The definition used for forest-fire burn scars in this study was based on Silva et al.
204   (2018), where trees were detected that were directly or indirectly affected by fire to the
205   point that they cause an impact visible on the optical satellite images. We quantified the
206   total area of forest fire per year and its recurrence. We used violin plots to analyze the
207   distribution patterns of areas sizes, including the median, maximum and minimum for
208   each year. We quantified forest fires by categorizing the data according to land-tenure
209   categories such as federal government land, settlement projects, private properties,
210   conservation units and Indigenous Lands (Acre, 2010).
211          We analyzed the relationship between droughts and forest fire based on the
212   MCWD for the three climatic regions, as described in Section 2.4 and Figure 2a. We
213   calculated the Spearman correlation coefficient to test the relationship of the different
214   predictor variables to fire occurrence.
215
216   3. Results
217   3.1. Spatio-temporal distribution of burning in already-deforested areas
218          We mapped 550,251 ha of burning in already-deforested areas in the state of Acre
219   in four years (2016-2019), corresponding to 64% of the total area mapped over the
220   period occurred in 2016 and 2019 (Figure 3a). The overall accuracy of estimates of
221   burned area was 98.5% (97.9% to 99.0%).
222          The year 2019 had the largest amount of burning in already-deforested areas
223   among all of the years analyzed: 44% more than 2018, 46% more than 2017 and 4%
224   more than the 2016 El Niño year. On the other hand, in 2017 and 2018, the area burned
225   in already-deforested areas was 44% smaller than in 2016 and 2019. In the whole period
226   analyzed, 67% (371,207 ha) of the burning occurred at least once in previously
227   deforested areas and 33% (179,895 ha) occurred at least once in newly deforested areas.
228   Of the total burning in already-deforested areas, 76% (323.284 ha) burned once, 19%
229   (78,549 ha) burned twice, 4% (18,413 ha) burned three times and 1% (3868 ha) burned
6
230 four times (Figure 3b). Annually, 23% to 46% of the burned area was associated with
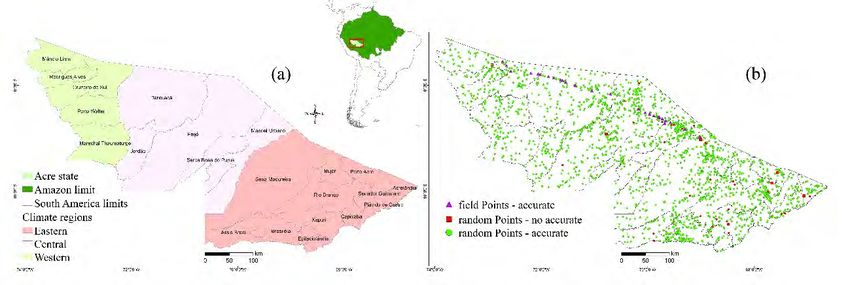
231 newly deforested areas.
(a)
232
(b)
233
234
235 Fig. 3 Total burning in already-deforested areas in the state of Acre from 2016 to 2019
236 (a). Shown in brown are the burnings that occurred in freshly deforested areas in each
237 year, in orange, the burnings that occurred only once in grid cells deforested in previous
238 years (before the period analyzed), and in yellow, the grid cells in which burnings were
239 detected multiple times during the period (b).
240
241 The distribution pattern of areas revealed that between 52,000 and 69,000 ha were
242 burned every year (Figure 4, upper panel). These areas represent, respectively, 3 and 5%
243 of the cumulative deforested area in Acre by the end of 2019 and are 17 to 55% greater
244 than the 44,460 ha average area deforested annually in Acre over the 2016-2019 period
245 (INPE, 2020c). The years 2016 and 2019 had the highest numbers of fires in already-
246 deforested areas with more than 10 ha. These years also account for the largest
247 percentages of the total burning in already-deforested areas (65 and 62%, respectively)
248 (Figure 4, lower panel). This difference becomes larger in areas > 50 ha, since in the
249 years 2019 and 2016 the burning in already-deforested areas within this class was four
250 times larger than in 2017 and 2018. Areas with up to 5 ha represented 22% (2019 and
251 2016) to 35% (2017 and 2018) of the total burning in already-deforested areas. These
252 small areas represented 74% (2019 and 2016) to 81% (2017 and 2018) of the total
253 number of areas affected by fires.7
2019 9% 13% 16% 24% 15% 10% 13%
Burned area
2018 15% 20% 20% 24% 11% 5% 5%
2017 14% 20% 19% 23% 12% 5% 6%
2016 9% 13% 14% 21% 14% 11% 19%
2019 48% 25% 14% 9% 3%
1%
Number of burns
Size (ha)
2018 56% 25% 11% 6%
1% 0.5-2
2-5
2017 54% 26% 11% 6% 5 - 10
1%
10 - 25
25 - 50
2016 49% 26% 12% 9% 3% 50 - 100
1%
+100
0 10 20 30 40 50 60 70 80 90 100
Contribution of burned polygon sizes (%)
254
255 Fig. 4 Distribution of areas by size class for burning in already-deforested areas by
256 burned area (upper panel) and number of burns (lower panel).
257
258 In regards to land-tenure categories, the years 2016 and 2019 had the largest
259 amounts of burning in already-deforested areas when compared to 2017 and 2018 in all
260 land-tenure categories (Figure 5). Undesignated public land had the largest contribution
261 to the total burned area (34% ± 1.9%), an average of 46,000 ha. On the other hand,
262 Indigenous Lands had the smallest area burned in all years (1% ±0.4%), an average of
263 1,989 ha year-1, with only 1% of the total area burned. Together, all land-tenure
264 categories except Indigenous Lands, totalized an area burned in 2019 and 2016 (349.134
265 ha) 80% larger than the area observed between 2017 and 2018 (193.870 ha).
266 In fact, incidence of fire in conservation units and federal government land was
267 larger in 2019 than in all of the years analyzed (burned areas in conservation units were
268 17% larger than in 2016, 53% larger than in 2017 and 55% larger than in 2018; burned
269 areas in federal-government land were 12% larger than in 2016, 51% larger than in
270 2017 and 44% larger than in 2018). The percentage of burned areas in new deforestation
271 (31% to 42%) and in the already-deforested areas (58% to 69%) were equivalent among
272 all land-tenure categories with the exception of conservation units (ANOVA Levene's
273 test and Tukey HSD test, p < 0.001), with more burning in new deforestation (51%)
274 than in the already-deforested areas (49%), indicating the advance of new frontiers of
275 deforestation (Figure 5b).
2768
(a) 200,000
1 1
160,000 12 14
Burned area (ha)
120,000 32 35
2 1
12 11
80,000
27 32 35 25
40,000 25 27
27 24
28 25
0
2016 2017 2018 2019
Settlement projects Private properties
Undesignated public land Conservation units
Indigenous lands
*a *ab *ab *c *bc
(b) 100
31 35 37
80 42
51
% Buned area
60
40
69 65 63 58
49
20
-
Settlement Private Undesignated Conservation Indigenous
projects properties public land units lands
Consolidated deforestation area New deforestation
277
278 Fig. 5 Burning in already-deforested areas by land-tenure category in the 2016-2019
279 period: (a) area burned per year by land-tenure category, and (b) percentages of area
280 burned in new deforestation and in the burning in already-deforested area. The values in
281 the bars indicate the percentage contribution of each class. Different letters indicate
282 significantly different means (ANOVA and Tukey HSD test, p < 0.001)
283
284 Undesignated public lands (terras devolutas), settlement projects and private
285 properties, represent 93% to 95% of the area larger than 50 ha of burning in already-
286 deforested areas (Table 1). In 2016 and 2018, private properties represented the largest
287 contribution to large areas. In 2018 and 2019, undesignated public land was the main
288 contributor to large burned areas, reaching 46% of the total.
2899
290 Table 1. Area occupied by the class of areas greater than 50 ha of burning in already-
291 deforested areas by land-tenure category and year.
2016 2017 2018 2019
ha % ha % ha % ha %
Undesignated public land 16,341 32 3,595 33 4,306 41 18,892 46
Settlement projects 13,295 26 2,588 24 1,977 19 8,074 20
Private properties 18,975 37 4,191 39 3,573 34 11,775 29
Indigenous lands 167 0 117 1 72 1 0 0
Conservation units 2,126 4 274 3 672 6 1,945 5
Total 50,904 100 10,765 100 10,600 100 40,686 100
292
293 3.2. Deforestation and burning in already-deforested areas
294 At the municipal level, burning in already-deforested areas is significantly related
295 to the annual rate of deforestation recorded by INPE (p < 0.001, r = 0.74, Spearman;
296 Figure 6). The year 2019 had the largest area affected by fire (180,000 ha) and the
297 highest annual deforestation rate in the last 14 years (68,800 ha) (p < 0.001, r = 0.74)
298 and the lowest correlation was for the year 2017 (p = 0.023, r = 0.49). Burning in
299 already-deforested areas was more intense in 2019, representing 41% of the mapped
300 area (34% - 56.783 ha - in 2016, 37% - 35.387 ha - in 2017, 39% - 39.312 ha - in 2018
301 and 41% -71.344 ha - in 2019).
302
30000
R2=0.72
25000 y=2,42x + 1388
p < 0.001
Burned area (ha)
20000
2016
15000
2017
10000 2018
2019
5000
0
0 2000 4000 6000 8000 10000
Annual defordestation (ha)
303
304 Fig. 6 Relationship between annual increase in deforestation and burning in already-
305 deforested areas for the state of Acre from 2016 to 2019.
306
307 The total burning in already-deforested areas represented 4% to 8% of the
308 deforested area for the entire state of Acre (Supplementary Material, Table S2). In the
309 central region of Acre, the municipality (county) of Santa Rosa do Purus burned 30% of
310 the cumulative deforested area detected by PRODES, Manoel Urbano, Feijó, Manoel
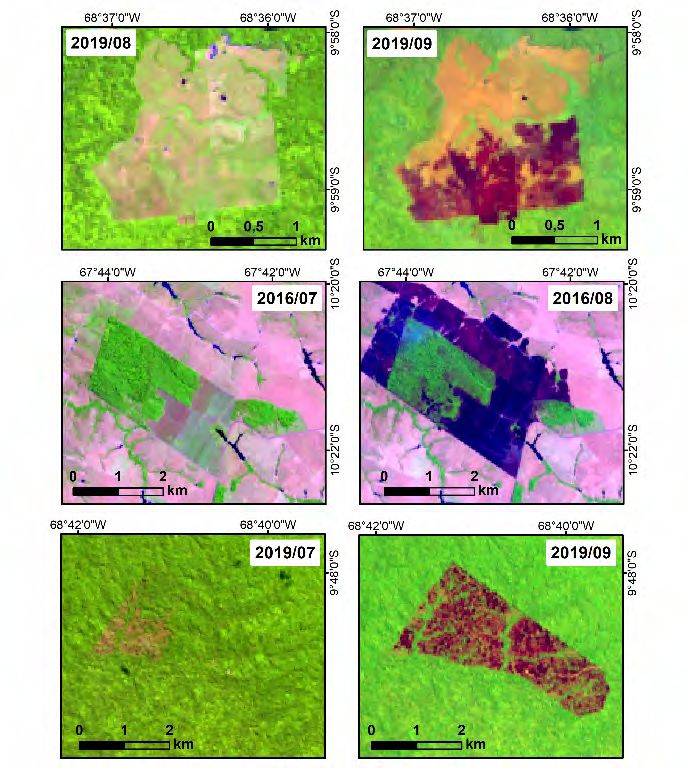
311 Urbano, Jordão, Sena Madureira and Porto Walter burned from 10 to 22%. The10 312 municipality of Assis Brasil, in the Alto Acre region, is an extreme case where, in 2016 313 and 2019, 20% to 24% of the deforested area was affected by fire, respectively. These 314 processes confirm the fact that fire is used not only to burn areas that are being 315 deforested, but also in previously deforested land such as pasture or secondary 316 vegetation (“capoeiras”), with the objective of managing these already-deforested areas. 317 It should be remembered that many recently deforested areas are not burned in the same 318 year, a detail that is not captured by this analysis. 319 320 3.3. Spatio-temporal distribution of forest fires 321 Forest fires in the period analyzed reached 34,084 ha, with the year 2016 322 accounting for 91.3% of the total fire-affected area (31.117 ha), followed by 2019, with 323 5.6% of the total (1920 ha) (Figure 7). The average overall accuracy of forest-fire 324 identification by this method is 98.8% (98.1% to 99.4%). In 2016, there were areas of 325 up to 3,927 ha, followed by 2019 with a maximum area of 350 ha, 2017 with 143 ha and 326 2018 with 33 ha. 327 328 Fig. 7 Areas of forest fire (inner boxplot) and the empirical distribution of area by sizes 329 (outer curve). 330 331 Forest fires were clustered in the eastern region of the state of Acre in all years: 332 97% in 2016, 84% in 2017, 94% in 2018 and 100% in 2019. The land-tenure categories 333 that contributed most to forest fires were settlement projects and private properties in all 334 of the years analyzed, with the exception of 2019, where 78% of the fire occurred in 335 conservation units, Indigenous Lands and undesignated public land in the extreme 336 southeastern portion of Acre (Table 2; Supplementary Material, Figure S2). 337
11

338   Table 2. Contribution of land-tenure categories to the area of forest fires in the state of
339   Acre between 2016 and 2019.
      Land-tenure                 2016              2017               2018              2019
      category                   ha      %       ha       %        ha         %        ha       %
      Settlement projects      9,543     31     487       65       108        36      228       12
      Private properties      12,525     40     148       20        85        29      195       10
      Undesignated public
                               7,364     24     114       15        69        23      466       24
      land
      Conservation units       1,657      5      0         -        36        12      476       25
      Indigenous Lands           28       0      0         -         0         -      555       29
      Total                   31,117 100        749      100       298       100 1,920 100
340
341
342   3.4. Droughts, burnings in already-deforested areas and forest fires
343          We identified a gradient in the maximum cumulative water deficit (MCWD) in
344   the three climatic regions of Acre in the period analyzed. The eastern region had the
345   greatest water deficit during the dry season every year, followed by the central and
346   western regions (Supplementary Material, Figure S2). Furthermore, the correlation
347   between MCWD and occurrence of burnings in already-deforested areas was positive
348   for all years (p = 0.03, r = -0.62, Spearman; Figure 8a), except for 2019. Similarly,
349   MCWD had a negative correlation with occurrence of fires in the climatic regions of
350   Acre, with the eastern and central regions exhibiting the strongest relation, especially
351   for 2016, when there was an El Niño event (p = 0.0016, r = -0.80, Spearman; Figure
352   8b). The burning in already-deforested areas was a record in 2019, the year in which
353   there was weak El Niño, with water deficits equivalent to the years 2017 and 2018
354   (visible in Figure S3 in the Supplementary Material).
355
12
(a) 140.000
Bunerd MCWD
100
burning in already-deforested (ha)
120.000 0
100.000 -100
MCWD (mm)
80.000 -200
60.000 -300
40.000 -400
20.000 -500
0 -600
east central west east central west east central west east central west
2016 2017 2018 2019
(b) 1.000.000
Forest fire MCWD
100
100.000 0
-100
10.000
MCWD (mm)
Forest fire (ha)
-200
1.000
-300
100
-400
10 -500
1 east central west east central west east central west east central west
-600
2016 2017 2018 2019
356
357 Fig. 8 Temporal relationship between (a) maximum cumulative water deficit (MCWD)
358 and burning in already-deforested areas and (b) MCWD and forest-fire area in the state
359 of Acre from 2016 to 2019 in the three regions analyzed (east, central and west regions).
360
361 4. Discussion
362 4.1. Impact of burning in already-deforested areas
363 This study retrieved georeferenced and time-varying data on burning in already-
364 deforested areas. This provides an important complement to the widely used PRODES
365 deforested-area product from the Brazil’s National Institute for Space Research (INPE)
366 (INPE, 2020c). The main addition to the already-available fire products from INPE,
367 namely active-fire point detections (“hot pixels”) and the new burned-area product
368 (INPE, 2020d), is the greater accuracy of our data due their higher spatial resolution,
369 with which the extent of burned areas is measured (70 m in the new product versus 1
370 km in the INPE products). The information presented by this study allows visualization
371 of burned areas as small as 0.5 ha in area, allowing assessment of the annual burning
372 rate for 2016-2019, in which fire frequency and extent achieved record breaking levels
373 in the Amazon. The data presented here provide a valuable expansion of the information
374 available for policymakers.
375 Our results indicate that 2019 had the largest area of burning in already-deforested
376 areas in Acre, 80% greater than 2018 and even 4% greater than the area burned during
377 the El Niño in 2016. The proportion of fires in recently deforested land was higher in13 378 2018 and 2019. In 2019, the contribution was 41%, following the trend of increasing 379 deforestation in Acre (INPE, 2020c). 380 The contribution of areas larger than 10 ha to the total area of burning in already- 381 deforested areas was greater in 2019 than in 2017 and 2018, representing 32% of the 382 total area mapped. Fire in areas larger than 50 ha represented an average of 18% of the 383 total burned area we mapped over the whole period, with peaks reaching 26% in the 384 2016 and 2019. These areas are usually associated with extensive cattle ranching 385 (EMBRAPA, 2017); they amount to 66% of the deforested area in Acre. The areas are 386 in medium and large landholdings and represent the main source of ignition for forest 387 fires in Amazonia (Cano-Crespo et al., 2015; Dias Filho, 2011). 388 Deforestation rates have been increasing throughout Brazilian Amazonia since 389 2012 (INPE, 2020c) and our results show that the increasing trend in fires associated 390 with this was maintained and that it accelerated with an upward surge in the 2019. A 391 likely future trend of increased deforestation would be associated with still more fires. 392 Aragão et al. (2018) divided Brazilian Amazonia into one-degree grid cells and showed 393 that, although fire increases in grid cells where deforestation increases, there is also a 394 very large amount of forest burned in grid cells without increased deforestation, and that 395 in the 2015 drought fires burned large areas of forest throughout the region independent 396 of the amount of deforestation. 397 398 4.2. Impact of forest fire 399 The fact that major forest fires occurred in Acre in 2019 despite this not being a 400 year of extreme drought, when all other years without extreme droughts had almost no 401 forest fires, reflects the virulently anti-environmental rhetoric and policies currently in 402 place. Among the years analyzed, it was only in 2016 that an extreme drought event was 403 recorded, when the El Niño was very strong (NOAA, 2020). 404 The size of the largest mapped areas of forest fires reflect the magnitude of the 405 fires, showing the size of the spread of the fire. In 2016, we had a maximum area with 406 size of 3900 ha (mean = 38 ha, median = 10 ha). In 2019, we mapped a maximum areas 407 of 350 ha (mean = 17 ha, median = 5 ha), which was greater than in any year without 408 extreme droughts recorded by Silva et al. (2018). 409 The relationship between droughts and forest fires is different from the 410 relationship with burned areas, where the occurrence of fires observed in this study 411 coincided with rainfall deficit below -180 mm. Burning after deforestation was shown 412 to occur throughout Acre. The concentration of forest fires in the analyzed period 413 (2016-2019) was in the eastern region of Acre, which is a historically drier region 414 compared to the other regions of Acre (Aragão et al., 2007). In 2019, forest fires 415 occurred only in this region, where the largest areas were located near the triple national 416 boundary where Brazil, Peru and Bolivia meet and where a drought was recorded with 417 MCWD of -240 mm (Supplementary Material Figure S3). The concentration of large 418 fires in specific regions may be a reflection of the fact that the climate in the 419 southwestern portion of Amazonia is getting progressively drier, as reported by Aragão 420 et al. (2008), Fu et al. (2013) and Staal et al. (2018). 421 Projections for the future indicate that Acre is among the areas with the greatest 422 risk of prolonged drought periods and major forest fires (Faria et al., 2017; Fu et al., 423 2013). These scenarios cause ecological concerns regarding the degradation of forests 424 and loss of biodiversity (Barlow et al., 2016). This also has implications for the state’s 425 economy (Campanharo et al., 2019; Mendonça et al., 2004) and public health 426 (Machado-Silva et al., 2020; Morello et al., 2019). Policy concerns include loss of the 427 benefits from REDD (reducing emissions from deforestation and forest degradation),
14

428   which is under implementation in Acre through the Acre-California agreement (Acre,
429   2013).
430
431   4.3. The prominence of the 2019 fires may hide a worrying trend
432           Aside from the anomalous 2016 El Niño year, 2019 was outstanding in terms of
433   total burned area and also in terms of forest area burned. Since this was also true for the
434   annual deforestation rate, which increased to a level over 150% of the average for the
435   2016-2019 it may be the case that a new trend of greater forest suppression and
436   degradation was started in 2019. Additional evidence comes from the significant
437   negative correlation of 62% between burned area and water deficit. This shows that
438   climate was not behind the record fires in 2019 (Barlow et al., 2019), suggesting these
439   fires were intentional and were not unintended accidental fires (Stabile et al., 2020).
440           Institutional change favoring deforestation and fires is another new trend. Barlow
441   et al. (2019) argued that the deforestation policy under the presidential administration
442   that began in January 2019 deviated from the successful approach of 2004-2012, a
443   reference to the Action Plan for Prevention and Control of Amazon Deforestation
444   (PPCDAM), which, together with macroeconomic factors, helped reduce the annual
445   deforestation in Brazilian Amazonia by 84% in the decline that ended in 2012 (West et
446   al., 2019; West and Fearnside, 2021). The current federal administration has weakened
447   institutional enforcement capacity, resorting to an emergency approach to
448   environmental policy (Ferrante and Fearnside, 2019; Pereira et al., 2019). The
449   administration’s discourse has led deforesters to believe that violations of
450   environmental laws will be forgiven and that regulations will be further relaxed
451   (Klingler and Mack, 2020). The combination of concrete institutional changes and anti-
452   environmental discourse encourages both deforestation and burning, even when the
453   government attempts to reverse this effect.
454           The government decreed a moratorium on fires for 60 days in August 2019, and a
455   120-day ban was decreed in 2020 (Brazil, 2019). Military enforcement of these bans did
456   not prevent large amounts of deforestation and burning (Finer et al., 2020; Moutinho et
457   al., 2020; OC, 2020), and the federal environmental agencies that the presidential
458   administration has largely dismantled have not had their surveillance and enforcement
459   capacities restored. Another controversial case was that Brazil’s Amazonian fire crisis is
460   caused by indigenous people and subsistence farming by traditional communities
461   (Ferrante et al., 2020). However, our results show that in all years evaluated in Acre
462   only 1 to 2% of the total burning was in Indigenous Lands and 11 to 14% was in
463   conservation units (which include extractive reserves inhabited by traditional
464   communities) (Figure 5a); in contrast, 32 to 35% was in undesignated public land,
465   which is the primary target of large land grabbers (grileiros).
466
467   4.4. Protected areas are under increased pressure
468          Despite 2019 not having the largest area of forest burned, the year stood out in the
469   share of the burning that was in conservation units and Indigenous Lands (hereafter,
470   “protected areas”). The conjecture that at least part of the burning envisaged illegal
471   occupation of protected areas is supported by recent studies (Keles et al., 2020). These
472   use remote sensing to show the routine transgression of the legal constraints on land use
473   that involve deforestation and fires, in addition to land-grabbing (grilagem). They also
474   demonstrate that forest suppression and degradation are used as a strategy for pressuring
475   institutions to dismember protected areas or withdraw their protected status.
476          Among the protected areas, the Chico Mendes Extractive Reserve is under the
477   most social, political and economic pressure (Hoelle, 2011; Mascarenhas et al., 2018;
15

478   Vadjunec et al., 2009). This protected area represented 43 to 66% of the total burning in
479   already-deforested portions of protected areas. Between the 2018 and 2019, burning in
480   already-deforested areas in this extractive reserve increased by 340%. According to
481   Fearnside et al. (2018), the Chico Mendes Extractive Reserve had the fourth largest loss
482   of forest by 2014 of the 73 extractive reserves of the Brazilian Amazon. This protected
483   area is under strong pressure from deforestation, driven by the appreciation of livestock,
484   invasion of land and devaluation of forest productive chains such as rubber and Brazil
485   nuts (Hoelle, 2011; Vadjunec et al., 2009). Even though conservation units are
486   identified as a barriers to deforestation and burning (Pfaff et al., 2014), the results
487   presented here must be taken as an important warning sign with regard to their
488   preservation.
489
490   4.5. Stricter land and environmental policies could bring great gains
491          The fact that the greatest share of the area burned (65%) was in areas owned by
492   government demonstrates that the bulk of Brazil’s Amazon burning is due to weak
493   enforcement, as has also been the case for deforestation (Araujo et al., 2009). In
494   addition, the share of burned areas above 50 ha in area, which peaked in 2019, suggests
495   that medium to large landholders play a relevant role in fire-assisted land-cover change,
496   which is another parallel with deforestation (Cano-Crespo et al., 2015; Dias Filho, 2011;
497   Godar et al., 2014). Therefore, there are two reasons why more rigorous policy would
498   bring great gains. First, avoiding deforestation in government-owned land is saving
499   economically valuable resources for current and future generations of Brazilians, which
500   is a duty of the government (Stabile et al., 2020). Second, large areas and landholdings
501   are detected with less error than smaller ones, and targeting them is more cost-effective
502   (Godar et al., 2014). This means that there is a clear opportunity for more rigorous
503   policy to deliver significant outcomes.
504
505   5. Conclusions
506          A novel high-resolution measurement of the areal extent of fires was developed as
507   part of this study and was applied to the case of Brazil’s state of Acre, whose leadership
508   in sustainability has been challenged by rising amounts of fire and deforestation. Two
509   classes of fire were investigated: burning in already-deforested areas and forest fires.
510   The spatial and temporal patterns showed the prominence of 2019 fires in both classes
511   and the propensity of a given location to burn more than once. Significant correlations
512   that were positive with deforestation and negative with water deficit were also found, as
513   well as the dominance of federal lands, including protected areas, among the land
514   classes with large areas burned. The importance of burns above 50 ha in area shows the
515   role of large actors. Importantly, it was shown that climate was not a driver of the 2019
516   fire season. This adds evidence to attributing the upsurge to the discourse and policies
517   of Brazil’s presidential administration that began in January 2019.
518          Our arguments arrive at a moment when the needed changes to preserve Acre’s
519   regional leadership in sustainability are still possible. Authorities should undertake
520   strong action and target budgetary resources for surveillance and enforcement of
521   environmental restrictions. Authorities must also alter their discourse to emit signals
522   consistent with sustainability.
523          One important limitation of the analysis, and also a task for future study, is the
524   lack of precise investigation of which, among relevant biophysical, climatic,
525   socioeconomic and institutional factors, are the main predictors of burned area. This
526   would improve the usefulness of the data generated here for policy planning, including
527   the positioning of fire brigades.
16

528
529   Acknowledgments
530         This study was supported by CNPq/Prevfogo-Ibama Nº 33/2018 AcreQueimadas
531   Project, FAPAC Nº 03/2013, IAI Project MAPFIRE. PMF thanks CNPq (311103/2015-
532   4). L.E.O.C.A. was supported by CNPq (processes 305054/2016-3).
533
534   References
535   Acre, 2013. Sistema de incentivo a serviços ambientais. Rio Branco.
536   https://bityl.co/4uDM
537   Acre, 2010. Zoneamento Ecológico-Econômico do Estado do Acre: Fase II (Escala
538        1:250.000), 2nd ed. SEMA, Rio Branco. https://amz.run/49BR
539   Acre, 2018. Plano Estadual de Prevenção e Controle do Desmatamento e Queimadas do
540        Acre - 2017-2020.
541   Alencar, A., Brando, P.M., Asner, G.P., Putz, F.E., 2015. Landscape fragmentation,
542        severe drought, and the new Amazon forest fire regime. Ecol. Appl. 25, 1493–1505.
543        https://doi.org/10.1890/14-1528.1
544   Anderson, L.O., Aragão, L.E.O.C., Gloor, M., Arai, E., Adami, M., Saatchi, S.S.,
545        Malhi, Y., Shimabukuro, Y.E., Barlow, J., Berenguer, E., Duarte, V., 2015.
546        Disentangling the contribution of multiple land covers to fire-mediated carbon
547        emissions in Amazonia during the 2010 drought. Glob. Biogeochem. Cycles 29,
548        1739–1753. https://doi.org/10.1002/2014GB005008
549   Anderson, L.O., Cheek, D., Aragao, L.E., Andere, L., Duarte, B., Salazar, N., Lima, A.,
550        Duarte, V., Arai, E., 2017. Development of a Point-based Method for Map
551        Validation and Confidence Interval Estimation: A Case Study of Burned Areas in
552        Amazonia. J. Remote Sens. GIS 06. https://doi.org/10.4172/2469-4134.1000193
553   Aragão, L.E.O.C., Anderson, L.O., Fonseca, M.G., Rosan, T.M., Vedovato, L.B.,
554        Wagner, F.H., Silva, C.V.J., Junior, C.H.L.S., Arai, E., Aguiar, A.P., Barlow, J.,
555        Berenguer, E., Deeter, M.N., Domingues, L.G., Gatti, L., Gloor, M., Malhi, Y.,
556        Marengo, J.A., Miller, J.B., Phillips, O.L., Saatchi, S., 2018. 21st Century drought-
557        related fires counteract the decline of Amazon deforestation carbon emissions. Nat.
558        Commun. 9, 536. https://doi.org/10.1038/s41467-017-02771-y
559   Aragão, L.E.O.C., Malhi, Y., Barbier, N., Lima, A., Shimabukuro, Y.E., Anderson, L.,
560        Saatchi, S., 2008. Interactions between rainfall, deforestation and fires during
561        recent years in the Brazilian Amazonia. Philos. Trans. R. Soc. B Biol. Sci. 363,
562        1779–1785. https://doi.org/10.1098/rstb.2007.0026
563   Aragão, L.E.O.C., Malhi, Y., Roman-Cuesta, R.M., Saatchi, S., Anderson, L.O.,
564        Shimabukuro, Y.E., 2007. Spatial patterns and fire response of recent Amazonian
565        droughts. Geophys. Res. Lett. 34, 1–5. https://doi.org/10.1029/2006GL028946
566   Araujo, C., Bonjean, C.A., Combes, J.-L., Combes Motel, P., Reis, E.J., 2009. Property
567        rights and deforestation in the Brazilian Amazon. Ecol. Econ. 68, 2461–2468.
568        https://doi.org/10.1016/j.ecolecon.2008.12.015
569   Barlow, J., Berenguer, E., Carmenta, R., França, F., 2019. Clarifying Amazonia’s
570        burning crisis. Glob. Change Biol. 26, 1–3. https://doi.org/10.1111/gcb.14872
571   Barlow, J., Lennox, G.D., Ferreira, J., Berenguer, E., Lees, A.C., Nally, R.M.,
572        Thomson, J.R., Ferraz, S.F. de B., Louzada, J., Oliveira, V.H.F., Parry, L., Solar,
573        R.R.C., Vieira, I.C.G., Aragão, L.E.O.C., Begotti, R.A., Braga, R.F., Cardoso,
574        T.M., Oliveira Jr, R.C. de, Souza Jr, C.M., Moura, N.G., Nunes, S.S., Siqueira,
575        J.V., Pardini, R., Silveira, J.M., Vaz-de-Mello, F.Z., Veiga, R.C.S., Venturieri, A.,
576        Gardner, T.A., 2016. Anthropogenic disturbance in tropical forests can double
17

577       biodiversity loss from deforestation. Nature 535, 144–147.
578       https://doi.org/10.1038/nature18326
579   Brando, P.M., Soares-Filho, B., Rodrigues, L., Assunção, A., Morton, D.,
580       Tuchschneider, D., Fernandes, E.C.M., Macedo, M.N., Oliveira, U., Coe, M.T.,
581       2020. The gathering firestorm in southern Amazonia. Sci. Adv. 6, eaay1632.
582       https://doi.org/10.1126/sciadv.aay1632
583   Brazil, 2019. Decreto no 9.985, de 23 de agosto de 2019. https://bityl.co/4uDT
584   Campanharo, W.A., Lopes, A.P., Anderson, L.O., da Silva, T.F.M.R., Aragão,
585       L.E.O.C., 2019. Translating fire impacts in southwestern Amazonia into economic
586       costs. Remote Sens. 11, 764. https://doi.org/10.3390/rs11070764
587   Cano-Crespo, A., Oliveira, P.J.C., Boit, A., Cardoso, M., Thonicke, K., 2015. Forest
588       edge burning in the Brazilian Amazon promoted by escaping fires from managed
589       pastures. J. Geophys. Res. Biogeosciences 120, 2015JG002914.
590       https://doi.org/10.1002/2015JG002914
591   Dias Filho, M.B., 2011. Os desafios da produção animal em pastagens na fronteira
592       agrícola brasileira. Revista Brasileira de Zootecnia 40, 243–252.
593       https://bityl.co/4uDY
594   EMBRAPA (Empresa Brasileira de Pesquisa Agropecuária), 2017. TerraClass 2014.
595       https://bityl.co/4uDa
596   Faria, B.L.D., Brando, P., Macedo, M., Panday, P., Soares-Filho, B., Coe, M., 2017.
597       Current and future patterns of fire-induced forest degradation in Amazonia.
598       Environ. Res. Lett. 119601. https://doi.org/10.1088/1748-9326/aa69ce
599   Fearnside, P.M., 2005. Deforestation in Brazilian Amazonia: History, rates, and
600       consequences. Conserv. Biol. 19, 680–688. https://doi.org/10.1111/j.1523-
601       1739.2005.00697.x
602   Fearnside, P.M., Nogueira, E.M., Yanai, A.M., 2018. Maintaining carbon stocks in
603       extractive reserves in Brazilian Amazonia. Desenvolv. e Meio Ambiente 48.
604       https://doi.org/10.5380/dma.v48i0.58780
605   Ferrante, L., Fearnside, P.M., 2019. Brazil’s new president and ‘ruralists’ threaten
606       Amazonia’s environment, traditional peoples and the global climate. Environ.
607       Conserv. 46, 261–263. https://doi.org/10.1017/S0376892919000213
608   Ferrante, L., Fearnside, P.M., 2020. Military forces and COVID-19 as smokescreens for
609       Amazon destruction and violation of indigenous rights. Die Erde 151(4).
610       https://doi.org/10.12854/erde-2020-542
611   Ferrante, L., Leite, L., da Silva Junior, C.A., Lima, M., Coelho Junior, M.G., Fearnside.
612       P.M. 2020. Brazil's biomes threatened: President Bolsonaro lied to the world.
613       Nature Research Ecology and Evolution Community, 22 October 2020.
614       https://bityl.co/4ueU
615   Finer, M., Vale, H., Villa, L., Nicolau, A., 2020. Amazon fire trackers 2020: Over 500
616       illegal major fires in Brazilian Amazon. Monitoring of the Andean Amazon Project
617       (MAAP). https://bityl.co/4uDc
618   Fonseca, M.G., Alves, L.M., Aguiar, A.P.D., Arai, E., Anderson, L.O., Rosan, T.M.,
619       Shimabukuro, Y.E., Aragão, L.E.O.C., 2019. Effects of climate and land-use
620       change scenarios on fire probability during the 21st century in the Brazilian
621       Amazon. Glob. Change Biol. 25, 2931–2946. https://doi.org/10.1111/gcb.14709
622   Fu, R., Yin, L., Li, W., Arias, P.A., Dickinson, R.E., Huang, L., Chakraborty, S.,
623       Fernandes, K., Liebmann, B., Fisher, R., Myneni, R.B., 2013. Increased dry-season
624       length over southern Amazonia in recent decades and its implication for future
625       climate projection. Proc. Natl. Acad. Sci. U. S. A. 110, 18110–18115.
626       https://doi.org/10.1073/pnas.1302584110
18

627   Godar, J., Gardner, T.A., Tizado, E.J., Pacheco, P., 2014. Actor-specific contributions
628       to the deforestation slowdown in the Brazilian Amazon. Proc. Natl. Acad. Sci. 111,
629       15591–15596. https://doi.org/10.1073/pnas.1322825111
630   Hoelle, J., 2011. Convergence on cattle: political ecology, social group perceptions, and
631       socioeconomic relationships in Acre, Brazil. Cult. Agric. Food Environ. 33, 95–
632       106. https://doi.org/10.1111/j.2153-9561.2011.01053.x
633   IBGE (Instituto Brasileiro de Geografia e Estatística), 2019. Síntese de indicadores
634       sociais: Uma análise das condições de vida da população brasileira 2019. IBGE,
635       Rio de Janeiro. https://bityl.co/4uDb
636   IBGE (Instituto Brasileiro de Geografia e Estatística), 2016. Municipal boundaries.
637       https://geoftp.ibge.gov.br/organizacao_do_territorio/malhas_territoriais/malhas_mu
638       nicipais/municipio_2019/UFs/AC/ac_municipios.zip
639   INPE (Instituto Nacional de Pesquisas Espaciais), 2020a. Sistema de Detecção do
640       Desmatamento em Tempo Real (DETER). https://bityl.co/4uDd
641   INPE (Instituto Nacional de Pesquisas Espaciais), 2020b. Banco de Dados de
642       Queimadas. https://bityl.co/4uDg
643   INPE (Instituto Nacional de Pesquisas Espaciais), 2020c. Project PRODES -
644       Monitoring of the Brazilian Amazon Forest by satellite. https://bityl.co/4uDh
645   INPE (Instituto Nacional de Pesquisas Espaciais), 2020d. Estimativa de área queimadas
646       com 1 km de resolução espacial.
647   Jiménez-Muñoz, J.C., Mattar, C., Barichivich, J., Santamaría-Artigas, A., Takahashi,
648       K., Malhi, Y., Sobrino, J.A., Schrier, G. van der, 2016. Record-breaking warming
649       and extreme drought in the Amazon rainforest during the course of El Niño 2015–
650       2016. Sci. Rep. 6. https://doi.org/10.1038/srep33130
651   Keles, D., Delacote, P., Pfaff, A., Qin, S., Mascia, M.B., 2020. What drives the erasure
652       of protected areas? Evidence from across the Brazilian Amazon. Ecological
653       Economics, 176, art. 106733, https://doi.org/10.1016/j.ecolecon.2020.106733
654   Klingler, M., Mack, P., 2020. Post-frontier governance up in smoke? Free-for-all
655       frontier imaginations encourage illegal deforestation and appropriation of public
656       lands in the Brazilian Amazon. J. Land Use Sci. 0, 1–15.
657       https://doi.org/10.1080/1747423X.2020.1739765
658   Lewis, S.L., Brando, P.M., Phillips, O.L., Heijden, G.M.F. van der, Nepstad, D.C.,
659       2011. The 2010 Amazon drought. Science 331, 554–554.
660       https://doi.org/10.1126/science.1200807
661   Machado-Silva, F., Libonati, R., Lima, T.F.M., Peixoto, R.B., França, J.R. de A.,
662       Magalhães, M. de A.F.M., Santos, F.L.M., Rodrigues, J.L.M., DaCamara, C.C.,
663       2020. Drought and fires influence the respiratory diseases hospitalizations in the
664       Amazon. Ecol. Indic. 109, 105817. https://doi.org/10.1016/j.ecolind.2019.105817
665   Mascarenhas, F. de S., Brown, I.F., Silva, S.S. da, 2018. Desmatamento e incêndios
666       florestais transformando a realidade da Reserva Extrativista Chico Mendes. Rev.
667       Desenvolv. e Meio Ambiente 48. https://doi.org/10.5380/dma.v48i0.58826
668   Mendonça, M.J.C., Vera Diaz, M. del C., Nepstad, D.C., Seroa da Motta, R., Alencar,
669       A., Gomes, J.C., Ortiz, R.A., 2004. The economic cost of the use of fire in the
670       Amazon. Ecol. Econ. 49, 89–105. https://doi.org/10.1016/j.ecolecon.2003.11.011
671   Morello, T., Martino, S., Duarte, A.F., Anderson, L., Davis, K.J., Silva, S., Bateman,
672       I.J., 2019. Fire, tractors, and health in the Amazon: A cost-benefit analysis of fire
673       policy. Land Econ. 95, 409–434. https://doi.org/10.3368/le.95.3.409
674   Morton, D.C., Page, Y.L., DeFries, R.S., Collatz, G.J., Hurtt, G.C., 2013. Understorey
675       fire frequency and the fate of burned forests in southern Amazonia. Philos. Trans.
676       R. Soc. B Biol. Sci. 368. https://doi.org/10.1098/rstb.2012.0163
19

677   Moutinho, P., Alencar, A., Rattis, L., Arruda, Vera, Castro, I., Artaxo, P., 2020.
678       Amazônia em chamas: Desmatamento e fogo em tempos de COVID-19. Instituto
679       de Pesquisa Ambiental da Amazônia (IPAM), Brasília. https://bityl.co/4uDo
680   NOAA, 2020. El Niño and La Niña years and intensities based on Oceanic Niño Index
681       (ONI). https://bityl.co/4uDj
682   OC, 2020. Queimadas em agosto confirmam que Exército fracassou na Amazônia. Obs.
683       Clima. https://bityl.co/4uDk
684   Pereira, E.J. de A.L., Ferreira, P.J.S., Ribeiro, L.C. de S., Carvalho, T.S., Pereira, H.B.
685       de B., 2019. Policy in Brazil (2016–2019) threaten conservation of the Amazon
686       rainforest. Environ. Sci. Policy 100, 8–12.
687       https://doi.org/10.1016/j.envsci.2019.06.001
688   Pessôa, A.C.M., Anderson, L.O., Carvalho, N.S., Campanharo, W.A., Junior, C.H.L.S.,
689       Rosan, T.M., Reis, J.B.C., Pereira, F.R.S., Assis, M., Jacon, A.D., Ometto, J.P.,
690       Shimabukuro, Y.E., Silva, C.V.J., Pontes-Lopes, A., Morello, T.F., Aragão,
691       L.E.O.C., 2020. Intercomparison of Burned Area Products and Its Implication for
692       Carbon Emission Estimations in the Amazon. Remote Sens. 12, 3864.
693       https://doi.org/10.3390/rs12233864
694   Pfaff, A., Robalino, J., Lima, E., Sandoval, C., Herrera, L.D., 2014. Governance,
695       location and avoided deforestation from protected areas: Greater restrictions can
696       have lower impact, due to differences in location. World Dev 55, 7–20.
697       https://doi.org/10.1016/j.worlddev.2013.01.011
698   Silva, S.S., Fearnside, P.M., Graça, P.M.L.A., Brown, I.F., Alencar, A., de Melo,
699       A.W.F., 2018. Dynamics of forest fires in the southwestern Amazon. For. Ecol.
700       Manag. 424, 312–322. https://doi.org/10.1016/j.foreco.2018.04.041
701   Staal, A., Tuinenburg, O.A., Bosmans, J.H.C., Holmgren, M., Nes, E.H. van, Scheffer,
702       M., Zemp, D.C., Dekker, S.C., 2018. Forest-rainfall cascades buffer against drought
703       across the Amazon. Nat. Clim. Change 8, 539. https://doi.org/10.1038/s41558-018-
704       0177-y
705   Stabile, M.C.C., Guimarães, A.L., Silva, D.S., Ribeiro, V., Macedo, M.N., Coe, M.T.,
706       Pinto, E., Moutinho, P., Alencar, A., 2020. Solving Brazil’s land use puzzle:
707       Increasing production and slowing Amazon deforestation. Land Use Policy 91,
708       104362. https://doi.org/10.1016/j.landusepol.2019.104362
709   Tasker, K.A., Arima, E.Y., 2016. Fire regimes in Amazonia: The relative roles of policy
710       and precipitation. Anthropocene 14, 46–57.
711       https://doi.org/10.1016/j.ancene.2016.06.001
712   Thomaz, S.M., Bustamante, M.M.C., Pillar, V.D., Val, A.L., Turra, A., Viana, B.F.,
713       Nobre, C.A., Joly, C.A., Cunha, C.N. da, Seixas, C.S., Adams, C., Nova, D.V.,
714       Viola, E.J., Bernard, E., Fischer, E.A., Scarano, F.R., Araújo, F.S. de, Giulio, G.M.
715       di, Fernandes, G.W.A., Sparovek, G., Overbeck, G.E., Ganade, G.M.S., Romero,
716       G., Queiroz, H.L., Bergallo, H.G., Vieira, I.C.G., Metzger, J.P.W., Ometto, J.P.,
717       Ferreira, J.N., Filho, J.A.F.D., Orsini, J.A.M., Sabino, J., Gonçalves, L., Maia, L.C.,
718       Gerhardinger, L.C., Garcia, L.C., Aguiar, L.M.S., Martinelli, L.A., Tabarelli, M.,
719       Marques, M.C.M., Copertino, M.S., Alves, M.A.S., Cunha, M.M.L.C. da, Piedade,
720       M.T.F., Dechoum, M., Netto, P.E.A., Rocha, P.L.B. da, Loyola, R.D., Cordeiro,
721       R.S.B., Machado, R.B., Rodrigues, R.R., Menezes, R.S.C., Filho, R.B.F., Floeter,
722       S.R., Gadda, T.M.C., Lewinsohn, T.M., 2020. Re: Biodiversity under concerted
723       attack in Brazil. Science. https://doi.org/10.1126/science.aaw8276
724   Vadjunec, J.M., Gomes, C.V.A., Ludewigs, T., 2009. Land-use/land-cover change
725       among rubber tappers in the Chico Mendes Extractive Reserve, Acre, Brazil. J.
726       Land Use Sci. 4, 249–274. https://doi.org/10.1080/17474230903222499
You can also read