Discovery of a heme-binding domain in a neuronal voltage-gated potassium channel
←
→
Page content transcription
If your browser does not render page correctly, please read the page content below
JBC Papers in Press. Published on July 28, 2020 as Manuscript RA120.014150
        The latest version is at https://www.jbc.org/cgi/doi/10.1074/jbc.RA120.014150

Discovery of a heme-binding domain in a neuronal voltage-gated potassium

                                                channel

Mark J Burton‡,*, Joel Cresser-Brown§,*, Morgan Thomas‡, Nicola Portolano‡, Jaswir Basran¶, Samuel,
 L, Freeman§, Hanna Kwon§, Andrew R. Bottrill†, Manuel J Llansola-Portoles , Andrew A. Pascal ,
 Rebekah Jukes-Jones§§, Tatyana Chernova§§, Ralf Schmid¶, Noel W Davies¶, Nina M Storey¶, Pierre
                 Dorlet||, Peter C E Moody¶, John S Mitcheson¶ and Emma L Raven§,1
‡
   Department of Chemistry and Leicester Institute of Structural and Chemical Biology, University of
Leicester, Leicester, LE1 7RH, England.
§
   School of Chemistry, University of Bristol, Cantock’s Close, Bristol, BS8 1TS, UK.
¶
   Department of Molecular and Cell Biology and Leicester Institute of Structural and Chemical Biology,
University of Leicester, Leicester, LE1 9HN, England.
†
   Protein Nucleic Acid Chemistry Laboratory, Hodgkin Building, University of Leicester, LE1 9HN,
UK.
   Université Paris-Saclay, CEA, CNRS, Institute for Integrative Biology of the Cell (I2BC), 91198, Gif-
sur-Yvette, France.
§§
    MRC Toxicology Unit, University of Cambridge, Lancaster Rd, Leicester, LE1 9HN, UK.

                                                                                                                  Downloaded from http://www.jbc.org/ by guest on November 15, 2020
||
   CNRS, Aix Marseille Univ, BIP, Marseille, France.
1
   To whom correspondence should be addressed. School of Chemistry, University of Bristol, Cantock’s
Close, Bristol, BS8 1TS, UK. Telephone: +44 (0)117 9287647; E-mail: emma.raven@bristol.ac.uk.

                             Running title: A heme-binding domain in hERG3.

Keywords: heme, hERG3, ion channel, PAS domain, Cap domain, heme regulation.
1
 To whom correspondence should be addressed. School of Chemistry, University of Bristol, Cantock’s
Close, Bristol, BS8 1TS, UK. Telephone: +44 (0)117 9287647; E-mail: emma.raven@bristol.ac.uk.
*
    These authors contributed equally to this work.

ABSTRACT                                                  observations are discussed in the context of the
The ether-à-go-go (EAG) family of voltage gated           emerging role for heme as a regulator of ion
K+ channels are important regulators of neuronal          channel activity in cells.
and cardiac action potential firing (excitability)
and have major roles in human diseases such as            INTRODUCTION
epilepsy, schizophrenia, cancer and sudden
cardiac death. A defining feature of EAG (Kv10-           PAS (Per-ARNT-Sim) domains, first identified by
12) channels is a highly conserved domain on the          sequence homology in the Drosophila proteins
amino-terminus, known as the eag-domain,                  period and single-minded, and the vertebrate aryl
consisting of a PAS domain capped by a short              hydrocarbon receptor nuclear transporter
sequence containing an amphipathic helix (Cap-            (ARNT), are well known sensory modules present
domain). The PAS and Cap domains are both vital           in a variety of signalling proteins in organisms
for the normal function of EAG channels. Using            ranging from bacteria to humans (1-3). PAS
heme-affinity pull-down assays and proteomics of          domains demonstrate considerable plasticity in
lysates from primary cortical neurons, we                 binding different biologically-relevant ligands.
identified that an EAG channel, hERG3 (Kv11.3),           Relevant in the context of this work is their ability
binds to heme. In whole cell electrophysiology            to bind heme as a ligand. The ligand binding event
experiments, we identified that heme inhibits             is significant as it can act as a primary trigger to
hERG3 channel activity. In addition, we                   initiate a cellular signalling / regulatory response;
expressed the Cap and PAS domain of hERG3 in              or, it can provide the PAS domain with a capacity
E.coli and, using spectroscopy and kinetics,              to respond to secondary physical or chemical
identified the PAS domain as the location for             signals (such as binding of gas molecules, changes
heme binding. The results identify heme as a              in redox potential, or light activation). In the case
regulator of hERG3 channel activity. These                of heme as a ligand, there are several examples of

                                                      1
heme-binding PAS domains that act as biological           1-135) which itself comprises a Cap domain
regulators in cells, for example the O2 sensor            (residues 1-25) and a Per-ARNT-Sim (PAS)
proteins (e.g. FixL, E. coli DOS) and the                 domain (residues 26-135).
transcriptional regulators involved in circadian          Heme binding to the hERG3-eag domain. We
control (e.g. nPAS2, CLOCK, Rev-ERB, Per)                 expressed the Cap domain (residues 1-26) and the
(4,5).                                                    PAS (27-135) domain of the hERG3 protein as an
Several layers of regulatory control can be               N-terminal His6/S-tagged fusion protein in E.coli
envisaged in the process of heme binding to a PAS         (Figs. 1 and S2); we will refer to this protein as
domain protein. Heme binding might, for                   hERG3-eag. On addition of heme to hERG3-eag,
example, induce a conformational change in the            Fig. 2A, a species with Soret bands at 420 and 370
PAS domain which affects the interactions with            nm is observed, which we assign as arising from
partner proteins, and there is evidence for this in       six- and five- coordinated heme, respectively.
the heme-binding circadian proteins (6). And              There is also a broad absorption envelope at 500-
since known cell sigalling gases such as carbon           600 nm and a ligand-to-metal charge transfer band
monoxide (CO), nitric oxide (NO) and dioxygen             at 650 nm (Fig. 2A). These bands are similar to
(O2) all bind to heme (and with different                 those reported for heme bound to proteins through
affinities), then the formation of a heme-bound           Cys, Cys/His or Cys/X coordination (Table S1
PAS domain opens opportunities for the molecule           (8)). The presence of two bands in the Soret region
to also respond to changes in concentrations of any       is indicative of heterogeneity, which may arise
or all of these cell signalling gases. Thinking in        either from changes in axial ligands or from

                                                                                                                  Downloaded from http://www.jbc.org/ by guest on November 15, 2020
these terms, it may not be a coincidence that CO          different orientations of the bound heme (8-10).
and NO production in cells is catalysed by two            The ligands to the heme in hERG3 were not
heme-containing proteins – heme oxygenase and             identified. The affinity of ferric heme for hERG3-
nitric oxide synthase, respectively – both of which       eag was determined by titration (Kd = 7.02 ± 0.35
are themselves O2-dependent. This interplay of            μΜ, Fig. 2A, inset top). Heme affinity can also be
heme- and gas-responsive PAS domains could                extracted from the first-order rate constant for
provide the cell with highly versatile mechanisms         transfer of heme to apo-myoglobin (which has a
for regulatory control, that are at the same time         very high affinity for heme (11)); we measured
responsive to changing concentrations of heme,            this rate constant as koff = 0.03 s-1 (Fig. 2A, inset
O2, CO or NO. How these mechanisms play out               bottom), which is several orders of magnitude
has yet to be fully established.                          higher than for the globins and more in the range
In this paper, we present evidence from                   observed for other regulatory heme proteins (12).
electrophysiological experiments for heme-                Spectroscopic analysis of heme binding.
dependent modulation of hERG3 (human ether-à-             Resonance Raman spectroscopy was used to
go-go related gene 3, alternatively known as              provide more quantitative insight into the
Kv11.3). We identify an interaction of heme with          interaction of hERG3-eag with heme. In the high-
a PAS domain contained within the channel. Our            frequency region, the spectrum of free heme
results provide insight on the role of heme in            displays the distinctive features of a ferric five-
channel regulation; we use this to discuss how            coordinate high-spin complex (5c-HS), with
heme-induced structural changes might be used to          characteristic bands at 1372 (v4), 1490 (v3), and
control channel function .                                1570 cm-1 (v2) (Fig. 2B(i)). The v10 mode of the 5c-
                                                          HS species is hidden by the vinyl stretching bands
                    RESULTS                               expected in the 1610- to 1640 cm-1 region (1618
Proteomics analyses. We sought to identify                cm-1 for the in-plane and 1628 cm-1 for the out-of-
potential heme binding proteins in neuronal               plane vinyl group (13)). The ferric hERG3-eag-
lysates from primary cortical neurons, using              heme complex shows significant differences from
heme-affinity     chromatography      and    mass         free heme (Fig. 2B(ii)). All the modes described
spectrometry. Using this approach, we identified a        for ferric five-coordinate high-spin complex (5c-
number of proteins known to bind heme (e.g.               HS) are present for the hERG3-eag-heme
mitochondrial enzymes) as well as proteins with           complex. Additionally, we observe bands at 1502
unknown heme affinity; this included hERG3                (v3), 1553 & 1585 cm-1 (v2), and 1640 cm-1 (v10).
(Fig. S1). In the structure of the overall hERG3          These modes indicate the presence of a six-
channel, there are four subunits each containing a        coordinate low-spin complex (6c-LS) (Table S1)
transmembrane region as well as cytoplasmic N-            (14). These resonance Raman data are in
and C-terminal regions, Fig. 1 (7). The N-terminal        agreement with the absorption spectra above, and
cytoplasmic region (approximately 400 residues)           demonstrate the formation of a six-coordinated
contains a highly conserved eag-domain (residues          heme species with a specific binding environment.

                                                      2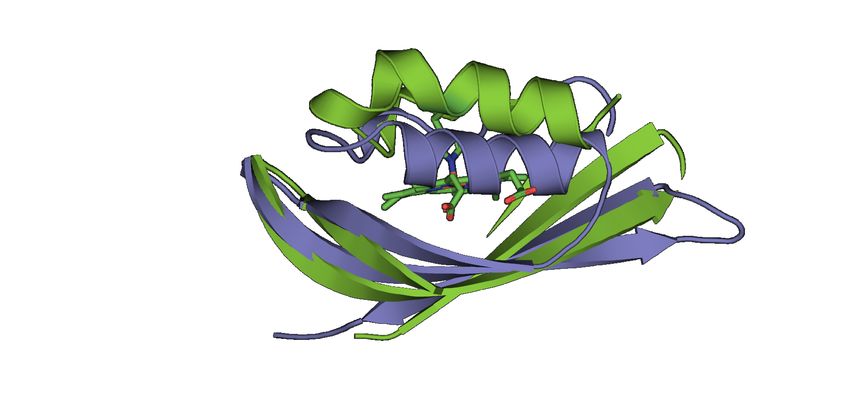
EPR analyses support these conclusions, as the              The first 17 residues at the N-terminus are not seen
spectrum of the hERG3-eag-heme complex shows                in interpretable electron density in the crystal;
the formation of a low-spin heme complex (Fig.              furthermore, residues 18-23 are of weak density,
2C). The spectrum is indicative of a mixture of             indicating heterogenetity in this region (the N-
species and was best simulated with two                     terminal Cap). Mass spectrometry data (Fig. S2C)
components (see Fig. 2C). The g-values for both             show there is a mixture of molecular weights with
are in good agreement with those of other ferric            varying degrees of truncation at the N-terminus
heme proteins bearing cysteine coordinated                  (Fig. S2D), and the observed density most likely
opposite a neutral sixth ligand (8). A Cys/His              reflects this mixture. As a significant proportion
ligation is favoured for both components as                 of the protein is unaccounted for in the model, this
suggested by the placement in the Blumberg-                 probably explains the relatively high R values for
Peisach diagram (Fig. 2C).                                  a structure at this resolution (see Table S2).
Carbon monoxide (CO) binds tightly (Kd = 1.03 ±             Despite attempts to obtain a co-crystal structure of
0.37 μM, Fig. 3A) to the ferrous hERG3-eag-heme             heme-bound        hERG3-eag,        extensive      co-
complex, and gives a species (Soret band at 420             crystallisation and soaking experiments were
nm; Q-bands at 540 and 569 nm) that is                      unsuccessful. As we have noted previously (6),
characteristic of a normal CO-bound heme                    this does not mean that heme cannot bind to the
species. An identical species (Soret band at 420            protein, as the spectroscopic data clearly
nm; Q-bands at 540 and 569 nm), is formed on                demonstrate that it does. It is more likely that the
reaction of apo-hERG3-eag domain with a pre-                particular conformation selected for in the crystal

                                                                                                                     Downloaded from http://www.jbc.org/ by guest on November 15, 2020
formed heme-CO complex, and with an affinity                structure is incompatible with heme binding, so
(Kd = 10.55 ± 1.34 μM, data not shown) that is              that heme cannot bind to the protein during the
within reasonable range of the Kd for binding of            crystallisation process. Structural flexibility of the
CO to the ferrous hERG3-eag complex (Kd = 1.03              protein that is linked to the heme binding event
± 0.37 μM) as above. These spectra for the                  (see Discussion) might also affect whether heme
hERG3-heme-CO complex formed by two                         co-crytallises with the protein.
different routes are significantly different from           Effect of heme on hERG3 channels. To measure
that of a free heme-CO complex (lmax = 407, 537             the functional response of hERG3 channels to
and 567 nm (12)), which indicates formation of a            heme, hERG3 was heterologously expressed in
specific protein-heme-CO complex. The CO                    CHO cells. In whole-cell recordings, K+ currents
ligand is easily dissociated (koff = 0.03 s-1) in the       were elicited with the characteristic features of the
presence of nitric oxide (Soret band at 390 nm,             hERG family (Fig. 5A), including slow voltage
Fig. 3C), which is characteristic of a five-                dependent activation and deactivation, rapid onset
coordinated NO-bound heme protein complex                   and recovery from inactivation and inhibition by
(15,16). These data indicate that the hERG3-eag-            astemizole (data not shown). Application of heme
heme complex is competent for binding of                    (Fig. 5B-E) caused a substantial inhibition of
biologically relevant gaseous ligands.                      hERG3 current at all potentials (shown here after
Structure of the hERG3-eag domain. The                      >3 mins). Mean (± SEM) heme inhibition of peak
purified hERG3-eag protein was crystallised in the          tail currents with a test potential to +40 mV was
apo-form, in a monomeric state. The structure of            63 ± 12 % (p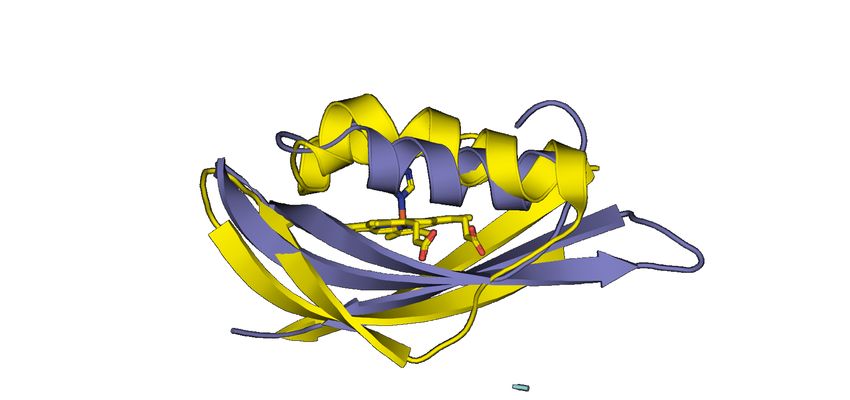
perfusate ameliorated run-down and resulted in             PAS domains, which are known to bind heme
stable recording conditions (Fig. 5G, H).                  (4,5), have well established roles in regulating the
Subsequent application of heme (Fig. 5F-H) to the          function of the related hERG1 channel (7,28,29),
intracellular side of the membrane caused                  but heme binding to this channel has not been
inhibition of hERG3 currents in a similar manner           established. Heme has been shown to potently
as extracellularly applied heme in whole cell              modulate the activity of a range of other potassium
recordings. The time courses of heme inhibition            ion channels such as Kv1.4, large conductance
were comparable, suggesting factors other than             Ca2+-activated K channels and ATP activated K
membrane diffusion of heme determine rates of              channels (12,30-36). Our observation that heme
hERG3 current inhbition. . These data                      binding reduces hERG3 activity furthers the
demonstrate that heme inhibits hERG3 channel               notion that heme plays a deliberate modulatory
activity, thus connecting the heme binding event           role in these ion channel systems. As we noted in
to modulation of channel function.                         the introduction, the capacity for the heme group
                                                           to also bind cell signalling gases (CO, NO, O2 or
                   DISCUSSION                              even H2S) vastly broadens the range of stimuli that
The ether-à-go-go (EAG, Kv10-12) family of                 these ion channels could potentially be modulated
voltage gated K+ channels are regulators of                by.
neuronal and cardiac cell action potential firing          It is worth noting that heme is important for
(excitability). In humans, the family comprises            neuronal survival (37), and so a role for heme in
hEAG, hERG and hELK channels (22,23). In this              the regulation of the ‘neuronal’ channels hERG2

                                                                                                                    Downloaded from http://www.jbc.org/ by guest on November 15, 2020
work, we have identified heme-dependent                    and hERG3 might reasonably be anticipated. At
regulation of hERG3 channel activity. Formation            present, the biological basis for an interaction of
of a six-coordinated heme species is supported             heme with hERG3 is unknown, but a significant
from resonance Raman data, as well as EPR and              portion of brain damage caused during
UV-visible spectra, and a heme-binding PAS                 haemorrhagic stroke is believed to be due to the
domain within the eag-domain of the channel has            longer lasting, cytotoxic effects of heme (38).
been identified.                                           More generally, an abundance of heme after
Recent cryo-EM structural models of rat EAG1               traumatic events such as stroke and ischemia
and hERG1 confirm that the four eag-domains are            could conceivably disrupt the regulatory balance
arranged around the periphery of the tetrameric            of ion channels in the brain and has cytotoxic
intracellular assembly formed by the cNBHD and             implications for the cells involved (39). Heme
C-linkers (24,25). The function of this large              dependent inhibition of hERG3 would reduce
intracellular complex is to modulate voltage               repolarising K+ currents, potentially increasing
dependent gating; profoundly influencing the time          neuronal excitability and susceptibility to cell
course and amplitudes of potassium currents                death. An abundance of heme after traumatic
during physiological processes such as action              events thus has the capacity to disrupt the dynamic
potentials. It sits underneath the transmembrane           processes surrounding the regulation of ion
domains, with the C-linker connecting directly             channel function if they are sensitive to heme.
with the S6 activation gate. The PAS domain                We did not identify the heme binding location in
makes contacts predominantly with the CNBHD,               hERG3-eag. However, we have compared the
whereas the Cap-domain extends towards the                 structure of apo-hERG3-eag with those of other
interface between the voltage sensor, C-linker and         heme-binding PAS domain proteins (EcDOS (40)
channel pore and thus is perfectly positioned to           and FixL (41)). Overlay of hERG3 with those of
influence voltage and time dependent gating                EcDOS and FixL shows that, compared to the apo-
properties. Interestingly, functional studies reveal       hERG3 structure, there is a large movement of the
that deletion of the PAS and Cap domains has               F-helix in the heme-bound EcDOS and FixL
differential effects on the gating properties of           structures to accommodate binding of the heme
hERG1 and hEAG1, suggesting that specific                  group, Fig. 4B, C. It is feasible, therefore, that a
contacts with gating machinery of the two                  similar mode of heme binding might occur in
channels are different (26,27) In hEAG1 channels,          hERG3 if its F-helix is similarly flexible. Relevant
the eag-domain is also required for calcium-               in this context is the disulphide bond between
calmodulin dependent inhibition of current (26).           Cys39 and Cys64, which is located 12 residues
hERG3 gating is similar to hERG1 and it is likely          from the F-helix via a flexible loop. It has been
that the eag domain has a similar role in both             proposed that disulphide bridges might serve as
channels, which is to slow deactivation gating and         redox sensors in cells, by switching between thiol
enhance inactivation gating.                               and disulphide structures (17-20). Loss of the
                                                           Cys39-Cys64       disulphide     could      facilitate

                                                       4
movement of the F-helix, allowing heme to bind (44)) and diluted accordingly to 500 nM prior to
to the protein. The ligands to the bound heme are use.
not identified as yet but candidate residues are Heme-agarose affinity purification and mass
His70, His77, and Cys66 (Fig. 4A), which are in spectrometry of neuronal lysates. Neuronal
the vicinity of the proposed heme binding site lysates were screened for possible heme-binding
based on the comparison with EcDOS and FixL. proteins using a modification of a previously
Cys/His axial ligations would be consistent with published heme-agarose affinity (45). Binding of
our spectroscopic data and with known ligations target proteins to heme-agarose was performed as
in other regulatory heme proteins (4,5). previously (46), with modifications, Fig. S1B,
Based on our structure, we identify one further that minimise pulling down proteins that bind to
possible mechanism of heme-dependent the heme-agarose resin non-specifically. Full
regulation. The N-terminal Cap domain (residues details are given in the supplementary
1-26) in hERG3-eag is mostly unresolved in our information. Using this approach, only proteins
structure. In hERG1 the Cap domain, which that were displaced from the agarose beads to bind
contains a flexibly-linked, but stable amphipathic specifically to the (heme) competitor (i.e. more
helix, is already known to affect channel activity likely to be bona fide heme binding proteins) were
(27,42,43). So in addition to affecting the identified and subjected to proteomics analysis,
conformation of the F-helix (as above), it is Fig. S1C. Data are available via
possible that heme binding to the PAS domain in ProteomeXchange with identifier PXD019887.
hERG3 could also affect the orientation of the Expression and Purification of hERG3-eag
Downloaded from http://www.jbc.org/ by guest on November 15, 2020
adjacent and potentially highly mobile Cap domain. The human KCNH7 clone (imaGenes
domain (Fig. 1). This N-terminus is oriented Gmbh, Berlin) was used to obtain a sequence
towards the pore in the structure of the channel encoding residues 1-135 of the N-terminus of the
(25), and movements of the Cap domain might human hERG3 channel, which comprises the Cap
affect the conformations of the nearby cyclic (residues 1-26) and PAS (27-135) domains (Figs.
nucleotide-binding homology domain, C-linker, 1 and S2A). We refer to the fragment encoding
voltage sensing domain, or pore forming domains residues 1-135 as hERG3-eag. The hERG3-eag
as shown Fig. 6. Structural adjustments of this domain was expressed as an N-terminal His6/S-
kind, in response to heme binding, would provide tagged fusion protein in E.coli BL21(DE3) cells
a mechanism for closure of the channel, due to the using a pLEICS-93 (PROTEX facility, University
proximity of the N-terminal Cap domain to vital of Leicester) expression vector. Cell cultures in
regulatory domains of channel gating (25). LB media were grown at 37 oC containing
Relevant in this context is the observation that free ampicillin (0.1%) to an optical density (OD600) of
heme affects channel function in the A-type 0.6-0.7, at which point the temperature was
potassium channels and, crucially, that the heme reduced to 18 oC and isopropyl β-D-
binds to the inactivation domain on the N-terminal thiogalactoside (IPTG, 0.2 mM) added. After
region (30). We have no evidence for heme overnight incubation, cells were harvested,
binding directly to the Cap domain in hERG3-eag, suspended in lysis buffer (50 mM phosphate/100
but changes in conformation of the N-terminal mM NaCl, pH 7.00, 10% glycerol, 0.1% Triton,
regions – induced either directly (by heme binding 0.1 M MgSO4, 1 complete ULTRA Tablet Mini
to N-termini), or indirectly (by heme binding to EASYpack[Roche], 1 mg/ml lysozyme and
adjacent domains, such as PAS) – might plausibly 1mg/ml DNAase), lysed by sonication and
provide a mechanism for ion channel regulation. centrifuged to remove cell debris. Cell lysates
were loaded onto a 5 ml Ni2+-NTA (Qiagen)
EXPERIMENTAL PROCEDURES affinity column equilibrated with 50 mM
Chemicals and reagents. All reagents were from phosphate/100 mM NaCl, pH 7.00, 10% (vol/vol)
Sigma-Aldrich (Dorset, England) unless glycerol and 15 mM imidazole. After washing
otherwise stated. CO solutions were prepared by with equilibration buffer the His6/S-tagged
bubbling bath solution with CO gas. Iron proteins were eluted with 50 mM phosphate/100
protoporphyrin IX (hemin, Fig. S1A) was mM NaCl, pH 7.0, 10% glycerol and 100 mM
purchased from Sigma Aldrich. Aqueous stock EDTA. The His6/S-tag was cleaved with a His-
solutions of heme for all spectroscopic and tagged TEV-protease during overnight dialysis.
electrophysiological experiments were prepared The His6/S-tag and His-tagged TEV protease were
by dissolving solid heme in 0.1 M NaOH; final removed by reverse Ni2+-NTA affinity column
concentrations were calculated and proteins were purified to homogeneity with
spectrophotometrically (ε385 = 58.4 mM−1cm−1 size exclusion chromatography (Superdex 200,
GE Healthcare) using 50 mM phosphate/100 mM
5NaCl, pH 7.0, Fig. S2B. Protein concentrations 50 mM NaCl, pH 7.5, and transferred to quartz
were determined using a Bradford assay. EPR tubes.
Optical Absorption Spectroscopy. Absorption Electrophysiology. hERG3 currents were
spectra (25.0 oC) were obtained using a double expressed in Chinese hamster ovary (CHO) cells
beam spectrophotometer (Perkin Elmer Lambda and currents were recorded using either whole-
40) or a Kontron Uvikon UV-vis spectrometer. cell or macropatch (inside-out or cell attached)
Ferric heme-bound hERG3-eag was obtained by configurations of the patch clamp technique.
addition of heme to hERG3-eag in 50 mM hERG3 currents were recorded with an Axopatch
HEPES, 50 mM NaCl, pH 7.5. The reduced 200 voltage clamp amplifier, and digitized using
protein was obtained by anaeorobic addition of a Digidata 1440A interface, and acquired and
dithionite, and the ferrous-CO complex by gentle analysed using pClamp 10.3 software (Molecular
bubbling of CO through the reduced protein. Devices, Sunnyvale, CA, USA). For whole cell
Values of Kd for binding of ligands (heme, CO) to recordings the intracellular solution contained (in
hERG3 (3-5 mM) were obtained at 25.0 oC in mM): 30 KOH, 110 KCl, 1.2 MgCl2, 1 CaCl2, 10
50mM HEPES/50mM NaCl, pH 7.5 as described EGTA, 5 HEPES, 1 ATP, titrated to pH 7.2 with
previously (12). Heme dissociation was measured KOH. Cells were superfused with normal bath
by reacting the ferric heme-hERG3-eag complex solution containing (mM): 135 NaCl, 10 KCl, 5
(6.4 μM) with a 5.6-fold excess of apo-myoglobin glucose, 2 MgCl2, 2 CaCl2 and 10 HEPES, titrated
(36 μM); the reaction was followed at 408 nm (50 to pH 7.3 with NaOH. Macropatch currents were
mM HEPES/50 mM NaCl pH 7.5). recorded in equimolar K+ solutions. The bath
Downloaded from http://www.jbc.org/ by guest on November 15, 2020
Resonance Raman Spectroscopy. Samples (50 μL, solution contained (in mM): 40 KOH, 80 KCl, 10
in 50 mM HEPES, 50 mM NaCl, pH 7.5) of ferric K2SO4, 10 HEPES, 5 EGTA, 5 HEDTA and 10
heme and its complexes were prepared in quartz Glucose, pH 7.2. Pipette solution contained (in
EPR tubes and placed in a homemade spinning mM): 140 KCl, 1 MgCl2, 0.1 CaCl2 and 10
cell, at room temperature, to avoid local heating HEPES, pH 7.4. To prevent rapid and complete
and to prevent photo-dissociation and current run-down 10 µM Phosphatidylinositol
degradation. Protein concentrations were in the 4,5-bisphosphate (PIP2) was added to the bath
range 90-120 μM, and sub-stoiochiometric solution in all excised inside-out macropatch
concentrations of heme (to 0.8 equivalents) were recordings.
added to the protein to ensure that no excess of Aqueous stock solutions of ferric heme for
heme was present. Raman excitation at 413.1 nm electrophysiology experiments were prepared by
was achieved with a laser power= γ = 90° (Table S2). Data were processed and elution using a 10 minute linear gradient from 3-
scaled with DIALS software from the CCP4 96% B (80% acetonitrile / 0.1% formic acid). The
program suite (48). The structure was determined output of the column was sprayed directly into the
by molecular replacement in PHASER (49) using H-ESI2 electrospray ion source of the mass
the hERG1 PAS domain [PDB 4HQA (50)] as the spectrometer maintained at 5kV. The FT analyser
search model and refined with REFMAC5 (51). was set to acquire 10 microscans over the m/z
The model was refined to a resolution of 1.39 Å range 800-2000 Da in positive ion mode. The
with Rwork and Rfree values of 18.2% and 23.4%, maximum injection time for MS was 150 ms and
respectively, the final cycles of refinement the AGC target setting was 3e6. Protein charge-
included extrapolated hydrogen atoms with state distributions were deconvoluted using the
anisotropic atomic displacement parameters (B) Xtract function of the Xcalibur program (version
for all atoms. Data collection and refinement 2.1.0.1139, Thermo Scientific).
statistics are in Table S2 (PDB ID 6Y7Q) and the
weighting scheme is given in Table S3. Data Availability. Atomic coordinates and
Mass spectrometry analysis was carried out on a diffraction data have been deposited in the Protein
hERG3-eag crystal. The crystal was dissolved in Data Bank (accession code 6Y7Q). Proteomics
50 mM Hepes, 50 mM NaCl pH 7.5 and LC-MS data are available via ProteomeXchange with
was carried out using an RSLCnano HPLC system identifier PXD019887.
(Thermo Scientific) and an LTQ-Orbitrap-Velos
mass spectrometer (Thermo Scientific). Samples
Downloaded from http://www.jbc.org/ by guest on November 15, 2020
were loaded at 0.1 mL/min onto a Vydac C8 5µm
250mm x 1mm I.D. reverse phase column (Grace
Davison). The protein was desalted for 10 minutes
in the loading buffer (0.1% formic acid) before
Acknowledgements. We thank the late Dr. Xiaowen Yang in the Protein Expression Laboratory
(PROTEX-University of Leicester) for preparing the expression clones, and Dr. Fred Muskett for helpful
discussions on the purification of hERG3-eag. We acknowledge Dr. Chris Millard, Chitra Seewooruthun
and Kirsty Ford for help with the acquisition of crystallographic data and the Diamond Light Source
staff at beam line I03 (BAG MX14692-18). This work benefited from the Biophysics Platform of I2BC,
supported by iBiSA and by the French Infrastructure for Integrated Structural Biology (FRISBI) ANR-
10-INBS-05.
Conflict of interest. The authors declare that they have no conflicts of interest with the contents of this
article.
Author contributions. ER and JSM conceived and coordinated the project. All other authors designed
experiments, performed research and analysed data. ER coordinated writing of the paper, with assistance
from JSM and all authors.
REFERENCES
1. Taylor, B. L., Zhulin, I.B. (1999) PAS domains: internal sensors of oxygen, redox potential, and
light. Microbiol. Mol. Rev. 63, 479-506
2. Henry, J. T., and Crosson, S. (2011) Ligand-binding PAS domains in a genomic, cellular, and
structural context. Annual review of microbiology 65, 261-286
3. Moglich, A., Ayers, R. A., and Moffat, K. (2009) Structure and signaling mechanism of Per-
ARNT-Sim domains. Structure 17, 1282-1294
4. Shimizu, T., Lengalova, A., Martinek, V., and Martinkova, M. (2019) Heme: emergent roles of
heme in signal transduction, functional regulation and as catalytic centres. Chem Soc Rev 48,
5624-5657
5. Shimizu, T., Huang, D., Yan, F., Stranava, M., Bartosova, M., Fojtikova, V., and Martinkova,
M. (2015) Gaseous O2, NO, and CO in signal transduction: structure and function relationships
of heme-based gas sensors and heme-redox sensors. Chemical reviews 115, 6491-6533
6. Freeman, S. L., Kwon, H., Portolano, N., Parkin, G., Venkatraman Girija, U., Basran, J.,
Fielding, A. J., Fairall, L., Svistunenko, D. A., Moody, P. C. E., Schwabe, J. W. R., Kyriacou,
7C. P., and Raven, E. L. (2019) Heme binding to human CLOCK affects interactions with the E-
box. Proc Natl Acad Sci U S A 116, 19911-19916
7. Cabral, J. H. M., Lee, A., Cohen, S.L., Chait, B.T., Li, M., Mckinnon, R. (1998) Crystal
Structure and Functional Analysis of the HERG Potassium Channel N Terminus: A Eukaryotic
PAS Domain. Cell 95, 649-655
8. Smith, A. T., Pazicni, S., Marvin, K. A., Stevens, D. J., Paulsen, K. M., and Burstyn, J. N. (2015)
Functional divergence of heme-thiolate proteins: a classification based on spectroscopic
attributes. Chemical reviews 115, 2532-2558
9. Reynolds, M. F., Shelver, D., Kerby, R. L., Parks, R. B., Roberts, G. P., and Burstyn, J. N.
(1998) EPR and electronic absorption spectroscopies of the CO-sensing CooA protein reveal a
cysteine-ligated low-spin ferric heme. Journal of the American Chemical Society 120, 9080-
9081
10. Pazicni, S., Lukat-Rodgers, G. S., Oliveriusova, J., Rees, K. A., Parks, R. B., Clark, R. W.,
Rodgers, K. R., Kraus, J. P., and Burstyn, J. N. (2004) The redox behavior of the heme in
cystathionine beta-synthase is sensitive to pH. Biochemistry 43, 14684-14695
11. Hargrove, M. S., Singleton, E.W., Quillin, M.L., Ortiz, L.A., Jr., Olson, J.S. Mathews, A.J.
(1982) His64(E7)-Tyr apomyoglobin as a reagent for measuring rates of hemin dissociation. J.
Biol. Chem. 269, 4207-4214
12. Kapetanaki, S. M., Burton, M. J., Basran, J., Uragami, C., Moody, P. C. E., Mitcheson, J. S.,
Schmid, R., Davies, N. W., Dorlet, P., Vos, M. H., Storey, N. M., and Raven, E. (2018) A
Downloaded from http://www.jbc.org/ by guest on November 15, 2020
mechanism for CO regulation of ion channels. Nat Commun 9, 907
13. Kalsbeck, W. A., Robertson, D.E., Pandey, R.K., Smith, K.M., Dutton, P.L., Bocian, D.F.
(1996) Structural and Electronic Properties of the Heme Cofactors in a Multi-Heme Synthetic
Cytochrome. Biochemistry 35, 3429-3438
14. Kitanishi, K., Igarashi, J., Hayasaka, K., Hikage, N., Saiful, I., Yamauchi, S., Uchida, T.,
Ishimori, K., and Shimizu, T. (2008) Heme-binding characteristics of the isolated PAS-A
domain of mouse Per2, a transcriptional regulatory factor associated with circadian rhythms.
Biochemistry 47, 6157-6168
15. Stone, J. R., Sands, R. H., Dunham, W. R., and Marletta, M. A. (1995) Electron paramagnetic
resonance spectral evidence for the formation of a pentacoordinate nitrosyl-heme complex on
soluble guanylate cyclase. Biochem Biophys Res Commun 207, 572-577
16. Stone, J. R., and Marletta, M. A. (1994) Soluble guanylate cyclase from bovine lung: activation
with nitric oxide and carbon monoxide and spectral characterization of the ferrous and ferric
states. Biochemistry 33, 5636-5640
17. Gupta, N., and Ragsdale, S. W. (2011) Thiol-disulfide redox dependence of heme binding and
heme ligand switching in nuclear hormone receptor rev-erb{beta}. J Biol Chem 286, 4392-4403
18. Yi, L., Jenkins, P. M., Leichert, L. I., Jakob, U., Martens, J. R., and Ragsdale, S. W. (2009)
Heme regulatory motifs in heme oxygenase-2 form a thiol/disulfide redox switch that responds
to the cellular redox state. J Biol Chem 284, 20556-20561
19. Yi, L., Morgan, J. T., and Ragsdale, S. W. (2010) Identification of a thiol/disulfide redox switch
in the human BK channel that controls its affinity for heme and CO. J Biol Chem 285, 20117-
20127
20. Yi, L., and Ragsdale, S. W. (2007) Evidence that the heme regulatory motifs in heme
oxygenase-2 serve as a thiol/disulfide redox switch regulating heme binding. J Biol Chem 282,
21056-21067
21. Light, W. R., 3rd, and Olson, J. S. (1990) Transmembrane movement of heme. J Biol Chem
265, 15623-15631
22. Asher, V., Sowter, H., Shaw, R., Bali, A., and Khan, R. (2010) Eag and HERG potassium
channels as novel therapeutic targets in cancer. World J Surg Oncol 8, 113
23. Ganetzky, B., Robertson, G. A., Wilson, G. F., Trudeau, M. C., and Titus, S. A. (1999) The eag
family of K+ channels in Drosophila and mammals. Annals of the New York Academy of
Sciences 868, 356-369
24. Whicher, J. R., and MacKinnon, R. (2016) Structure of the voltage-gated K(+) channel Eag1
reveals an alternative voltage sensing mechanism. Science 353, 664-669
25. Wang, W., and MacKinnon, R. (2017) Cryo-EM Structure of the Open Human Ether-a-go-go-
Related K(+) Channel hERG. Cell 169, 422-430 e410
826. Lorinczi, E., Helliwell, M., Finch, A., Stansfeld, P. J., Davies, N. W., Mahaut-Smith, M.,
Muskett, F. W., and Mitcheson, J. S. (2016) Calmodulin Regulates Human Ether a Go-Go 1
(hEAG1) Potassium Channels through Interactions of the Eag Domain with the Cyclic
Nucleotide Binding Homology Domain. J Biol Chem 291, 17907-17918
27. Muskett, F. W., Thouta, S., Thomson, S. J., Bowen, A., Stansfeld, P. J., and Mitcheson, J. S.
(2011) Mechanistic insight into human ether-a-go-go-related gene (hERG) K+ channel
deactivation gating from the solution structure of the EAG domain. J Biol Chem 286, 6184-
6191
28. Chen, J., Zou, A., Splawski, I., Keating, M. T., and Sanguinetti, M. C. (1999) Long QT
syndrome-associated mutations in the Per-Arnt-Sim (PAS) domain of HERG potassium
channels accelerate channel deactivation. J Biol Chem 274, 10113-10118
29. Gianulis, E. C., Liu, Q., and Trudeau, M. C. (2013) Direct interaction of eag domains and cyclic
nucleotide-binding homology domains regulate deactivation gating in hERG channels. J Gen
Physiol 142, 351-366
30. Sahoo, N., Goradia, N., Ohlenschlager, O., Schonherr, R., Friedrich, M., Plass, W., Kappl, R.,
Hoshi, T., and Heinemann, S. H. (2013) Heme impairs the ball-and-chain inactivation of
potassium channels. Proc Natl Acad Sci U S A 110, E4036-4044
31. Tang, X. D., Xu, R., Reynolds, M. F., Garcia, M. L., Heinemann, S. H., and Hoshi, T. (2003)
Haem can bind to and inhibit mammalian calcium-dependent Slo1 BK channels. Nature 425,
531-535
Downloaded from http://www.jbc.org/ by guest on November 15, 2020
32. Jaggar, J. H., Li, A., Parfenova, H., Liu, J., Umstot, E. S., Dopico, A. M., and Leffler, C. W.
(2005) Heme is a carbon monoxide receptor for large-conductance Ca2+-activated K+ channels.
Circ Res 97, 805-812
33. Burton, M. J., Kapetanaki, S. M., Chernova, T., Jamieson, A. G., Dorlet, P., Santolini, J.,
Moody, P. C. E., Mitcheson, J. S., Davies, N. W., Schmid, R., Raven, E. L., and Storey, N. M.
(2016) A heme-binding domain controls regulation of ATP-dependent potassium channels. P
Natl Acad Sci USA 113, 3785-3790
34. Augustynek, B., Kudin, A. P., Bednarczyk, P., Szewczyk, A., and Kunz, W. S. (2014) Hemin
inhibits the large conductance potassium channel in brain mitochondria: a putative novel
mechanism of neurodegeneration. Experimental neurology 257, 70-75
35. Wang, S., Publicover, S., and Gu, Y. (2009) An oxygen-sensitive mechanism in regulation of
epithelial sodium channel. Proc Natl Acad Sci U S A 106, 2957-2962
36. Wu, J. Y., Qu, H. Y., Shang, Z. L., Tao, S. T., Xu, G. H., Wu, J., Wu, H. Q., and Zhang, S. L.
(2011) Reciprocal regulation of Ca(2)+-activated outward K+ channels of Pyrus pyrifolia pollen
by heme and carbon monoxide. New Phytol 189, 1060-1068
37. Smith, A. G., Raven, E. L., and Chernova, T. (2011) The regulatory role of heme in neurons.
Metallomics : integrated biometal science 3, 955-962
38. Li, Z. (2011) Heme Biology The Secret Life of Heme in Regulating Diverse Biological Processes
World Scientific
39. Robinson, S. R., Dang, T. N., Dringen, R., and Bishop, G. M. (2009) Hemin toxicity: a
preventable source of brain damage following hemorrhagic stroke. Redox Rep 14, 228-235
40. Kurokawa, H., Lee, D. S., Watanabe, M., Sagami, I., Mikami, B., Raman, C. S., and Shimizu,
T. (2004) A redox-controlled molecular switch revealed by the crystal structure of a bacterial
heme PAS sensor. J Biol Chem 279, 20186-20193
41. Gong, W., Hao, B., and Chan, M. K. (2000) New mechanistic insights from structural studies
of the oxygen-sensing domain of Bradyrhizobium japonicum FixL. Biochemistry 39, 3955-3962
42. Ng, C. A., Hunter, M. J., Perry, M. D., Mobli, M., Ke, Y., Kuchel, P. W., King, G. F., Stock,
D., and Vandenberg, J. I. (2011) The N-terminal tail of hERG contains an amphipathic alpha-
helix that regulates channel deactivation. PloS one 6, e16191
43. Wang, J., Myers, C. D., and Robertson, G. A. (2000) Dynamic control of deactivation gating by
a soluble amino-terminal domain in HERG K(+) channels. J Gen Physiol 115, 749-758
44. Dawson, R. M. C., Elliot, D. C., Elliot, W. H., and Jones, K. M. (1975) Data for Biochemical
Research, Oxford University Press, Oxford, U.K
45. Otto, B. R., van Dooren, S. J., Nuijens, J. H., Luirink, J., and Oudega, B. (1998) Characterization
of a hemoglobin protease secreted by the pathogenic Escherichia coli strain EB1. The Journal
of experimental medicine 188, 1091-1103
946. Lee, B. G. (1992) Isolation of an Outer Membrane Hemin-Binding Protein of Haemophilus
Influenzae Type B. Infection and Immunity 60, 810-816
47. Stoll, S., and Schweiger, A. (2006) EasySpin, a comprehensive software package for spectral
simulation and analysis in EPR. J Magn Reson 178, 42-55
48. Laboratory, S. D. (1994) The CCP4 suite: Programs for Protein Crystallography. Acta Cryst. D
50, 760-763
49. McCoy, A. J., Grosse-Kunstleve, R. W., Adams, P. D., Winn, M. D., Storoni, L. C., and Read,
R. J. (2007) Phaser crystallographic software. Journal of applied crystallography 40, 658-674
50. Adaixo, R., Harley, C. A., Castro-Rodrigues, A. F., and Morais-Cabral, J. H. (2013) Structural
properties of PAS domains from the KCNH potassium channels. PloS one 8, e59265
51. Murshudov, G. N., Vagin, A.A., Dodson, E.J. (1997) Refinement of Macromolecular Structures
by the Maximum-Likelihood Method. Acta Cryst. 53, 240-255
FOOTNOTES
This work was funded by Biotechnology and Biological Sciences Research Council Grants
BB/K000128/1 and BB/M018598/1.
The abbreviations used are: PAS, (Per-ARNT-Sim) domain; hERG3-eag, residues 1-35 of the N-
terminus of the human hERG3 channel, comprising the Cap and PAS domains; PIP2,
Downloaded from http://www.jbc.org/ by guest on November 15, 2020
phosphatidylinositol 4,5-bisphosphate.
FIGURE LEGENDS
Figure 1. Schematic of the hERG3 channel subunit. hERG, which is part of the EAG family of ion
channels, has four subunits which assemble to form a tetrameric structure (left). Each subunit contains
a transmembrane region as well as cytoplasmic N- and C-terminal regions. The transmembrane region
contains voltage sensor (helices S1-S4, dark grey) and pore-forming (helices S5-S6, magenta) domains
inside the membrane bilayer. The C-terminal cytoplasmic region contains a cyclic nucleotide-binding
homology domain (CNBHD, red), which is connected to the transmembrane region via a structured
domain usually referred to as the C-linker. The N-terminal cytoplasmic region (approximately 400
residues) contains a region that is known as the eag domain (residues 1-135), which itself comprises a
Cap domain (residues 1-25, light blue) and a PAS domain (residues 26-135, purple). This eag-domain
fragment (residues 1-135) has been expressed in this work and is referred to as hERG3-eag in this paper.
Figure 2. Analysis of heme binding to the hERG3-eag domain. (A) Difference spectra obtained on
titration of the hERG3-eag domain with ferric heme; the arrows represent the directions of the
absorbance changed with increasing heme concentration. Inset (top): Hyperbolic fitting of the heme
binding data at both wavelength maxima to a 1:1 model for heme binding. Inset (bottom): Absorbance
changes at 408 nm on binding of the ferric hERG3-eag complex to apo-myoglobin. Data were fitted to
-1
the first order decay process, yielding kobs = 0.03 s . (B) Room temperature high-frequency resonance
Raman spectra of (i) free heme, (ii) the ferric hERG3-eag-heme complex. All spectra were collected
with 413.1 nm laser excitation. (C) Left: X-band EPR spectrum (black trace) of the ferric hERG3-eag-
heme complex in the low-spin region along with the simulated spectrum (red trace). Experimental
conditions: microwave frequency, 9.38 GHz; microwave power, 0.064 mW; field modulation amplitude,
2 mT; field modulation frequency, 100 kHz; temperature, 15 K; [heme] = 100 μM, 5-fold excess of
protein in HEPES buffer 50 mM, pH 7.5, NaCl 50 mM. Simulation parameters : species 1 (75%) g-
values (g-strain) gz1 = 2.42 (0.06) gy1 = 2.27 (0.00) gx1 = 1.91 (0.04); species 2 (25%) g-values (g-strain)
gz2 = 2.50 (0,07) gy2 = 2.28 (0.00) gx2 = 1.90 (0.06); Lorentzian linewidth full-width at half-maximum
4mT. Right: Blumberg-Peisach correlation diagram showing EPR parameters plotted for various heme
proteins.
Figure 3. (A) Spectrophotometric titration of the ferrous hERG3-eag-heme complex with CO. Inset:
quadratic (Morrison) fitting to the binding curve to give Kd = 1.03 ± 0.37 μM. (B) Formation of a heme-
10NO-hERG3 complex (lmax = 390 nm) on dissociation of CO from the ferrous heme-hERG3 complex (3
μM, lmax = 421 nm) in the presence of NO. NO was formed from the NO releasing molecule, S-nitroso-
N-acetyl penicillamine (see Methods). Inset: the 421 nm time course, fitted to a three-exponential
process; using the dominant (50%) phase a rate constant for dissociation of CO, koff(CO), was determined
-1
(koff(CO) = 0.03 s ).
Figure 4. (A) Cartoon representation of the hERG3-eag crystal structure showing the PAS (purple) and
Cap (light blue) domains; the colour scheme used is the same as that used in Fig. 1 for the PAS and Cap
domains. Potential heme binding residues are labelled. (B) and (C). Structural alignment of hERG3-eag
with structures of heme-bound PAS domains in E. coli DOS (1V9Y, green in (B)) and FixL (1DP6,
yellow in (C)). Movement of the F-helix in E. coli DOS and FixL allows binding of the heme.
Figure 5. hERG3 currents are inhibited by heme. (A) Representative whole-cell hERG3 currents
(upper panel) elicited with voltage protocol (lower panel) consisting of 1-s test pulses from -100 to +50
mV in 10 mV increments and from a holding potential of -80 mV. Inward tail currents were measured
at a potential of -110 mV. The start-start interval for the voltage protocol was 5-s. (B) A family of
hERG3 current traces from the same cell shown in (A) after superfusion of heme (500 nM). (C) Mean
end-pulse current-voltage relationship with and without heme (500 nM) (n = 3). (D, E) Mean tail current
(normalised to maximum control current in individual cells (D) or normalised to maximum current (E)
Downloaded from http://www.jbc.org/ by guest on November 15, 2020
in each recording solution) and plotted against test-pulse potential, with and without heme (500 nM) (n
= 3). Data are fitted with Boltzmann functions (solid lines). Half maximal activation (V0.5) and slope
factor were -12.3 ± 4.7 mV and 10.7 ± 1.0 mV respectively before heme and -19.0 ± 4.4 mV and 14.1
± 2.6 mV with heme (n = 3). (F) Representative traces of excised inside-out macro-patch recordings of
hERG3 tail currents before and during application of heme (1 µM). Patches were excised into solutions
containing 10 μM phosphoinositol 4,5 bisphosphate to attenuate current run-down. Intracellular and
+
extracellular solutions contained equimolar K concentrations. Tail currents were measured at a
potential of -140 mV and following 2-s test pulses to 0 mV (see voltage protocol in lower panel).
Horizontal dotted lines indicate zero current (D-F). G) Representative plot of changes in amplitude of
the deactivating component of the tail current plotted against time. The time between traces was 8-s.
(H) Scatter plot of hERG3 tail current amplitudes in three separate excised patches plotted against time
after heme application. Time of heme application is indicated by the vertical dashed line.
Figure 6. Cryo-EM structure of the hERG1 (Kv11.1) channel (5VA1), showing the cyclic nucleotide-
binding homology domain (CNBHD, red), the pore domain (magenta), and the voltage sensing domain
(dark grey). For direct comparison, the colour schemes used for the CNBHD, pore and voltage sensing
domains are the same as those shown schematically in Fig. 1. In addition, the PAS and Cap (in light
grey) domains are also shown for hERG1, aligned with hERG3-eag crystal structure (PAS domain, in
purple; Cap domain in light blue, colour scheme as Fig. 1). Movements of the F-helix (labelled) or the
Cap domain, induced by heme binding, might conceivably affect the conformations of the nearby
CNBDH, pore, and voltage sensing domains which could provide a mechanism for channel regulation.
Refer also to Fig. 1, which shows a schematic of the locations of each domain in relation to the overall
channel structure. We have drawn cartoon schematics of heme-dependent regulation of several different
ion channels previously (KATP, Slo1 (BK) and Kv1.4 channels (36)), and we envisage a similar
mechanism of control here.
11Figure 1
Voltage sensor Pore
domain domain
S1 S2 S3 S4 S5 S6
N
CNBHD
C
PAS
domain
Cap
domainFigure 2
(A) (B)
-1372
-1490
-1570
-1586
-1628
-1502
1619
-1640
(ii)
-1372
-1490
-1570
-1628
-1590
-1619
(i)
1350 1400 1450 1500 15 50 1600 1650
Raman shift (cm-1)
(C) 1.2
1.0 cyt c2
Mb-azide
Rhombicity (V'/D')
0.8
dZ"/dB
0.6
SUR2A hERG3 (2)
P450cam
0.4 hERG3 (1)
0.2
1 2 2
g2Z gZ gY 1
gY g1X gX
0.0
220 246 272 298 324 350 376 0 1 2 3 4 5 6 7 8
Magnetic Field (mT) Tetragonality (D')Figure 3 (A) (B)
Figure 4

(A)

      180°

(B)      (C)
Figure 5
(A) Control (B) Heme
250 pA
250 ms
+50
Voltage
(mV)
-80
-110
(C) (D) (E)
Control
C o n tro l Heme
H em e
Normalized Current
Normalized current
1 .0 1 .0 1 .0
Normalized current
0 .5 0 .5 0 .5
0 .0 0 .0 0 .0
-100 --80
-1 0 080
-60
-6 0
-40
-4 0
-20
-2 0
0
0
20
20
40
40 -100
-1 0 0 -80
-8 0 -60
-6 0 -40
-4 0 -20
-2 0 00 20
20 40
40 -100 - -80
-1 0 0 80 --60
60 -40
-4 0 -20
-2 0 0
0 20
20 40
40
Membrane potential (mV) 200
Membrane potential (mV) Membrane potential (mV)
(F) (G) (H)
Excised
Heme 600
Cell attached 1.0
Normalized Current
Excised
Current (pA)
400 0.8
+ Heme
0.6
100 ms
200 0.4
200 pA
0.2
0
0
-140 0
0 100 200 300 400 500 0 100 200 300
Time (s) Time after Heme application (s)Figure 6
Voltage sensor Pore
domain domain
Cap
F helix
CNBHD
PASDiscovery of a heme-binding domain in a neuronal voltage-gated potassium
channel
Mark J Burton, Joel Cresser-Brown, Morgan Thomas, Nicola Portolano, Jaswir Basran,
Samuel L Freeman, Hanna Kwon, Andrew R. Bottrill, Manuel J Llansola-Portoles,
Andrew A Pascal, Rebekah Jukes-Jones, Tatyana Chernova, Ralf Schmid, Noel W
Davies, Nina M Storey, Pierre Dorlet, Peter C. E. Moody, John S Mitcheson and Emma
L Raven
J. Biol. Chem. published online July 28, 2020
Access the most updated version of this article at doi: 10.1074/jbc.RA120.014150
Alerts:
• When this article is cited
• When a correction for this article is posted
Downloaded from http://www.jbc.org/ by guest on November 15, 2020
Click here to choose from all of JBC's e-mail alertsYou can also read