Efficient generation of thymic epithelium from induced pluripotent stem cells that prolongs allograft survival - Nature
←
→
Page content transcription
If your browser does not render page correctly, please read the page content below
www.nature.com/scientificreports

                                                                                                          There are amendments to this paper

              OPEN              Efficient generation of thymic
                                epithelium from induced
                                pluripotent stem cells that prolongs
                                allograft survival
                                Ryo Otsuka, Haruka Wada, Hyuma Tsuji, Airi Sasaki, Tomoki Murata, Mizuho Itoh,
                                Muhammad Baghdadi & Ken-ichiro Seino*
                                The thymus plays a significant role in establishing immunological self-tolerance. Previous studies
                                have revealed that host immune reaction to allogeneic transplants could be regulated by thymus
                                transplantation. However, physiological thymus involution hinders the clinical application of
                                these insights. Here, we report an efficient generation of thymic epithelial-like tissue derived from
                                induced pluripotent stem cells (iPSCs) and its potential to regulate immune reaction in allogeneic
                                transplantation. We established an iPSC line which constitutively expresses mouse Foxn1 gene and
                                examined the effect of its expression during in vitro differentiation of thymic epithelial cells (TECs).
                                We found that Foxn1 expression enhances the differentiation induction of cells expressing TEC-related
                                cell surface molecules along with upregulation of endogenous Foxn1. iPSC-derived TECs (iPSC-TECs)
                                generated T cells in nude recipient mice after renal subcapsular transplantation. Moreover, iPSC-TEC
                                transplantation to immuno-competent recipients significantly prolonged the survival of allogeneic
                                skin. Our study provides a novel concept for allogeneic transplantation in the setting of regenerative
                                medicine.

                                The thymus is a crucial lymphoid organ for T-cell generation. During intrathymic development, T cells produce
                                a vast receptor repertoire for defending individuals from invasive microorganisms or eliminating de novo malig-
                                nant neoplasms. However, repertoire expansion also provides a potential cost for self-reactivity, which leads to
                                autoimmune disorders. To prevent the release of auto-reactive T cells from the thymus, immature T cells encoun-
                                ter thymic antigen presenting cells (APCs), which express a wide spectrum of self-antigen-derived peptides com-
                                bined with major histocompatibility complex (MHC) molecules. This process allows elimination of auto-reactive
                                T cells and also induces regulatory T cells1.
                                    Given that the thymus functions as a site of T-cell tolerance establishment, previous research attempted thy-
                                mus transplantation to prevent immunological rejection in experimental transplantation models2–5. Immune
                                rejection is mainly mediated by T cells, and eliminating T cells themselves or preventing their activation contrib-
                                utes to prolonged survival of transplanted organs. Indeed, most currently available commercial immunosuppres-
                                sants target T cells and inhibit their activation6.
                                    There are several subsets of APCs in the thymus, such as dendritic cells, macrophages, or thymic epithelial
                                cells (TECs)7. However, thymic lobes transplanted without haematopoietic cells, but containing epithelial struc-
                                ture, tolerizes the host immune system to the thymus donor mouse strain2,3. These results suggest that intrathymic
                                haematopoietic APCs are not necessary for establishing donor-specific unresponsiveness. Therefore, transplanta-
                                tion of thymic epithelium might be beneficial for preventing immune rejection. However, despite its therapeutic
                                potential, thymus grafting to organ transplantation recipients has not reached clinical settings. This would be
                                because of physiological involution of the thymus. The thymus has its maximum size and potential for T cell
                                generation during childhood; its function decreases with aging. The degenerated thymus is typified by a reduced
                                number of T cells and TECs; however, adipose tissues are broadly observed8. Thus, considering that organ donors
                                are usually adult individuals, physiological involution results in decreased thymus availability from organ donors.

                                Institute for Genetic Medicine, Hokkaido University, Kita-15, Nishi-7, Sapporo, 060-0815, Japan. *email: seino@
                                igm.hokudai.ac.jp

Scientific Reports | (2020) 10:224 | https://doi.org/10.1038/s41598-019-57088-1                                                                  1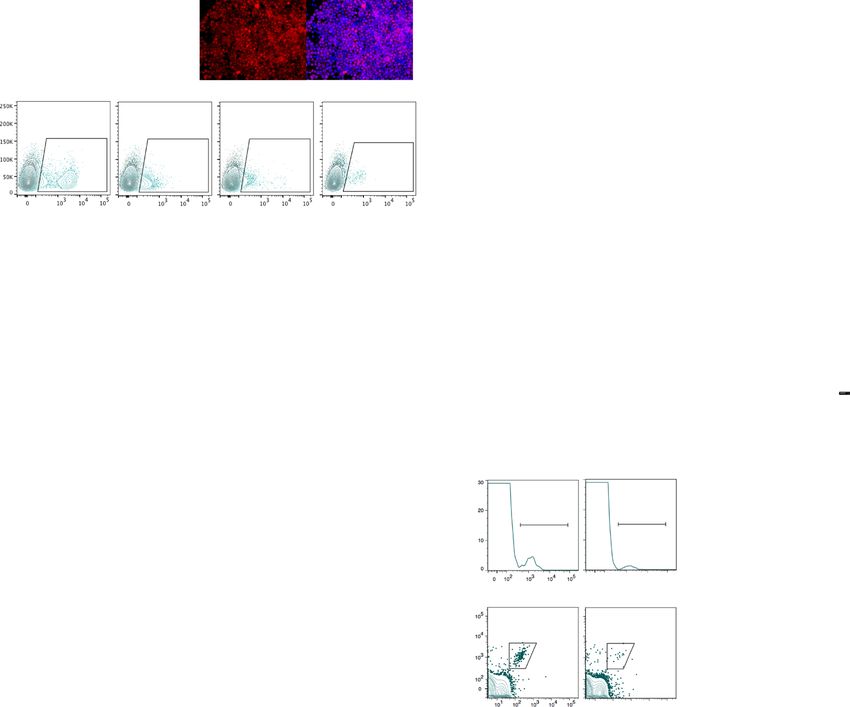
www.nature.com/scientificreports/                                                                    www.nature.com/scientificreports

                                Even though it is possible to graft an aged thymus, there would be less ability to tolerize the recipient immune
                                system.
                                    Pluripotent stem cells such as embryonic stem cells (ESCs) and iPSCs are expected to be an alternative source
                                of grafts for transplantation. Recently, it has been reported that mouse and human ESCs can be induced to dif-
                                ferentiate into thymic epithelial-like cells in vitro9–12; however, these previous reports also showed difficulties
                                with efficient TEC derivation. Moreover, application of these pluripotent stem cell-derived TECs to induce
                                donor-specific tolerance has not been investigated.
                                    Here, we report an alternative way to induce iPSC-derived TECs through a stepwise in vitro differentia-
                                tion protocol along with Foxn1 gene transduction. Foxn1 transduction significantly enhanced TEC induction
                                efficiency with upregulation of TEC-related marker genes. Furthermore, our results raise the possibility that
                                iPSC-derived TECs transplanted into allogeneic recipients contribute to prolonged survival of the transplants
                                whose MHC is identical to iPSC-TECs.

                                Results
                                Conditioning thymic epithelial cell differentiation. The thymus is of endodermal origin, sharing its
                                ancestor with respiratory or gastric organs such as the lung, liver, or pancreas13. We first focused on constructing
                                a step-by-step protocol for induction of TECs through definitive endoderm (DE), anterior foregut endoderm
                                (AFE), and pharyngeal endoderm (PE) (Fig. 1a). DE is known to be induced by a high concentration of Activin
                                and is defined by cell surface expression of Cxcr4, c-Kit, and EpCAM14. We established a protocol for DE induc-
                                tion by modifying several induction methods to optimize them for our iPS cell line (Supplementary Figs. 1–4).
                                Flow cytometric analysis revealed highly overlapped expression of these marker molecules, suggesting efficient
                                (c-Kit+Cxcr4+ cells were 86.7% ± 3.25) DE induction (Fig. 1b). Additionally, upregulation of DE marker genes,
                                defined by quantitative PCR (qPCR), also indicated appropriate differentiation (Fig. 1c). We also examined Foxa2
                                protein expression and found it to be primarily localized to the nucleus, whereas protein expression of Sox2, one
                                of the key factors responsible for pluripotency, was not detected (Supplementary Fig. 5). These results are consist-
                                ent with the estimated efficiency determined by flow cytometry (Fig. 1b).
                                    The thymus arises from an anterior portion of developing endoderm, AFE13. The early anterior-posterior for-
                                mation is regulated by bone morphogenetic protein (BMP), fibroblast growth factor (FGF), and Wnt/β-catenin
                                signalling. Previously, screening multiple combinations of signal agonists and antagonists revealed that DE cells
                                could be anteriorized by simultaneous inhibition of transforming growth factor (TGF) and BMP signaling15.
                                By culturing DE cells in the presence of these signal inhibitors, i.e., SB431542 and LDN193189, anterior marker
                                genes were significantly upregulated, and immunofluorescence imaging showed merged expression of Sox2 with
                                Foxa2 (Fig. 1d,e). Importantly, suppressed Sox2 expression at the DE stage was restored after the anteriorization
                                process. To induce pharyngeal endoderm, anterior foregut endoderm cells were exposed to 6 factors to stimulate
                                BMP, FGF, Wnt/β-catenin, and retinoic acid (RA) signalling whilst under combinatory inhibition of TGF and the
                                sonic hedgehog signalling pathway10,15. This induction step efficiently induced pharyngeal pouch marker Tbx1
                                and Hoxa3 (Fig. 1f). Because TECs are known to develop from the Hoxa3-expressing region in the 3rd pharyn-
                                geal pouch (3rd p.p.)16,17, we focused on optimizing culture conditions by using Hoxa3 as a guide for sufficient
                                3rd p.p. induction. We identified that single or combinatory withdrawal of BMP4, CHIR99021, or cyclopamine
                                from the induction conditions did not affect Hoxa3 and Tbx1 expression on day 9 (Fig. 1g). However, subtracting
                                FGF8, SB431542, or RA resulted in reduced expression of Tbx1 and Hoxa3 (data not shown).
                                    We found that thymic specification can be carried out by continuous exposure to FGF8, SB431542, and RA
                                until day 14 of differentiation (morphological changes are shown in Supplementary Fig. 5). Physiological TEC
                                differentiation is dependent on region-specific expression of forkhead box protein, Foxn118. Hence, we employed
                                Foxn1 as a key differentiation marker and quantified its expression on day 14. A small but significant increase in
                                Foxn1 expression indicated the existence of a TEC population in the obtained cells (Fig. 1h). We also analysed
                                marker molecules on the cell surface by flow cytometry. TECs are categorized as an epithelial cell subset, and
                                approximately 5% of obtained cells expressed epithelial cell adhesion molecule (EpCAM). TECs are further clas-
                                sified into two subsets based on their surface expression of Ly51 and UEA-1, which are expressed by cortical and
                                medullary TECs, respectively19. Flow cytometry analysis revealed minimal levels of these populations (Fig. 1i).
                                Bilateral cross-talk between developing thymocytes and TEC progenitors is an essential event during mature TEC
                                development1. However, it is indicated by cell surface analysis that the in vitro culture condition promoted termi-
                                nal differentiation without receiving signals from T cells. Notably, gene expression of delta-like 4 ligand (Dll4) was
                                also determined by qPCR, and the results suggest the possibility of T-cell differentiation (Fig. 1h).

                                Transduction of exogenous Foxn1 gene promotes iPSC-TEC differentiation. Foxn1 is known as
                                a key transcription factor of thymus morphogenesis. Loss-of-function mutation of Foxn1 results in athymia and
                                nude phenotype because of defects in hair follicle formation20. We next sought to address whether this devel-
                                opmental control gene would also affect in vitro generation of TECs. To evaluate this possibility, we generated
                                a mouse iPS cell line carrying an exogenous gene construct that encodes mouse Foxn1 under the human EF1α
                                promoter. We did not observe any change in cell growth activity or toxicity with Foxn1-transduced iPSCs (data
                                not shown). TEC induction was carried out by following our induction protocol (Figs. 1a, 2a). Flow cytometric
                                analysis revealed that inducing Foxn1 expression during in vitro differentiation had a promotive effect on TEC
                                induction (Fig. 2b). Comparing the differentiation results showed the significantly enhanced induction efficiency
                                of TEC-related molecule expressing cells (Fig. 2b).
                                    We also analysed developmental genes such as Hoxa3, Tbx1, and Pax9, which showed a significant increase
                                through differentiation induction (Fig. 2c). Additionally, Ccl25 and Dll4 were also upregulated (Fig. 2c). As it is
                                known that the molecular expression of Ccl25 and Dll4 can be influenced by, but not dependent on21–23, Foxn1,
                                there was a possibility that the upregulation of these genes was not caused by differentiation induction but rather

Scientific Reports | (2020) 10:224 | https://doi.org/10.1038/s41598-019-57088-1                                                                     2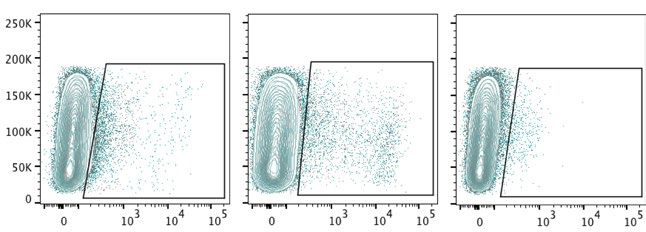
www.nature.com/scientificreports/ www.nature.com/scientificreports
a
Day 0 Activin A Day 5 Day 7 FGF8 Day 9 FGF8 Day 14
CHIR99021 SB431542 SB431542 SB431542
LDN193189 Definitive LDN193189 Anterior Foregut Retinoic acid Pharyngeal Retinoic acid Thymic
iPS Cell Endoderm Endoderm Endoderm Epithelial Cell
Oct4 Foxa2 Foxa2 Tbx1 Hoxa3
Sox2 Sox17 Sox2 Hoxa3 Foxn1
Nanog Cer1 Pax9 Pax1
Cxcr4
b c
Foxa2 Sox17 Cer1 Oct4
0.0 03 0.0 04
Normalized to Gapdh
1.5 ** 0.2 5
98.2% 98.9% 0.0 02 5 * *
0.0 03 0.2
0.0 02 1
EpCAM-APC
0.1 5
c-Kit-APC
0.0 01 5 0.0 02 iPSC
0.1
0.0 01 0.5
0.0 01 0.0 5 DE
0.0 00 5
**
0 0.0 00 0 0
Cxcr4-PE e
Sox2 / Foxa2 / DAPI
d
Sox2 Pax9
0.0 02 5 0.0 12
Normalized to Gapdh
**
0.0 02 **
0.0 08
0.0 01 5 DE
0.0 01 AFE
0.0 04
Isotype control
0.0 00 5
0 0
f Day 7
BMP4, CHIR99021, Cyclopamine,
Day 9
g Day 7 BMP4( ),
CHIR99021( ),
Day 9
FGF8, SB431542, Retinoic acid Anterior Foregut Cyclopamine( ) Pharyngeal
Anterior Foregut Pharyngeal
Endoderm Endoderm Endoderm Endoderm
Tbx1 Hoxa3 Tbx1 Hoxa3
0.0 04 0.0 00 6
Normalized to Gapdh
0.0 05 0.0 03
Normalized to Gapdh
NS ** BMP4( )
(p=0.07) NS NS
0.0 03 0.0 00 45 0.0 04 CHIR99021( )
0.0 02
AFE 0.0 03 Cyclopamine( )
0.0 02 0.0 00 3
PE 0.0 02 BMP4( )
0.0 01
0.0 01 0.0 00 15 CHIR99021( )
0.0 01
0 0 Cyclopamine( )
0 0
h iPSC TEC i Specific staining Isotype
Hoxa3 Foxn1 Dll4
10
Normalized to Gapdh
0.0 02 0.0 00 1 4.0 0E- 04 5.61 % 4.61 % 1.45 % EpCAM
**
% of positive cell
0.0 01 5 * 0.0 00 07 5 3.0 0E- 04 ** 7.5 UEA-1
SSC
0.0 01 0.0 00 05 2.0 0E- 04 5 Ly51
0.0 00 5 0.0 00 02 5 1.0 0E- 04 2.5
0 0 0.0 0E+0 0 0
EpCAM-APC UEA-1-APC-Cy7 Ly51-PE
Figure 1. Generation of iPSC-TECs. (a) Schematic showing the differentiation protocol of thymic epithelial cells.
(b) Definitive endoderm marker expression on day 5 of differentiation. Plots show representative flow cytometric
analysis. (c) Expression of Foxa2, Sox17, Cer1, and Oct4 on day 5 of differentiation. Definitive endoderm markers
(biological replicates: Foxa2, n = 8; Sox17, n = 7; Cer1, n = 6) and Pluripotency gene (Oct4, n = 8). (d) RT-qPCR
analysis of anterior foregut marker gene expression on day 7 of differentiation. Definitive endoderm cells were
treated with SB431542 and LDN193189 for 2 days (n = 3, biological replicates). (e) Double immunostaining for
Foxa2 (green) and Sox2 (red). Nuclei were counterstained with DAPI (blue). Lower panels show enlargement of
insets in upper panels. Scale bars represent 200 μm. (f) RT-qPCR analysis of Tbx1 and Hoxa3 (n = 6 and n = 7,
respectively, biological replicates) as pharyngeal pouch endoderm marker genes on day 9. (g) Optimizing pharyngeal
endoderm differentiation conditions. Each bar represents culture condition without the indicated factors. NS, not
significant, Tukey’s multiple comparison test (n = 3, biological replicates). (h) RT-qPCR analysis for TEC-related
genes (Hoxa3, Foxn1, and Dll4) on day 14 of differentiation (n = 3, biological replicates). (i) Representative plots of
cell surface analysis of TEC-related marker molecules and average induction rate of each marker-positive cell (n = 3,
biological replicates). Plots show live cell (DAPI−) gated population. *p < 0.05, **p < 0.01, two-tailed Student’s t-test.
DE: definitive endoderm; AFE: anterior foregut endoderm; PE: pharyngeal endoderm; TEC: thymic epithelial cell.
induced by exogenous Foxn1 expression. We also analysed Foxn1 expression by a specific primer pair target-
ing the 3′-UTR of Foxn124, which enabled us to distinguish exogenous from endogenous Foxn1. Although the
influence of exogenous Foxn1 cannot be excluded, significantly upregulated expression of “endogenous Foxn1”
indicated that the iPSC-derived cultured cells accurately differentiated into thymic epithelial lineage (Fig. 2c). We
also evaluated the expression level of total (endogenous + exogenous) Foxn1 and found that estimated exogenous
(total – endogenous) Foxn1 expression level was higher than that of endogenous Foxn1. This might due to sus-
tained strong expression of transduced Foxn1 gene.
Scientific Reports | (2020) 10:224 | https://doi.org/10.1038/s41598-019-57088-1 3www.nature.com/scientificreports/ www.nature.com/scientificreports
a Foxn1/ DAPI b NS
Foxn1 lentivirus vector p=0.06
*
Fold differentiation efficiency
*
iPS cell 100
** *
10
18.1 % 10.7 % 6.61 % 1.95 % Isotype
1
SSC
Specific staining
+ + + +
+
M A1 L4
CA 51 C
Ep Ly UE DL MH
EpCAM-APC Ly51-PE-Cy7 UEA-1-APC-Cy7 Dll4-PE
c 0.0 00 6
Hoxa3
0.0 00 6
Tbx1
0.0 00 3
Pax9
0.0 00 4
Pax1
0.0 02
Ccl25
0.0 03
Dll4
0.0 16
Foxn1-UTR
**
**
Normalized to Gapdh
** ** **
* * 0.0 00 3 0.0 01 5 0.0 12
0.0 00 4 0.0 00 4 0.0 00 2 0.0 02
iPSC
0.0 00 2 0.0 01 0.0 08
iPSC-TEC
0.0 00 2 0.0 00 2 0.0 00 1 0.0 01
0.0 00 1 0.0 00 5 0.0 04
0 0 0 0 0 0 0
d e
EpCAM + EpCAM
recipient PBL recipient PBL
0.0 5
2.5
Normalized to Gapdh
iPSC-TEC
% of CD3+ cells
0.0 4 2 *
1.58% 0.457%
1.5
Count
0.0 3
Aggregate 1
0.0 2 formation
0.5
0.0 1
0
Renal subcapsular
cells
0 CD3 -PE
transplantation 2
+
Total Foxn1 1.38% 0.16% 1.5 *
% of CD3+ TCR
CD3 -PE
EpCAM +
Endogenous Foxn1 1
EpCAM
0.5
0
TCR -APC-Cy7
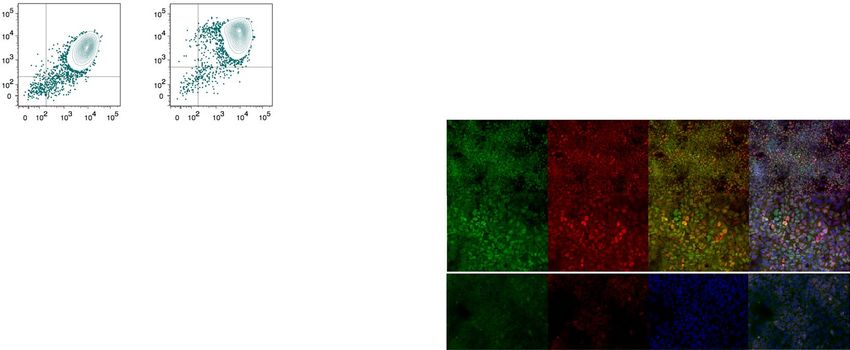
Figure 2. Foxn1 gene transduction and phenotypic/functional characterization of iPSC-TECs. (a) TEC
differentiation with Foxn1-expressing mouse iPSC. Fluorescent images show double staining for Foxn1 (red)
and the nucleus (blue). Scale bars represent 100 μm. Flow cytometric plots show representative flow cytometric
analysis of TEC-related marker molecules on day 14 of differentiation. (b) Fold induction efficiency of marker-
expressing cells compared with normal (not transduced with Foxn1) iPSCs. (c) Expression of Hoxa3, Tbx1,
Pax9, Pax1, Ccl25, Dll4, and Foxn1-UTR on day 14 of differentiation. Foxn1-UTR expression was analysed by
primers specific for 3′-UTR regions of Foxn1 mRNA. (n = 8, biological replicates). (d) Expression of “Total”
and “Endogenous” Foxn1 on day 14 of differentiation (n = 4, biological replicates). (e) Schematic of Foxn1-
iPSC-derived transplantation of TEC into nude recipients (left). iPSC-TECs (EpCAM+, Ly51+, UEA-1+) were
sorted, and aggregates (1 × 10⁵ iPSC-TECs were mixed with 3 × 10⁴ MEFs) were transplanted into nude mice.
Peripheral blood analysis of nude mice 6 weeks after transplantation. Nude mice received iPSC-TEC aggregates
without DN1 thymocytes. Plots show live cell (DAPI−) and recipient blood cell (CD45.2+) gated populations
(right). (*p < 0.05, **p < 0.01, Student’s t-test).
iPSC-TECs generate T cells in nude mice recipients. We then examined the functional capac-
ity of iPSC-TECs by transplantation of these cells with immature T-cell progenitors into athymic nude mice
(Supplementary Fig. 6a,b). Flow cytometric analysis revealed physiological-like development of CD4 or CD8
single-positive cells derived from co-cultured DN1 cells (Supplementary Fig. 6c). Furthermore, when the differ-
entiated cells were sorted by their expression of EpCAM, we observed a 10-fold increase in the proportion of T
cells in peripheral blood from EpCAM+ cell recipient nude mice compared with EpCAM− cell recipients (Fig. 2e).
Consistent with this, TCRVβ repertoire expression analysis showed a variety of TCRVβ generation in recipient T
cells (Supplementary Fig. 7). These results demonstrated that exogenously expressed Foxn1 exerted a promotive
effect on in vitro generation of iPSC-TECs that reconstituted host T cells with a wide TCR repertoire range.
iPSC-TECs contribute to skin graft survival in allogeneic recipients. MHC-homozygous
iPSCs are expected to be less immunogenic when transplanted into MHC-homozygous recipients, and the
MHC-homozygous iPSCs are banked for the therapeutic use of iPSC-derived grafts25. Thereafter, we evaluated
the effect of iPSC-TECs on allograft survival, in which we used skins instead of iPSC-derived therapeutic cells.
C3129F1 mice (recipients) received renal subcapsular transplantation of C57BL/6 (B6) iPSC-TEC aggregates fol-
lowing preconditioning of anti-CD4/CD8 antibodies and total body irradiation (Fig. 3a). For control group mice,
B6 MEF aggregates were transplanted to assess the possibility of B6 cell influence on recipient “anti-B6” immune
responsiveness. Anti-T cell antibody treatment efficiently depleted peripheral CD4+ or CD8+ T cells, and we
observed peripheral T cell recovery 5 weeks after the aggregate transplantation (Supplementary Fig. 8). Despite
Scientific Reports | (2020) 10:224 | https://doi.org/10.1038/s41598-019-57088-1 4www.nature.com/scientificreports/ www.nature.com/scientificreports
a iPSC-TEC
Recipient
(C3129F1)
Transplantation
with preconditioning
Day 6 1 0 Week 5
Skin donor
Skin transplantation
CD4 CD4 3Gy TBI Skin
CD8 CD8 TEC Tx Tx
b 10 0 10 0 10 0
75 75 75
%Graft survival
* iPSC-TEC Tx
50 50 50
MEF Tx
25 25 25
Auto skin B6 skin BALB/c skin
0 0 0
0 5 10 15 20 0 5 10 15 20 0 5 10 15 20
Days post transplantation
c
iPSC-TEC group MEF group
10 0 10 0
80 * 80
**
%Graft size
60 * 60 B6 skin
BALB/c skin
40 40
20 20
0 0
0 5 10 15 20 0 5 10 15 20
Days post transplantation
Figure 3. Immune-regulatory functions of iPSC-TECs. (a) Schematic overview of iPSC-TEC and skin
transplantation. Timeline shows the procedure of recipient preconditioning and skin transplantation. (b)
Kaplan-Meier curves for each skin graft are shown with p-value (B6 skin). Solid line, survival of each skin
graft transplanted to iPSC-TEC recipients (n = 6). Dotted line graft survival in MEF (control cell) aggregate
recipients (n = 6). (*p < 0.05, generalized Wilcoxon test) (c) Percent graft size of B6 and BALB/c skin after
transplantation with error bars on each day of size measurement. (left) iPSC-TEC aggregates pre-transplanted
group, (right) MEF aggregates pre-transplanted group. Statistical significance was evaluated when n ≥ 3 at each
time point. (*p < 0.05, two-tailed Student’s t-test).
the heterozygous MHC haplotype (H-2b/k) in C3129F1 mice and homozygous haplotype in B6 mice (H-2b), skin
grafting from B6 to control C3129F1 caused rapid rejection and resulted in graft loss. In contrast, recipients
of iPSC-TEC aggregates showed significantly prolonged survival of B6 skin (Fig. 3b centre panel; median sur-
vival time (MST) of 15.5 days). Moreover, skins from third-party BALB/c (H-2d) were rejected independently of
pre-transplanted subrenal capsule iPSC-TEC aggregates (Fig. 3b,c; MST = 12 days), and auto skin grafts showed
complete engraftment (Fig. 3b; MST > 20 days). The recipients of MEF aggregates rapidly rejected B6 (MST = 12
days) and BALB/c (MST = 12 days) skin graft. These results suggest that iPSC-TEC transplantation reconstitutes
the host immune system and specifically extends the survival of allografts from the same donor strain.
Discussion
In this study, we have demonstrated that mouse iPSCs, integrated with exogenous Foxn1 gene, efficiently differ-
entiate into thymic epithelial cells, and transplantation of in vitro generated thymic aggregates induces prolonged
survival of transplanted grafts. Although skin allograft rejection and antigen-specific T-cell clone deletion were
previously investigated in PSC-TEC recipients10, our study demonstrates for the first time that iPSC-TECs con-
tribute to allograft survival in immunocompetent mice.
Previous studies aiming to generate thymic epithelium from PSCs showed successful differentiation from
PSCs to TECs9–11,26. However, the efficiency of the TEC differentiation was generally low, and Su et al. utilized a
recombinant transcription factor, HOXA3, and FOXN112. They demonstrated promotion of the differentiation
efficiency and functional T-cell generation in nude mice. We induced exogenous Foxn1 expression during iPSC
differentiation that promoted in vitro TEC generation. This result suggests that Foxn1 influences the fate of differ-
entiating cells. Consistent with this, Bredenkamp et al. showed that enforced expression of Foxn1 in mouse fibro-
blasts promotes TEC-like phenotype acquisition24. The induction efficiency of target cells varies depending on
cell line, and protocols often need to be optimized for each cell line. Although it is difficult to exactly compare the
utility of the TEC induction protocol with another mouse iPSC-TEC study27, enforcement of Foxn1 expression
in iPSC may enhance differentiation efficiency, whichever protocol is used. Future studies are needed to extend
our findings.
Foxn1 is also known to be expressed and function in hair follicles28. However, we excluded the possibility of
hair follicle cell generation by analysing ectodermal gene expression. Moreover, these types of genes were not
detected in our differentiation protocol (data not shown). Together, these results suggest that the T-cell generating
function was not simply due to phenotypic acquisition but also caused by successful differentiation toward TECs.
Transplanted iPSC-TECs were only sufficient to generate a small number of T cells in vivo. One of the possible
Scientific Reports | (2020) 10:224 | https://doi.org/10.1038/s41598-019-57088-1 5www.nature.com/scientificreports/ www.nature.com/scientificreports
reasons is that iPSC-TECs after isolation can survive for only a short period. The differentiation medium contains
various supplements that may influence the cells’ demand for nutrients. Fine-tuning of medium supplements
may be beneficial for sustained engraftment of iPSC-TECs. Another possible reason is that iPSC-TECs are not
capable of efficiently recruiting immature T cells from peripheral circulation. Consistently, double-negative thy-
mocytes mixed with iPSC-TECs differentiated into mature T cells within aggregates. iPSC-TECs expressed T-cell
recruiting chemokine Ccl25; however, its protein level and secretion may not be effective for T-cell infiltration
into iPSC-TEC aggregates.
B6 iPSC-TECs significantly prolonged the survival of skin grafts from the B6 donor, specifically, albeit to a
lesser extent. It could be reasoned that there is a hierarchy in the susceptibility of different allografts to rejection,
and the skin is ranked as one of the most susceptible transplants to rejection29. Thymus transplantation following
appropriate pre-treatment reconstitutes the recipient’s T-cell immune system. To establish immune tolerance
against the thymus donor, T cells developed in the donor thymus would need to be dominant. It is supposed
that donor thymus-derived T cells exist as a small proportion and could not convert the T-cell immune system
to donor tolerant. Regulatory T cells also play significant roles in T-cell tolerance. Even in cases where those cells
were generated through iPSC-TECs, their numbers were not sufficient to regulate anti-donor response. While
we treated recipient mice with a T-cell depletion antibody and total body irradiation to modify their immune
system to become similar to that of nude mice, there is an involved preconditioning regimen in addition to T-cell
depletion (e.g., co-stimulatory molecule blockade). In addition, anti-recipient thymus treatment is also needed to
precisely balance T-cell development. Treating recipient mice with another kind of conditioning method prior to
iPSC-TEC or skin transplantation would facilitate allograft survival for even longer periods.
Our research group has recently achieved the regulation of recipient immune response against PSC-derived
allograft by the administration of PSC-derived immunoregulatory cells30,31. Although in several previous stud-
ies, thymus transplantation surmounted discordant allogeneic barrier2–5, this approach has still not reached the
clinic. Our notion will provide a possibility for iPSCs to be an alternative source of thymus graft which is difficult
to procure from a living or cadaveric donor. Further, even in PSC-based therapy, our conceptual studies would
contribute to the successful development of regenerative medicine.
Methods
Mice. C57BL/6, BALB/c, C3H/He, 129X 1/SvJJmsSlc and BALB/cnu/nu mice were purchased from Japan SLC,
Inc. C3129F1 mice were obtained by mating female C3H with male 129 mice in our own colony. All animal pro-
cedures were approved by the Hokkaido University Animal Care Committee (Approval number: 17–0110) and
the methods were performed in accordance with the Guide for the Care and Use of Laboratory Animals published
by the National Institutes of Health.
Cells and culture condition. The B6 mouse iPS cell line was established in our previous study32. iPSCs were
maintained on laminin-coated culture dishes with maintenance medium consisting of Advanced-DMEM/F-12
(1:1 mixed, Thermo, SIGMA) supplemented with 0.5× Neuro Brew-21 (Miltenyi), 0.5× N2 supplement (Wako),
0.1 mM non-essential amino acids, 1 mM sodium pyruvate, 10 U/ml penicillin, 100 μg/ml streptomycin, 0.1 mM
2-mercaptoethanol (Nacalai), 0.03% L-Glutamine (Gibco), 3 μM CHIR99021 (Adooq), PD0325901 (Tocris), and
recombinant human leukaemia inhibitory factor (produced in our laboratory). Cells were maintained in a 5%
CO2/air environment at 37 °C.
Cloning and gene transduction with lentiviral vector. Mouse Foxn1 CDS was cloned into
pLenti-EF1a-C-Myc-DDK-IRES-Puro vector (Origene), and B6 iPSCs were infected with lentivirus. Lenti-X293T
cells were transfected with lentiviral vector and two packaging plasmids, pMD2.G and psPAX2 (Addgene), using
polyethylene imine. Lentivirus-containing supernatants were collected and mixed with 1/3 volume of polyeth-
ylene glycol solution. The mixture was incubated at 4 °C overnight and centrifuged at 1500 × g for 30 min. After
removing the supernatant, pellets were centrifuged again at 1500 × g for 5 min to completely remove remaining
supernatant. Concentrated virus pellets were reconstituted in serum-free media and frozen at −80 °C. To generate
a Foxn1-expressing iPS cell line, concentrated virus solution was added into the maintenance culture of iPS cells,
and a stable cell line was established by puromycin selection.
Thymic epithelial cell induction. Several definitive endoderm induction methods were modified and
optimized for our iPSC line15,33,34. Briefly, the induction was performed in a serum-free differentiation medium
(SFD)34, d0-2, d3-5, and serum-containing differentiation medium (SCD), d2-3. SFD consisted of 75% IMDM
(Sigma), 25% Ham’s F-12 nutrient mixture (Sigma) with 1× Neuro Brew-21 (vitamin A+), 1× N2 supplement, 10
U/ml penicillin, 100 μg/ml streptomycin, 0.05% BSA, 0.03% L-Glutamine, 0.5 mM ascorbic acid, and 4.5 × 10⁻⁴ M
monothioglycerol (Sigma). Neuro Brew-21 and N2 supplement were substituted with 2% fetal bovine serum
(Sigma) to produce SCD. iPS cells were trypsinised and seeded on a gelatin-coated culture dish (8000 cells/cm2)
with SFD on day 0 of induction. On day 2 of differentiation, the medium was replaced with SCD containing 50 ng/
ml Activin A and 6 μM CHIR99021, GSK3 inhibitor. The medium was replaced with SFD containing 50 ng/ml
Activin A and 0.1 μM LDN193189 (a BMP signal inhibitor) on day 3 and 4. Definitive endoderm cells (day 5)
were confirmed by flow cytometry and qPCR analysis. Cells were anteriorized by culturing in 0.05% FBS/SFD
with 10 μM SB431542, TGF signal inhibitor, and 0.1 μM LDN193189 for the following 2 days. Anterior foregut
endoderm cells (day 7) were then exposed to 50 ng/ml FGF8, 10 μM SB431542, and 0.1 μM retinoic acid in 0.05%
FBS/SFD for 7 days to induce TEC differentiation. Terminally differentiated TECs were detached from the culture
dish by treating with accutase (Nacalai), and cell surface molecules and gene expression were analysed.
Scientific Reports | (2020) 10:224 | https://doi.org/10.1038/s41598-019-57088-1 6www.nature.com/scientificreports/ www.nature.com/scientificreports
Immunofluorescence. Immunofluorescence staining for cultured cells was performed on μ-slide 8 well
(ibidi). Cells were fixed in 4% paraformaldehyde for 15 min at room temperature, washed twice in Tris-buffered
saline with 0.05% tween 20 (TBS-T) and blocked 60 min with blocking solution (TBS-T containing 1%
bovine serum albumin and 1% Block Ace). The fixed cells were immersed in a permeabilizing solution (0.2%
Triton-X100/TBS-T) for 10 min. Primary antibodies, Foxa2, Sox2, and Foxn1, were prepared as 1:200 dilution
with antibody diluent (1%BSA/TBS-T) and added overnight at 4 °C (Supplementary table 2). Cells were washed
and incubated with donkey anti-rabbit IgG-AlexaFlour555, goat anti-mouse IgG-AlexaFlour488, and donkey
anti-goat IgG-AlexaFlour555 for 1 h at 4 °C. Nuclei were stained with DAPI. Stained samples were visualized
using fluorescent microscopy (Zeiss Observer Z1, Zeiss) and images were captured and analyzed by AxioVision
software (Zeiss).
Flow cytometry analysis and cell sorting. Flow cytometry analysis for in vitro cultured cells was per-
formed by the following procedure. Cells attached to the culture dish were washed in PBS(−) and trypsinised for
5 min. The trypsin reaction was neutralized by the addition of culture medium containing 10% FBS and collected
cells were centrifuged. Pellets were re-suspended and filtered before proceeding to staining (Supplementary table 2).
Reverse-transcription and quantitative PCR. Total RNA was extracted using TriPure (Roche
Diagnostics GmbH). RNA was reverse transcribed into cDNA using First Strand cDNA Synthesis Kit ReverTra
Ace (Toyobo). All experiments were performed in technical duplicate with the KAPA SYBR Fast qPCR Kit
(Nippon Genetics). Primer pairs are listed in Supplementary Table 1.
Transplantation. For iPSC-TEC aggregate transplantation, sorted 1 × 10⁵ iPSC-TECs were mixed with
3 × 10⁴ MEFs and cultured overnight on an 8 μm-pore semipermeable filter in SFD medium; formed aggregates
were transplanted under the kidney capsule. In experiments with DN1 thymocytes, E14 fetal thymus DN1 cells
were sorted, and 1 × 10³ cells were mixed with 1 × 10⁵ iPSC-TECs and 2.5 × 10⁴ MEFs per aggregate. Recipient
C3129F1 mice were administrated with anti-CD4 (GK1.5) and anti-CD8 (53-6.7) monoclonal antibodies con-
taining mouse ascites on day 1 and 6 of transplantation. At least 4 weeks after iPSC-TEC or MEF aggregate trans-
plantation, peripheral blood cells were analysed by flow cytometry to confirm T-cell reconstitution. All recipient
mice, including nude mice, received 3 Gy of total body irradiation 6 h before renal subcapsular transplantation.
For skin transplantation, ear skins from the dorsal side of B6, BALB/c, and C3129F1 mice were transplanted
into the dorsal thoracic wall of C3129F1 recipients as previously described35. Graft survival was monitored by
macroscopic inspection. Recipient mice were anesthetized by intraperitoneal injection of a three-drug mixture of
®
medetomidine (Domitor Nippon Zenyaku Kogyo Co., Ltd.), midazolam (midazolam injection, TEVA , Takeda ®
®
Pharmaceutical Co., Ltd.), and butorphanol (Vetorphale , Meiji Seika).
TCR repertoire diversity analysis. TCR repertoire of recipient splenic T cells was analyzed by Anti-Mouse
TCR Vβ Screening Panel (BD Bioscience). We measured the diversity of TCR Vβ repertoire by the Shannon
entropy as previously described36,37. Entropy (H) was calculated as H ≡ Σpilog2pi, where pi is the frequency of Vβ
repertoire i.
Statistical analyses. ®
Statistical data were analyzed with JMP 14 (SAS Institute Inc.) using Student’s t-test
(unpaired, two-tailed) or Tukey’s multiple comparison test. Kaplan–Meier survival curves were analyzed using
generalized Wilcoxon test. p-Value was considered statistically significant whenwww.nature.com/scientificreports/ www.nature.com/scientificreports
16. Manley, N. R. & Capecchi, M. R. The role of Hoxa-3 in mouse thymus and thyroid development. Development 121, 1989–2003
(1995).
17. Chojnowski, J. L. et al. Multiple roles for HOXA3 in regulating thymus and parathyroid differentiation and morphogenesis in
mouse. Development 141, 3697–708 (2014).
18. Vaidya, H. J., Leon, A. B. & Blackburn, C. C. FOXN1 in thymus organogenesis and development. 1826–1837, https://doi.org/10.1002/
eji.201545814 (2016).
19. Gray, D. H. D. et al. Developmental kinetics, turnover, and stimulatory capacity of thymic epithelial cells. Blood 108, 3777 LP – 3785
(2006).
20. Nehls, M., Pfeifer, D., Schorpp, M., Hedrich, H. & Boehm, T. New member of the winged-helix protein family disrupted in mouse
and rat nude mutations. Nature 372, 103 (1994).
21. Bleul, C. C. & Boehm, T. Chemokines define distinct microenvironments in the developing thymus. Eur. J. Immunol. 30, 3371–3379
(2000).
22. Tsukamoto, N., Itoi, M., Nishikawa, M. & Amagai, T. Lack of Delta like 1 and 4 expressions in nude thymus anlages. Cell. Immunol.
234, 77–80 (2005).
23. Itoi, M., Tsukamato, N. & Amagai, T. Expression of Dll4 and CCL25 in Foxn1-negative epithelial cells in the post-natal thymus. Int.
Immunol. 19, 127–132 (2007).
24. Bredenkamp, N. et al. An organized and functional thymus generated from FOXN1-reprogrammed fibroblasts. Nat. Cell Biol. 16,
1–7 (2014).
25. Okita, K. et al. A more efficient method to generate integration-free human iPS cells. Nat. Methods 8, 409–412 (2011).
26. Chhatta, A. R. et al. De novo generation of a functional human thymus from induced pluripotent stem cells. J Allergy Clinic
Immunol. 144(5), 1416–1419 (2019).
27. Okabe, M., Ito, S., Nishio, N., Tanaka, Y. & Isobe, K. Thymic Epithelial Cells Induced from Pluripotent Stem Cells by a Three-
Demensional Spheroid Culture System Regenerates Functional T Cells in Nude Mice. Cell. Reprograming 17, 368–375 (2015).
28. Mecklenburg, L., Nakamura, M., Paus, R., Mecklenburg, L. & Sundberg, J. P. The nude mouse skin phenotype: The role of Foxn1 in
hair follicle development and cycling. Exp. Mol. Pathol. 71, 171–178 (2001).
29. Jones, N. D. et al. Differential susceptibility of heart, skin, and islet allografts to T cell-mediated rejection. J. Immunol. 166,
2824–2830 (2001).
30. Kudo, H. et al. Induction of macrophage-Like immunosuppressive cells from mouse ES cells that contribute to prolong allogeneic
graft survival. PLoS One 9 (2014).
31. Sasaki, H. et al. New immunosuppressive cell therapy to prolong survival of induced pluripotent stem cell-derived allografts.
Transplantation 99, 2301–2310 (2015).
32. Wada, H. et al. Successful differentiation to T cells, but unsuccessful B-cell generation, from B-cell-derived induced pluripotent stem
cells. Int. Immunol. 23, 65–74 (2011).
33. Mou, H. et al. Generation of multipotent lung and airway progenitors from mouse ESCs and patient-specific cystic fibrosis iPSCs.
Cell. Stem. Cell. 10, 385–397 (2012).
34. Gouon-Evans, V. et al. BMP-4 is required for hepatic specification of mouse embryonic stem cell-derived definitive endoderm. Nat.
Biotechnol. 24, 1402–1411 (2006).
35. Garrod, K. R. & Cahalan, M. D. Murine skin transplantation. J. Vis. Exp. 3–4, https://doi.org/10.3791/634 (2008).
36. Hill, M. O. Diversity and Evenness: A Unifying Notation and Its Consequences. Ecology 54, 427–432 (1973).
37. Morris, H. et al. Tracking donor-reactive T cells: Evidence for clonal deletion in tolerant kidney transplant patients. Sci. Transl. Med.
7, 272ra10 (2015).
Acknowledgements
This study was supported in part by research grants from the Ministry of Education, Culture, Sports, Science and
Technology of Japan (H.W., and K.S.), and Japan Agency for Medical Research and Development (K.S.). R.O. was
supported by Research Fellow of Scholarship for Doctoral Students in Immunology from Japanese Society for
Immunology.
Author contributions
R.O., H.W., H.T., M.B. and K.S. designed the study; R.O., H.T., A.S., T.M. and M.I. performed experiments and
analyzed data; R.O., H.W., M.B. and K.S., wrote the manuscript.
Competing interests
The authors declare no competing interests.
Additional information
Supplementary information is available for this paper at https://doi.org/10.1038/s41598-019-57088-1.
Correspondence and requests for materials should be addressed to K.-i.S.
Reprints and permissions information is available at www.nature.com/reprints.
Publisher’s note Springer Nature remains neutral with regard to jurisdictional claims in published maps and
institutional affiliations.
Open Access This article is licensed under a Creative Commons Attribution 4.0 International
License, which permits use, sharing, adaptation, distribution and reproduction in any medium or
format, as long as you give appropriate credit to the original author(s) and the source, provide a link to the Cre-
ative Commons license, and indicate if changes were made. The images or other third party material in this
article are included in the article’s Creative Commons license, unless indicated otherwise in a credit line to the
material. If material is not included in the article’s Creative Commons license and your intended use is not per-
mitted by statutory regulation or exceeds the permitted use, you will need to obtain permission directly from the
copyright holder. To view a copy of this license, visit http://creativecommons.org/licenses/by/4.0/.
© The Author(s) 2020, corrected publication 2021
Scientific Reports | (2020) 10:224 | https://doi.org/10.1038/s41598-019-57088-1 8You can also read