Extreme Ground Snow Loads in Europe from 1951 to 2100

Page created by Clarence Le
 
CONTINUE READING
Extreme Ground Snow Loads in Europe from 1951 to 2100
climate
Article
Extreme Ground Snow Loads in Europe from 1951 to 2100
Pietro Croce           , Paolo Formichi         and Filippo Landi *

                                          Department of Civil and Industrial Engineering-Structural Division, University of Pisa, Largo Lucio Lazzarino 1,
                                          56122 Pisa, Italy; p.croce@ing.unipi.it (P.C.); p.formichi@ing.unipi.it (P.F.)
                                          * Correspondence: filippo.landi@ing.unipi.it; Tel.: +39-339-1981604

                                          Abstract: Lightweight roofs are extremely sensitive to extreme snow loads, as confirmed by recently
                                          occurring failures all over Europe. Obviously, the problem is further emphasized in warmer climatic
                                          areas, where low design values are generally foreseen for snow loads. Like other climatic actions,
                                          representative values of snow loads provided in structural codes are usually derived by means of
                                          suitable elaborations of extreme statistics, assuming climate stationarity over time. As climate change
                                          impacts are becoming more and more evident over time, that hypothesis is becoming controversial,
                                          so that suitable adaptation strategies aiming to define climate resilient design loads need to be
                                          implemented. In the paper, past and future trends of ground snow load in Europe are assessed
                                          for the period 1950–2100, starting from high-resolution climate simulations, recently issued by the
                                          CORDEX program. Maps of representative values of snow loads adopted for structural design,
                                          associated with an annual probability of exceedance p = 2%, are elaborated for Europe. Referring
                                          to the historical period, the obtained maps are critically compared with the current European maps
                                          based on observations. Factors of change maps, referred to subsequent time windows are presented
                                          considering RCP4.5 and RCP8.5 emission trajectories, corresponding to medium and maximum
         
                                   greenhouse gas concentration scenarios. Factors of change are thus evaluated considering suitably
Citation: Croce, P.; Formichi, P.;
                                          selected weather stations in Switzerland and Germany, for which high quality point measurements,
Landi, F. Extreme Ground Snow             sufficiently extended over time are available. Focusing on the investigated weather stations, the study
Loads in Europe from 1951 to 2100.        demonstrates that climate models can appropriately reproduce historical trends and that a decrease
Climate 2021, 9, 133. https://            of characteristic values of the snow loads is expected over time. However, it must be remarked that,
doi.org/10.3390/cli9090133                if on one hand the mean value of the annual maxima tends to reduce, on the other hand, its standard
                                          deviation tends to increase, locally leading to an increase of the extreme values, which should be
Academic Editors: Mário                   duly considered in the evaluation of structural reliability over time.
Gonzalez Pereira and
Steven McNulty                            Keywords: climate change; extremes; European climatic actions maps; ground snow loads; Eurocodes

Received: 26 June 2021
Accepted: 23 August 2021
Published: 25 August 2021
                                          1. Introduction
Publisher’s Note: MDPI stays neutral
                                               Impacts of climate change in several relevant societal and political sectors will become
with regard to jurisdictional claims in
                                          more severe in coming decades [1]. Looking at the available climate observations, a clear
published maps and institutional affil-   consequence of global warming is that the probability of occurrence of extreme weather
iations.                                  and climate events has generally increased [2–5]. Aiming to make key economic and policy
                                          sectors more resilient to climate change, reduction of disaster risks and development of
                                          adaptation strategies have become global and European priorities [5].
                                               Focusing on civil engineering structures and infrastructures, the challenge is the
Copyright: © 2021 by the authors.
                                          assessment of projected changes in extremes of climatic actions over time [6–9]. In struc-
Licensee MDPI, Basel, Switzerland.
                                          tural engineering, variable actions connected to climate, such as wind, snow, precipitation,
This article is an open access article
                                          temperature and so on, are commonly referred to as “climatic actions” [10,11]. The represen-
distributed under the terms and           tative values of such actions are associated with specified probabilities of being exceeded
conditions of the Creative Commons        during a given reference period: e.g., the characteristic value in EN1990 corresponds
Attribution (CC BY) license (https://     to p = 2% in one year [10]. The representative values are usually determined by elaborating
creativecommons.org/licenses/by/          extreme measurements covering a period of 40–50 years, assuming the climate as stationary
4.0/).                                    over time. To consider the influence of changing climate, suitably extended data series

Climate 2021, 9, 133. https://doi.org/10.3390/cli9090133                                                       https://www.mdpi.com/journal/climate
Extreme Ground Snow Loads in Europe from 1951 to 2100
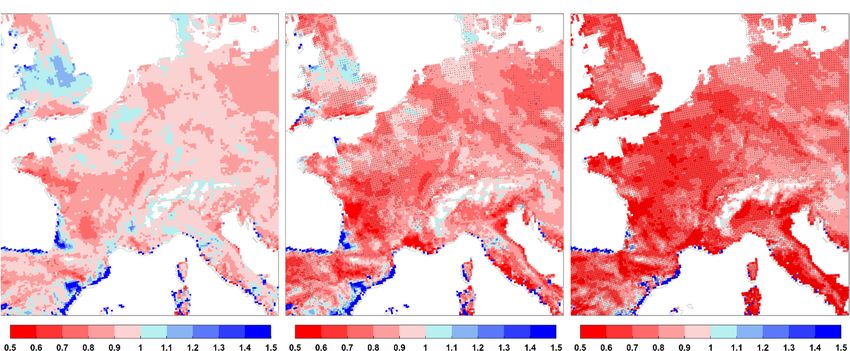
Climate 2021, 9, 133                                                                                           2 of 20

                       should be handled, including available past observations as well as future projections
                       provided by climate models [12].
                            Trends of extreme temperature, precipitation and snow loads in Europe based on
                       observations and reanalysis data have been recently discussed by the authors in [13].
                       In this paper, the study is extended to ground snow loads considering high resolution
                       climate projections.
                            Impacts of climate changes on temperature and precipitation are commonly assessed
                       using climate projections [2–5], while little has yet been done for snow [14], although
                       it represents a significant climate variable. In addition to the complexity of the snow
                       accumulation phenomena, it must be remarked that, on the one hand, changes in snow
                       parameters cannot be appreciated by using only general or global circulation models
                       (GCMs), having low grid resolution (>100 km) [14]. On the other hand, regional climate
                       models (RCMs) with adequate grid resolutions (10–50 km) have been developed only in
                       recent time. In any case, it is often necessary to rely on sophisticated snow models forced
                       by climate projections of temperature and precipitation [6,7,15].
                            Recent collapses of large-span lightweight roofs [6,7,16–18] confirmed that extreme
                       snow loads can cause significant economic damages and causalities [19]. A discussion
                       about the reliability and failure of roofs subjected to snow loads can be found in [20]
                       where a total of 249 roof collapses during the winter 2005/2006 is investigated identifying
                       main observed causes into human errors and insufficient code provisions. Aiming to
                       assess trends of extreme values of snow loads, a general methodology is presented in [6]
                       and [7]. This procedure, combining available projections of daily minimum and maximum
                       temperature and precipitation with site specific information on snowfall accumulation and
                       melting processes, has been successfully applied to some specific regions in [8], and for the
                       evaluation of long-term structural reliability too [21].
                            In climate impact studies for engineering applications, a common way to repre-
                       sent climate change induced variations is the “factor of change” (FC) or “change factor”
                       approach [22–25], which “employs the (climate) model’s response to climate change to modify
                       observations” [23]. Although in other contexts, like specific climatology studies FC can
                       be associated to change of other relevant physical variables such as solar radiation and
                       land use or land cover and so on, in the following factors of change (FCs) are used consis-
                       tently with their definition in [22–25], for assessing impact on climate variables relevant in
                       engineering applications.
                            In this paper, an assessment of changes of ground snow loads from 1951 to 2100 at
                       European scale is presented considering climate projections of snow water equivalent
                       recently made available within the EURO-CORDEX initiative [26,27] according to different
                       scenarios [28]. First, ground snow load maps for characteristic values, i.e., 0.02 probability
                       of exceedance in one year [10], obtained from climate projections for the historical period
                       are discussed in comparison with the current European maps, based on observations.
                       Then, FC maps elaborated for subsequent time windows are presented considering a
                       climate model ensemble and different scenarios. These FCs are thus compared with long
                       series of point observations at selected weather stations in Switzerland and Germany, so
                       assessing the suitability of climate projections to capture current and past trends of snow
                       water equivalent.
                            The influence of climate change on structural reliability represents also a challenging
                       task in the ongoing revision of structural Eurocodes, requested to the European Committee
                       for Standardization (CEN) by the European Commission [29,30].

                       2. Material and Methods
                       2.1. Snow Loads
                           Snow load on structures s, is usually determined from the snow load on ground, sk ,
                       using a suitable loading chain, like

                                                              s = sk Ce µi Ct ,                                   (1)
Extreme Ground Snow Loads in Europe from 1951 to 2100
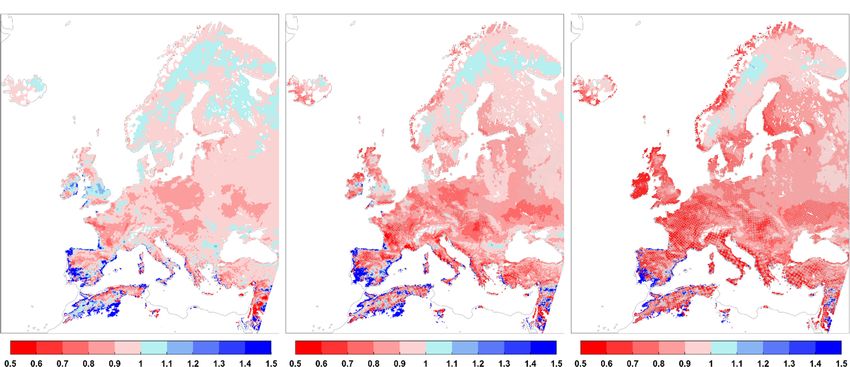
Climate 2021, 9, 133                                                                                           3 of 20

                       where Ce , the exposure coefficient, depending on the orographic conditions of the neighbor-
                       hood of the construction, on the shelter effect of trees and other surrounding construction
                       works, and on wind velocity, accounts for the removal or the accumulation of snow on roof
                       exerted by wind; µi , the shape coefficient, which is a function of the shape and extension of
                       the roof, and on the presence of taller adjacent constructions, is used to convert the ground
                       into the roof snow load as well as to model possible non-uniform snow distributions on
                       roof; finally Ct , the thermal coefficient, accounts for changes in the snow cover caused by
                       the heat flux through the roof.
                             In the snow load model, the key information for structural design is snow load on
                       ground [31]. In modern codes and standards, representative values of snow load on
                       ground, characterized by a given annual probability of exceedance, are usually derived
                       by extreme statistics, analyzing measurements of snow cover depth or of snow water
                       equivalent (SWE) [32,33]. In the past, the SWE was measured directly only in some weather
                       stations of European countries such as Germany, Finland, Switzerland and partially UK,
                       in the other cases, the height of snow cover was converted into snow load by means of
                       analytical snow density laws depending on the climatic conditions and the snow lasting
                       period [33].
                             In Europe, snow loads are defined in the Eurocode EN1991-1-3 [34], where an annual
                       probability of exceedance equal to 0.02 of the time-varying part is considered. In the
                       Eurocode, a loading chain format according to Equation (1) is adopted, but several ongoing
                       studies are improving the formulation of design shape coefficients [35] and the main results
                       are being introduced in the new revised version of the EN1991-1-3 standard. Maps of
                       climatic actions are given in National Annexes to Eurocodes, since they are Nationally
                       Determined Parameters (NDPs). A detailed discussion concerning the definition of snow
                       load maps in Eurocodes, and the actual situation of European harmonization based on
                       Eurocode recommendations and national provisions can be found in [31].
                             Despite the different methods adopted for the statistical treatment of extremes, the
                       elaboration of climatic action maps in European countries, including ground snow load,
                       is based on the extreme value statistics covering a time period of 40–50 years. In the
                       statistical analysis, climate is hypothesized stationary over time, although that assumption
                       potentially leads to an underestimation of possible consequences of climate change.
                             The general methodology to elaborate snow load maps can be resumed as follows:
                       •    First, annual extremes are collected for the considered period in a proper set of weather
                            stations adequately spread over the investigated area;
                       •    Then, available data for each weather station are fitted to an appropriate extreme value
                            probability distribution, in such a way that representative values can be derived. In Eu-
                            rope, a Gumbel (EVI) distribution is generally adopted for annual maxima [31,33,36],
                            including also non-snowy winters, following a “mixed distribution approach” [31,37];
                       •    After that, homogenous climatic zones, which are characterized by a common load–
                            altitude relationship, are identified;
                       •    Finally, isopleths are drawn to show the variation of the load within the considered
                            geographic area.
                            The background study for definition of roof and ground snow loads in Europe was
                       the European Snow Load Research Project (ESLRP) [33], led by the university, involving
                       18 CEN countries. In this project, snow data series from approximately 2600 weather
                       stations were analyzed according to a common approach. Ten climatic regions were
                       identified for snow loads (Iceland, UK and Eire, Norway, Finland and Sweden, Central
                       West, Central East, Alpine, Iberian Peninsula, Mediterranean Region, Greece), and adopted
                       in EN1991-1-3 [34] (see Figure 1).
Extreme Ground Snow Loads in Europe from 1951 to 2100
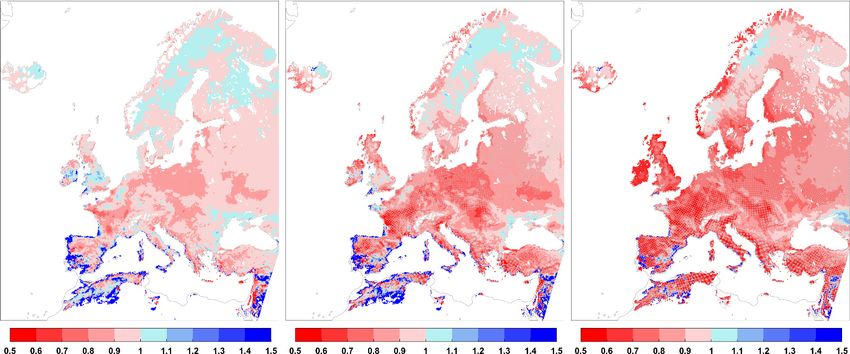
Climate 2021, 9, x FOR PEER REVIEW                                                                                                                   4 of 20

Climate 2021, 9, 133             identified for snow loads (Iceland, UK and Eire, Norway, Finland and Sweden, Central
                                                                                                                4 of 20
                                 West, Central East, Alpine, Iberian Peninsula, Mediterranean Region, Greece), and
                                 adopted in EN1991-1-3 [34] (see Figure 1).

                                                                                                                      .
                                 Figure
                                 Figure 1.
                                        1. Climatic
                                           Climatic regions
                                                    regions defined
                                                            defined in
                                                                    in Annex
                                                                       Annex C
                                                                             C of
                                                                               of EN1991-1-3, based on
                                                                                  EN1991-1-3, based on the
                                                                                                       the results
                                                                                                           results of
                                                                                                                   of the
                                                                                                                      the ESLRP.
                                                                                                                          ESLRP.

                                       The snow load maps, given in [34], were the reference for each country to develop
                                 the National Maps provided in the National       National Annexes.
                                                                                                 Annexes. Due to the different approaches     approaches
                                 and methodologies          adopted     country     by  country,    the  National
                                       methodologies adopted country by country, the National Maps suffer from         Maps     suffer    from    somesomein-
                                 consistencies
                                 inconsistencies   especially
                                                      especially  across  thethe
                                                                     across     borders,
                                                                                  borders,  further
                                                                                               furtheremphasized
                                                                                                         emphasized     byby lack  of of
                                                                                                                                lack   homogeneity
                                                                                                                                           homogeneity     of
                                 available
                                 of availabledatadata[31].
                                                         [31].
                                       In view of future revisions, there is still a strong need for a harmonized definition of
                                 snow parameters across different countries and for an update of                       of current
                                                                                                                           current values,
                                                                                                                                      values, alsoalso con-
                                                                                                                                                        con-
                                             more recent measurements, as well as information provided by satellite net-
                                 sidering more       recent   measurements,       as  well   as  information     provided       by  satellite    networks,
                                 reanalysis
                                 works,       and climate
                                          reanalysis            models.models.
                                                           and climate      In this framework,        the evaluation
                                                                                       In this framework,                   of snowfall
                                                                                                                 the evaluation               responsere-
                                                                                                                                        of snowfall        to
                                 global warming
                                 sponse   to globaliswarming
                                                           a challenging     task. Although
                                                                      is a challenging       task.aAlthough
                                                                                                     decrease of     snowfallsof
                                                                                                                  a decrease        is snowfalls
                                                                                                                                       expected on       av-
                                                                                                                                                      is ex-
                                 erage, global
                                 pected           warming
                                          on average,           can have
                                                             global         diverging
                                                                      warming      can haveeffects  on extremes;
                                                                                                  diverging    effectsin fact,   the drop of
                                                                                                                          on extremes;         in snowfall
                                                                                                                                                   fact, the
                                 fraction
                                 drop   of of  precipitation
                                            snowfall      fractionis associated    with an
                                                                     of precipitation          increase of with
                                                                                           is associated      precipitation
                                                                                                                    an increase  rate of
                                                                                                                                       during      extreme
                                                                                                                                            precipitation
                                 events   [38].  The     temperature      rise,  on   the  one    hand,   facilitates    the
                                 rate during extreme events [38]. The temperature rise, on the one hand, facilitates the melt- melting      of  snow    and
                                 increases   the   fraction    of precipitation     falling   as  rain, on   the other     hand,
                                 ing of snow and increases the fraction of precipitation falling as rain, on the other hand,       it can    increase    theit
                                 intensity   of the   single   snow    events,  leading     to higher   ground    snow
                                 can increase the intensity of the single snow events, leading to higher ground snow loads  loads   [39].   For   example,
                                 increasing
                                 [39].        trends inincreasing
                                       For example,         intensity and     frequency
                                                                         trends              of daily
                                                                                   in intensity     andheavy    precipitation
                                                                                                          frequency      of dailyhave heavy been    already
                                                                                                                                                precipita-
                                 observed,
                                 tion         evenalready
                                       have been      over theobserved,
                                                                   Alps [40,41],
                                                                              evenconfirming
                                                                                      over the Alps theory    and early
                                                                                                         [40,41],            modelstheory
                                                                                                                    confirming          [4,42].and early
                                 modelsDecreases
                                           [4,42]. of SWE extremes, and snow cover duration are generally predicted for
                                 central
                                       Decreases at
                                          Europe      of the
                                                           SWE scale  of Global
                                                                  extremes,     andClimate
                                                                                       snow Models        (GCMs),are
                                                                                                cover duration         likegenerally
                                                                                                                              those provided
                                                                                                                                           predicted by the
                                                                                                                                                         for
                                 Coupled     Model     Intercomparison       Project   (CMIP3      and  CMIP5)     [43]
                                 central Europe at the scale of Global Climate Models (GCMs), like those provided by the  within   the   World     Climate
                                 Research Model
                                 Coupled     Program       (WCRP). However,
                                                        Intercomparison              the (CMIP3
                                                                               Project    coarse resolution
                                                                                                     and CMIP5)  of GCMs        is not able
                                                                                                                       [43] within              to capture
                                                                                                                                         the World      Cli-
                                 topographic     features,     which    are  extremely      relevant   in  the assessment
                                 mate Research Program (WCRP). However, the coarse resolution of GCMs is not able to             of  snow     variables.
                                       First,
                                 capture      evaluationsfeatures,
                                            topographic         of changes     in snow
                                                                           which           parametersrelevant
                                                                                     are extremely         based on   inRegional      Climateof
                                                                                                                           the assessment           Models
                                                                                                                                                      snow
                                 (RCMs)
                                 variables. are  discussed       in  [44,45].   These     studies    were    based    on    low   resolution       models,
                                 49 and   25 km
                                       First,       horizontal
                                              evaluations       of grid  resolution
                                                                    changes    in snow  forparameters
                                                                                             [44,45], respectively,       considering
                                                                                                           based on Regional                the previous
                                                                                                                                      Climate       Models
                                 generation     of  forcing    emission    scenarios     [46].
                                 (RCMs) are discussed in [44,45]. These studies were based on low resolution models, 49
                                       The rise of intensities of extreme snow precipitation can cause not only more severe
                                 and 25 km horizontal grid resolution for [44,45], respectively, considering the previous
                                 snow loads, but also increased risk of ice accretion on structures particularly sensitive
                                 generation of forcing emission scenarios [46].
                                 to atmospheric icing, like power lines and communication towers [44]. The relevance of
                                       The rise of intensities of extreme snow precipitation can cause not only more severe
                                 heavy snowfalls is confirmed by events occurred in the last years, which affected central
                                 snow loads, but also increased risk of ice accretion on structures particularly sensitive to
                                 Europe in Winter 2005/2006 [16,17,20], central Italy in January 2017, southern Germany
                                 in 2019 [47], and Madrid in January 2021. Possible correlation of extreme winter event
Extreme Ground Snow Loads in Europe from 1951 to 2100
Climate 2021, 9, 133                                                                                                 5 of 20

                       with arctic amplification has been assessed in [48], however, not enough evidence has been
                       found [49].

                       2.2. Datasets
                             Aiming at evaluating the evolution of snow load on ground in Europe, the climate
                       model data produced by the EURO-CORDEX initiative [25,26], which are provided by the
                       Earth System Grid Federation (ESGF), are considered in the following, focusing on snow
                       variables [14]. Daily snow water equivalent data were collected from the combination of
                       nine global and regional climate models as described in Table 1. The nine GCMs/RCMs
                       were chosen for the availability of climate projections for both RCP4.5, medium scenario
                       with stabilization of radiative forcing due to climate policy measures to limit emissions,
                       and RCP8.5, representative of the highest emissions and non-climate policy scenarios.
                       These scenarios are generally adopted in impact studies due to the higher availability of
                       climate model runs with respect to RCP2.6 and RCP6. The discussion about the applica-
                       bility of climate change scenarios is rapidly evolving and at present, RCP4.5 appears to
                       offer more realistic baselines [50] while the use of RCP8.5 is debated within the scientific
                       community [51,52].

                       Table 1. Description of the main characteristics of the of the members of climate model ensemble used
                       in the study. Data are provided for the historical, RCP4.5 and RCP8.5 experiment by the following
                       Institutions: the Climate Limited-area Modeling Community (CLMcom), the Danish Meteorological
                       Institute (DMI), Royal Netherlands Meteorological Institute (KNMI), the Max Planck Institute (MPI-
                       CSC) and the Laboratoire des Sciences du Climat et de l’Environnement—Institute Pierre Simon
                       Laplace (IPSL-INERIS).

                           Model Acronym          Institution Acronym           Driving GCM                   RCM
                         EC-EARTH-CCLM                  CLMcom               ICHEC-EC-EARTH               CCLM4-8-17
                         HadGEM2-CCLM                   CLMcom              MOHC-HadGEM2-ES               CCLM4-8-17
                            MPI- CCLM                   CLMcom              MPI-M-MPI-ESM-LR              CCLM4-8-17
                            EC-EARTH-
                                                          DMI                ICHEC-EC-EARTH              HIRHAM5 v2
                             HIRHAM
                        HadGEM2-HIRHAM                    DMI               MOHC-HadGEM2-ES              HIRHAM5 v2
                        EC-EARTH-RACMO                   KNMI                ICHEC-EC-EARTH              RACMO 22E
                          MPI-Remo2009                  MPI-CSC             MPI-M-MPI-ESM-LR              Remo 2009
                          NCC-Remo2015                  MPI-CSC               NCC-NorESM1-M               Remo 2015
                          IPSL-WRF381P                IPSL-INERIS           IPSL-IPSL-CM5A-MR             WRF381P

                            The selected RCMs provide not only future projections for the period 2006–2100, but
                       also historical simulations for the period 1951–2005. Therefore, the historical run and the
                       RCPs ones are merged to obtain two series of SWE for the period 1951–2100.
                            Since the outcome of each climate model can represent an independent sample of
                       future climate, a combination of available models, as large as possible, should be considered
                       to increase the robustness of the assessment. The opportunity to adopt a multi-model
                       ensemble for climate change studies is presented and discussed in [53]. A methodology to
                       enlarge the number of simulations, which are strictly limited by the huge computational
                       time of climate model runs, thus increasing the statistical representatives of the ensemble,
                       has been previously presented by the authors in [54,55]. Statistical adjustment procedures
                       based on data augmentation and Bayesian inference are presented in [56] and recently
                       applied to large RCM ensemble for the assessment of uncertainty associated to the expected
                       changes in mean temperature and total precipitation in Europe [57].
                            Regarding climate projections of snow variables, some inconsistencies were already
                       identified in previous studies for high altitude cells [14], usually above 1500 m. For example,
                       the snow accumulation process may lead to cells characterized by constant snow cover,
                       and unrealistic snow accumulation. This result is not surprising since the resolution and
                       the refinement of the climate model does not allow to capture huge local variations; for this
Extreme Ground Snow Loads in Europe from 1951 to 2100
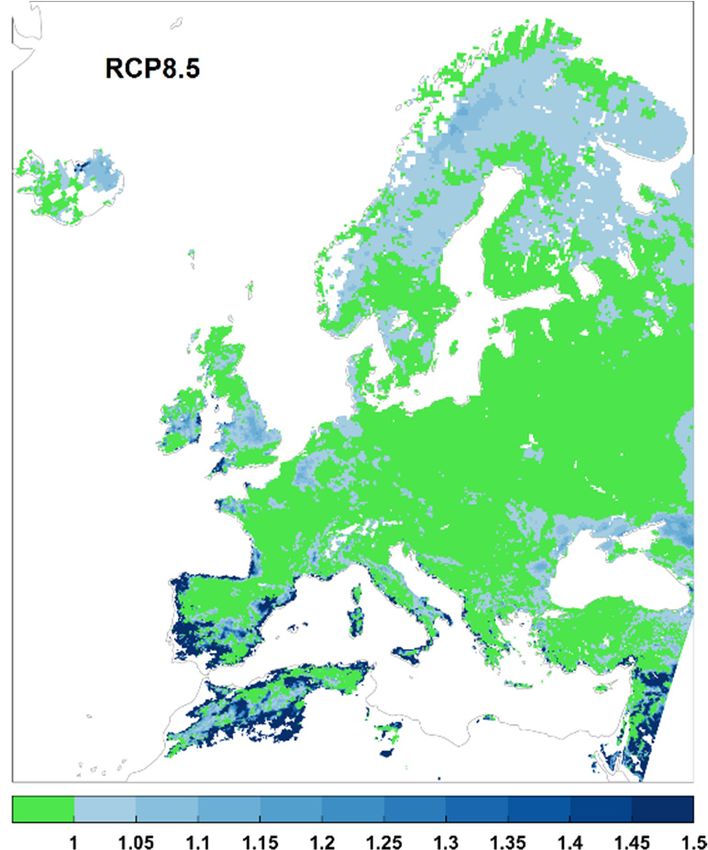
Climate 2021, 9, 133                                                                                          6 of 20

                       reason, the grid cells affected by unrealistic snow accumulation, higher than 70 kN/m2
                       according to [14], were disregarded in the elaboration of RCMs outputs.

                       2.3. The Factor of Change Approach
                             Trends will be assessed in Section 3.2 according to common practice for engineering
                       applications by means of the FC approach [20–23]. FCs are synthetic measures of changes
                       in the statistics of climate variables and can be derived also for characteristic values of
                       climatic actions investigating the n − th time window and the initial time window. The
                       main assumption in the FC approach is that errors in measurements and predictions of
                       climate variables are nearly constant over time. Of course, the higher the quality of the
                       data the more reliable are the results obtained with the proposed method.
                             To be consistent with the actual definition of climatic hazard maps for structural
                       design [6–8,58,59], a 40-year period is considered in the present study for the definition of
                       the time windows and a time shift of 10 years between each other is adopted.
                             The fundamental steps of the procedure are the following:
                       1.   Extraction of annual maxima of the investigated climate variable for the investigated
                            time windows (e.g., 1951–1990, 1961–2000, 1971–2010, . . . , 2050–2090);
                       2.   Elaboration of extreme values for each time period, via the block maxima method [60].
                            Of course, several extreme value distributions can be assumed for the considered
                            variable. Since ground snow load extremes in Europe are usually described by the
                            extreme value type I (EVI) distribution [31,33,36], an EVI distribution was assumed
                            in the present study too. The cumulative distribution function (CDF) of the EVI
                            distribution, also known as Gumbel distribution, is

                                                                      x−µ
                                                                        
                                        F ( x < X ) = exp − exp −                 with µ ∈ R; σ > 0,           (2)
                                                                       σ

                            being µ the location, and σ the scale of the distribution.
                       3.   Characteristic values of ground snow load, qk (n), are thus evaluated for the n-th time
                            window, from
                                                      qk (n) = µ + σ ·{− ln[− ln(1 − p)]}.                       (3)
                            In the equation, p is the given probability of exceedance, i.e., p = 0.02 in one year
                            according to EN1990 [10].
                       4.   FC are derived in terms of ratios between the characteristic value in the n-th time
                            window and that obtained in the first one
                                                                           qk (n)
                                                             FC(n) =                .                            (4)
                                                                       q k ( n = 1)

                               FCs can provide advice for the update of climatic maps given in codes and standards,
                       relying on the analysis of past observations. In this context, it is important to underline
                       once more that engineering works shall cope with climatic hazards during their physical
                       life, which can obviously be longer than the design service life [8]. Therefore, to guarantee
                       adequate reliability levels over time for the designed structures, an adaptation strategy
                       for structural design was proposed in [8], which consists of adopting an envelope of
                       characteristic values in the future time windows for the updated climatic load maps [8,59].
                               According to the proposed approach, the updated values of ground snow load
                       q0k , including influence of climate change, are obtained multiplying the maximum FC
                       in the future time windows by the current value of qk obtained from the analysis of
                       observations (qk,obs )
                                                           q0k = max(FC(t))·qk,obs                               (5)
Extreme Ground Snow Loads in Europe from 1951 to 2100
Climate 2021, 9, x FOR PEER REVIEW                                                                                              7 of 20

Climate 2021, 9, 133                                                                                                             7 of 20
                                                                          ′ = max(FC( )) ∙       ,                                   (5)

                                 3.3.Results
                                     Resultsand
                                             andDiscussion
                                                  Discussion
                                 3.1.
                                  3.1. Climate Simulationsfor
                                      Climate Simulations  forthe
                                                               theHistorical
                                                                  HistoricalPeriod
                                                                             Period
                                       First,
                                        First,the
                                               thecapability of of
                                                    capability  RCM  ensemble
                                                                   RCM        to reproduce
                                                                        ensemble           the observed
                                                                                  to reproduce          climate
                                                                                                the observed    was assessed,
                                                                                                             climate  was as-
                                 comparing the outcomes of historical simulations for the period 1951–2005, which are
                                  sessed, comparing the outcomes of historical simulations for the period 1951–2005, which
                                 based on the measured atmospheric composition changes, with the available observations.
                                  are based on the measured atmospheric composition changes, with the available observa-
                                 Characteristic ground snow load maps were developed with this aim and illustrated
                                  tions. Characteristic ground snow load maps were developed with this aim and illustrated
                                 in Figure 2.
                                  in Figure 2.

                                  Figure2.2.Characteristic
                                 Figure     Characteristicground
                                                           groundsnow
                                                                    snowload
                                                                         loadmaps,
                                                                              maps,showing
                                                                                    showingload
                                                                                              loadvalues
                                                                                                    valuesassociated
                                                                                                           associatedto
                                                                                                                      to0.02
                                                                                                                         0.02probability
                                                                                                                              probability
                                  ofexceedance
                                 of  exceedance in
                                                 inone
                                                    oneyear,
                                                          year,elaborated
                                                                elaboratedfrom
                                                                           fromthe
                                                                                theanalysis
                                                                                    analysisofofthe
                                                                                                 thenine
                                                                                                     nineclimate
                                                                                                          climatemodels,
                                                                                                                   models,described
                                                                                                                            describedinin
                                  Table 1, considering the period 1951–1990.
                                 Table 1, considering the period 1951–1990.

                                       Themaps
                                       The  mapsin  inFigure
                                                       Figure22were
                                                                weredeveloped
                                                                       developedextracting,
                                                                                   extracting,for
                                                                                                foreach
                                                                                                    eachconsidered
                                                                                                          consideredGCM/RCM
                                                                                                                       GCM/RCMand    and
                                  foreach
                                 for  eachcell
                                           cellininthe
                                                    theEUR11
                                                        EUR11domain,
                                                                domain,    the
                                                                         the   annual
                                                                             annual    maxima
                                                                                     maxima   in in
                                                                                                  thethe period
                                                                                                      period     1951–1990,
                                                                                                              1951–1990,     by means
                                                                                                                          by means    of
                                  of an extreme    value  analysis, fitting an EVI distribution.   White   areas in the maps
                                 an extreme value analysis, fitting an EVI distribution. White areas in the maps in Figure 2  in  Figure
                                  2 represent
                                 represent  cellscells  characterized
                                                   characterized         by unrealistic
                                                                  by unrealistic         snow accumulation
                                                                                 snow accumulation       (SWE >(70  SWE  > 702 ),kN/m
                                                                                                                      kN/m        which),
                                  which  were    disregarded   in the  analysis according  to  the  already  mentioned
                                 were disregarded in the analysis according to the already mentioned criterion.          criterion.
                                       The reference ground snow load map, derived for each climate region from the
                                 analysis of observations covering the same period [33] during the ESLRP, and reported in
                                 EN1991-1-3 Annex C (Figure 3a) was compared with the snow load map derived according
Extreme Ground Snow Loads in Europe from 1951 to 2100
Climate 2021, 9, x FOR PEER REVIEW                                                                                                     8 of 20

Climate 2021, 9, 133                   The reference ground snow load map, derived for each climate region from the 8anal-     of 20

                                 ysis of observations covering the same period [33] during the ESLRP, and reported in
                                 EN1991-1-3 Annex C (Figure 3a) was compared with the snow load map derived accord-
                                 ing  to Climate
                                 to the  the Climate  Models
                                                  Models       Ensemble
                                                          Ensemble   meanmean   (Figure
                                                                           (Figure       3b),
                                                                                   3b), in    in terms
                                                                                           terms        of differences
                                                                                                  of differences        of charac-
                                                                                                                  of characteristic
                                 teristic values (Figure 3c). To be consistent with EN1991-1-3    provisions,  cells characterized
                                 values (Figure 3c). To be consistent with EN1991-1-3 provisions, cells characterized by
                                 by  altitude
                                 altitude     higher
                                           higher    than
                                                  than 15001500  m are
                                                              m are notnot represented
                                                                        represented      in Figure
                                                                                     in Figure  3. 3.

                       (a)                                         (b)                                             (c)
      Figure 3.
      Figure 3. Characteristic
                Characteristic ground    snow load
                               ground snow    load maps
                                                   maps as
                                                        as provided in EN1991-1-3:2003
                                                           provided in                 (a) and
                                                                       EN1991-1-3:2003 (a) and derived
                                                                                               derived according
                                                                                                        according to
                                                                                                                   to the
                                                                                                                      the Climate
                                                                                                                          Climate
      Models  Ensemble  mean    (b), difference map between  CMs ensemble and  EN1991-1-3:2003  (c) for the period  1951–1990.
      Models Ensemble mean (b), difference map between CMs ensemble and EN1991-1-3:2003 (c) for the period 1951–1990.

                                       The reference
                                             reference map
                                                         mapin  inFigure
                                                                   Figure3a3awas
                                                                               wasobtained
                                                                                    obtained   considering
                                                                                             considering   thethe   altitude
                                                                                                               altitude       of the
                                                                                                                          of the  cell cell of
                                                                                                                                       of the
                                 the  climate
                                 climate   modelmodel
                                                   andand     the snow
                                                         the snow         load-altitude
                                                                     load-altitude        relationship
                                                                                     relationship        provided
                                                                                                    provided          in EN1991-1-3:2003
                                                                                                                in EN1991-1-3:2003       [34]
                                 [34] forcorresponding
                                 for the  the corresponding       climatic
                                                             climatic       regions.
                                                                       regions.
                                       Error statistics (root-mean-square error, RMSE, and mean absolute error, MAE) were
                                 evaluated considering
                                              consideringcharacteristic
                                                              characteristicload
                                                                               loadvalues
                                                                                     values  obtained
                                                                                           obtained  fromfrom  RCMs
                                                                                                            RCMs         simulations
                                                                                                                     simulations   overover
                                                                                                                                          the
                                 period
                                 the      1951–1990
                                     period    1951–1990(ensemble
                                                            (ensemblemean)   andand
                                                                         mean)     thethe
                                                                                       reference
                                                                                          referencevalues
                                                                                                      valuesobtained
                                                                                                              obtained  from  thethe
                                                                                                                           from    analysis
                                                                                                                                      analy-
                                 of measurements
                                 sis of measurements   in ESLRP
                                                           in ESLRP forfor
                                                                        thethe
                                                                            different  climatic
                                                                                different        regions
                                                                                          climatic  regionsdefined
                                                                                                              definedin [33,34],  shown
                                                                                                                         in [33,34], shown  in
                                 Figure
                                 in Figure1. 1.
                                             Error  statistics
                                                Error statisticswere
                                                                  werethus
                                                                        thuscomputed
                                                                              computedfor foreach
                                                                                              eachcell
                                                                                                    cellin
                                                                                                         inthe
                                                                                                            the climatic
                                                                                                                 climatic region (Alpine,
                                 Mediterranean, Central
                                 Mediterranean,      Central East,
                                                                East, Central
                                                                      Central West, Iberian Peninsula, UK and Eire) comparing   comparing
                                 snow loads given by the RCMs and EN provisions. Error values were then averaged for
                                 cells belonging to the same region and reported in Table     Table 2.
                                                                                                     2.

                                       2. RMSE and MAE statistics
                                 Table 2.              statistics between
                                                                  between RCMs
                                                                          RCMs ensemble
                                                                               ensemble mean and
                                                                                             and EN1991-1-3:2003
                                                                                                 EN1991-1-3:2003 ground
                                 snow load map.

                                                   Climatic Region
                                          Climatic Region                     RMSE (kN/m2 ) RMSE (kN/m2) MAEMAE
                                                                                                            (kN/m(kN/m
                                                                                                                  2)  2)

                                               Alpine    Alpine                      2.43              2.43              1.44   1.44
                                                    Mediterranean
                                          Mediterranean                              1.10              1.10              0.73   0.73
                                            Central East
                                                      Central East                   0.39              0.39              0.30   0.30
                                           Central West
                                                      Central West                   0.32              0.32              0.16   0.16
                                         Iberian Peninsula                           0.83                                0.34
                                                   Iberian Peninsula
                                              UK–Eire                                0.36              0.83              0.17   0.34
                                                         UK–Eire                                       0.36                     0.17

                                      RMSE values
                                              values range                                           2
                                      RMSE            range from
                                                             from 0.32
                                                                   0.32 (Central
                                                                        (Central West)
                                                                                 West)to
                                                                                       to2.43
                                                                                          2.43kN/m
                                                                                               kN/m2 (Alpine)
                                                                                                       (Alpine) and
                                                                                                                and highlight
                                                                                                                    highlight
                                 significant errors especially for the Alpine, Mediterranean  and Iberian regions.
                                 significant errors especially for the Alpine, Mediterranean and Iberian regions.  Differences
                                                                                                                        Differ-
                                 in error magnitude can be motivated by the different orographic features. In fact, the
                                 ences in error magnitude can be motivated by the different orographic features. In fact,
                                 considerable smoothing of surface orography in RCMs, associated to cell dimension, leads
                                 to higher errors in orographically structured terrain [27], while regions characterized with
                                 small orography variability show a better performance. Moreover, higher snow loads are
Extreme Ground Snow Loads in Europe from 1951 to 2100
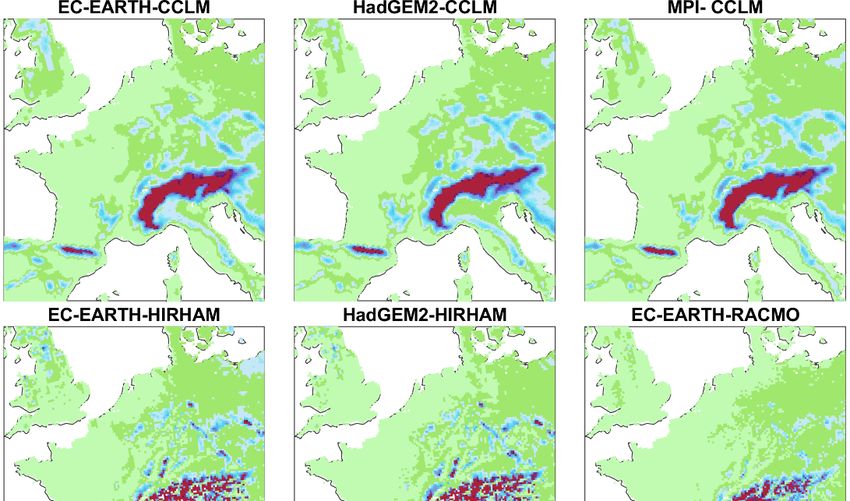
Climate 2021, 9, 133                                                                                            9 of 20

                       associated to high altitude regions and consequently higher absolute errors are obtained
                       for regions such as the Alps.
                             The detected errors suggest the adoption of a calibration strategy to analyze climate
                       projections of snow water equivalent. The FC approach is an efficient methodology, com-
                       monly used in climate impact research [20]. As described before, changes can be derived
                       comparing future and current climate simulations provided by RCMs and then applied to
                       observed values at local scale to estimate modeled future values. In this way, it is assumed
                       that the ensemble of climate simulations is particularly effective in detecting changes in the
                       statistics of climate variables over time [54]. In Section 3.3, the ability of the investigated
                       RCM ensemble to detect changes for the observation period (1951–2020) will be evaluated
                       at selected weather stations.

                       3.2. Future Climate Projections
                              In this section, climate projections provided by the nine climate models described
                       in Table 1 are analyzed to assess future changes in characteristic ground snow loads
                       depending on the RCP4.5 and RCP8.5 scenarios. With this objective, consecutive time
                       windows of 40 years, shifted 10 years from each other, are considered from 1950 to 2090,
                       i.e., (1951–1990, 1961–2000, 1971–2010, . . . , 2050–2090).
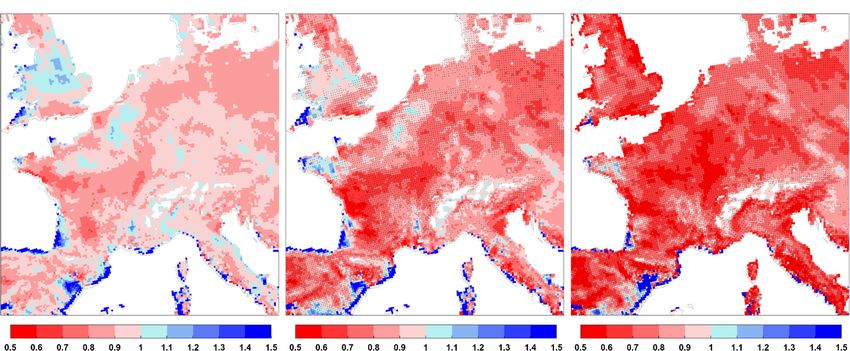
                              Ensemble mean FC maps referring to three time windows (1971–2010, 1991–2030
                       and 2011–2050) are illustrated in Figures 4 and 5, for two scenarios RCP4.5 and RCP8.5,
                       respectively. These maps show the regional variability of the expected future trends across
                       Europe. A general decreasing trend is obtained for most of Europe, but there are still areas
                       characterized by constant or increasing trend in the future.
                              The statistical significance of the expected changes was evaluated performing a two-
                       sample Kolmogorov–Smirnov (K-S) test, for the distribution of annual maxima in the
                       moving time windows at each cell. A 5% significance level was considered, and dots
                       were added in the maps at cells where changes are statistically significant for the K-S test
                       according to the majority of the investigated climate models. Although in the first time
                       windows statistical significance is observed in few regions, it substantially increases moving
                       far into the future; in fact, almost the whole EUR-11 domain is characterized by statistically
                       significant changes if the time window 2011–2050 is considered (see Figures 4 and 5).
                              In Figures 4 and 5, ensemble mean values of FC computed for each cell in the EUR11
                       domain are shown, however, an explicit evaluation of uncertainty among the different
                       simulations is needed to ensure robust climate adaptation strategies [61]. A first assessment
                       of the uncertainty in the detected changes was carried out considering the variability of dif-
                       ferent climate change projections. The agreement among each of the 18 (2RCPs × 9 RCMs)
                       alternative climate projections was evaluated following the procedure illustrated in [61].
                       FC were classified for all grid cells into four quartiles and an integer value of 1 (lower
                       quartile) to 4 (upper quartile) was assigned to each quartile. The quartile assignment was
                       done separately for each of the 18 simulations, then, for each grid cell, the most frequent
                       quartile value assigned to each grid cell (i.e., the mode) was identified together with the fre-
                       quency of the mode (i.e., the number of occurrences of the mode). When all 18 simulations
                       are available for the investigated grid cell, the frequency of the mode ranges from 5 (no
                       agreement among simulations) to 18 (perfect agreement). This parameter represents an
                       index of the agreement among different models and scenarios; moreover, its complement
                       to 18 can indirectly provide a rough quantification of the uncertainty of the projections.
Extreme Ground Snow Loads in Europe from 1951 to 2100
Climate 2021,
Climate 2021, 9,
              9, 133
                 x FOR PEER REVIEW                                                                                              10
                                                                                                                                 10 of 20
                                                                                                                                    of 20

                    (a)                                           (b)                                           (c)
     Figure 4.
     Figure  4. FC
                FC maps
                    maps (ensemble
                          (ensemble mean)
                                    mean) for
                                          for characteristic
                                               characteristic ground
                                                              ground snow
                                                                      snow loads,
                                                                            loads, associated
                                                                                   associated to
                                                                                               to 0.02
                                                                                                  0.02 probability
                                                                                                       probability of
                                                                                                                   of exceedance
                                                                                                                      exceedance in
                                                                                                                                 in
     one  year, in the Euro-Cordex domain  (first row) and  a focus on central Europe  (second  row).  Three moving   time
     one year, in the Euro-Cordex domain (first row) and a focus on central Europe (second row). Three moving time windows windows
     are considered (1971–2010 (a), 1991–2030 (b), and 2011–2050 (c)) in the elaboration with respect to 1951–1990, based on
     are considered (1971–2010 (a), 1991–2030 (b), and 2011–2050 (c)) in the elaboration with respect to 1951–1990, based on
     RCP4.5 scenario. The dots indicate statistically significant changes in the distribution of annual maxima at the 5% level.
     RCP4.5 scenario. The dots indicate statistically significant changes in the distribution of annual maxima at the 5% level.

                                      The results are shown in terms of mode and frequency of the mode for FCs in the time
                                 window 2011–2050 with respect to 1951–1990, in Figure 6a,b, respectively. The mode of
                                 quartile (Figure 6a) shows the most frequent quartile value associated with each grid cell.
                                 For example, in a large part of the Scandinavian region (red areas) the mode is equal to four
                                 (fourth quartile), corresponding to higher FC values. In the same areas, a high frequency
                                 of the mode value is obtained, therefore a high level of agreement is achieved among the
                                 investigated ensemble members (blue areas in Figure 6b).
Climate 2021,
Climate       9, x133
        2021, 9,   FOR PEER REVIEW                                                                                                1111of
                                                                                                                                       of 20
                                                                                                                                          20

                    (a)                                           (b)                                             (c)
     Figure
     Figure 5.
            5. FC
               FC maps
                   maps (ensemble
                         (ensemble mean)
                                   mean) for
                                          for characteristic
                                               characteristic ground
                                                              ground snow
                                                                      snow loads,
                                                                            loads, associated
                                                                                   associated to
                                                                                              to 0.02
                                                                                                 0.02 probability
                                                                                                      probability of
                                                                                                                  of exceedance
                                                                                                                     exceedance in
                                                                                                                                in
     one
     one year,
         year, in
               in the
                  the Euro-Cordex
                      Euro-Cordex domain   (first row)
                                  domain (first   row) and
                                                       and aa focus
                                                              focus on
                                                                    on central
                                                                       central Europe
                                                                               Europe (second
                                                                                       (second row).
                                                                                               row). Three
                                                                                                      Three moving
                                                                                                            moving time
                                                                                                                     time windows
                                                                                                                          windows
     are considered (1971–2010 (a), 1991–2030 (b), and 2011–2050 (c)) in the elaboration with respect to 1951–1990, based on
     are considered (1971–2010 (a), 1991–2030 (b), and 2011–2050 (c)) in the elaboration with respect to 1951–1990, based on
     RCP8.5 scenario. The dots indicate statistically significant changes in the distribution of annual maxima at the 5% level.
     RCP8.5 scenario. The dots indicate statistically significant changes in the distribution of annual maxima at the 5% level.

                                       The
                                       The results
                                             level of are shown among
                                                      agreement    in termsclimate
                                                                             of mode     and frequency
                                                                                     simulations           of the
                                                                                                   varies on        mode for FCs
                                                                                                               the investigated     in the
                                                                                                                                  territory.
                                 time  window
                                 Looking          2011–2050
                                             at the  histogram with
                                                                  of respect  to 1951–1990,
                                                                     the frequency     of the in  Figure
                                                                                               mode   in 6a   and 6b,
                                                                                                          Figure    6b: respectively.
                                                                                                                         an agreement  The
                                                                                                                                         is
                                 mode    of quartile  (Figure  6a)  shows  the  most   frequent   quartile value    associated
                                 obtained (≥10 of 18) for 52% of the EUR-11 domain, higher frequency values (≥16 of 18)         with  each
                                 grid  cell. For in
                                 are obtained     example,
                                                    7% of thein domain,
                                                                a large part
                                                                         while offull
                                                                                  the agreement
                                                                                       Scandinavian    region
                                                                                                   among   the (red   areas) the
                                                                                                                simulations       mode in
                                                                                                                               occurred  is
                                 equal   to four  (fourth
                                 3% of the grid cells.     quartile),  corresponding      to higher  FC   values.   In the  same  areas,  a
                                 high Infrequency    of  the mode    value  is  obtained,    therefore  a  high   level  of  agreement
                                           Figure 7, the envelope of FC is illustrated for the two considered emission scenarios.        is
                                 achieved    among
                                 For each cell        the
                                                 of the   investigated
                                                        EUR-11   domain, ensemble
                                                                           the maximummembers    (blue
                                                                                             value     areas
                                                                                                   of FC       in moving
                                                                                                          in the  Figure 6b).
                                                                                                                            time windows
                                 t is shown.
Climate2021,
Climate  2021,9,9,x 133
                    FOR PEER REVIEW                                                                                                          12 12
                                                                                                                                                 of of2020

                         (a)                                                                         (b)
       Figure 6. Mode of quartile (a) and frequency of the mode map and histogram (b) among the 18 different projections of
       expected changes in characteristic ground snow loads in the time window 2011–2050 with respect to 1951–1990. In (b) red
       areas in the map indicate lower intermodel agreement and higher uncertainty while blue areas indicate higher agreement
       and lower uncertainty. The histogram is drawn for the frequency of the mode considering the number of cells as % of the
       total in the EUR-11 domain.

                                            The level of agreement among climate simulations varies on the investigated terri-
                       (a)            tory.  Looking at the histogram of the frequency of           (b)the mode in Figure 6b: an agreement is
                                      obtained (≥10 of 18) for 52% of the EUR-11 domain, higher frequency values (≥16 of 18)
     Figure
       Figure6.6.Mode
                   Modeofofquartile
                            quartile(a)
                                      (a)and
                                      are andfrequencyin of
                                               frequency
                                           obtained      7%ofthe
                                                               ofmode
                                                               the  mode
                                                                   the    map
                                                                           mapand
                                                                         domain,andhistogram
                                                                                     histogram
                                                                                  while          (b)
                                                                                                   (b)among
                                                                                                       amongthe
                                                                                           full agreement        the1818different
                                                                                                                among     differentprojections
                                                                                                                                    projections
                                                                                                                           the simulations      ofof
                                                                                                                                               occurred
     expected    changes in characteristic
       expected changes in characteristic   ground   snow   loads   in the time window    2011–2050    with   respect   to 1951–1990.   In (b) red
                                      in 3% ground    snowcells.
                                              of the grid     loads in the time window 2011–2050 with respect to 1951–1990. In (b) red
     areas in the map indicate lower intermodel agreement and higher uncertainty while blue areas indicate higher agreement
       areas in the map indicate lower intermodel       agreement
                                            In Figure 7, the envelope and higher
                                                                             of FCuncertainty   while
                                                                                    is illustrated    forblue
                                                                                                           theareas
                                                                                                                two indicate
                                                                                                                      consideredhigher  agreement
                                                                                                                                     emission    scenar-
     and lower uncertainty. The histogram is drawn for the frequency of the mode considering the number of cells as % of the
       and lower uncertainty. The ios.histogram
                                           For    is
                                                 eachdrawn
                                                       cell  for
                                                             of  the
                                                                the    frequency
                                                                      EUR-11     of the
                                                                                domain,  mode
                                                                                            the considering
                                                                                                maximum         the  number
                                                                                                                 value   of  FCof cells
                                                                                                                                 in  theas % of the time
                                                                                                                                          moving
     total in the EUR-11 domain.
       total in the EUR-11 domain.windows is shown.
                                          The level of agreement among climate simulations varies on the investigated terri-
                                    tory. Looking at the histogram of the frequency of the mode in Figure 6b: an agreement is
                                    obtained (≥10 of 18) for 52% of the EUR-11 domain, higher frequency values (≥16 of 18)
                                    are obtained in 7% of the domain, while full agreement among the simulations occurred
                                    in 3% of the grid cells.
                                          In Figure 7, the envelope of FC is illustrated for the two considered emission scenar-
                                    ios. For each cell of the EUR-11 domain, the maximum value of FC in the moving time
                                    windows is shown.

                                    (a)                                                                        (b)
       Figure 7.7. FC
                   FC envelope
                      envelopemaps
                               mapsfor
                                     forcharacteristic
                                         characteristicground
                                                        groundsnow
                                                                snow  loads
                                                                    loads   according
                                                                          according to to
                                                                                       thethe RCP4.5
                                                                                           RCP4.5  (a) (a)
                                                                                                       andand RCP8.5
                                                                                                           RCP8.5 (b). (b).
                                                                                                                        For For
                                                                                                                            eacheach
                                                                                                                                 cell
       cell of the  EUR-11 domain, the maximum    value  of FC in the moving time windows
       of the EUR-11 domain, the maximum value of FC in the moving time windows is shown.    is shown.

                                          Green areas show zones where the update of characteristic values is not needed
                                      (max(FC) ≤ 1) while in the blue colored areas an increase is expected (max(FC) > 1)
                                      according to the investigated climate ensemble and an update of the reference value of
                                      ground snow load would be recommended. In fact, an adaptation of design load is needed
                                                                                                 (b)
                                  (a) when an increase of the load is expected for the future to guarantee that structure designed
                                      now will be able to withstand future changes. In case of expected decreasing trend, no
     Figure 7. FC envelope maps for characteristic ground snow loads according to the RCP4.5 (a) and RCP8.5 (b). For each
     cell of the EUR-11 domain, the maximum value of FC in the moving time windows is shown.
Green areas show zones where the update of characteristic values is not needed
                        (max(FC) ≤ 1) while in the blue colored areas an increase is expected (max(FC) > 1) ac-
                        cording to the investigated climate ensemble and an update of the reference value of
Climate 2021, 9, 133                                                                                                  13 of 20
                        ground snow load would be recommended. In fact, an adaptation of design load is needed
                        when an increase of the load is expected for the future to guarantee that structure designed
                        now will be able to withstand future changes. In case of expected decreasing trend, no
                        adaptationisisnecessary
                       adaptation       necessarysince
                                                   sincestructure
                                                         structureshould
                                                                   shouldbe bedesigned
                                                                                designedaccording
                                                                                         accordingto tothe
                                                                                                        thecurrent
                                                                                                            currentvaluevalue
                        ofthe
                       of  theload
                                loadwhich
                                     whichcan
                                            canbebeexperienced
                                                    experiencedby bythe
                                                                     thestructure
                                                                         structureduring
                                                                                     duringthe
                                                                                            thefirst
                                                                                                firstyears
                                                                                                      yearsofofits
                                                                                                                 itsservice.
                                                                                                                     service.
                              FC values higher
                             FC           higher than
                                                  thanoneoneare
                                                             areobtained
                                                                  obtained forfor
                                                                               UK,  Norway
                                                                                  UK,  NorwayandandSweden,   but the
                                                                                                       Sweden,      butmost
                                                                                                                          the
                        significant
                       most          FC values
                               significant      result for
                                           FC values       the southern
                                                        result            part of the
                                                               for the southern       French
                                                                                    part      Atlantic
                                                                                         of the  Frenchcoast,   for the
                                                                                                          Atlantic        Ibe-
                                                                                                                       coast,
                        rianthe
                       for    Peninsula,  and Mediterranean
                                 Iberian Peninsula,             coastal areas
                                                      and Mediterranean        whereareas
                                                                            coastal   few snow
                                                                                          whereevents    are however
                                                                                                   few snow     events are ex-
                        perienced.
                       however experienced.

                       3.3.
                        3.3. Evaluation
                             Evaluation ofofCurrent
                                            Currentand
                                                     andFuture
                                                         FutureTrends
                                                                 TrendsatatSelected
                                                                            SelectedWeather
                                                                                     WeatherStations
                                                                                              Stations
                              A
                              A first comparison against point observations was carriedout
                                first comparison    against point observations    was  carried  outtotoassess
                                                                                                        assessthe
                                                                                                               theability
                                                                                                                   abilityof
                                                                                                                           of
                       climate
                        climate projections to reproduce current and past trends. To the aims of the present study,
                                 projections  to  reproduce  current and   past trends. To  the aims  of the present  study,
                       42
                        42 weathers
                            weathers station
                                        station in
                                                 inGermany
                                                    Germanyand andSwitzerland,
                                                                    Switzerland,characterized
                                                                                    characterized bybyaahigh-quality
                                                                                                          high-qualitydata
                                                                                                                        data
                       series
                        series of snow measurements in the period 1951–2020, were considered (seeFigure
                               of snow   measurements    in the period  1951–2020,    were  considered   (see  Figure8).
                                                                                                                       8).

                        Figure8.8.Elevation
                       Figure     Elevationmap
                                            mapand
                                                andgeographical
                                                    geographicallocations
                                                                 locationsof
                                                                           ofthe
                                                                              the42
                                                                                  42weather
                                                                                    weatherstations
                                                                                            stationsininTable
                                                                                                         Table3.3.

                             Obviously, to
                            Obviously,    toobtain
                                              obtainaageneral
                                                           generalassessment
                                                                     assessment forfor the
                                                                                        thewhole
                                                                                             wholeEuropean
                                                                                                      European territory,
                                                                                                                   territory,more
                                                                                                                               more
                        uniformlydistributed
                       uniformly   distributedweather
                                                  weatherstations
                                                              stationsshould
                                                                        shouldbe
                                                                               beconsidered.
                                                                                    considered.However,
                                                                                                    However,thisthisisisnot
                                                                                                                         notan
                                                                                                                             aneasy
                                                                                                                                easy
                       task
                        tasksince
                             sincesnow
                                   snowdatadataareare
                                                   stillstill
                                                          poorly   documented
                                                              poorly   documentedand and
                                                                                       longlong
                                                                                              seriesseries
                                                                                                      of high-quality    data, from
                                                                                                            of high-quality     data,
                       which   trend trend
                        from which   can becanevaluated,      are available
                                                  be evaluated,              for few
                                                                    are available   forcountries     in Europe
                                                                                         few countries            [62]. [62].
                                                                                                           in Europe     Moreover,
                                                                                                                              More-
                       the number
                        over,       of reliable
                              the number          weather
                                            of reliable        station
                                                          weather       can vary
                                                                     station      fromfrom
                                                                             can vary     site to  site,
                                                                                                site     so that
                                                                                                     to site,     the the
                                                                                                              so that  coverage   of
                                                                                                                           coverage
                       various  areas
                        of various    is non-uniform.
                                   areas  is non-uniform.
Climate 2021, 9, 133                                                                                                       14 of 20

      Table 3. Comparison of FC of qk in the time window 1981–2020 with respect to 1951–1990 obtained from the RCMs ensemble
      and the observations.

       Station                                            Lon            Lat          Alt.         FC              FC
                                 Station
         Id.                                               [◦ ]          [◦ ]         [m]         Obs.        Ensemble Mean
          S01                 Angermünde                  13.99         53.03          54         0.72              0.81
          S02                    Arkona                   13.43         54.68          42         1.01              0.94
          S03                   Augsburg                  10.94         48.43         462         0.61              0.81
          S04                      Basel                   7.58         47.54         316         1.09              0.79
          S05              Berlin-Dahlem (FU)             13.30         52.45          51         0.79              0.78
          S06                      Bern                    7.46         46.99         553         0.86              0.86
          S07                Bernburg/Saale               11.71         51.82          85         0.84              0.94
          S08                    Bremen                    8.80         53.05           4         0.68              0.90
          S09                   Chemnitz                  12.87         50.79         418         1.10              0.90
          S10                    Cottbus                  14.32         51.78          69         0.72              0.82
          S11                      Elm                    9.18          46.92         958         0.80              0.92
          S12                Essen-Bredeney                6.97         51.40         150         0.87              0.69
          S13                    Freiburg                  7.83         48.02         237         0.68              0.75
          S14                  Geisenheim                  7.95         49.99         110         0.88              0.94
          S15                     Görlitz                 14.95         51.16         238         0.94              0.86
          S16                   Göttingen                  9.95         51.50         167         0.82              0.79
          S17            Hamburg-Fuhlsbüttel               9.99         53.63          14         0.77              0.85
          S18                   Hannover                   9.68         52.46          59         0.78              0.90
          S19             Heinersreuth-Vollhof            11.52         49.97         350         1.01              0.80
          S20               Hohenpeißenberg               11.01         47.80         977         0.87              0.86
          S21               Jena (Sternwarte)             11.58         50.93         155         0.87              0.93
          S22                 Kahler-Asten                 8.49         51.18         839         0.79              0.80
          S23                 Kaiserslautern               7.76         49.43         271         0.64              0.78
          S24                Kirchdorf/Poel               11.43         54.00          12         0.93              0.86
          S25                     Kleve                   6.10          51.76          46         0.74              0.82
          S26             Leipzig-Holzhausen              12.45         51.32         138         0.73              0.90
          S27                  Lindenberg                 14.12         52.21          98         0.79              0.83
          S28                     Lingen                   7.31         52.52          22         0.67              0.76
          S29                    Locarno                   8.79         46.17         367         0.82              0.77
          S30                    Lugano                    8.96         46.00         273         1.05              0.74
          S31                  Magdeburg                  11.58         52.10          79         0.65              0.88
          S32                   Neuchotel                  6.95         47.00         485         0.76              0.91
          S33          Neukirchen-Hauptschwenda            9.41         50.89         500         0.79              0.77
          S34                   Oberstdorf                10.28         47.40         806         0.84              1.00
          S35                  Regensburg                 12.10         49.04         365         0.96              0.81
          S36            Rostock-Warnemünde               12.08         54.18           4         0.88              0.83
          S37                   Schwerin                  11.39         53.64          59         0.97              0.82
          S38               Sigmaringen-Laiz               9.19         48.07         581         0.80              0.76
          S39            Stuttgart-Echterdingen            9.22         48.69         371         0.72              0.83
          S40           Weißenburg-Emetzheim              10.93         49.01         439         0.80              0.79
          S41                   Würzburg                   9.96         49.77         268         1.01              0.90
          S42                     Zurich                   8.57         47.38         556         0.91              0.76

                                     FC were evaluated at the selected weather stations for characteristic values of ground
                                snow loads qk , mean of annual maxima Q and the coefficient of variation of annual maxima
                                COVQ for the available time windows in the observation period (1951–1990, 1961–2000,
                                1971–2010 and 1981–2020). Results are summarized in Figure 9 for FC of qk , in Figure 10a
                                for FC of Q and in Figure 10b for FC of COVQ , considering the average µ and the confidence
                                interval µ ± 1.645σ. Observed trends (in red) were compared against those obtained by
                                climate projections for the corresponding cells for the historical and future period (in blue
                                and in green for the RCP4.5 and 8.5, respectively).
S37                      Schwerin                            11.39           53.64            59             0.97                  0.82
         S37                      Schwerin                            11.39           53.64            59             0.97                  0.82
          S38                  Sigmaringen-Laiz                        9.19            48.07           581             0.80                  0.76
         S38                  Sigmaringen-Laiz                        9.19            48.07           581             0.80                  0.76
          S39               Stuttgart-Echterdingen                     9.22            48.69           371             0.72                  0.83
         S39               Stuttgart-Echterdingen                     9.22            48.69           371             0.72                  0.83
          S40
Climate 2021,              Weißenburg-Emetzheim                        10.93           49.01           439             0.80                  0.79
         S409, 133         Weißenburg-Emetzheim                       10.93           49.01           439             0.80                  0.79 15 of 20
          S41                     Würzburg                             9.96            49.77           268             1.01                  0.90
         S41                      Würzburg                            9.96            49.77           268             1.01                  0.90
          S42                       Zurich                             8.57            47.38           556             0.91                  0.76
         S42                        Zurich                            8.57            47.38           556             0.91                  0.76

                                      Figure9. 9.FC
                                    Figure        FCof of characteristic
                                                           characteristic values
                                                                             values of  ground
                                                                                    ofground     snow
                                                                                        groundsnow       load
                                                                                                  snowloadload q,k,,associated
                                                                                                                     associated
                                                                                                                     associatedtoto0.02
                                                                                                                                      0.02probability
                                                                                                                                            probabilityofof
                                                                                                                                                          ex-
                                     Figure  9. FC
                                      ceedance        of characteristic
                                                  in one   year, for the values    of
                                                                            investigated  weather stations.    Average valueto 0.02   andprobability
                                                                                                                                           confidenceofinter-
                                                                                                                                                         ex-
                                    exceedance
                                     ceedance    ininone
                                                      one    year,
                                                          year,  forfor  the  investigated
                                                                      theaccording
                                                                           investigated      weather
                                                                                         weather        stations.
                                                                                                    stations. AverageAverage    value
                                                                                                                            value      µ and
                                                                                                                                     and       confidence
                                                                                                                                          confidence  inter-
                                      val ± 1.645          are shown                to point   observations   (in  red) and    regional climate  model   pro-
                                    interval
                                     val    ±µ1.645
                                                ± 1.645σ are are shown
                                                              shown        according
                                                                        according  to  to point
                                                                                      point      observations
                                                                                              observations   (in
                                      jections depending on the scenario RCP4.5 (in blue) and RCP8.5 (in green).
                                                                                                                 (in
                                                                                                                 red)  red)
                                                                                                                          andand regional
                                                                                                                              regional     climate
                                                                                                                                       climate     model
                                                                                                                                                model   pro-
                                     jections depending
                                    projections   depending   ononthethe
                                                                       scenario  RCP4.5
                                                                          scenario RCP4.5 (in(in
                                                                                               blue) and
                                                                                                 blue)  andRCP8.5
                                                                                                             RCP8.5   (in(in
                                                                                                                           green).
                                                                                                                             green).

                                     (a)                                                                           (b)
                                    (a)                                                                           (b)
       Figure 10. FC of mean annual maxima ground snow load                        (a) and FC of coefficient of variation of annual maxima
      Figure
     Figure
       ground10.10.
                  FCFC
                 snow    of mean
                      of load
                          mean      annual
                                 annual
                                COV           maxima
                                         maxima
                                       (b), for         ground
                                                 theground  snowsnow
                                                     investigated  load load
                                                                        Q (a)
                                                                   weather     and(a)FC
                                                                             stations.and   FC ofvalue
                                                                                                    coefficient
                                                                                         of coefficient
                                                                                        Average              andofconfidence
                                                                                                        of variationvariation
                                                                                                                     of annualofmaxima
                                                                                                                                 annual ground
                                                                                                                              interval    maxima
                                                                                                                                          ±  1.645
      ground
     snow  load snow
                  COV  load
       are shown according    COV
                           (b), for   (b), for  the investigated  weather   stations.  Average    value     and  confidence ±interval
                                   to point observations (in red) and regional climate model projections depending on the shown
                                    the investigated    weather  stations. Average    value  µ and  confidence   interval µ   1.645σ  are±  1.645
                                                                                                                                           scenario
                        Q
      are shown
       RCP4.5
     according   (in according    to point(in
                     blue) observations
                 to point   and RCP8.5       observations
                                            (in green).     (in red)climate
                                                red) and regional     and regional    climate model
                                                                            model projections           projections
                                                                                                  depending    on thedepending    on the(in
                                                                                                                      scenario RCP4.5     scenario
                                                                                                                                            blue)
      RCP4.5 (in blue) and RCP8.5 (in green).
     and RCP8.5 (in green).
                                             It is important to highlight that observations and predictions give similar trends for
                                      theInIt Table
                                               is important
                                           study       3, results
                                                     area,       to highlight
                                                                     for single
                                                            in particular,     thethat observations
                                                                                    stations
                                                                                    decreasing          and predictions
                                                                                                aretendency
                                                                                                     reported  infor  the FCsgiveofsimilar
                                                                                                                   characteristic   values  trends
                                                                                                                                     qk in the    time
                                                                                                                                             of groundfor
                                     the
                                    windowstudy     area,
                                                1981–2020. in  particular,   the   decreasing     tendency    in  characteristic
                                      snow load predicted by the projections matches the observations. This decreasing trend       values   of  ground
                                     snow
                                      for It
                                          the load
                                             is      predicted
                                                important
                                                investigated       by the
                                                              to area
                                                                  highlight projections
                                                                       is the that      of amatches
                                                                                    observations
                                                                                result                 thepredictions
                                                                                                     and
                                                                                             significant    observations.
                                                                                                           reduction       theThis
                                                                                                                        give
                                                                                                                        of          decreasing
                                                                                                                              similar
                                                                                                                               mean    trendsoffor
                                                                                                                                       value       trend
                                                                                                                                                    the
                                                                                                                                                  annual
                                     for
                                    studythe
                                      maxima   investigated
                                            area, inwhich        area
                                                       particular,    is  the result
                                                                     the decreasing
                                                                is combined            of a significant
                                                                                 with a tendency
                                                                                          contrasting     reduction
                                                                                                      in characteristicof the mean    value
                                                                                                                            values of(COV
                                                                                                         increase in variability       groundof  annual
                                                                                                                                                 snow
                                                                                                                                             ), and   it is
                                     maxima
                                    load  predicted   which
                                                        by     is projections
                                                             the  combined with        a contrasting
                                                                                  matches    the        increase This
                                                                                                 observations.      in variability
                                                                                                                          decreasing (COV   ), and
                                                                                                                                        trend  for   it is
                                                                                                                                                    the
                                      consistent with the theory illustrated by O’Gorman in [38] about the contrasting responses
                                     consistent with
                                    investigated     areathe    theory
                                                           is the  resultillustrated   by O’Gorman
                                                                           of a significant    reductioninof[38]
                                                                                                              theabout
                                                                                                                   mean the   contrasting
                                                                                                                           value of annualresponses
                                                                                                                                             maxima
                                    Q which is combined with a contrasting increase in variability (COVQ ), and it is consistent
                                    with the theory illustrated by O’Gorman in [38] about the contrasting responses of mean
                                    and extreme snowfall to climate change. The increase in variability is often combined with
                                    an increase in the skewness of the distribution.
                                          It is important to recall that extreme events in a changing climate are much more
                                    sensitive to changes in the variability than on averages as first demonstrated by Katz and
                                    Brown in [63] and this sensitivity is relatively greater the more extreme the event. In fact,
Climate 2021, 9, 133                                                                                          16 of 20

                       the increase in variability, which is confirmed by the observations and expected to be even
                       more relevant for the future, may have a significant impact in the long-term structural
                       reliability. For example, in [25] the assessment of variations in structural reliability over
                       time is discussed, starting from the expected changes in mean and COV of annual maxima.
                            Error statistics (root-mean-square error, RMSE) between FC obtained from the RCMs
                       ensemble and the point observations are reported in Table 4 considering the whole inves-
                       tigated area (RMSE in regional average) and the single stations (mean of RMSE for the
                       single stations). RMSE were computed for qk , mean of annual maxima Q and coefficient of
                       variation of annual maxima COVQ considering the two different emission scenarios. It is
                       important to recall that the simulation period for the RCP scenarios starts from 2006.

                       Table 4. RMSE statistics between FC obtained from the RCMs ensemble and the point measurements
                       for the investigated weather stations.

                          Scenario      Parameter      RMSE Regional Average        RMSE Single Stations Average
                                           qk                   0.021                           0.113
                           RCP4.5          Q                    0.073                           0.150
                                          COVQ                  0.108                           0.239
                                           qk                   0.018                           0.108
                           RCP8.5          Q                    0.055                           0.139
                                          COVQ                  0.068                           0.228

                            Results confirm the capability of the ensemble to adequately reproduce regional trends
                       for the investigated parameters, as it was already observed in Figures 9 and 10. Clearly,
                       higher errors were obtained considering FC for individual weather stations. It can be
                       also noticed that the scenario RCP8.5, which is characterized by lower errors than RCP4.5,
                       seems to better capture trends up to now.

                       4. Conclusions
                            The estimate of the evolution of extreme snow loads in a changing climate is a crucial
                       issue for structural design of roofs. In fact, even in a warmer climate, the relevance of snow
                       induced collapses is confirmed by the negative impacts of recent heavy snowfall events,
                       which took place in various European countries. In this context, the current assumption
                       of stationary climate for the statistical elaboration of historical extreme values of climatic
                       actions, is becoming controversial due to the impacts of climate change, that are calling for
                       the set-up of suitable adaptation strategies for a climate resilient structural design.
                            In the paper, changes in extreme ground snow loads in Europe from 1951 to 2100,
                       were estimated considering an ensemble of high-resolution projections, recently provided
                       by EURO-CORDEX. Maps obtained from climate model simulations for the historical
                       period were compared against maps based on observations, showing a general snow load
                       underestimation by the RCMs. This general underestimation was expected and can be
                       motivated by the gap between the scale of observations and of climate models, even at the
                       finest available resolution. In fact, the smoothing of surface topography in RCMs and the
                       consequent orography mismatch between RCMs grid and weather stations may lead to
                       significant biases in snow loads, especially in orographically structured terrain.
                            In the author’s opinion, this issue can be considerably mitigated when the evolution
                       of snow loads is described focusing on factors of change, rather than on absolute load
                       values. In fact, the adoption of a calibration strategy based on the FC approach, seems to be
                       very effective to overcome this problem, allowing a satisfactory estimate of the evolution
                       over time of snow loads at the scale of observations.
                            Consistently with the current techniques adopted to derive climatic load maps based
                       on observations, FC maps are derived considering consecutive time windows of 40 years,
                       shifted 10 years from each other. FC maps are an easy to use representation of climate
                       change signals to adapt load maps in codes and standards [58,59], as well as to assess
                       variations in structural reliability over time under non-stationary loads [25]. In addition,
You can also read