FAILURE CRITERIA FOR COMPOSITE MATERIALS UNDER MULTIAXIAL STRESS STATES
←
→
Page content transcription
If your browser does not render page correctly, please read the page content below
FAILURE CRITERIA FOR COMPOSITE MATERIALS UNDER MULTIAXIAL
                          STRESS STATES

                            Essam Totry1, Carlos González1, 2 and Javier LLorca1, 2
                        1
                         Departmento de Ciencia de Materiales, Universidad Politécnica de Madrid.
                    2
                      Instituto Madrileño de Estudios Avanzados en Materiales (IMDEA-Materiales).
                     E. T. S. de Ingenieros de Caminos. Ciudad Universitaria. 28040 – Madrid, Spain.

                                                   ABSTRACT
The potential of computational micromechanics to predict the failure locus of a unidirectional C/PEEK composite subjected
to transverse compression and longitudinal shear was established. Numerical simulations were compared with the
experimental results of [1], which contain detailed information of the matrix and fiber properties as well as the failure
micromechanisms during multiaxial loading. Analyses were based in the finite element analysis of a three-dimensional
representative volume element of the lamina microstructure and included the main deformation and failure mechanisms
observed experimentally, namely matrix shear yielding and interface decohesion. In addition, the numerical predictions of
the failure locus for composites with strong and weak interfaces were compared with those obtained by current
phenomenological failure models to establish the accuracy and range of validity of these criteria.

1. INTRODUCTION
Computational micromechanics is emerging rapidly as a very powerful tool to obtain the macroscopic
properties of engineering materials from the numerical simulation of the behavior of a representative
volume element (RVE) of the microstructure [2]. Applications of this methodology to polymer-matrix
composites (PMC) have began to appear recently [3, 4, 5] and they were mainly aimed to study the
effect of microstructural factors (fiber orientation, interface strength, etc.) on the onset and progression
of damage upon loading. Another interesting application in this field the prediction of the failure locus
of PMC lamina subjected to multiaxial stress states, an important and controverted problem. A recent
effort to assess the state-of-the-art developments in this matter is the World Wide Failure Exercise [6,
7, 8].
Computational micromechanics stands as a very useful tool in this area as it can provide "virtual tests"
which can be used to check the different failure criteria available in the literature. In addition, results of
virtual tests are cheaper and free from experimental constrains (buckling, free edge effects, failures at
end constraints). However, this methodology should be validated previously against experimental
results of PMC lamina subjected to multiaxial stress states and this is the main objective of this paper.
To this end, the failure locus of a unidirectional C/ PEEK composite subjected to transverse
compression and longitudinal shear was computed and compared with the experimental results of
Vogler and Kyriakides [1], which contain detailed information of the matrix and fiber properties as
well as the failure micromechanisms during multiaxial loading. The predicted failure locus was
compared with the predictions of Puck [9, 10] and LaRC [11] failure criteria and the influence of
matrix and interface properties on the accuracy of these criteria was discussed.

2. NUMERICAL MODEL
2.1 Representative volume element of the microstructure
The RVE of the lamina microstructure is a prism, with a square section of dimensions LxL in the 23
plane perpendicular to the fibers (Figure 1). The fiber centers in this plane were generated randomly
and sequentially following the strategy of the random sequential adsortion algorithm, as described in

                                                           1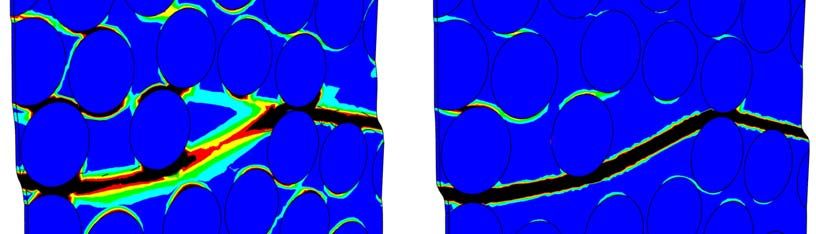
[12]. 30 fibers of 10 µm in diameter were included within the RVE with a volume fraction of 60%. It
was assumed that the lamina microstructure was given by an indefinite translation of this RVE along
the 2 and 3 axes to eliminate surface effects and, thus, the fiber positions within the RVE kept this
periodicity condition. To this end, fibers intersecting the RVE edges were split into an appropriate
number of parts and copied to the opposite sides of the square RVE to create the periodic
microstructure. Finally, the RVE was extruded along the fiber axis to obtain the three-dimensional
prism. The RVE was very thin along the 1 axis (t) because no deformation gradients occur along this
axis during transverse compression and longitudinal shear In fact, it was checked that the results of the
numerical simulations were independent of the thickness RVE, whose length was only limited by the
aspect ratio of the finite elements. Previous simulations of PMC lamina subjected to transverse
compression [13] and transverse shear [14] have demonstrated that this size of the RVE is large enough
to capture accurately the maximum stress supported by the composite lamina, particularly if the results
obtained with various fiber realizations are averaged.

             Figure 1: Schematic of the representative volume element of the lamina microstructure
                  subjected to transverse compression (σ2) and longitudinal shear (τ12).

2.2 Finite element model
The prismatic RVE was discretized for the analysis with the finite element method. The model volume
(matrix and fibers) was meshed using modified quadratic 10-node tetrahedra (C3D10M in Abaqus
[15]) using an adaptive automatic meshing algorithm. In order to take into account the effect of
interface fracture on the composite response, interface elements were included between matrix and
fibers throughout the model. The interface element is made up of two quadratic (6-node) triangular
surfaces that connect the faces of two adjacent quadratic tetrahedra. The two triangular surfaces of the
interface element lie together in the initial configuration (zero thickness) and separate as the adjacent
solid elements deform. The relative displacement of the element faces generate normal and shear
stresses depending on the constitutive equation of the cohesive crack, which is independent of the
element formulation. The interface elements are compatible with C3D10M solid elements in Abaqus
[15] and were programmed as a UEL subroutine. The element formulation is detailed in [16] and not
repeated here.
Periodic boundary conditions were applied to the RVE surfaces to ensure continuity between
neighboring RVEs (which deform like jigsaw puzzles).  r    r The periodic
                                                                      r     boundary conditions can be
expressed in terms of the displacement vectors U 1 , U 2 and U 3 which relate the displacements
between opposite faces according to:
      r                 r                r
      u (0, x2 , x3 ) − u (t , x2 x3 ) = U1                                                          (1)

                                                   2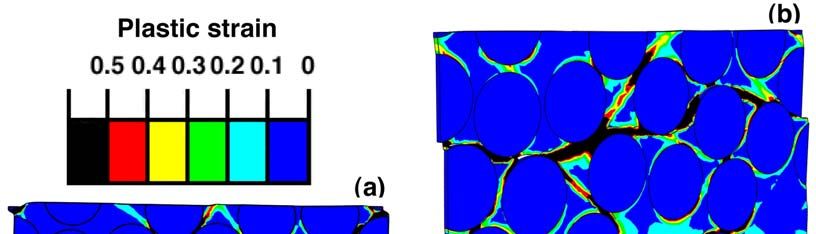
r                r                 r
      u ( x1,0, x3 ) − u ( x1, L, x3 ) = U 2                                                          (2)
      r                r                  r
      u ( x1, x2 ,0) − u ( x1, x2 , L) = U 3 .                                                        (3)

Combined uniaxial compression    r along the x2 axis and longitudinal shear along the fibers (σ2 and τ12,
Figure 1) are imposed with U 2 = (δ s , −δ c ,0) , where δcr and δs stand
                                                                    r     for the imposed compressive and
                                                          U
shear displacements, respectively. The components of 1 and U 3 are chosen so that the all the normal
and shear forces acting on the RVE surfaces are zero (besides those corresponding to transverse
compression and longitudinal shear). The compressive and shear strains are given by ε 2 = ln{1 − δ c /L}
and γ 12 = arctan{δ s /( L − δ c )} , respectively. The corresponding normal and shear stresses were
computed from the resultant normal and tangential forces acting on the RVE faces divided by the actual
cross-section. Simulations were carried out with Abaqus/Standard A08 within the framework of the
small deformation/displacement theory because the emphasis was in the composite strength, which was
normally attained at strains below 7%. Moreover, it was checked in selected cases that simulations
carried out within the framework of finite deformations theory provided equivalent results. The average
finite element model comprised approximately 25000 elements and 55000 nodes.
2.3 Constitutive equations of matrix, fibers and interface
Carbon fibers were modeled as linear, thermo-elastic transversally isotropic solids and their elastic
constants are given in Table 1. The epoxy matrix was assumed to behave as an isotropic, elasto-plastic
solid and the elastic constants are given in Table 2. Plastic deformation was governed by the Mohr-
Coulumb criterion and the total matrix strain was given by the addition of the elastic and plastic strain
components. The Mohr-Coulomb criterion assumes that yielding takes place when the shear stress
acting on a specific plane, τ, reaches a critical value, which depends on the normal stress σn acting on
that plane and takes into account the influence of the triaxiality on the shear yielding of polymers. More
details about the numerical implementation of the Mohr-Coulomb model can be found in [18, 19].
Quinson et al. [20] measured the yield point of various glassy polymers subjected to different
triaxiality levels (uniaxial tension and compression, simple shear and plane strain compression) and
reported friction angles in the range 7o to 15o. They are in agreement with the magnitude of 15o
obtained from the deviation of the fracture plane from the maximum shear stress plane in FRP
subjected to transverse compression [5, 9] and thus Ф= 15o was chosen for the PEEK matrix in this
investigation. Regarding to the yield stress under pure shear, Vogler and Kyriakides [1] carried out
tests of the neat PEEK matrix but indicated that the inelastic matrix properties within the composite
were different [21], and this has been corroborated recently through nanoindentation [22]. Thus, in
absence of accurate data, the matrix cohesion c was chosen equal to 79.5 MPa, the strength of the
composite in shear. This hypothesis takes into account that failure under longitudinal shear occurs
through the matrix in agreement with the experimental observations [1].

                       E1              E2 = E3        ν 12 = ν 13         ν 23      G12 = G13
                     (GPa)              (GPa)                                        (GPa)
                      214                 26             0.280           0.445         112
                                     Table 1: Fiber elastic constants (from [17])

Fiber/matrix interfaces were simulated through a cohesive crack model. In the absence of damage, the
interface behavior was linear with an initial stiffness Ki (105 GPa), which is a numerical parameter
large enough to ensure the displacement continuity at the interface and to avoid any modification of the

                                                          3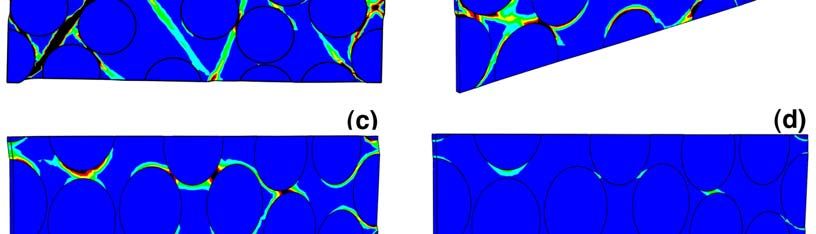
stress fields around the fibers in the absence of damageDescribed in [16].

                                          E               ν
                                       (GPa)
                                        4.10            0.356
                             Table 2: Matrix elastic constants (from [17])

3. RESULTS
Six different fiber realizations were generated to build the corresponding RVEs and meshed following
the methodology presented in the previous section. The mechanical response was computed under
transverse compression, longitudinal shear and biaxial compression and shear using a pseudo-radial
loading path in which δs/δc = -6. The corresponding stress-strain curves for pure compression and shear
are plotted in Fig. 2(a), while those for biaxial compression and shear are plotted in Fig. 2(b). The
strength of the composite lamina in compression was slightly higher than that of the unreinforced
matrix, YCm , which was computed in accordance with the Mohr-Coulomb model. Different fiber
realizations led variations in the composite strength under uniaxial compression but the maximum
difference was below 7% of the compressive strength. Thus, the average value from the six realizations
could be considered as a very good approximation of the compressive strength. The specimens
deformed in uniaxial compression failed by the development of a plastic shear band in the matrix,
which was approximately oriented at 50o- 55o with the pependicular to the loading axis, in agreement
with the experimental observations [1, 5]. (Fig. 3(a)). Decohesions at the fiber/matrix interface were
observed in several fibers around the shear band but they appeared after the shear band was formed and
thus were a consequence of the strain localization rather than the origin. Obviously, the scatter in the
stress-strain curves among different RVEs increased in the post-peak regime because the behavior was
controlled by the path and orientation of the shear band in the matrix.

         (a)                                                                      (b)

 Figure 2: Stress-strain curves of six different RVEs. (a) Uniaxial compression and shear. (b) Biaxial
  compression and shear using a pseudo-radial loading path characterized by δs/δc= -6. The absolute
                  value of the compressive stresses and strains are used in the plots.

                                                   4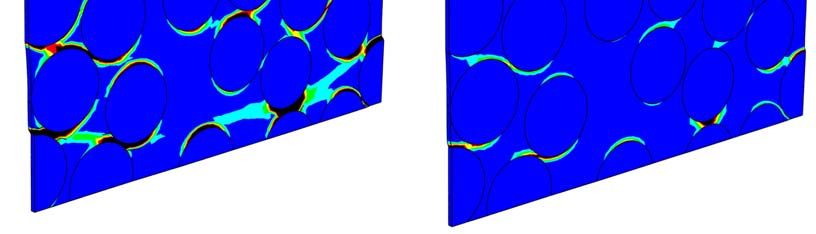
Figure 3: Contour plot of the accumulated plastic strain in the lamina subjected to: (a) uniaxial
     compression, ε2= -4.6%. (b) Biaxial compression and shear using a pseudo-radial loading path
 characterized by δs/ δc= -3, ε2 = -2.5%, γ12 = 7.4%. (c) Biaxial compression and shear using a pseudo-
radial loading path characterized by δs/δc = -6, ε2 = -1.2%, γ12 = 7.4%. (d) Longitudinal shear. γ12 = 5%.
 All plots correspond to the instant of maximum stress in stress-strain curves of Figure 2. Compression
                                     is always in the vertical direction.

                                                    5
On the contrary, the stress-strain curves of the six realizations under longitudinal shear were practically
superposed and presented a wide plateau, which showed that the composite deformed at a constant
shear stress equal to the matrix flow stress in shear, c. The corresponding deformation pattern can be
found in the contour plot of the accumulated plastic strain in the matrix in Fig. 3(d). Deformation was
initially localized in a matrix band parallel to the applied shear stress τ12 and further loading only
increased the shear strain in the band. Comparison among the different RVEs showed that the
localization occurred along the shortest matrix path parallel to applied shear stress. Once the band
percolated through the RVE, deformation continued at a constant shear stress equal to the matrix
cohesion. This deformation micromechanism is in perfect agreement with the experimental
observations, which reported that the specimens loaded in longitudinal shear failed by splitting along
the fibers. Our constitutive equation for the matrix did not take into account the matrix failure in shear
and thus it was not possible to reproduce the final fracture of the lamina under these conditions, though
this was not necessary as the focus of the simulations was in the maximum strength.
The stress-strain curves for six different RVEs subjected to compression and shear using a pseudo-
radial loading path characterized by δs/δc = -6 also showed very little scatter (Fig. 2(b)). Failure
occurred by the development of a shear band in the matrix parallel to the applied shear stress (Fig.
3(c)), as in the specimens subjected to uniaxial shear. Nevertheless, the compressive stresses led to a
more diffuse damage pattern in the matrix and increased the matrix resistance to shear yielding. As a
result, the τ12 – γ12 curves showed strain hardening and presented a well-defined maximum in strength
which was followed by the localization of the deformation in continuous band throughout the RVE.
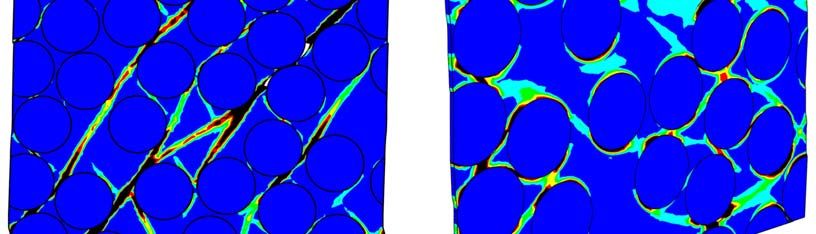
The behavior of the lamina subjected to different biaxial loading paths characterized by δs/δc is plotted
in Figure 4(a) in the σ2 – τ12 stress space. Normal and tangential stresses increased proportionally
during elastic deformation upon pseudo-radial deformation and this proportionally disappeared with the
onset of plastic deformation in the matrix. Two different failure modes were observed. If δs/δc ≤ -4, the
composite failed in shear-dominated mode and deformation was localized in matrix band parallel to the
shear stress. It should be noted that the maximum shear strength increased with the compressive stress
applied to the lamina while this failure mode was dominant, in agreement with the postulates of the
Mohr-Coulomb model. The compressive stresses became dominant as δs/δc > -2 and fracture occurred
through a matrix plane whose inclination with respect to the line perpendicular to the compressive
stress was in the range 50 o - 55o, depending on the details of the spatial arrangement of the fibers. The
transition between both mechanisms was found at δs/δc ≈ -3, in which the orientation of the fracture
surface was in between the behavior dominated by shear or compression, as shown in Fig. 3(b).
The predictions of the failure locus under transverse compression and longitudinal shear obtained by
computational micromechanics are plotted in Fig. 4(b) together with the experimental results of Vogler
and Kyriakides [1]. The agreement is excellent for the whole shape of the failure locus and it is worth
noting the experimental points in Fig. 4(b) should be interpreted as lower bounds of the actual strength
under shear-dominated fracture because of the end plate effects [1]. It should be noted that the
differences between the numerical results and the experiments in the region of shear-dominated failure
may also appear because the friction angle chosen for the matrix in the simulations (Ф= 15 o) was
slightly higher than the actual one. The numerical simulations explained the transition from shear
failure by splitting along the fibers to compressive failure along an inclined surface parallel to the
fibers. The former is characterized by a linear increase of the shear strength with the applied
compressive stress and the slope depends of the friction angle Ф. The end of this regime is
accompanied by a change in the failure mode to compressive failure, leading to a gentle reduction in
the maximum shear strength at failure.
6(a) (b)
Figure 4: a) Mechanical response of the composite lamina under biaxial deformation in the σ2 – τ12
stress space. The corresponding δs/δc ratio for each curve is given in the figure. b) Failure locus under
transverse compression and longitudinal shear. Experimental results [1] and numerical simulations
using computational micromechanics as well as predictions of the Puck [10] and LaRC03 models [23]
The corresponding failure envelopes corresponding to the Puck [10] and LaRC03 [23] models are also
plotted in Fig. 4(b) for comparison. Both models assume that the composite lamina is isotropic in the
23 plane and that failure under transverse compression and longitudinal shear occurs through surfaces
parallel to the fibers. Fracture is caused by the normal and tangential stresses acting on the fracture
plane following the Mohr-Coulomb criterion (matrix-dominated failure). The failure surface is
determined by computing the critical orientation of the fracture plane for each combination of normal
and tangential stresses. The two models differ slightly in their expression of the Mohr-Coulomb failure
criterion. Puck [9, 10] proposed
τt τl
( )2 + ( )2 = 1 (4)
ST − ηtσ n S L − ηlσ n
where τ t and τ l are, respectively, the transverse and longitudinal shear stresses and σ n is the normal
stress acting on the fracture plane. S L and ST stand for the lamina strength under longitudinal and
transverse shear. S L can be measured directly in the laboratory but mechanical tests under transverse
(out-of-plane) shear are very difficult to carry out and ST is normally from the transverse compressive
strength of the lamina YC by assuming the failure is controlled by the matrix and follows the Mohr-
Coulomb model.
The failure locus can be determined by computing the critical orientation of the fracture plane for each
combination of normal and tangential stresses once the lamina properties under longitudinal shear and
transverse compression are given [10].
Dávila et al. [23] followed a similar strategy to obtain the failure locus under transverse compression
and longitudinal shear starting from another approximation based on the Mohr-Coulomb model,
7| τ | +ηtσ n 2 | τ l | +ηlσ n 2
( t ) +( ) =1 (5)
ST SL
which assumes that the compressive stresses acting on the fracture plane reduce the effective shear
stresses rather than increase the shear strength.
Both models (Puck and LaRC03) reproduce adequately the two main failure mechanisms (compressive
and shear-dominated failure) which were found in the experiments and in the numerical simulations.
Nevertheless, the Puck model is able to predict accurately the failure surface in the whole range of
biaxial stresses. On the contrary, LaRC03 criteria does not capture adequately the transition between
both failure mechanisms and tends to overestimate the composite strength.
4. CONCLUSIONS
The mechanical response of a composite lamina made up of PEEK matrix unidirectionally reinforced
with 60 vol. % C fibers subjected to transverse compression and longitudinal shear was simulated using
computational micromechanics. The failure locus --- given by the envelope of the loading curves under
different biaxial loading conditions in the σ 2 - τ12 stress space --- was in excellent agreement with the
experimental results reported by Vogler and Kyriakides [1] for this material. In addition, the transition
from shear to compression-dominated fracture and the differences in the orientation of the fracture
plane were adequately predicted by the numerical simulations. These results demonstrate the actual
potential of computational micromechanics to predict the macroscopic properties of composite lamina
from the properties and spatial distribution of the constituents.
The numerical simulations were also useful to establish the range of validity of current failure criteria
for composites. In particular, they showed that Puck failure criterion [10] provides an excellent
estimate for the failure locus of unidirectional laminates subjected to transverse compression and
longitudinal shear when fracture is controlled by the matrix. The failure loci obtained from the
computational micromechanics can be very useful in extending the accuracy of current failure criteria
for conditions of interface dominated failure.
ACKNOWLEDGMENTS
This investigation was supported by the Ministerio de Eduación y Ciencia de España through the grant
MAT 2006-2602 and by the Comunidad de Madrid through the program ESTRUMAT-CM (reference
MAT/0077).
REFERENCES
1- T. J. Vogler, S. Kyriakides, “Inelastic behavior of an AS4/PEEK compoiste under combined
transverse compression and shear. Part I: experiments”, International Journal of Plasticity,
(1999);15:783-806.
2- T. I. Zohdi, P. Wriggers, “Introduction to Computational Micromechanics”, Springer, 2005.
3- A.Miravete, J.M. Bielsa, A.Chiminelli, J.Cuartero, S.Serrano, N.Tolosana, R.G. de Villoria, “3D
mesomechanical analysis of three-axial braided composite materials”, Composites Science and
Technology (2006);66 :2594-2964.
4- S. Song, A. M. Waas, K. W. Shahwan, X. Xiao, O. Faruque, “Braided textile composites under
compressive loads. modeling the response, strength and degradation”, Composites Science and
Technology, (2007);67:3059-3070.
5- C. González, J. LLorca, “Mechanical behavior of unidirectional fiber-reinforced polymers under
transverse compression: microscopic mechanisms and modeling”, Composites Science and
8Technology, (2007);67:2795-2806.
6- M. J. Hinton, P. D. Soden, A. S. Kaddour, “Failure criteria in fiber-reinforced polymer composites”:
the World Wide Failure exercise, Elsevier, 2004.
7- P. D. Soden, M. J. Hinton, A. S. Kaddour, “A comparison of the predictive capabilities of current
failure theories for composite laminates”, Composites Science and Technology, (1998);58:1225-
1254.
8- A. S. Kaddour, M. J. Hinton, P. D. Soden, “A comparison of the predictive capabilities of current
failure theories for composite laminates: additional contributions”, Composites Science and
Technology, (1998);58:1225-1254.
9- A. Puck, H. Schürmann, “Failure analysis of FRP laminates by means of physically based
phenomenological models”, Composites Science and Technology, (1998);58:1045-1067.
10- A. Puck, H. Schürmann, “Failure analysis of FRP laminates by means of physically based
phenomenological models”, Composites Science and Technology, (2002);62:1633-1662.
11- S. T. Pinho, C. G. Dávila, P. P. Camanho, L. Iannucci, P. Robinson, “Failure models and criteria
for FRP under in-plane of three-dimensional stress states including shear non-linearity”, Report
NASA/TM-2005-213530, 2005.
12- J. Segurado, J. LLorca, “A numerical approximation to the elastic properties of sphere-reinforced
composites”, Journal of the Mechanics and Physics of Solids, (2002);50:2107-2121.
13- C. González, J. LLorca, “Numerical simulation of the fracture behavior of Ti/SiC composites
between 20oC and 400oC”, Metallurgical and Materials Transactions A, (2007);38:169-179.
14- E. Totry, C. González, J. LLorca, “Failure locus of fiber-reinforced composites under transverse
compression and out-of-plane shear”, Composites Science and Technology, (2008);68 :829--839.
15- Abaqus, Users' Manual, version 6.7, ABAQUS, Inc., 2008.
16- J. Segurado, J. LLorca, “A new three-dimensional interface finite element to simulate fracture in
composites”, International Journal of Solids and Structures, (2004);41:2977-2993.
17- S. Y. Hsu, T. J. Vogler, S. Kyriakides, “Inelastic behavior of an AS4/PEEK compoiste under
combined transverse compression and shear. Part II: modeling”, International Journal of Plasticity,
(1999);15:807-836.
18- Abaqus, Theory Manual, HKS, Inc., 1998.
19- P. Menetrey, K. J. Willam, “Triaxial failure criterion for concrete and it generalization”, ACI
Structural Journal, (1995);92:311-318.
20- R. Quinson, J. Perez, M. Rink, A. Pavan, “Yield criteria for amorphous glassy polymers”, Journal
of Materials Science, (1997);32:1371-1379.
21- S. Y. Hsu, T. J. Vogler, S. Kyriakides, “Compressive strength predictions for fiber composites”,
Journal of Applied Mechanics, (1998);65:7--16.
22- J. R. Gregory, S. M. Spearing, “Nanoindentation of neat and in situ polymers in polymer-matrix
composites”, Composites Science and Technology, (2005);65:595-607.
23- C. Dávila, P. P. Camanho, C. A. Rose, “Failure criteria for FRP laminates”, Journal of Composite
Materials, (2005);39:323-345.
9You can also read