FASTER CARS Laser Spectroscopic Technique for Direct Identification of a Single Virus I: IQSE
←
→
Page content transcription
If your browser does not render page correctly, please read the page content below
Laser Spectroscopic Technique for Direct Identification of a Single Virus I:

                                                  FASTER CARS

                                                  V. Deckert1,2,3, *, T. Deckert-Gaudig1, D. Cialla-May1,2, J. Popp1,2, R. Zell4, Stefanie
                                                  Deinhard-Emmer4, A. V. Sokolov3,5, Z. Yi3 and M. O. Scully3,5,6, *
                                                  1
                                                      Institute of Photonic Technology (IPHT) Albert-Einstein-Str. 9, 07745 Jena, Germany
                                                  2
                                                   Friedrich-Schiller-Universität Jena, Institute of Physical Chemistry and Abbe Center of
                                                  Photonics, Helmholtzweg 4, 07743 Jena, Germany
                                                  3
                                                      Institute for Quantum Science and Engineering (IQSE), Texas A&M University, College
arXiv:2003.07951v1 [physics.med-ph] 17 Mar 2020

                                                  Station, TX 77843, USA
                                                  4
                                                   Section of Experimental Virology, Institute of Medical Microbiology, Jena University
                                                  Hospital, Hans-Knöll-Str. 2, D-07745 Jena, Germany
                                                  5
                                                      Baylor University, Waco, TX 76706, USA
                                                  6
                                                      Princeton University, Princeton, NJ 08544, USA
                                                  *Corresponding authors: Volker.deckert@leibniz-ipht.de (V. D.), scully@tamu.edu
                                                  (M.O.S.)
                                                  Abstract: From the famous 1918 H1N1 influenza to the present COVID-19 pandemic, the
                                                  need for improved virial detection techniques is all too evident. The aim of the present
                                                  paper is to show that identification of individual virus particles in clinical sample
                                                  materials quickly and reliably is near at hand. First of all, our team has developed
                                                  techniques for identification of virions based on a modular atomic force microscopy
                                                  (AFM). Furthermore, Femtosecond Adaptive Spectroscopic Techniques with Enhanced
                                                  Resolution via Coherent Anti-Stokes Raman Scattering (FASTER CARS) [1] using tip-
                                                  enhanced techniques markedly improves the sensitivity.

                                                                                                                                             1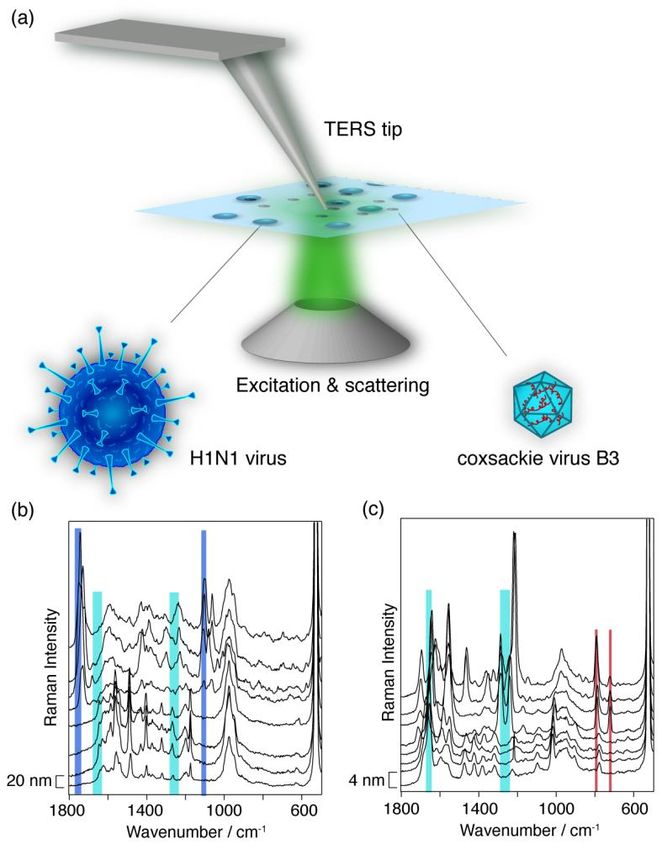
I. Introduction

Scanning probe microscopy, especially in combination with plasmon-enhanced near-field
spectroscopy, is used to specifically analyze and study objects below Abbe’s diffraction limit. The
scientific goal is, in addition to virus diagnostics, to identify structural changes of the virus
surface at an early stage, using so-called tip enhanced Raman scattering (TERS) together with
coherent anti-Stokes Raman spectroscopy (CARS), see Figure 1. This combined technique will
improve the sensitivity and consequently speed up acquisition times considerably. In contrast to
known methods, this is unique. Due to its surface specificity our technique allows early
detection of changes that alter the antigenic properties of viruses and thus the effectiveness of
vaccines, with the smallest sample quantities. Furthermore, identification without specific
antibodies is possible. This goes far beyond the current state of the art.

In the following section II, we demonstrate how the tip-enhanced Raman technique can be used
to characterize and differentiate between influenza and picorna-viruses. In section III we explain
the instrumentation and show how it provides exciting new tools for viral research and
detection systems, e.g. FASTER CARS: Femtosecond Adaptive Spectroscopic Techniques with
Enhanced Resolution via Coherent Anti-Stokes Raman Scattering. Section IV presents a
conclusion and outlook.

                                                                                                 2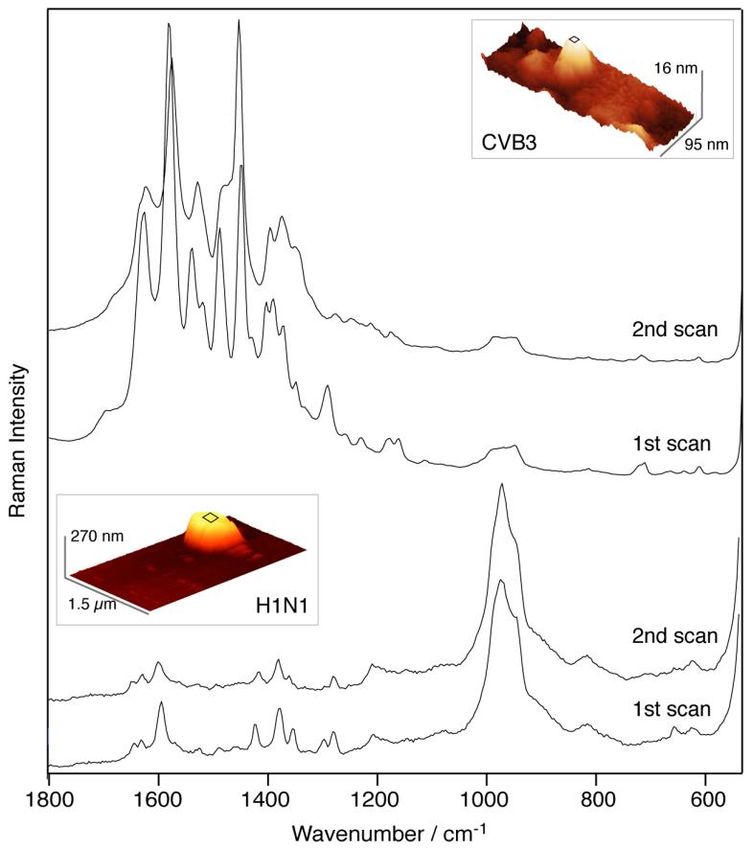
Figure 1: a) Schematics of the transmission TERS setup used in the experiments with the virus
mixture spread on a slide and the laser illuminating the sample from below ( = 532 nm, P = 500
µW). In the model of a H1N1 virus protein spikes (cyan) protrude from the lipid bilayer (blue). In
the model of a coxsackie virus B3 the protein lattice (cyan) are on the surface and the RNA
strands (red) are inside the virus. b) Selected TERS spectra recorded on a single H1N1 virus
(measurement point distance 20 nm, tacq = 10 s). c) Selected TERS spectra recorded on a single
coxsackie virus B3 (measurement point distance 4 nm, tacq = 10 s). In b) and c), lipid marker
bands (blue), protein marker bands (cyan) and RNA marker bands (red) are highlighted. See the
text in section II for further explanation.
II. Nano-spectroscopic system for differentiating between influenza and picornavirus
Viruses are infectious agents that spread as nano-sized particles, so-called virions outside of cells.
Viruses can only multiply within a suitable host cell and as the infection propagates, the virion
attacks a cell of a living organism by injecting it with genetic material and inducing the cell to
3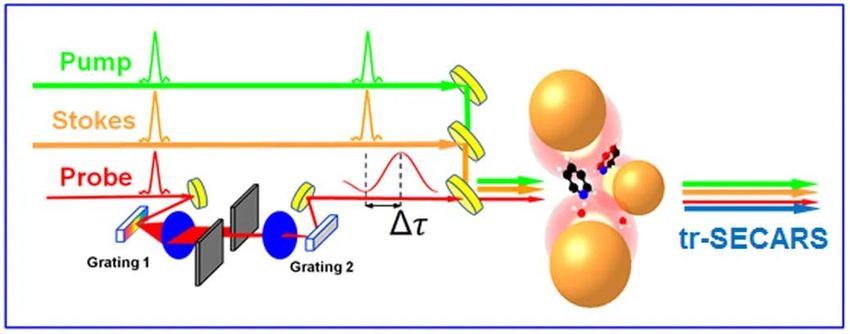
make multiple replicas of the virion. The building blocks of a virion are either DNA or RNA
molecules surrounded by a protective scaffold of proteins, the so called (nucleo-)capsid (e.g.
CVB3 virus in Figure 1). Moreover, there can be a lipid bilayer serving as envelope. Protein spikes
can protrude from the bilayer forming a sea urchin like structure (e.g. H1N1 virus in Figure 1).

Some viruses are pathogenic and can cause severe diseases, which makes accurate diagnostics
essential. The goal is to characterize the specific virus based on single viral particles. One
common technique is the polymerase chain reaction (PCR), which has simplified and accelerated
the detection of pathogens over culturing techniques [2-4]. In PCR, the nucleic acid—either DNA
or RNA—has to be extracted from the specimen first. Next, characteristic viral sequences are
amplified employing varying primer sets followed by further molecular analysis [2,3]. In general,
multiple DNA target molecules are necessary for sufficient amplification and the examination of
a single virus particle is still challenging. Although PCR technologies are quite powerful, several
drawbacks limit the application in microbiological diagnostics. On the one hand, high sensitivity
of DNA/RNA amplification makes this process susceptible to contamination that might yield
false-positive results. Furthermore, false-negative results, e.g. due to failed amplification, have
to be considered, too [4]. The nature of the PCR process is prone to several disturbing factors
that may hamper exponential DNA amplification. The implementation of the quantitative Real-
Time PCR (qRT-PCR) in recent years, where fluorescent molecules are added, enables exact
quantitation of template DNA, however, results that are difficult to interpret are not rare [3,5,6].

Another approach to identifying viruses is the immunoassay-based detection of viral proteins,
which is in some cases less sensitive. Thus, the existing molecular analysis tools do not permit a
combination of multiplexing and quantitation and in every case the viral components have to be
extracted. Working on a single viral particle via the PCR technique is not possible.

Ideally, a new technique would combine the ability of qualitative and quantitative analysis at the
single virus particle level, rendering the need for separation of the different components
unnecessary. A promising technique for that endeavor is tip-enhanced Raman and potentially
other nonlinear optical spectroscopies like FASTER CARS. TERS has been demonstrated to
operate in a very specific and sensitive mode down to the single molecule level, with nanometer
resolution and below [7-10]. In TERS, scanning probe techniques (atomic force microscopy /
AFM or scanning tunneling microscopy / STM) are paired with Raman spectroscopy. The former
component enables morphological imaging with sub-nanometer lateral resolution, the latter
provides detailed spectral information on every specifically selected position on the sample
surface.

                                                                                                   4
The heart piece in TERS is the probe, which generally is a commercial AFM tip (for AFM-based
setups) that is commonly evaporated with silver and exactly positioned in the laser focus. Upon
laser irradiation of the metallized tip a so-called evanescent field is generated. Molecules
located in some nanometer proximity to the tip experience a Raman signal enhancement (up to
107) of their vibrational modes according to the surface-enhanced Raman spectroscopy theory
(see for instance refs. [11-15]).
Once the tip is positioned in the laser spot, the sample is moved under the tip and the region of
interest is selected. After setting a grid of profile lines on the sample, the AFM is coupled to the
Raman spectrometer and enhanced Raman spectra are recorded. Such a setup does not need
special sample pretreatments or tagging and allows a direct chemical characterization. The
same setup also provides topographic imaging of the sample surface in a single experiment. The
spatial resolution in TERS is limited by the diameter of the silver particle at the tip, and lately has
been pushed down to around 0.5 – 1 nm for bio-samples [9, 16, 17]. A not-to-scale setup is
sketched in Fig. 1a). For specific instrumental details the reader is referred to ref. [18].
Depending on the number of acquired data, subsequent multivariate data analysis might be
useful for data assessment. In the context of a general tip-enhanced approach of a virus
identification, it is important to point out that not only all major components to be expected in
viruses (namely DNA / RNA [19-21], proteins, lipids and even glycoproteins) have been already
detected by TERS. Also, different studies on viruses [22-26] already proved the feasibility of the
concept. In contrast to PCR-related techniques, in TERS a separation of the different
components or labeling is not required, and ultimately only a single virion is sufficient for an
identification.
So far, reported TERS experiments on single virus particles were performed on more or less
randomly chosen points, which is apparently not sufficient for a thorough characterization [22-
26]. It was shown that grid-based TERS mapping of Varicella-zoster and Porcine teschovirus
allowed a linear discriminant supported distinction of the two viruses. Clearly, the identification
and discrimination of different virus strains demand a comprehensive characterization in terms
of spectral surface imaging which is in line with the above mentioned extreme lateral resolution
[25].
For the present experiments an enveloped influenza A virus H1N1 and a non-enveloped
coxsackie virus B3 (CVB3) were chosen. The swine H1N1 influenza virus particle is composed of a
2-6 nm lipid bilayer decorated with viral proteins and eight ribonucleoprotein (RNP) complexes.
The RNPs consist of RNA strands, which interact with numerous nucleoprotein molecules and
some viral polymerase complexes. The consistency of the lipid envelope depends on the type of
5cell membrane of host cell the virus originates. The inner surface is covered completely with
viral matrix protein. From the lipid layer flexible protein spikes with a protrusion height of 10-14
nm stick out [27]. In Figure 1, the structure of an influenza virus is sketched. From AFM
measurements it is known that H1N1 shows pleomorphism that means size (150 – 400 nm) and
shape (spherical or rod-like) vary [27, 28]. The dimension of the CVB3 virus (Fig. 1) is ten times
smaller (20-30 nm), with an icosahedral structure (determined by crystallography), where the
RNA is packed in a protein coat (capsid) [29]. Clearly, the different surface components of the
viruses yield TERS spectra with information on proteins and lipids for H1N1 (Fig. 1b)) and protein
and RNA for CVB3 (Fig. 1c)). Again, it is obvious that spectral variability on the virus surface
occurs and a larger virus surface area must be considered. Nevertheless, a discrimination of
both viruses solely based on the TERS spectra is quite straightforward. The experiment with the
full statistical evaluation (multiple maps, different particles, different tips) will be published
elsewhere. Here we want to emphasize that the method is potentially able to identify any single
virus based on the surface composition. The main challenge is the time required for an
assessment, particularly the spectral acquisition time. Interestingly, the necessary AFM
topography which is always detected to locate a sample can also provide substantial information
for a virus pre-screening, thus considerably limiting the potential candidates for TERS
investigations [30].
Clearly, the extreme intrinsic lateral resolution of TERS requires the acquisition of a statistical
relevant number of spectra on the virus surface in order to catch all relevant structural features
of a given virus. If a mere virus classification rather than a nanometer scale structural
information is the goal, a different experimental approach could be advantageous, particularly
by decreasing the overall acquisition time considerably. The approach shown here, artificially
decreases the spatial resolution by deliberately scanning the tip during the acquisition. This way,
the spectral information is based on the entire scanned surface and as the tip is scanned
continuously rather than in a step-scan manner, this also ensures a “gap-free” TERS experiment.
It is important to note, that this approach is fundamentally different from a conventional SERS
experiment, where one would bring the plasmonic substrate in contact with a virus sample. In
such an experiment no averaging can be achieved on a single virus and consequently a large
number of samples must be investigated. Furthermore, specific substrate – sample interactions
will lead to preferential binding sites that will also strongly affect the results.
In Figure 2 we present two straightforward TERS experiments, acquired while scanning a defined
area on a single H1N1 and CVB3 virus, respectively. This way, all Raman signals during the scan
were detected while the lateral resolution was intentionally decreased. The measurement
6parameters were adjusted such that exactly one spectrum was recorded during one topography
scan.
Figure 2. TERS spectra acquired during two repetitive topography scans on a single CVB3 (top)
and a single H1N1 virus (bottom), respectively. Measurement conditions for CVB3 scan: 20x20
nm, 128x128 px, scan rate: 2 Hz, tacq = 5 s, 14 acc, and for H1N1 scan: 200x200 nm, 128x128 px,
scan rate: 1 Hz, tacq = 10 s, 14 acc. The shown 3D topography images were generated with
Gwyddion [31]. The black rectangles indicate the investigated areas on the particles.
In both samples the respective spectra acquired during subsequent topography scans indicate
that the apparent spectral reproducibility is much higher compared to the single acquisitions in
Figure 1, thus demonstrating the expected location averaging. This leads to a much faster
overall data acquisition and much more representative spectral data. This comes at a cost that
some information is consequently buried in an averaged data set, i.e., the clearly visible lipid
marker bands of the H1N1 virus of the “high resolution” data acquisition are not evident in
Figure 2, hence, indicating that lipids patches that are accessible for the TERS tip are
comparatively rare. While it is theoretically possible to achieve the same result by combining all
high-resolution spectra of a sample, e.g. combining all spectra from a virus scan in Figure 1 b or c,
7for a comparison it must be warranted that the specimen is sampled correctly, otherwise an
imbalance of certain chemical distributions will affect the resulting post-experimental averaged
data. This is particularly important since recent experimental and theoretical high-resolution
TERS studies indicate a resolution down to the Ångström regime. For a TERS experiment this
leads to very small step sizes, i.e. to a prohibitively long acquisition time. For an
analytical/diagnostic application the average data is most likely much more useful as it can be
accessed much faster and due to the intrinsic spectral averaging provides a typical fingerprint of
the virus. It is of course still important to determine the minimum representative scan area for a
virus, which allows the clear identification of the virus strand. This is essential for comparison
with other experiments e.g. to avoid geometrical influences of the tip.
Another possibility to further increase the sensitivity will be introduced in the following section
where we propose a combined tip/surface enhanced Raman technique with FAST CARS [1].
III. Instrumentation and new techniques
Figure 3 CARS (a, b) and FAST CARS (c, d)
spectra of sodium dipicolinate probe
delay of 0 ps (a, b) and 1.5 ps (c, d). The
pump wavelengths are 722 nm and 732
nm, as indicated (see ref. [33] for further
details).
To our best knowledge, tip-enhanced CARS has been demonstrated in early 2000s, interestingly
already at bio-related specimen, namely DNA compounds [32]. Stimulated by our success in
detecting anthrax using FAST CARS [33], see Figure 3, we developed new techniques for
enhancing the sensitivity and resolution of coherent Raman spectroscopy. Specifically, we have
developed new vibrational spectroscopic techniques for nanoscale real-time molecular sensing
8having large signal enhancement, small background, short detection time and high spectral
resolution [34]. On other hand, other groups have pushed the surface-enhanced CARS to single
molecule sensitivity [35, 36]. Our time-resolved Tip Enhanced Coherent Anti-Stokes Raman
Spectroscopy (TECARS) is an exciting new tool for virus research. Our early “proof of principle”
research was used to detect hydrogen-bonded molecular complexes of pyridine with water in
the near field of gold nanoparticles with large signal enhancement. This yields an improved FAST
CARS [1] approach which is aptly called FASTER CARS.
Combining this technique with modern quantum molecular calculation is natural for studying
complex biological systems. Figure 4 shows a simplified experimental arrangement used in ref.
[34]. Figure 5 shows typical data.
Figure 4: Simplified experimental setup of time-resolved surface-enhanced CARS spectroscopy.
Three laser beams collinearly excite nanomolar amounts of pyridine in the near-field of gold
nanoparticles. The pump (green) and Stokes (orange) broadband femtosecond laser pulses
excite a molecular vibrational coherence which is probed by a time-delayed shaped narrowband
picosecond probe pulse (red). The probe pulse is Sinc-shaped by a pulse shaper slit. The CARS
signal is generated in the forward direction (blue) and collected by a spectrometer with a 0.1 s
integration time.
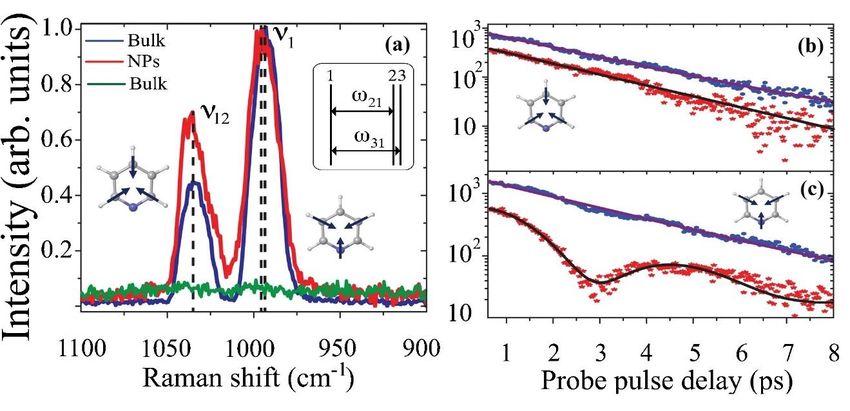
9Figure 5: Normalized spectra for 1 ps delay and temporal traces of pyridine with (red) and
without (blue, green) gold nanoparticles (NPs). Signals with NPs were obtained from 12 µm thick
layers of pyridine on the surface of NPs. Bulk signals without NPs showed no detectable spectral
features for 12 µm thick samples (green, (a)). Therefore, bulk signals without NPs were obtained
under similar excitation conditions from 2 mm thick layers (blue). The ring breathing mode of
the pyridine-water complex is not resolved in the spectra (a), but can be extracted from the
temporal trace (c) where the vibrational dephasing is deconvoluted from the probe pulse shape.
No detectable signals were observed without NPs under identical conditions (green) and,
therefore, the amount of bulk pyridine was increased (blue). Additional details can be found in
ref. [34].
The review article of Lis and Cecchet characterizes this technique nicely; they say [37]:
“Investigations demonstrated that the electronic background that derives from
the water and the metal could also be reduced on such kind of solid substrates.
Voronine et al. used time-resolved surface-enhanced CARS, which combines
delayed laser pulses of different widths, to obtain a high spectral resolution with
the suppression of the non-resonant back ground.”
They go on to say that this technique yields “astonishing sensitivity”. Indeed, this improvement
over our earlier FAST CARS anthrax detection scheme holds real promise for detection and
identification of single virus particles such as SARS-CoV-2 virus which causes COVID-19.
10IV Conclusion and outlook
We have shown that on one hand, the Tip-Enhanced Raman technique can be used to
characterize and differentiate between influenza and picornavirus. On the other hand, surface
enhanced CARS result in “astonishing” enhancement in the sensitivity [37]. The new FASTER
CARS system, which combines nanometer spatial resolution and enhanced sensitivity, forged by
both the tip and coherent Raman enhancement, provides exciting new tools for viral research
and detection, e.g., the SARS-COV-2 virus.
Acknowledgements:
We would like to express our deep appreciation to TAMUS chancellor John Sharp without whom
this project would not have happened. We thank the: Office of Naval Research (Award No.
N00014-16-1-3054), Air Force Office of Scientific Research (Award No. FA9550-18-1-0141),
National Science Foundation (Awards No. 1828416, 1609608), Chancellor’s Research
Initiative/Governor’s University Research Initiative (CRI/GURI), the Robert A. Welch Foundation
(Grant No. A-1261), King Abdulaziz City for Science and Technology (KACST) and the Deutsche
Forschungsgemeinschaft (DFG, German Research Foundation, Grant No. DFG-CRC1375NOA) for
support of the work. We also like to thank Drs. G. Agarwal, B. Brick, K. Chamakura, J. Mogford, J.
Sharp, R. Young, and A. Zheltikov for stimulating and helpful discussions.
References:
[1] The present paper builds on and extends our earlier femtosecond Raman work in which the
focus was on detection of anthrax. See M. O. Scully, A. Sokolov, M. Zubairy, et al., "FAST
CARS: Engineering a laser spectroscopic technique for rapid identification of bacterial
spores," PNAS 99 (17), 10994-11001 (2002).
[2] Y.-W. Tang, G. W. Procop, and D. H. Persing, "Molecular diagnostics of infectious diseases,"
Clinical Chemistry 43, 2021-2038 (1997).
[3] J. S. Ellis and M. C. Zambon, "Molecular diagnosis of influenza," Rev. Med. Virol. 12, 375-389
(2002).
[4] M. Vaneechoutte and J. Van Eldere, "The possibilities and limitations of nucleic acid
amplification technology in diagnostic microbiology," J. Med. Microbiol. 46, 188-194 (1997).
[5] M. A. A. Valones, R. L. Guimaraes, L. A. C. Brandao, P. R. E. de Souza, A. A. T. Carvalho, and S.
Crovela, "Principles and applications of polymerase chain reaction in medical diagnostic
fields: a review," Braz. J. Microbiol. 40, 1-11 (2009).
[6] I. M. Mackay, K. E. Arden, and A. Nitsche, "Reat-Time PCR in virology," Nucl. Acid. Research
30, 1292-1305 (2002).
11[7] R. Zhang, Y. Zhang, Z. C. Dong, S. Jiang, C. Zhang, L. G. Chen, L. Zhang, Y. Liao, J. Aizpurua, Y.
Luo, J. L. Yang, and J. G. Hou, "Chemical mapping of a single molecule by plasmon-enhanced
Raman scattering," Nature 498 (7452), 82-86 (2013).
[8] Tanja Deckert-Gaudig, Evelyn Kämmer, and Volker Deckert, "Tracking of nanoscale
structural variations on a single amyloid fibril with tip-enhanced Raman scattering.," Journal
of Biophotonics 5 (3), 215-219 (2012).
[9] Tanja Deckert-Gaudig, Dmitry Kurouski, Martin A. B. Hedegaard, Pushkar Singh, Igor K.
Lednev, and Volker Deckert, "Spatially resolved spectroscopic differentiation of hydrophilic
and hydrophobic domains on individual insulin amyloid fibrils," Scientific Reports 6, 33575
(2016).
[10]Joonhee Lee, Kevin T. Crampton, Nicholas Tallarida, and V. Ara Apkarian, "Visualizing
vibrational normal modes of a single molecule with atomically confined light," Nature 568
(7750), 78-82 (2019).
[11] Tanja Deckert-Gaudig, Atsushi Taguchi, Satoshi Kawata, and Volker Deckert, "Tip-enhanced
Raman spectroscopy - from early developments to recent advances.," Chemical Society
Reviews 46 (13), 4077-4110 (2017).
[12] Satoshi Kawata, Taro Ichimura, Atsushi Taguchi, and Yasuaki Kumamoto, "Nano-Raman
Scattering Microscopy: Resolution and Enhancement.," Chemical Reviews 117 (7), 4983-
5001 (2017).
[13] Marie Richard-Lacroix, Yao Zhang, Zhenchao Dong, and Volker Deckert, "Mastering high
resolution tip-enhanced Raman spectroscopy: towards a shift of perception," Chemical
Society Reviews 46 (13), 3922-3944 (2017).
[14] Prabhat Verma, "Tip-Enhanced Raman Spectroscopy: Technique and Recent Advances.,"
Chemical Reviews 117 (9), 6447-6466 (2017).
[15] Judith Langer et al., "Present and Future of Surface-Enhanced Raman Scattering," Acs Nano
14 (1), 28-117 (2020).
[16] Zhe He, Zehua Han, Megan Kizer, Robert J. Linhardt, Xing Wang, Alexander M. Sinyukov,
Jizhou Wang, Volker Deckert, Alexei V. Sokolov, Jonathan Hu, and Marlan O. Scully, "Tip-
Enhanced Raman Imaging of Single-Stranded DNA with Single Base Resolution," Journal of
the American Chemical Society 141 (2), 753-757 (2019).
[17] Xiu-Mei Lin, Tanja Deckert-Gaudig, Prabha Singh, Michael Siegmann, Stephan Kupfer,
Zhenglong Zhang, Stefanie Gräfe, and Volker Deckert, "Direct Base-to-Base Transitions in
ssDNA Revealed by Tip-Enhanced Raman Scattering," arXiv:1604.06598 (2016).
12[18] Lucas Langelüddecke, Prabha Singh, and Volker Deckert, "Exploring the Nanoscale: Fifteen
Years of Tip-Enhanced Raman Spectroscopy.," Applied Spectroscopy 69 (12), 1357-1371
(2015).
[19] K. Domke, D. Zhang, and B. Pettinger, "Tip-enhanced Raman spectra of picomole quantities
of DNA nuclerobases at Au(111)," J. Am. Chem. Soc. 129, 6708-6709 (2007).
[20]L. E. Hennemann, A. J. Meixner, and D. Zhang, "Surface- and tip-enhanced Raman
spectroscopy of DNA," Spectroscopy 24, 119-124 (2010).
[21] E. Bailo and V. Deckert, "Tip-enhanced Raman scattering," Chem. Soc. Rev 37, 921-930
(2008).
[22] P. Hermann, A. Hermelink, V. Lausch, G. Holland, L. Möller, N. Bannert, and D. Naumann,
"Evaluation of tip-enhanced Raman spectroscopy for characterizing different virus strains,"
Analyst 136, 1148-1152 (2011).
[23] P. Hermann, H. Fabian, D. Naumann, and A. Hermelink, "Comparative study of far-field and
near-field Raman spectra from silicon-based samples and biological nanostructures," J. Phys.
Chem. C 115, 24512-24520 (2011).
[24] D. Cialla, T. Deckert-Gaudig, C. Budich, M. Laue, R. Möller, D. Naumann, V. Deckert, and J.
Popp, "Raman to the limit: tip-enhanced Raman spectroscopic investigations of single
tobacco mosaic virus," J. Raman Spectrosc. 40, 240-243 (2009).
[25] Konstanze Olschewski, Evelyn Kämmer, Stephan Stöckel, Thomas Bocklitz, Tanja Deckert-
Gaudig, Roland Zell, Dana Cialla-May, Karina Weber, Volker Deckert, and Jürgen Popp, "A
manual and an automatic TERS based virus discrimination," Nanoscale 7 (10), 4545-4552
(2015).
[26] A. Hermelink, D. Naumann, J. Piesker, P. Lasch, M. Laue, and P. Hermann, "Towards a
correlative approach for characterising single virus particles by transmission electron
microscopy and nanoscale Raman spectroscopy," Analyst 142 (8), 1342-1349 (2017).
[27] M.-C. Giocondi, F. Ronzon, M. C. Nicolai, P. Dosset, P.-E. Milhiet, and M. Chevalie,
"Organization of influenza A virus envelope at neutral and low ph," J. Gen. Virol. 91, 329-338
(2010).
[28] Y. Liu, K. Hu, Y. Hong, Y. Yang, H. Suo, and J. Wang, Chin. J. Virol. 24, 106-110 (2008).
[29] J. K. Muckelbauer, M. Kremer, I. Minor, G. Diana, F. J. Dutko, J. Groarke, D. C. Pevear, and M.
G. Rossmann, "The structure of coxsackie B3 at 3.5Â resolution," Structure 3, 653-667 (1995).
[30] Thomas Bocklitz, Evelyn Kämmer, Stephan Stöckel, Dana Cialla-May, Karina Weber, Roland
Zell, Volker Deckert, and Jürgen Popp, "Single virus detection by means of atomic force
microscopy in combination with advanced image analysis.," Journal of structural biology 188
(1), 30-38 (2014).
13[31] David Nečas and Petr Klapetek, "Gwyddion: an open-source software for SPM data
analysis," Central European Journal of Physics 10 (1), 181-188 (2012).
[32] Taro Ichimura, Norihiko Hayazawa, Mamoru Hashimoto, Yasushi Inouye, and Satoshi
Kawata, "Application of tip-enhanced microscopy for nonlinear Raman spectroscopy,"
Applied Physics Letters 84 (10), 1768-1770 (2004).
[33] Dmitry Pestov, Robert K. Murawski, Gombojav O. Ariunbold, Xi Wang, Miaochan Zhi, Alexei
V. Sokolov, Vladimir A. Sautenkov, Yuri V. Rostovtsev, Arthur Dogariu, Yu Huang, and Marlan
O. Scully, "Optimizing the Laser-Pulse Configuration for Coherent Raman Spectroscopy,"
Science 316 (5822), 265-268 (2007).
[34] Dmitri V. Voronine, Alexander M. Sinyukov, Xia Hua, Kai Wang, Pankaj K. Jha, Elango
Munusamy, Steven E. Wheeler, George Welch, Alexei V. Sokolov, and Marlan O. Scully,
"Time-Resolved Surface-Enhanced Coherent Sensing of Nanoscale Molecular Complexes,"
Scientific Reports 2, 891 (2012).
[35] Yu Zhang, Yu-Rong Zhen, Oara Neumann, Jared K. Day, Peter Nordlander, and Naomi J.
Halas, "Coherent anti-Stokes Raman scattering with single-molecule sensitivity using a
plasmonic Fano resonance," Nature Communications 5, 4424 (2014).
[36] Steven Yampolsky, Dmitry A. Fishman, Shirshendu Dey, Eero Hulkko, Mayukh Banik, Eric O.
Potma, and Vartkess A. Apkarian, "Seeing a single molecule vibrate through time-resolved
coherent anti-Stokes Raman scattering," Nature Photonics 8, 650 (2014).
[37] Dan Lis and Francesca Cecchet, "Localized surface plasmon resonances in nanostructures to
enhance nonlinear vibrational spectroscopies: towards an astonishing molecular sensitivity,"
Beilstein Journal of Nanotechnology 5, 2275-2292 (2014).
14You can also read


