Hydrologic regimes drive nitrate export behavior in human-impacted watersheds - HESS
←
→
Page content transcription
If your browser does not render page correctly, please read the page content below
Hydrol. Earth Syst. Sci., 25, 1333–1345, 2021
https://doi.org/10.5194/hess-25-1333-2021
© Author(s) 2021. This work is distributed under
the Creative Commons Attribution 4.0 License.

Hydrologic regimes drive nitrate export behavior
in human-impacted watersheds
Galen Gorski and Margaret A. Zimmer
Department of Earth and Planetary Sciences, University of California Santa Cruz, Santa Cruz, CA 95064, USA

Correspondence: Galen Gorski (ggorski@ucsc.edu)

Received: 28 October 2020 – Discussion started: 5 November 2020
Revised: 8 February 2021 – Accepted: 17 February 2021 – Published: 18 March 2021

Abstract. Agricultural watersheds are significant contribu-        and lower-NO−  3 concentration likely contributed to low-NO3
                                                                                                                                 −

tors to downstream nutrient excess issues. The timing and          conditions in stream, particularly in the larger watersheds.
magnitude of nutrient mobilization in these watersheds are         Stormflow c–Q behavior was consistent across watersheds,
driven by a combination of anthropogenic, hydrologic, and          but baseflow c–Q behavior was linked to the intensity of agri-
biogeochemical factors that operate across a range of spatial      culture and the density of built drainage infrastructure, with
and temporal scales. However, how, when, and where these           more drainage infrastructure associated with higher loads
complex factors drive nutrient mobilization has previously         and more chemostatic export patterns across the watersheds.
been difficult to capture with low-frequency or spatially lim-     This suggests that the way humans replumb the subsurface in
ited data sets. To address this knowledge gap, we analyzed         response to geologic conditions has implications for hydro-
daily nitrate concentration (c) and discharge (Q) data for a 4-    logic connectivity, homogenization of source areas, and, sub-
year period (2016–2019) from five nested, agricultural water-      sequently, nutrient export during both baseflow and storm-
sheds in the midwestern United States that contribute nutrient     flow. Our analysis also showed that anomalous flow periods
loads to the Gulf of Mexico. These records allow us to inves-      greatly influenced overall c–Q patterns, suggesting that the
tigate nutrient mobilization patterns at a temporal and spatial    analysis of high-resolution records at multiple scales is criti-
resolution not previously possible. The watersheds span two        cal when interpreting seasonal or annual patterns.
distinct landforms shaped by differences in glacial history,
resulting in natural soil properties that necessitated different
drainage infrastructure across the study area. To investigate
                                                                   1   Introduction
nutrient export patterns under different hydrologic condi-
tions, we partitioned the hydrograph into stormflow and base-      Excess nutrient export to streams can have detrimental ef-
flow periods and examined those periods separately through         fects on human health and ecosystem function by contami-
the analysis of their concentration–discharge (c–Q) relation-      nating drinking water (Weyer et al., 2001) and contributing
ships on annual, seasonal, and event timescales. Stormflow         to harmful algal blooms (Howarth, 2008), hypoxia (Jenny et
showed consistent chemostatic patterns across all seasons,         al., 2016), and loss of species diversity in receiving water
while baseflow showed seasonally dynamic c–Q patterns.             bodies (Diaz and Rosenberg, 2008). Globally, the number of
Baseflow exhibited chemodynamic conditions in the sum-             hypoxic dead zones that have been identified in the scien-
mer and fall and more chemostatic conditions in the winter         tific literature has roughly doubled each decade, now reach-
and spring, suggesting that water source contributions during      ing well over 500 (Conley et al., 2011). The spatial extent
baseflow were nonstationary. Baseflow chemodynamic be-             and severity of dead zones are often correlated to tempo-
havior was driven by low-flow, low-NO−     3 conditions during     ral patterns in upstream nitrogen loading from contributing
which in-stream and near-stream biological processing likely       catchments (Rabalais et al., 2009; Turner et al., 2012).
moderated in-stream NO−    3 concentrations. Additionally, in-
puts from deeper groundwater with longer residence times

Published by Copernicus Publications on behalf of the European Geosciences Union.
1334                                        G. Gorski and M. A. Zimmer: Hydrologic regime drives nitrate export patterns

   One of the largest dead zones in the world is in the north-          Recent studies have recognized that c–Q relationships
ern Gulf of Mexico, which experiences expansive eutrophi-            vary as a function of flow percentile, suggesting that the
cation each spring and summer due to nutrient export from            structure of hydrologic connectivity is driven by flow condi-
largely agricultural watersheds within the Upper Mississippi         tions (Diamond and Cohen, 2018; Jones et al., 2017; Zim-
River basin (Rabalais et al., 2002). In response, many US            mer et al., 2019). Recently, the accessibility of data from
states have invested considerable resources in developing nu-        high-frequency sensor networks has allowed the exploration
trient reduction strategies with the goal of mitigating nutrient     of these relationships at a timescale previously difficult to
mobilization and downstream effects. For example, the Iowa           observe. For example, high-frequency data sets have been
Nutrient Reduction Strategy has a goal of reducing nitrogen          used to investigate c–Q behavior at the event scale, reveal-
loads in Iowa streams by 45 %, committing USD 560 million            ing dynamic changes in NO−      3 sourcing and processing at
to meet that goal in 2019 alone (Iowa State University, 2020).       short timescales (Blaen et al., 2017; Bowes et al., 2015;
   Despite the considerable investments in developing solu-          Carey et al., 2014; Kincaid et al., 2020). However, much
tions, downstream water bodies still receive substantial nitro-      previous work has focused on a single catchment and/or
gen loading from their upstream watersheds (Bouraoui and             data collected over a relatively short period of time. This
Grizzetti, 2011; Sprague et al., 2011). A reason for this per-       makes it difficult to determine how the connections between
sistence is the build-up of excess applied nitrogen that can         the hydrologic, biogeochemical, and anthropogenic factors,
remain in the subsurface for decades and contribute to in-           which operate over a range of temporal and spatial scales,
stream nitrate (NO−   3 ) loads long after application practices     influence in-stream NO−   3 concentrations. For example, an-
have changed or mitigation strategies have been implemented          tecedent moisture conditions and precipitation timing and in-
(Fovet et al., 2015; Sebilo et al., 2013). These, and other,         tensity reflect changes that occur over hours or days (Roze-
NO− 3 sources create a heterogeneous patchwork of source ar-         meijer et al., 2010), while vegetation dynamics and on-farm
eas throughout the landscape that can become activated or            practices, such as crop planting and fertilization, reflect sea-
deactivated in response to changing hydrologic conditions            sonal changes (Minaudo et al., 2019; Royer et al., 2006). Ad-
(Abbott et al., 2018; Dupas et al., 2019). A better under-           ditionally, the influence of these factors is impacted by differ-
standing of which factors contribute to source area activa-          ences in watershed-specific characteristics such as topogra-
tion, and the timing of their activation, is critical for predict-   phy, soil type, land use practices, and geologic history (Mari-
ing in-stream NO−    3 concentrations and loads and ultimately       nos et al., 2020; Moatar et al., 2017; Wymore et al., 2017).
developing operational nutrient management strategies.               Understanding how these processes and watershed character-
   The examination of the relationship between solute con-           istics interact across the relevant spatial and temporal scales
centration and stream discharge (c–Q relationships), in com-         in heavily managed watersheds is a crucial step for develop-
bination with other information about watershed structure            ing strategies to mitigate downstream impact (Hansen et al.,
and land use practices, can be an effective way to investi-          2018).
gate contributing source zones within a watershed (e.g., God-           Only recently have high-resolution records become suf-
sey, 2009; Thompson et al., 2011). When viewed in log–log            ficiently long and instrumentation sufficiently widespread to
space, solute concentration and discharge often vary linearly        examine c–Q relationships under different hydrologic condi-
according to a slope, which can be used to describe the rela-        tions in multiple locations. These higher-resolution records
tive tendency of a watershed to transport or retain the solute       allow us to examine nutrient mobilization patterns at the
under various hydrologic conditions (Basu et al., 2010; Mu-          event, seasonal, and annual scale across key spatial gradients
solff et al., 2017). Slopes near zero (|c–Q slope| ≤ 0.2) indi-      in a way not previously possible. Here, we analyze 4 years of
cate the chemostatic behavior in which solute concentration          publicly available daily measurements of discharge and NO−     3
varies little in response to changes in discharge. Chemostatic       concentration from five nested agricultural watersheds in the
conditions can arise when contributing areas have uniform            midwestern United States. Using a semi-autonomous event-
solute concentrations, as is often seen with NO−       3 in areas    picking algorithm, we partition the hydrograph into storm-
with intensive agriculture (Bieroza et al., 2018; Thompson           flow and baseflow periods to address the following research
et al., 2011). In contrast, chemodynamic behavior is char-           questions:
acterized by slopes different from zero in which the solute
concentration is sensitive to changes in discharge. Chemo-             1. How do c–Q relationships during stormflow and base-
dynamic conditions can arise from source areas with more                  flow periods vary by season, and what can that tell us
heterogeneous solute concentrations which may become ac-                  about changes in hydrologic connectivity and nitrogen
tivated under different hydrologic conditions (Dupas et al.,              sources throughout the year?
2019). The c–Q relationship can be characterized as an en-             2. What relationship do NO−3 concentration, load mea-
richment pattern if the slope is positive (c–Q slope>0.2) or a            surements, and c–Q relationships have to underlying
dilution pattern if the slope is negative (c–Q slope< − 0.2).             and human-impacted watershed properties?

Hydrol. Earth Syst. Sci., 25, 1333–1345, 2021                                         https://doi.org/10.5194/hess-25-1333-2021

G. Gorski and M. A. Zimmer: Hydrologic regime drives nitrate export patterns                                                1335

    3. How can high-frequency records be used to identify dis-    2.2   Data sets
       tinct export regimes and characterize anomalous events
       that might play a disproportionate role in watershed c–    We analyzed in situ mean daily NO−     3 concentration (c) and
       Q behavior?                                                discharge (Q) data from the outlet of each watershed at gag-
                                                                  ing stations maintained by the USGS for USC (05482300),
                                                                  MRF (05483600), MJF (05482500), and DVM (05484500)
2     Methods                                                     and from the Iowa Institute of Hydraulic Research (IIHR) for
                                                                  UPN (WQS0032). To retrieve data, we used the dataRetrieval
2.1    Site description
                                                                  package in R (version 3.6.0) through the National Water In-
The Raccoon River watershed drains 8870 km2 of low-relief,        formation System (De Cicco et al., 2018). Data for UPN were
heavily agricultural area in central Iowa, USA, which drains      obtained directly from the IIHR. We analyzed daily discharge
into the Gulf of Mexico (Fig. 1). It is made up of the North      and NO−  3 concentration data from January 2016 to Decem-
Raccoon River watershed (United States Geological Sur-            ber 2019, during which discharge records were complete for
vey hydrologic unit code, USGS HUC – 07100007) and the            all sites and NO−  3 records had >88 % coverage for all sites
South Raccoon River watershed (USGS HUC – 07100006).              except UPN, which had 72 % coverage (Table S1 in the Sup-
   For this study, we subdivided the Raccoon River water-         plement). At each gaging station, NO−    3 concentrations were
shed into a series of five nested watersheds, shown in Fig. 1,    measured at 15 min resolution (5 min for UPN) using Hach
including the Upstream Sac City (USC) and the Middle              Nitratax plus sc probes (Hach, Loveland, CO) and aggre-
Redfield (MRF) on the North Raccoon River, the Upstream           gated to the daily average NO−   3 concentration for this study.
Panora (UPN) on the Middle Raccoon River, the Middle Jef-         NO− 3 concentration averages are not volume weighted in an
ferson (MJF) on the South Raccoon River, and the Down-            effort to facilitate comparison to maximum contaminant lev-
stream Van Meter (DVM), which is below the confluence of          els and target concentrations. Concentrations are measured
the three major tributaries draining the area. The MJF is in-     as NO−              −
                                                                          3 and NO2 in milligrams per liter as nitrogen; how-
clusive of USC, MRF is inclusive of UPN, and DVM is in-           ever, because NO−    2 measurements are generally negligible,
clusive of the entire Raccoon River watershed. Typical of this    we refer to sensor measurements as the NO3 concentration
area, agricultural productivity is the dominant land use in all   throughout.
five watersheds, ranging from 85 % to 92 % of land use (Ta-          To analyze land use characteristics for each watershed, we
ble S2), the vast majority of which is corn (Zea mays L.) and     downloaded land use data from the National Land Cover
soybeans (Glycine max L.).                                        Database 2016 at a 30 m × 30 m resolution (Dewitz, 2019).
   The Raccoon River watershed is marked by a stark divide        Land use data were binned into four categories, namely water
in landforms driven by recent glaciations, with the major-        or wetlands, developed, forested, barren, or shrubs, and crops
ity of the area underlain by glacial sediments deposited by       (including pasture). Data for landforms, drainage infrastruc-
the Des Moines Lobe during the last glaciation of the region      ture, and stream network were downloaded from the Iowa
approximately 12 000 years ago (Prior, 1991). These areas         Department of Natural Resources. Digital elevation model
are characterized by poorly developed surface drainage net-       (DEM) data were downloaded from Amazon Web Services
works and ephemeral surface water bodies. As a result, ex-        (AWS) open Terrain Tiles, using the elevatr package (version
tensive tile drainages, ditches, and canals have been installed   0.3.1) in R (Hollister et al., 2020). We downloaded daily pre-
and constructed, beginning as early as the 1800s, to drain        cipitation data for the 4-year period of analysis (2016–2019)
excess water from the subsurface (Fig. 1). The southwestern       for two sites (USC00137312 and USC00136566) within the
portion of the Raccoon River watershed lies within the south-     Raccoon River watershed from the National Oceanic and At-
ern Iowa drift plain, an area that was shaped by 500 000-         mospheric Administration (NOAA) National Centers for En-
year-old glacial advances that extended south into present        vironmental Information.
day Missouri (Prior, 1991). This portion of the watershed is
characterized by steeper topography and more naturally well-      2.3   Event identification
developed drainage networks, which require less drainage
infrastructure such as tile drains, ditches, and canals. UPN,     We separated the discharge time series into baseflow and
MRF, and DVM drain areas that overlie both the Des Moines         stormflow periods through semi-automating storm event
Lobe and the southern Iowa drift plain, while USC and MJF         identification using the following criteria: (1) dQ/dt ≥ 1 ×
are entirely within the Des Moines Lobe.                          10−4 cfs per second for the rising limb of the event, (2)
   The Raccoon River watershed is characterized by cold dry       max(Qevent ) ≥ 0.01 · max(Qrecord ), and (3) the event dura-
winters and warm wet summers, with an average annual pre-         tion ≥ 3 d. The end of each event was determined when ei-
cipitation of 850 mm (1981–2010; PRISM Climate Group,             ther the event falling limb dQ/dt ≥ 0 or discharge returned
2004), the majority of which falls as rain between April and      to pre-event levels. For some, such as events that appeared
October, aligning with the growing season.                        as shoulder peaks on larger events, or those with indistinct
                                                                  peaks, visual inspection and subjective decisions were re-

https://doi.org/10.5194/hess-25-1333-2021                                      Hydrol. Earth Syst. Sci., 25, 1333–1345, 2021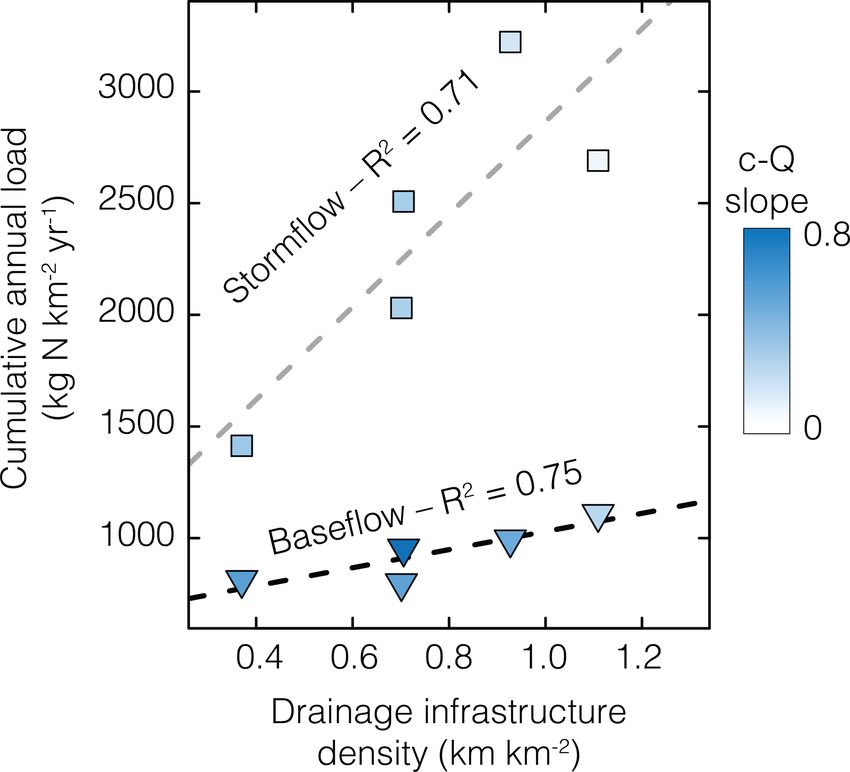
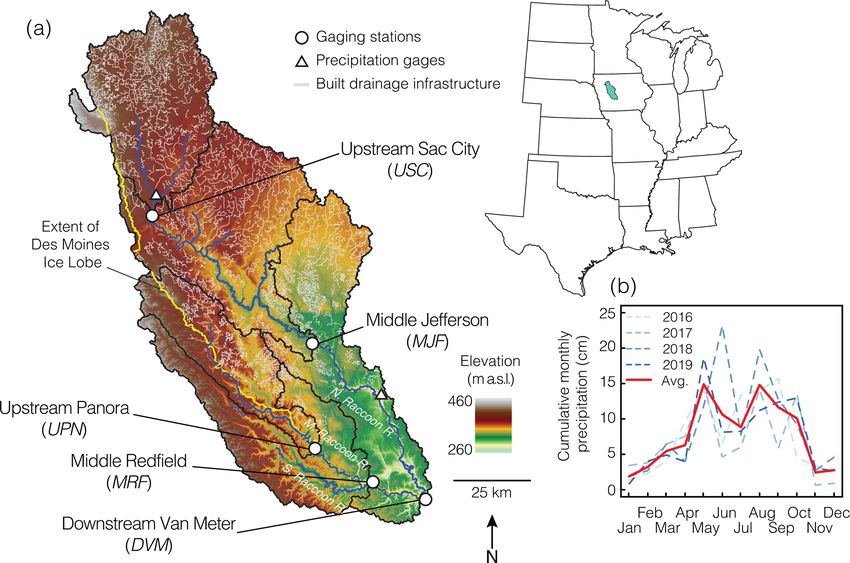
1336                                          G. Gorski and M. A. Zimmer: Hydrologic regime drives nitrate export patterns

Figure 1. (a) Map of five watersheds (black outlines) analyzed in central Iowa along the North, Middle, and South Raccoon rivers. Middle
Jefferson (MJF) is inclusive of Upstream Sac City (USC), Middle Redfield (MRF) is inclusive of Upstream Panora (UPN), and Downstream
Van Meter (DVM) is inclusive of the entire watershed pictured. The yellow line maps the extent of the Des Moines Lobe in the last glaciation.
Areas to the southwest of the line lie in the southern Iowa drift plain. Built drainage infrastructure is shown in gray. Gaging stations (white
circles) are along the North and Middle Raccoon rivers (blue lines), and the DVM gaging station is below the confluence of the branches of
the Raccoon rivers. A total of two precipitation gages are shown with white triangles. Precipitation data were averaged on a monthly basis
across the 4-year study period (2016–2019) and shown in (b); the red line indicates the monthly averages across the 4 years. Landform and
drainage infrastructure data were downloaded from the Iowa Department of Natural Resources.

quired (Fig. S1). The criteria were derived from similar stud-            how a simple partitioning of the hydrograph, based on peaks
ies (Dupas et al., 2016; Knapp et al., 2020; Rozemeijer et                in discharge, allows us to isolate nutrient export dynamics in
al., 2010), and exact thresholds were tuned and adapted for               specific hydrologic regimes.
the structure and dynamics of the watersheds’ hydrographs to
ensure the selection of peaks. We tried several different ap-             2.4   Characterizing export regimes
proaches to identify events (including percent flow change)
but found that the above criteria produced the most reason-               Export patterns (chemostatic, dilution, or enrichment) were
able results. Because the watersheds are in close proximity               calculated for stormflow, baseflow, and the full record (herein
and generally have similar characteristics, their hydrographs             referred to as stormflow and baseflow) for the full period of
exhibit a reasonably similar structure, which may make this               analysis and on a seasonal basis. Concentration–discharge re-
method more suited to this type of analysis. If the analy-                lationships for baseflow and stormflow and baseflow periods
sis were expanded to include watersheds with very differ-                 were calculated by aggregating data for the time period of
ent hydrograph structures, a different approach may be mer-               interest. Stormflow c–Q relationships were calculated in two
ited. Time periods identified as storm events were classified             ways; first, by aggregating data from all stormflow events
as stormflow, and all other times were classified as baseflow             over the time period of interest and, second, by calculating
(Fig. 2).                                                                 c–Q relationships for each individual storm event and av-
   We note that this classification scheme differs from tra-              eraging those values over all events (Fig. S4). The former is
ditional baseflow separation techniques that use graphical,               referred to as bulk stormflow c–Q relationships and the latter
geochemical, or isotopic approaches to identify and separate              as event-averaged c–Q relationships.
the proportion of the hydrograph that is comprised of base-                  The year was divided seasonally into fall (October,
flow and stormflow (Hooper and Shoemaker, 1986; Klaus                     November, and December – OND), winter (January, Febru-
and McDonnell, 2013). Baseflow separation techniques have                 ary, and March – JFM), spring (April, May, and June – AMJ),
shown that a large fraction of event water is derived from                and summer (July, August, and September – JAS).
baseflow (e.g., Schilling and Zhang, 2004). Our goal is not
to contradict or supplant this finding but rather to illustrate

Hydrol. Earth Syst. Sci., 25, 1333–1345, 2021                                               https://doi.org/10.5194/hess-25-1333-2021
G. Gorski and M. A. Zimmer: Hydrologic regime drives nitrate export patterns                                                       1337

                                                                         3     Results and discussion

                                                                         3.1    Streamflow exhibits strong seasonality

                                                                         In all five watersheds, 44 %–52 % of the analysis period was
                                                                         classified as stormflow, with an average of 15 unique storm
                                                                         events in each watershed per year (Table 1). While the pro-
                                                                         portion of stormflow periods was similar between water-
                                                                         sheds, the fraction of flow that was partitioned into storm-
                                                                         flow and baseflow varied considerably between watersheds.
                                                                         MJF and USC had the highest proportion of stormflow, with
                                                                         77.0 % and 73.4 % of annual flow classified as stormflow, re-
                                                                         spectively, compared to 62.4 % and 63.9 % in UPN and MRF,
                                                                         respectively (Table 1). This observation is consistent with the
Figure 2. Example hydrograph and chemograph from one gaging              higher density of drainage infrastructure (e.g., canals and tile
station over the 4-year period of analysis, with the magnified portion   drainage) in MJF and USC, leading to quicker routing of
showing stormflow periods (red) and baseflow periods (blue and           high flows to the stream channel compared to more natural
black). For full records of all five watersheds, see Fig. S1.            drainage networks in UPN and MRF.
                                                                            Flow in all watersheds exhibited strong seasonality, with
                                                                         an average of 42.9 % of total flow delivered in the spring.
  We calculated the coefficient of variation (CV) for c and Q            Summer months contributed the least to overall flow, with
and calculated the ratio of CVc : CVQ to assess the relative             an average of 17.3 % across all watersheds. Despite differ-
variability of each (Musolff et al., 2015; Thompson et al.,              ences in overall flow between the seasons, spring and sum-
2011). CVc : CVQ was calculated as follows:                              mer experienced a similar number of stormflow events across
CVc   µQ σc                                                              all watersheds (average of 5.5 in spring and 4.4 in summer)
    =       ,                                                     (1)    and similar precipitation totals (average 309 mm in spring
CVQ   µc σQ
                                                                         and 381 mm in summer). Increased streamflow in the spring
where µ represents the mean, and σ represents the standard               months is likely a result of snowmelt, rain-on-snow events,
deviation.                                                               which can produce excess runoff, and increased crop growth
                                                                         in the summer months, leading to more water retention.
2.5   Load estimations
                                                                         3.2    NO−3 concentrations are sensitive to watershed
Cumulative NO−  3 load estimates were calculated for each                       characteristics, season, and hydrologic regime
hydrologic regime (stormflow, baseflow, and stormflow and
baseflow) on an annual and seasonal basis, as follows:                   The heavily tile-drained USC watershed showed the highest
Xn                                                                       median NO−   3 concentration of 9.23 ± 3.09 mg per liter (me-
       c Q /f,
   i=1 i i
                                                       (2)               dian ± standard deviation), while MRF, which has the least
                                                                         drainage infrastructure, showed the lowest (6.96 ± 2.51 mg
where ci and Qi are the daily NO−    3 concentration and dis-            per liter; Table S3). This is consistent with observations of
charge values, and f is the fraction of data coverage for the            increased stream NO−  3 concentrations at the outlets of heav-
period of interest. If data were missing during a period, base-          ily tile-drained Iowa watersheds compared to those with less
flow and stormflow loads were calculated based on their frac-            built drainage infrastructure (Schilling et al., 2012). The out-
tional contribution during the periods with data. All annual             let of the largest watershed, DVM, which receives contribu-
periods had f >0.75, but some seasonal periods had low cov-              tions from USC and MRF, showed intermediate NO−          3 con-
erage; for seasonal periods where f ≤ 0.75, no load estimate             centrations of 7.38 ± 3.07 mg per liter.
was calculated.                                                             NO−  3 concentrations displayed pronounced seasonality
   Correlations between nutrient export parameters (load es-             during stormflow and baseflow across all watersheds. Sum-
timates and c–Q slopes) and landscape parameters were cal-               mer baseflow NO−   3 concentrations showed a general decreas-
culated using the Pearson correlation coefficient, and the sig-          ing trend with the watershed area as the outlet of the largest
nificance was determined as being p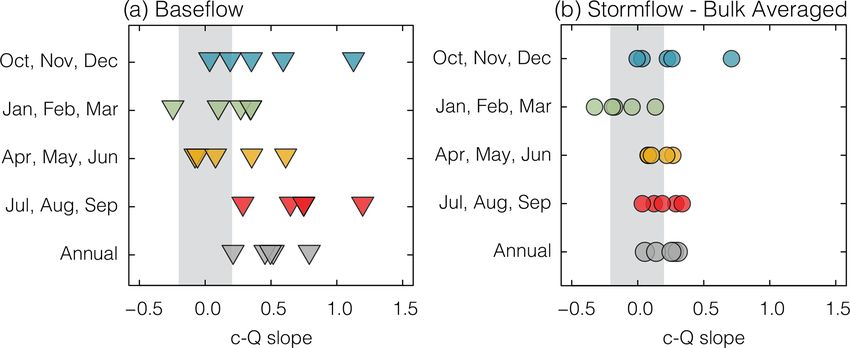
1338                                                 G. Gorski and M. A. Zimmer: Hydrologic regime drives nitrate export patterns

Table 1. Watershed hydrologic characteristics.

                Watershed          Area       Stormflow           Baseflow            Stormflow              OND         JFM        AMJ         JAS
                                              discharge∗         discharge∗               events           (events    (events    (events    (events
                                  (km2 )             (%)                (%)        (events yr−1 )            yr−1 )     yr−1 )     yr−1 )     yr−1 )
                UPN                1116               62.4               32.3                 14.3             3.3        1.3        5.0        5.0
                                                      (9.3)              (5.5)                (1.7)          (1.5)      (0.6)      (0.8)      (2.2)
                USC                1840               73.4               26.6                 15.0             3.0        3.0        5.8        3.3
                                                      (3.5)              (3.6)                (3.6)          (1.4)      (1.8)      (2.5)      (2.8)
                MRF                2548               63.3               36.8                 16.8             3.8        2.3        5.0        5.8
                                                      (4.9)              (4.1)                (1.3)          (1.0)      (1.0)      (0.8)      (1.7)
                MJF                4188                 77               23.1                 14.3             3.7        2.3        5.5        3.8
                                                      (6.1)              (5.3)                (3.9)          (1.6)      (1.9)      (1.3)      (3.3)
                DVM                8870               72.9               27.1                 15.8             3.0        2.3        6.3        4.3
                                                      (6.7)              (4.6)                (5.1)          (1.9)      (1.0)      (1.3)      (2.8)
              ∗ As a percent of total annual discharge, standard deviations are reported in parentheses.

ing in the subsurface and hyporheic zone; both have been                                 flow periods exhibiting generally more chemodynamic c–Q
positively associated with watershed area (Peralta-Tapia et                              slopes (Fig. 4). Enriching chemodynamic export patterns (c–
al., 2015). In addition, summer periods have warmer tem-                                 Q slope >0.2) were observed during baseflow periods in all
peratures which promote biological nitrogen uptake activity                              watersheds annually, with UPN showing the strongest en-
(e.g., denitrification and assimilation) that can lower NO−  3                           richment signal (c–Q slope = 0.79) and USC showing the
concentrations (Moatar et al., 2017; Rode et al., 2016).                                 weakest (c–Q slope = 0.21; Fig. 4a). Baseflow c–Q slopes
Weakened correlations between baseflow NO−       3 concentra-                            were seasonally dynamic. Fall and summer showed gener-
tions and watershed area during the rest of the year suggest                             ally higher c–Q slopes (blue and red triangles, respectively;
that other processes may be more dominant at driving NO−     3                           Fig. 4a), and winter and spring c–Q slopes were closer to
concentrations during non-summer periods.                                                zero (green and yellow triangles, respectively; Fig. 4a).
   Maximum NO−      3 concentrations were observed in the                                   There is a negative correlation between seasonal base-
spring during both baseflow and stormflow periods (Fig. 3).                              flow c–Q slope and drainage infrastructure density, which is
During stormflow periods, NO−      3 concentrations correlated                           strongest during the spring months (R 2 = 0.85;p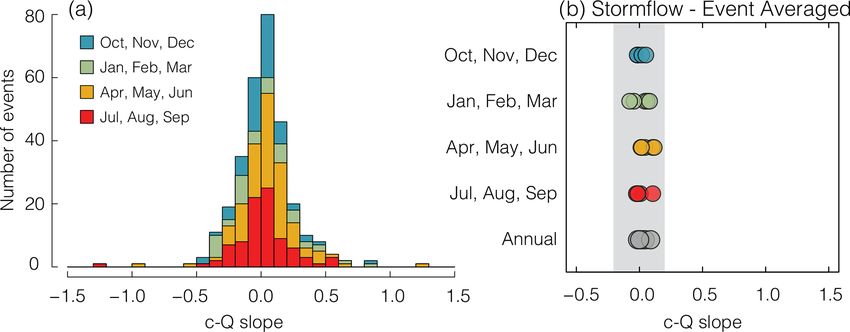
G. Gorski and M. A. Zimmer: Hydrologic regime drives nitrate export patterns 1339
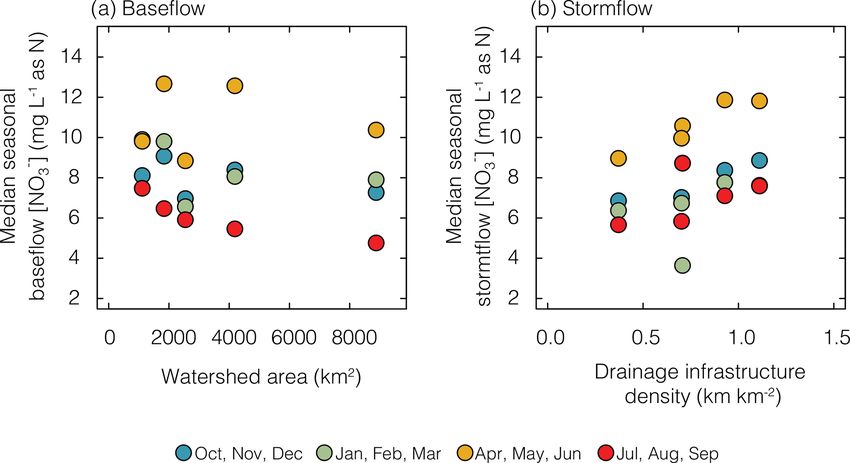
Figure 3. Seasonal median NO− −
3 concentration during baseflow periods plotted against watershed area (a), and NO3 concentration during
−
stormflow periods plotted against drainage infrastructure density (b). Baseflow NO3 concentration showed the strongest correlation with
watershed area during the summer months (red), and stormflow NO− 3 concentration correlated the strongest with drainage infrastructure
density during the spring months (yellow).
Figure 4. Concentration–discharge slopes in each watershed calculated independently for baseflow (a) and bulk stormflow (b) for each
season and annually (gray). Gray boxes indicate chemostatic behavior (|c–Q slope| ≤ 0.2).
The strongest chemodynamic enrichment patterns oc- tion that low-flow periods were more chemodynamic than
curred in the summer across all watersheds, while the most high-flow periods is consistent with other studies that have
chemostatic season was generally the spring (Fig. 4a). This partitioned the hydrograph seasonally (Ehrhardt et al., 2019),
pattern is exemplified in DVM, which integrates the sig- by breakpoint analysis (Marinos et al., 2020), or by median
nal from the other four upstream watersheds. The summer discharge (Moatar et al., 2017), suggesting that this is a gen-
baseflow period in DVM is strongly enriching (c–Q slope = eral feature of watershed hydrologic routing. There is con-
0.75), while, in spring, baseflow is chemostatic (c–Q slope = siderable overlap in c and Q values between stormflow and
0.08). This dynamic shift is driven by differences in baseflow baseflow periods (Fig. S3). Given that baseflow and storm-
NO− 3 concentrations from spring to summer, suggesting dif- flow c–Q patterns differ, this suggests that the partitioning of
ferences in the sourcing or internal processing of baseflow the hydrograph by events may sample different hydrologic
from one season to the next (Richardson et al., 2020). regimes with similar discharges.
The bulk stormflow c–Q slope exhibited subtle season-
3.4 Stormflow c–Q patterns show stationarity in ality, with a slight dilution trend in winter c–Q slopes in
seasonal NO−
3 sources several watersheds and a slight enrichment trend in spring
and summer (Fig. 4b). Fall bulk stormflow c–Q slopes were
Bulk stormflow periods generally exhibited more chemo- chemostatic to weakly chemodynamic for all watersheds ex-
static behavior than baseflow periods (Fig. 4). The observa-
https://doi.org/10.5194/hess-25-1333-2021 Hydrol. Earth Syst. Sci., 25, 1333–1345, 20211340 G. Gorski and M. A. Zimmer: Hydrologic regime drives nitrate export patterns cept UPN, which showed a c–Q slope of 0.71. This higher much more in line with the other watersheds for the fall sea- c–Q slope was driven by two anomalous, low-NO− 3 concen- son. These events were included in our analysis, as they met tration events (discussed in further detail in Sect. 3.5). the criteria for event selection; however, their ability to skew Although tile-drained watersheds show higher stormflow the bulk analysis is notable, as they represent
G. Gorski and M. A. Zimmer: Hydrologic regime drives nitrate export patterns                                                      1341

Figure 5. (a) Individual storm event c–Q slopes for all five watersheds colored by season, and (b) event-averaged stormflow c–Q slope by
season calculated individually for each watershed. Gray boxes indicate chemostatic behavior (|c–Q slope| ≤ 0.2).

                                                                        with zero events identified in USC and MJF. In contrast, there
                                                                        was an average of 6.0 events across all five watersheds in
                                                                        summer 2018, which has an anomalously high nitrate load.
                                                                        Additionally, the identified events in summer 2017 were ap-
                                                                        proximately 22 % the size of the events in summer 2018. This
                                                                        variability highlights the difficulty in predicting loads across
                                                                        seasons, hydrologic regimes, and watersheds.
                                                                           Baseflow loads showed considerable seasonal variability,
                                                                        although they consistently made up ≤ 15 % of the annual
                                                                        load in each watershed. Baseflow loads typically peaked in
                                                                        the spring months, likely due to a seasonally high water ta-
                                                                        ble, which increased shallow groundwater contribution to
                                                                        streams (Jiang et al., 2010; Molenat et al., 2008). Addition-
                                                                        ally, spring fertilizer application and plowing can increase
                                                                        surface leaching, increasing the nitrate pool in the shallow
                                                                        subsurface (Royer et al., 2006). That said, there were some
                                                                        discrepancies within individual watersheds; UPN had the
Figure 6. Seasonal NO−                    2
                         3 load (kg N/km ) normalized by water-         highest seasonal baseflow export in the fall, and MRF had
shed area, averaged over 4 years of analysis (2016–2019), for each
watershed for baseflow periods (a) and stormflow periods (b). Wa-       similar fall and spring baseflow loads (Fig. 6a).
tersheds are ordered by the density of drainage infrastructure from
highest (USC) to lowest (MRF). Error bars show the range of loads       3.7   Nutrient export is driven by the spatial distribution
measured over the 4-year period. Insufficient data were available to          of land use types and hydrologic infrastructure
estimate winter loads in UPN and are indicated with an asterisk (∗ ).
                                                                        There is a systematic trend toward higher-NO−     3 load in wa-
                                                                        tersheds with a higher density of built drainage infrastructure
                                                                        (Fig. 7), consistent with other studies (Basu et al., 2010; Mu-
   Spring stormflow periods accounted for the largest con-
                                                                        solff et al., 2015; Schilling and Zhang, 2004). The slope of
tribution to annual load across all watersheds, with an aver-
                                                                        the relationship between NO−   3 load and drainage infrastruc-
age of 37.5±11.5 % for all years. Spring stormflow contribu-
                                                                        ture density is much shallower for baseflow than for storm-
tions displayed a large spatiotemporal range, from 19.7 % in
                                                                        flow, given the greater range in observed stormflow load
UPN in 2016 to 59.8 % in DVM in 2017. Summer stormflow
                                                                        across the watersheds (Kennedy et al., 2012). Drainage struc-
loads also showed considerable variation, with an average
                                                                        tures and tile drains route water from high-NO−  3 source areas
contribution of 9.4 % of annual load, but ranged from
1342 G. Gorski and M. A. Zimmer: Hydrologic regime drives nitrate export patterns
Seasonal and annual c–Q slopes across all hydrologic
regimes show only weak correlations with watershed area,
suggesting that drainage infrastructure and the distribution
and intensity of agriculture are the dominant drivers of the
NO− 3 export regime in these watersheds. This is consistent
with a recent study of 33 agricultural watersheds in the Mid-
west (Marinos et al., 2020). Our results show that both con-
ditions that lead to high-NO− 3 loads, whether hydrologic
(i.e., stormflow) or landscape (i.e., increases in drainage in-
frastructure and agricultural intensity), are associated with
chemostatic behavior. This trend is in line with the idea that
landscapes with such agricultural intensity are a saturated so-
lute source for which delivery is flow limited (Thompson et
al., 2011).
Figure 7. For all five watersheds, cumulative annual load exported
during stormflow (squares) and baseflow (triangles) periods as a 4 Conclusions
function of the drainage infrastructure density. Shapes are colored
by the average c–Q slope for stormflow and baseflow periods, with Detailed analysis of event, seasonal, and annual NO− 3 export
darker blues associated with more chemodynamic export regimes. showed that all five heavily agricultural watersheds showed
similar temporal patterns of NO− 3 load, with highs in spring
stormflow and lows in summer baseflow. Stormflow across
The short-circuiting of subsurface flow paths and in-
all seasons was largely chemostatic, and spring stormflow ac-
creased cropped area drives watershed nutrient export pat-
counted for ∼ 40 % of annual loads. In contrast, baseflow pe-
terns towards chemostatic behavior by homogenizing the
riods exhibited seasonality in export regimes, with low sum-
source regions and limiting nutrient cycling during trans-
mer flows driving periods of chemodynamic enrichment and
port (Marinos et al., 2020; Musolff et al., 2015; Thomp-
winter and spring driving more chemostatic behavior in the
son et al., 2011). These patterns are most clear during both
winter and spring. The differences in c–Q behavior between
baseflow and stormflow periods in the spring months, when
stormflow and baseflow suggests that the systems dynam-
tile drains likely have their greatest influence on hydrologic
ically, but predictably, shift between NO− 3 export patterns
routing. During the spring months, both baseflow and storm-
in response to hydrologic forcing. There was a systematic
flow NO− 3 loads are strongly correlated with drainage infras- trend toward more chemostatic behavior and higher-NO−
tructure density (R 2 = 0.88 and 0.88, respectively; pG. Gorski and M. A. Zimmer: Hydrologic regime drives nitrate export patterns 1343
lution water quality sampling to disentangle the key factors highly variable storm event responses and dynamic source
controlling watershed nutrient export and the important role zone activation, J. Geophys. Res.-Biogeo., 122, 2265–2281,
of state and federal water quality monitoring programs in ad- https://doi.org/10.1002/2017JG003904, 2017.
dressing important water quality issues. Bouraoui, F. and Grizzetti, B.: Long term change of
nutrient concentrations of rivers discharging in Eu-
ropean seas, Sci. Total Environ., 409, 4899–4916,
https://doi.org/10.1016/j.scitotenv.2011.08.015, 2011.
Data availability. Records that have been portioned into
Bowes, M. J., Jarvie, H. P., Halliday, S. J., Skeffington, R.
stormflow and baseflow for this analysis can be found at
A., Wade, A. J., Loewenthal, M., Gozzard, E., Newman,
https://doi.org/10.4211/hs.173cff98da3c4263a110cba8c6d62406
J. R., and Palmer-Felgate, E. J.: Characterising phospho-
(Gorski and Zimmer, 2020).
rus and nitrate inputs to a rural river using high-frequency
concentration-flow relationships, Sci. Total Environ., 511, 608–
620, https://doi.org/10.1016/j.scitotenv.2014.12.086, 2015.
Supplement. The supplement related to this article is available on- Buda, A. R. and DeWalle, D. R.: Dynamics of stream nitrate sources
line at: https://doi.org/10.5194/hess-25-1333-2021-supplement. and flow pathways during stormflows on urban, forest and agri-
cultural watersheds in central Pennsylvania, USA, Hydrol. Pro-
cess., 23, 3292–3305, https://doi.org/10.1002/hyp.7423, 2009.
Author contributions. GG and MAZ designed the study. GG car- Carey, R. O., Wollheim, W. M., Mulukutla, G. K., and Mineau, M.
ried out the analysis. GG and MAZ prepared the paper. M.: Characterizing storm-event nitrate fluxes in a fifth order sub-
urbanizing watershed using in situ sensors, Environ. Sci. Tech-
nol., 48, 7756–7765, https://doi.org/10.1021/es500252j, 2014.
Competing interests. The authors declare that they have no conflict Conley, D. J., Carstensen, J., Aigars, J., Axe, P., Bonsdor, E.,
of interest. Eremina, T., Haahti, B., Humborg, C., Jonsson, P., Kotta, J.,
and Christer, L.: Hypoxia Is Increasing in the Coastal Zone
of the Baltic Sea, Environ. Sci. Technol., 45, 6777–6783,
Acknowledgements. The authors would like to thank the Iowa In- https://doi.org/10.1021/es201212r, 2011.
stitute of Hydraulic Research for generously providing data. We De Cicco, L. A., Hirsch, R. M., Lorenz, D., and Watkins, W. D.:
also thank one anonymous reviewer and Douglas Burns for their dataRetrieval: R packages for discovering and retrieving water
thoughtful feedback and suggestions during the review process. data available from Federal hydrologic web services, US Geo-
logical Survey, Reston, VA, https://doi.org/10.5066/P9X4L3GE,
2018.
Financial support. This work was supported by the National Sci- Dewitz, J.: National Land Cover Database (NLCD)
ence Foundation Graduate Research Fellowship Program. 2016 Products: U.S. Geological Survey data release,
https://doi.org/10.5066/P96HHBIE, 2019.
Diamond, J. S. and Cohen, M. J.: Complex patterns of catchment
solute-discharge relationships for coastal plain rivers, Hydrol.
Review statement. This paper was edited by Genevieve Ali and re-
Process., 32, 388–401, https://doi.org/10.1002/hyp.11424, 2018.
viewed by Douglas Burns and one anonymous referee.
Diaz, R. J. and Rosenberg, R.: Spreading dead zones and con-
sequences for marine ecosystems, Science, 321, 926–929,
https://doi.org/10.1126/science.1156401, 2008.
References Dosskey, M. G., Vidon, P., Gurwick, N. P., Allan, C. J., Duval, T. P.,
and Lowrance, R.: The role of riparian vegetation in protecting
Abbott, B. W., Gruau, G., Zarnetske, J. P., Moatar, F., Barbe, L., and improving chemical water quality in streams, J. Am. Wa-
Thomas, Z., Fovet, O., Kolbe, T., Gu, S., Pierson-Wickmann, A. ter Resour. Assoc., 46, 261–277, https://doi.org/10.1111/j.1752-
C., Davy, P., and Pinay, G.: Unexpected spatial stability of water 1688.2010.00419.x, 2010.
chemistry in headwater stream networks, Ecol. Lett., 21, 296– Dupas, R., Jomaa, S., Musolff, A., Borchardt, D., and Rode,
308, https://doi.org/10.1111/ele.12897, 2018. M.: Disentangling the influence of hydroclimatic patterns and
Basu, N. B., Destouni, G., Jawitz, J. W., Thompson, S. E., agricultural management on river nitrate dynamics from sub-
Loukinova, N. V., Darracq, A., Zanardo, S., Yaeger, M., hourly to decadal time scales, Sci. Total Environ., 571, 791–800,
Sivapalan, M., Rinaldo, A., and Rao, P. S. C.: Nutrient https://doi.org/10.1016/j.scitotenv.2016.07.053, 2016.
loads exported from managed catchments reveal emergent Dupas, R., Musolff, A., Jawitz, J. W., Rao, P. S. C., Jäger,
biogeochemical stationarity, Geophys. Res. Lett., 37, 1–5, C. G., Fleckenstein, J. H., Rode, M., and Borchardt, D.:
https://doi.org/10.1029/2010GL045168, 2010. Carbon and nutrient export regimes from headwater catch-
Bieroza, M. Z., Heathwaite, A. L., Bechmann, M., Kyllmar, K., ments to downstream reaches, Biogeosciences, 14, 4391–4407,
and Jordan, P.: The concentration-discharge slope as a tool for https://doi.org/10.5194/bg-14-4391-2017, 2017.
water quality management, Sci. Total Environ., 630, 738–749, Dupas, R., Abbott, B. W., Minaudo, C., and Fovet, O.: Dis-
https://doi.org/10.1016/j.scitotenv.2018.02.256, 2018. tribution of landscape units within catchments influences
Blaen, P. J., Khamis, K., Lloyd, C., Comer-Warner, S., Ciocca, nutrient export dynamics, Front. Environ. Sci., 7, 1–8,
F., Thomas, R. M., MacKenzie, A. R., and Krause, S.: High- https://doi.org/10.3389/fenvs.2019.00043, 2019.
frequency monitoring of catchment nutrient exports reveals
https://doi.org/10.5194/hess-25-1333-2021 Hydrol. Earth Syst. Sci., 25, 1333–1345, 20211344 G. Gorski and M. A. Zimmer: Hydrologic regime drives nitrate export patterns Ehrhardt, S., Kumar, R., Fleckenstein, J. H., Attinger, S., and Kincaid, D. W., Seybold, E. C., Adair, E. C., Bowden, W. B., Musolff, A.: Trajectories of nitrate input and output in three Perdrial, J. N., Vaughan, M. C. H., and Schroth, A. W.: nested catchments along a land use gradient, Hydrol. Earth Syst. Land Use and Season Influence Event-Scale Nitrate and Sol- Sci., 23, 3503–3524, https://doi.org/10.5194/hess-23-3503-2019, uble Reactive Phosphorus Exports and Export Stoichiometry 2019. from Headwater Catchments, Water Resour. Res., 56, 1–20, Fazekas, H. M., Wymore, A. S., and McDowell, W. H.: https://doi.org/10.1029/2020WR027361, 2020. Dissolved Organic Carbon and Nitrate Concentration- Klaus, J. and McDonnell, J. J.: Hydrograph separation using sta- Discharge Behavior Across Scales: Land Use, Excur- ble isotopes: Review and evaluation, J. Hydrol., 505, 47–64, sions, and Misclassification, Water Resour. Res., 56, 1–14, https://doi.org/10.1016/j.jhydrol.2013.09.006, 2013. https://doi.org/10.1029/2019WR027028, 2020. Knapp, J. L. A., von Freyberg, J., Studer, B., Kiewiet, L., Fovet, O., Ruiz, L., Faucheux, M., Molénat, J., Sekhar, M., Vertès, and Kirchner, J. W.: Concentration–discharge relationships F., and Aquilina, L.: Using long time series of agricultural- vary among hydrological events, reflecting differences in derived nitrates for estimating catchment transit times, J. Hydrol., event characteristics, Hydrol. Earth Syst. Sci., 24, 2561–2576, 522, 603–617, https://doi.org/10.1016/j.jhydrol.2015.01.030, https://doi.org/10.5194/hess-24-2561-2020, 2020. 2015. Lloyd, C. E. M., Freer, J. E., Johnes, P. J., and Collins, A. L.: Using Godsey, S. E.: Concentration-discharge relationships reflect chemo- hysteresis analysis of high-resolution water quality monitoring static characteristics of US catchments, Hydrol. Process., 23, data, including uncertainty, to infer controls on nutrient and sed- 1844–1864, https://doi.org/10.1002/hyp.7315, 2009. iment transfer in catchments, Sci. Total Environ., 543, 388–404, Gorski, G. and Zimmer, M.: Selected hydro- https://doi.org/10.1016/j.scitotenv.2015.11.028, 2016. graph events from Raccoon River Watershed, Marinos, R. E., Van Meter, K. J., and Basu, N. B.: Is the https://doi.org/10.4211/hs.173cff98da3c4263a110cba8c6d62406, River a Chemostat?: Scale Versus Land Use Controls on Ni- 2020. trate Concentration-Discharge Dynamics in the Upper Missis- Hansen, A. T., Dolph, C. L., Foufoula-Georgiou, E., and sippi River Basin, Geophys. Res. Lett., 47, e2020GL087051, Finlay, J. C.: Contribution of wetlands to nitrate re- https://doi.org/10.1029/2020gl087051, 2020. moval at the watershed scale, Nat. Geosci., 11, 127–132, Mellander, P. E., Melland, A. R., Jordan, P., Wall, D. P., https://doi.org/10.1038/s41561-017-0056-6, 2018. Murphy, P. N. C., and Shortle, G.: Quantifying nutri- Hollister, J., Shah, T., Robitaille, A. L., Beck, M. W., and Johnson, ent transfer pathways in agricultural catchments using high M.: elevatr: Access Elevation Data from Various APIs, Zenodo, temporal resolution data, Environ. Sci. Policy, 24, 44–57, https://doi.org/10.5281/zenodo.4282962, 2020. https://doi.org/10.1016/j.envsci.2012.06.004, 2012. Hooper, R. P. and Shoemaker, C. A.: A Comparison of Chemi- Minaudo, C., Dupas, R., Gascuel-Odoux, C., Roubeix, V., Danis, cal and Isotopic Hydrograph Separation, Water Resour. Res., 22, P. A., and Moatar, F.: Seasonal and event-based concentration- 1444–1454, https://doi.org/10.1029/WR022i010p01444, 1986. discharge relationships to identify catchment controls on nu- Howarth, R. W.: Coastal nitrogen pollution: A review of sources trient export regimes, Adv. Water Resour., 131, 103379, and trends globally and regionally, Harmful Algae, 8, 14–20, https://doi.org/10.1016/j.advwatres.2019.103379, 2019. https://doi.org/10.1016/j.hal.2008.08.015, 2008. Moatar, F., Abbot, B. W., Minaudo, C., Curie, F., and Pinay, Iowa State University: Iowa Nutrient Reduction Strategy: 2018– G.: Elemental properties, hydrology, and biology interact to 19 Annual Progress Report, available at: https://store.extension. shape concentration-discharge curves for carbon, nutrients, sed- iastate.edu/product/15915, last access: 12 July 2020. iment, and major ions, Water Resour. Res., 53, 1270–1287, Jenny, J. P., Normandeau, A., Francus, P., Taranu, Z. E., Gregory- https://doi.org/10.1002/2016WR019635, 2017. Eaves, I., Lapointe, F., Jautzy, J., Ojala, A. E. K., Dorioz, J. M., Molenat, J., Gascuel-Odoux, C., Ruiz, L., and Gruau, G.: Role of Schimmelmann, A., and Zolitschkal, B.: Urban point sources water table dynamics on stream nitrate export and concentration of nutrients were the leading cause for the historical spread of in agricultural headwater catchment (France), J. Hydrol., 348, hypoxia across European lakes, P. Natl. Acad. Sci. USA, 113, 363–378, https://doi.org/10.1016/j.jhydrol.2007.10.005, 2008. 12655–12660, https://doi.org/10.1073/pnas.1605480113, 2016. Musolff, A., Schmidt, C., Selle, B., and Fleckenstein, J. H.: Catch- Jiang, R., Woli, K. P., Kuramochi, K., Hayakawa, A., Shimizu, ment controls on solute export, Adv. Water Resour., 86, 133–146, M., and Hatano, R.: Hydrological process controls on nitro- https://doi.org/10.1016/j.advwatres.2015.09.026, 2015. gen export during storm events in an agricultural watershed, Musolff, A., Fleckenstein, J. H., Rao, P. S. C., and Jawitz, J. W.: Soil Sci. Plant Nutr., 56, 72–85, https://doi.org/10.1111/j.1747- Emergent archetype patterns of coupled hydrologic and bio- 0765.2010.00456.x, 2010. geochemical responses in catchments, Geophys. Res. Lett., 44, Jones, C. S., Wang, B., Schilling, K. E., and Chan, K.: Nitrate 4143–4151, https://doi.org/10.1002/2017GL072630, 2017. transport and supply limitations quantified using high-frequency Pellerin, B. A., Bergamaschi, B. A., Gilliom, R. J., Crawford, C. G., stream monitoring and turning point analysis, J. Hydrol., 549, Saraceno, J., Frederick, C. P., Downing, B. D., and Murphy, J. C.: 581–591, https://doi.org/10.1016/j.jhydrol.2017.04.041, 2017. Mississippi river nitrate loads from high frequency sensor mea- Kennedy, C. D., Bataille, C., Liu, Z., Ale, S., VanDe- surements and regression-based load estimation, Environ. Sci. Velde, J., Roswell, C. R., Bowling, L. C., and Bowen, Technol., 48, 12612–12619, https://doi.org/10.1021/es504029c, G. J.: Dynamics of nitrate and chloride during storm 2014. events in agricultural catchments with different subsurface Peralta-Tapia, A., Sponseller, R. A., Agren, A., Tetzlaff, D., drainage intensity (Indiana, USA), J. Hydrol., 466/467, 1–10, Soulsby, C., and Laudon, H.: Scale-dependent groundwater con- https://doi.org/10.1016/j.jhydrol.2012.05.002, 2012. tributions influence patterns of winter baseflow stream chemistry Hydrol. Earth Syst. Sci., 25, 1333–1345, 2021 https://doi.org/10.5194/hess-25-1333-2021
G. Gorski and M. A. Zimmer: Hydrologic regime drives nitrate export patterns                                                            1345

   in boreal catchments Andrés, J. Geophys. Res.-Biogeo., 120,          Sprague, L. A., Hirsch, R. M., and Aulenbach, B. T.: Nitrate in
   847–858, https://doi.org/10.1002/2014JG002878, 2015.                   the Mississippi River and Its Tributaries, 1980 to 2008: Are
Prior, J. C.: Landforms of Iowa, University of Iowa Press, Iowa City,     We Making Progress?, Environ. Sci. Technol., 45, 7209–7216,
   USA, 1991.                                                             https://doi.org/10.1021/es201221s, 2011.
PRISM Climate Group: http://prism.oregonstate.edu (last access: 1       Thompson, S. E., Basu, N. B., Lascurain, J., Aubeneau, A., and
   July 2020), 2004.                                                      Rao, P. S. C.: Relative dominance of hydrologic versus biogeo-
Rabalais, N. N., Turner, R. E., and Wiseman, W.                           chemical factors on solute export across impact gradients, Water
   J.: Gulf of Mexico hypoxia, a.k.a. “The dead                           Resour. Res., 47, 1–20, https://doi.org/10.1029/2010WR009605,
   zone”,      Annu.     Rev.    Ecol.    Syst.,    33,     235–263,      2011.
   https://doi.org/10.1146/annurev.ecolsys.33.010802.150513,            Turner, R. E., Rabalais, N. N., and Justić, D.: Predicting summer hy-
   2002.                                                                  poxia in the northern Gulf of Mexico: Redux, Mar. Pollut. Bull.,
Rabalais, N. N., Turner, R. E., Díaz, R. J., and Justić, D.: Global      64, 319–324, https://doi.org/10.1016/j.marpolbul.2011.11.008,
   change and eutrophication of coastal waters, ICES J. Mar. Sci.,        2012.
   66, 1528–1537, https://doi.org/10.1093/icesjms/fsp047, 2009.         Van Meter, K. J., Chowdhury, S., Byrnes, D. K., and Basu,
Richardson, C. M., Zimmer, M. A., Fackrell, J. K., and Paytan,            N. B.: Biogeochemical asynchrony: Ecosystem drivers of sea-
   A.: Geologic controls on source water drive baseflow genera-           sonal concentration regimes across the Great Lakes Basin, Lim-
   tion and carbon geochemistry: evidence of nonstationary base-          nol. Oceanogr., 65, 848–862, https://doi.org/10.1002/lno.11353,
   flow sources across multiple subwatersheds, Water Resour. Res.,        2020.
   56, e2019WR026577, https://doi.org/10.1029/2019WR026577,             Weyer, P. J., Cerhan, J. R., Kross, B. C., Hallberg, G. R., Kantam-
   2020.                                                                  neni, J., Breuer, G., Jones, M. P., Zheng, W., and Lynch, C. F.:
Rode, M., Halbedel Née Angelstein, S., Anis, M. R., Bor-                  Municipal drinking water nitrate level and cancer risk in older
   chardt, D., and Weitere, M.: Continuous In-Stream As-                  women: The Iowa women’s health study, Epidemiology, 12, 327–
   similatory Nitrate Uptake from High-Frequency Sensor                   338, https://doi.org/10.1097/00001648-200105000-00013, 2001.
   Measurements, Environ. Sci. Technol., 50, 5685–5694,                 Wherry, S. A., Tesoriero, A. J., and Terziotti, S.: Factors affecting
   https://doi.org/10.1021/acs.est.6b00943, 2016.                         nitrate concentrations in stream base flow, Environ. Sci. Technol.,
Rodríguez-Blanco, M. L., Taboada-Castro, M. M., Taboada-Castro,           55, 902–911, https://doi.org/10.1021/acs.est.0c02495, 2021.
   M. T., and Oropeza-Mota, J. L.: Relating nitrogen export             Wollheim, W. M., Bernal, S., Burns, D. A., Czuba, J. A., Driscoll,
   patterns from a mixed land use catchment in NW Spain                   C. T., Hansen, A. T., Hensley, R. T., Hosen, J. D., Inamdar, S.,
   with rainfall and streamflow, Hydrol. Process., 29, 2720–2730,         Kaushal, S. S., Koenig, L. E., Lu, Y. H., Marzadri, A., Ray-
   https://doi.org/10.1002/hyp.10388, 2015.                               mond, P. A., Scott, D., Stewart, R. J., Vidon, P. G., and Wohl,
Royer, T. V., David, M. B., and Gentry, L. E.: Timing of river-           E.: River network saturation concept: factors influencing the bal-
   ine export of nitrate and phosphorus from agricultural water-          ance of biogeochemical supply and demand of river networks,
   sheds in Illinois: Implications for reducing nutrient loading to       Biogeochemistry, 141, 503–521, https://doi.org/10.1007/s10533-
   the Mississippi River, Environ. Sci. Technol., 40, 4126–4131,          018-0488-0, 2018.
   https://doi.org/10.1021/es052573n, 2006.                             Wymore, A. S., Brereton, R. L., Ibarra, D. E., and Mcdow-
Rozemeijer, J. C., Van Der Velde, Y., Van Geer, F. C., De Rooij,          ell, W. H.: Critical zone structure controls concentration-
   G. H., Torfs, P. J. J. F., and Broers, H. P.: Improving load es-       discharge relationships and solute generation in forested trop-
   timates for NO3 and P in surface waters by characterizing the          ical montane watersheds, Water Resour. Res., 53, 6279–6295,
   concentration response to rainfall events, Environ. Sci. Technol.,     https://doi.org/10.1002/2016WR020016, 2017.
   44, 6305–6312, https://doi.org/10.1021/es101252e, 2010.              Wymore, A. S., Leon, M. C., Shanley, J. B., and McDowell, W.
Schilling, K. and Zhang, Y. K.: Baseflow contribu-                        H.: Hysteretic response of solutes and turbidity at the event scale
   tion to nitrate-nitrogen export from a large, agri-                    across forested tropical montane watersheds, Front. Earth Sci., 7,
   cultural watershed, USA, J. Hydrol., 295, 305–316,                     1–13, https://doi.org/10.3389/feart.2019.00126, 2019.
   https://doi.org/10.1016/j.jhydrol.2004.03.010, 2004.                 Zimmer, M. A., Pellerin, B., Burns, D. A., and Petrochenkov, G.:
Schilling, K. E., Jindal, P., Basu, N. B., and Helmers, M.                Temporal variability in nitrate-discharge relationships in large
   J.: Impact of artificial subsurface drainage on groundwa-              rivers as revealed by high-frequency data, Water Resour. Res.,
   ter travel times and baseflow discharge in an agricultural             55, 973–989, https://doi.org/10.1029/2018WR023478, 2019.
   watershed, Iowa (USA), Hydrol. Process., 26, 3092–3100,
   https://doi.org/10.1002/hyp.8337, 2012.
Sebilo, M., Mayer, B., Nicolardot, B., Pinay, G., and Mar-
   iotti, A.: Long-term fate of nitrate fertilizer in agri-
   cultural soils, P. Natl. Acad. Sci., 110, 18185–18189,
   https://doi.org/10.1073/pnas.1305372110, 2013.

https://doi.org/10.5194/hess-25-1333-2021                                             Hydrol. Earth Syst. Sci., 25, 1333–1345, 2021
You can also read


