Analysis of the Universal Thermal Climate Index during heat waves in Serbia
←
→
Page content transcription
If your browser does not render page correctly, please read the page content below

Nat. Hazards Earth Syst. Sci., 20, 2021–2036, 2020
https://doi.org/10.5194/nhess-20-2021-2020
© Author(s) 2020. This work is distributed under
the Creative Commons Attribution 4.0 License.

Analysis of the Universal Thermal Climate Index during
heat waves in Serbia
Milica M. Pecelj1,2,3 , Milica Z. Lukić4 , Dejan J. Filipović4 , Branko M. Protić4 , and Uroš M. Bogdanović5
1 Geographical  Institute Jovan Cvijić Serbian Academy of Science and Arts, Belgrade, Serbia
2 Department  of Geography, University of East Sarajevo, East Sarajevo, RS, Bosnia and Herzegovina
3 South Ural State University, Institute of Sports, Tourism and Service, Chelyabinsk, Russia
4 Faculty of Geography, University of Belgrade, Belgrade, Serbia
5 Faculty of Organisational Sciences, University of Belgrade, Belgrade, Serbia

Correspondence: Milica M. Pecelj (milicapecelj@gmail.com)

Received: 15 August 2019 – Discussion started: 23 September 2019
Revised: 20 May 2020 – Accepted: 10 June 2020 – Published: 22 July 2020

Abstract. The objective of this paper is to assess the biocli-     1   Introduction
matic conditions in Serbia during summer in order to iden-
tify biothermal heat hazard. Special emphasis is placed on         Extreme weather events such as heat waves, floods, droughts
the bioclimatic index UTCI (Universal Thermal Climate In-          and storms have shown an increased frequency in re-
dex), whose purpose is to evaluate the degree of thermal           cent decades (Brown et al., 2008; Easterling et al., 1997;
stress that the human body is exposed to. For this research,       IPCC, 2012; Rahmstorf and Coumou, 2011; Seneviratne and
mean daily and hourly (07:00 and 14:00 CET) meteorologi-           Nicholls, 2012). Heat and drought events are of great im-
cal data from three weather stations (Zlatibor, Novi Sad and       portance not only in most Mediterranean climate regions but
Niš) have been collected for the period from 1998 to 2017. In      also in most of southern and southeastern Europe because
order to identify patterns of biothermal heat stress conditions,   of the diverse and costly impact that they have on various
the thresholds of the daily UTCI (UTCI ≥ 38 ◦ C, referred          economic sectors and on the environment (Peña-Gallardo et
to as very strong heat stress, VSHS) at 14:00 CET are com-         al., 2019). In their study, Spinoni et al. (2015) made a list of
pared with the thresholds of daily maximum air temperature         the most severe drought events that occurred in Europe from
(tmax ≥ 35 ◦ C, referred to as hot days, HDs), which are fur-      1950 to 2012. They singled out the Balkans (particularly Ser-
ther termed as heat wave events (HWEs). The findings show          bia) as an area that is susceptible to extreme weather and
that the UTCI heat stress category “very strong heat stress“       drought (the longest drought was registered in 2007 and the
at 14:00 CET indicates heat waves. The most extreme heat           most severe drought event in 2011). Furthermore, in 2012,
wave events occurred in 2007, 2012, 2015 and 2017. More-           the Balkan Peninsula and southeastern Europe experienced
over, three HWEs at Niš that occurred in July 2007 lasted 3,       the hottest summer and one of the worst droughts in nearly
10 and 4 d. HWEs and very strong heat stress events (VSH-          40 years (Unkašević and Tošić, 2015; Tolika et al., 2014).
SEs) recorded in July 2007 (lasted 10 d each), 2012 (lasted 9         Extremely high temperatures, especially during the sum-
and 12 d) and 2015 (lasted 7 and 10 d) were of the longest du-     mer months, beg the question as to how heat could affect
ration and are considered to be the indicators of biothermal       the everyday lives of humans. Heat waves as a hazard of-
heat hazard. The daily UTCI14 h heat stress becomes more           ten have a negative effect, causing heat stress in the human
extreme in terms of severity and heat wave duration up to          body. They have both direct effects on human health, affect-
very strong heat stress.                                           ing the body’s physiological responses and functions, and in-
                                                                   direct effects on human health, increasing challenges regard-
                                                                   ing food and water safety (Lee et al., 2019). Bioclimatic con-
                                                                   ditions provide a base for considering the effects of climatic
                                                                   conditions on humans and give special importance to the so-

Published by Copernicus Publications on behalf of the European Geosciences Union.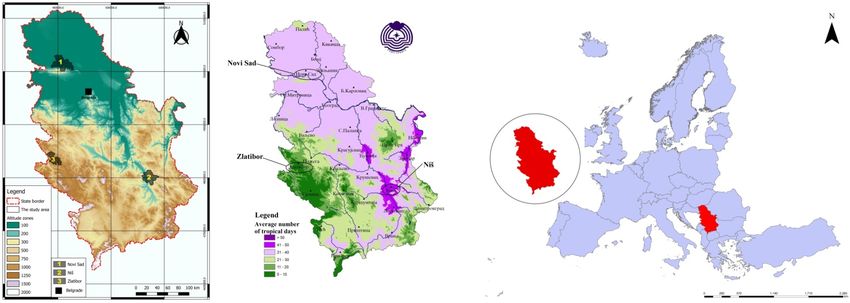
2022                   M. M. Pecelj et al.: Analysis of the Universal Thermal Climate Index during heat waves in Serbia

cial factors that mitigate or reinforce the consequences of en-   dynamic physiological response with a model of human ther-
vironmental changes (Bleta et al., 2014). The impact of the       moregulation together with a modern clothing model. The
weather and climate on humans is most commonly described          UTCI provides multiple opportunities for investigation and
as the biothermal conditions of a certain area, presented by      has many applications in weather forecasting for outdoor ac-
bioclimatic indices. Over the last century many models and        tivities, appropriate behavior and climate therapies as well
indices have been developed for the assessment of human           as in extreme thermal stress alerts. These analyses can have
exposure to heat, ranging from simple physical instruments        applications in tourism, the health sector, and urban and re-
designed to imitate human heat exchange with the environ-         gional planning (Jendritzky et al., 2012). In the past decade, a
ment to complex thermophysiological models that simulate          large number of publications in Europe have concerned anal-
external and internal body heat transfer and allow detailed       yses of bioclimatic conditions in accordance with the UTCI
simulation of different work loads, clothing and climate sce-     (Błażejczyk et al., 2014, 2017; Bleta et al., 2014; Di Napoli
narios (Havenith and Fiala, 2016). According to Epstein and       et al., 2018, 2019; Matzarakis et al., 2014; Milewski, 2013;
Moran (2006), there are over 100 heat stress indices that         Nastos and Matzarakis 2012; Nemeth, 2011; Tomczyk and
could describe extreme bioclimatic conditions in relation to      Owczarek, 2020; Urban and Kyselý, 2014).
humans. Many thermal indices have been developed for the             Although in recent years articles have been published in
purpose of describing the complex conditions of heat ex-          Serbia containing analysis of bioclimatic conditions con-
change between the human body and its thermal environment         ducted by means of other heat budget indices (Basarin et
(Fanger, 1970; Landsberg, 1972; Parsons, 2003). There are         al., 2016, 2018; Lukić et al., 2019; Milovanović et al., 2017;
two meteorological parameter indices: the ones used for cold      Pecelj et al., 2017, 2018; Stojicević et al., 2016), detailed bio-
environment conditions, combining the air temperature and         climatic conditions have not yet been thoroughly analyzed by
the wind velocity (Osczevski and Bluestein, 2005; Siple and       means of the UTCI, especially in the case of heat waves. Heat
Passel, 1945;), and the ones used for heat environment condi-     waves are prolonged periods of unusually high air tempera-
tions combining the air temperature and humidity (Masterton       ture that cause changes in everyday life and may cause health
and Richardson, 1979; Steadman, 1984; Yaglou and Minard,          and well-being effects due to heat stress. Even though heat
1957). Considering their shortcomings, i.e., the fact that they   waves are understood as meteorological events, their signifi-
are not universally applicable to all climatic regions (includ-   cance and influence could not be adequately presented with-
ing different seasons), the dominance in the analysis of bio-     out showing their clear impact on humans (Robinson, 2001).
thermal conditions and thermal stress over the last 30 years      There is a need to study the evolution of such indices re-
has been taken over by so-called heat budget indices (Blaze-      garding heat stress that affects the human thermoregulatory
jczyk, 1994; Höppe, 1999; Jendritzky et al., 2012). The heat      system as a result of heat exchange between the body and its
budget indices are based on the thermal exchange between          thermal environment.
humans and the environment. Methodologically, they use               Considering the fact that extreme temperature is one of
variables related to meteorological (air temperature, wind ve-    the most significant climatic parameters in the universal con-
locity, radiation, air humidity) and physiological (most com-     text of climate change, analyses of heat waves in Serbia have
monly metabolic heat) processes and clothing insulation. The      been performed using several different approaches, and all of
issue that should be emphasized during the analysis of ther-      them show a growing trend in maximum temperature (Drl-
mal stress is the influence that extreme temperatures have on     jača et al., 2009; Unkašević and Tošić, 2009a, b, 2013) and
the physiological parameters in humans. According to Mc-          heat waves (Unkašević and Tošić, 2011, 2015; Malinović-
Gregor and Vanos (2018), generated heat load can undermine        Milićević, 2013; Malinović-Milićević et al., 2016), espe-
the human body’s ability to hold its core temperature within      cially since 2000.
the range of optimal physiological performance.                      Keeping this fact in mind, the basic idea of this study is
   For the purpose of estimating the thermal effect of the        to conduct analysis of human bioclimatic conditions over
environment on the human body, the total effects of all the       the last 20 years in Serbia, where, according to the previ-
thermal components are considered by the Universal Ther-          ous studies mentioned above, warming has been perceived
mal Climate Index (UTCI). The UTCI is a heat budget index         and recorded, especially since 2000. Determining extreme
that considers both physiological and meteorological param-       weather events from the aspect of heat budget indices allows
eters and describes the physiological heat stress that the hu-    other meteorological parameters to be taken into account be-
man body experiences while achieving thermal equilibrium          cause high temperatures and humidity generate a heat load
with the surrounding outdoor environment (Błażejczyk et al.,     more rapidly unless the wind and direct radiation are taken
2013). Compared to other indices, the UTCI is more sen-           into account. The analysis of bioclimatic conditions implies
sitive to changes in all of the environment parameters, par-      the determination of UTCI thermal stress during the summer
ticularly air temperature, solar radiation, humidity and wind     months and different heat stress that has occurred in the past
speed (Błażejczyk et al., 2012). According to Jendritzky et      20 years in different geographical landscapes in Serbia. In
al. (2012) the UTCI evaluates the outdoor thermal environ-        addition to UTCI thermal stress, extreme temperature thresh-
ment for biometeorological applications by simulating the         olds were analyzed in order to observe biothermal stress re-

Nat. Hazards Earth Syst. Sci., 20, 2021–2036, 2020                                https://doi.org/10.5194/nhess-20-2021-2020
M. M. Pecelj et al.: Analysis of the Universal Thermal Climate Index during heat waves in Serbia                               2023

lated to heat waves. The conducted human bioclimatic eval-           meet air currents from the Adriatic Sea, which, as it can be
uation of UTCI thermal stress in Serbia was considered to            assumed, creates a favorable climate. For this reason Zlatibor
be of great importance due to the identification of biother-         has already been confirmed as a climatic resort (Pecelj et al.,
mal heat hazard and the study of the evolution of such in-           2017). The mountain climate of Zlatibor involves long and
dices regarding climate change. This evaluation is aimed at          cold winters, short and fresh summers, and less pronounced
addressing the following topics in this study:                       spring and autumn.
  – providing a comprehensive assessment of the human
    heat stress associated with the UTCI and
                                                                     2     Materials and methods
  – comparing it to heat waves defined by meteorological
    parameters.                                                      The present study implements the methodological approach
                                                                     of the UTCI. As a thermal comfort indicator, the UTCI con-
Study area                                                           siders combined meteorological and physiological parame-
                                                                     ters describing thermal comfort through the evaluation of hu-
The Republic of Serbia is located in southeastern Europe,            man energy balance. In terms of physiological conditions,
in the area of the southern Pannonian Plain and the cen-             metabolic rate plays an important role. Metabolic processes
tral Balkans. Northern Serbia is mainly flat, while its cen-         in the human body create heat that is constantly exchanged
tral and southern areas consist of highlands and mountains           with the environment, achieving a state of thermal equilib-
(Gocić and Trajković, 2014), as the map of the relief char-        rium in the body for maintaining a constant body tempera-
acteristics shows (Fig. 1). The territory of Serbia is char-         ture. The amount of the heat that is produced and released de-
acterized by temperate continental and mountain climate,             pends on the following: physical activity, clothing, sex, age,
and the spatial distribution of climate parameters is deter-         body mass, diet, mental state, health, external conditions, ac-
mined by geographical location. The Serbian territory is of          climatization etc. The unit of “MET” was introduced as a
the Cfb type according to Koppen–Geiger climate classifica-          measure of physical activity; 1 MET equals the heat release
tion, and it is characterized by a warm, temperate, humid cli-       of 58.2 W m−2 from the average skin surface area of an adult
mate with warm summers and maximum precipitation during              (1.8 m2 ). It is equal to the energy rate produced per unit sur-
late spring and early summer.                                        face area of an average person seated at rest (ANSI/ASHRAE
    The research involved studying three synoptic stations lo-       Standard 55, 2017). According to ISO 8996 (2004), the
cated in different geographical areas of Serbia: (i) Novi Sad,       metabolic heat energy of a person moving at the speed of
(ii) Niš and (iii) Zlatibor (Fig. 1).                                1.1 m s−1 is M = 135 W m−2 , i.e., 2.3 MET.
    The first weather station (at an altitude of 86 m) is located
in the territory of Novi Sad, which is the administrative urban      2.1    The Universal Thermal Climate Index (UTCI)
center of the province of Vojvodina and the South Bačka Dis-
trict (Fig. 1, area 1). The city is located in the southern part     For valid assessment of the outdoor thermal environment in
of the Pannonian Basin, on the Danube riverbank near Fruška          the fields of public weather services, public health systems,
Gora and the national park bearing the same name. Novi Sad           urban planning, tourism and recreation, and climate impact
has a temperate continental climate, summers are warm, and           research, the UTCI was developed based on the most recent
winters are cold, with a small amount of snow (Lazić et al.,        scientific progress in human thermophysiology in biophysics
2006). The second station is Niš (at an altitude of 202 m), and      and heat exchange theory. The UTCI is the result of an ap-
it is located in the Niš Fortress. This city is the administrative   proach which was developed in the International Society of
urban center of the Nišava District in southern Serbia, and it       Biometeorology (ISB) Commission 6 and was later improved
is situated in the Nišava valley, located in the central part        by COST Action 730 (Jendritzky et al., 2012). The design of
of a spacious geological depression called the Nišava basin          the UTCI is of great importance due to the fact that it is ap-
(Fig. 1, area 2). According to Köppen–Geiger climate clas-           plicable to all seasons and climates together with all spatial
sification, the Nišava valley belongs to the Cfwax type – the        and temporal scales.
Danube type of moderately warm and humid climate charac-                Human reaction was simulated by the UTCI-Fiala multin-
terized by hot summers (the highest precipitation is recorded        ode model of human thermoregulation, which was integrated
at the beginning of the summer) and somewhat dry winters             with an adaptive clothing model. For any combination of me-
(Prokić, 2018). Compared to other cities in this valley (Dim-       teorological parameters (Eq. 1), based on the conception of
itrovgrad, Pirot and Bela Palanka), Niš is the hottest, with an      an equivalent temperature, the UTCI is the air temperature of
average annual temperature of 11.8 ◦ C (Prokić, 2018).              the reference environment, which, according to the model,
    The third station is Zlatibor, a mountain in western Ser-        produces an equivalent dynamic physiological response un-
bia, which belongs to the mountain range of the Dinaric Alps         der a set of reference conditions (Bröde et al., 2012). In other
(Fig. 1, area 3). The Zlatibor weather station lies at an altitude   words, this model simulates the same sweat production or
of 1029 m a.s.l. In the area of the Zlatibor plateau, mountains      skin wettedness in human body response as the actual envi-

https://doi.org/10.5194/nhess-20-2021-2020                                   Nat. Hazards Earth Syst. Sci., 20, 2021–2036, 2020
2024 M. M. Pecelj et al.: Analysis of the Universal Thermal Climate Index during heat waves in Serbia
Figure 1. Relief map of Serbia with the studied areas: (1) Novi Sad, (2) Niš and (3) Zlatibor (left). Map of the average number of tropical
days in Serbia per year for the period 1981–2010 (middle; source: Republic Hydrometeorological Service of Serbia, RHMSS) and a map of
the geographical location of Serbia in Europe (right). Maps were created using QGIS 3.8 software on the basis of the European Commission’s
official (Eurostat) data sets (available at https://ec.europa.eu/eurostat/web/gisco/geodata/reference-data/, last access: 3 February 2020; map
ratio: 1 : 1 900 000; map projection: WGS 84/UTM, Zone 34N, the official national coordinate system).
ronment condition (Błażejczyk et al., 2013, 2014). This is layers are strongly influenced by changes in wind speed and
derived from the multidimensional dynamic response of a body movement and will therefore also influence physiolog-
state-of-the-art multinode thermophysiological model of hu- ical responses (Błażejczyk et al., 2012). Particular ranges of
man heat transfer and thermoregulation (Fiala et al., 2012). the UTCI are categorized according to thermal stress (Ta-
The UTCI can be represented as a general function as below: ble 1).
UTCI = f (t, f, v, tmrt ) 2.2 Data and indices considered in the study
UTCI = f (air temperature, relative humidity, wind
speed, mean radiant temperature) . (1) The meteorological data set from the period from 1998 to
2017 was recorded for two urban weather stations (Novi
For appropriate use, the UTCI can only be approximated us- Sad and Niš) and one rural mountain station (Zlatibor).
ing a regression equation abbreviated from sample calcula- Mean daily and hourly meteorological parameters (07:00,
tions performed by computing centers (Bröde et al., 2012; 14:00 CET) of air temperature (t), air humidity (f ) and
Jendritzky et al., 2012). The UTCI index (approximated us- wind speed (v) from the above weather stations were con-
ing a regression equation) causes a narrow range of input pa- sidered for the calculation of particular UTCI thermal heat
rameters it can manage. For the reference environment, the stress in the summer months (July, August and September).
ISB Commission on the UTCI decided to use (i) a wind speed The meteorological data set used in the study was retrieved
(v) of = 0.5 m s−1 at 10 m height (approximately 0.3 m s−1 from the Meteorological Yearbook for the period from 1998
at 1.1 m), (ii) a mean radiant temperature (tmrt ) equal to air to 2017 (Republic Hydrometeorological Service of Serbia,
temperature and (iii) vapor pressure that represents a relative 2018), while the UTCI was calculated by applying the BioK-
humidity (f ) of 50 %; at high air temperatures (> 29 ◦ C) the lima 2.6 software package (available at http://www.igipz.pan.
reference humidity was taken to be constant at 20 hPa (Błaże- pl/Bioklima-zgik.html, last access: 10 May 2019).
jczyk et al., 2013). Physiological parameters, the metabolic Although extreme temperatures are one of the most ef-
rate (M) and the thermal properties of clothing (clothing in- fective climatic parameters in the universal case of hot days
sulation, permeability) are taken as universal constants in and heat waves, the influence of other parameters, especially
the model due to the evaluation by means of the regression clothing insulation and metabolic rate, can justify thermal
equation. This implies an outdoor activity of a person walk- discomfort and the other way around. In that regard, the sum-
ing at the speed of 4 km h−1 (1.1 m s−1 ), corresponding to mer (July, August and September) daily maximum and min-
heat production of 135 W m−2 (2.3 MET) of metabolic en- imum temperatures (tmax , tmin ) for the same stations were
ergy (Błażejczyk et al., 2013; Jendritzky et al., 2012) and analyzed in terms of particular thresholds to identify the fre-
clothing insulation that is self-adapting according to the en- quency of extremely high temperatures and heat waves in the
vironmental conditions (Havenith et al., 2012). Clothing in- period observed and to compare them with the discomfort
sulation, vapor resistance and the insulation of surface air recorded by the UTCI.
Nat. Hazards Earth Syst. Sci., 20, 2021–2036, 2020 https://doi.org/10.5194/nhess-20-2021-2020M. M. Pecelj et al.: Analysis of the Universal Thermal Climate Index during heat waves in Serbia 2025
Table 1. UTCI thermal stress classification.
UTCI (◦ C) > 46 38 to 46 32 to 38 26 to 32 9 to 26 0 to 9 0 to −13 −13 to −27 −27 to −40 < −40
Stress Extreme Very Strong Moderate No Slight Moderate Strong Very Extreme
classes heat strong heat heat thermal cold cold cold strong cold
stress heat stress stress stress stress stress stress stress cold stress stress
Abbr. EHS VSHS SHS MHS NTS SLCS MCS SCS VSCS ECS
Source: Błażejczyk et al. (2013).
The first stage of the study presented mean daily As a result of comparing UTCI thermal stress to the
(UTCIavg ), morning (UTCI7 h ) and midday (UTCI14 h ) UT- selected thresholds of maximum and minimum tempera-
CIs. They are presented by months (July, August, September) tures, biothermal discomfort was identified during extremely
for each station to identify the general differences caused by high temperatures for the geographical area of Serbia. The
the geographical origin of the stations under study. The quan- recorded number of days with VSHS was compared to the
tification of human bioclimatic conditions in Serbia was de- number of days when the maximum air temperature was
signed for the UTCIs on a daily basis for each defined stress above 35 ◦ C.
category. To obtain better insight into the UTCI values dur-
ing the summer months, the averaged monthly UTCI14 h was
provided for each year to see how much the UTCI14 h fluctu- 3 Results
ated in relation to the average monthly value.
For the second stage, midday UTCI14 h heat stress indices On the basis of the conducted bioclimatic analysis and com-
(strong heat stress, SHS; very strong heat stress, VSHS; ex- parison of biothermal conditions given in the two urban me-
treme heat stress, EHS) and thermal indices based on the teorological stations Novi Sad and Niš as well as Zlatibor,
maximum and minimum temperatures (hot day, HD, and hot which represents a rural and lower mountain area, some dif-
night, HN) were identified. During the midday observation ferences in weather conditions were perceived in the summer
(14:00 CET), SHS, which refers to a UTCI range of 32 to period as was expected. The results are presented in three
38 ◦ C, and VSHS, which refers to a UTCI range of 38 to sections: (i) UTCIs (UTCIavg , UTCI7 h , UTCI14 h ), (ii) UTCI
46 ◦ C (Table 2), are particularly prominent. The occurrence heat stress indices (SHS, VSHS and EHS) and thermal in-
of thermal stress days was presented for each month (July, dices (HD and HN), and (iii) heat waves (HWEs and VSH-
August and September) in the last 20 years. EHS, which SEs).
refers to a UTCI range above 46 ◦ C, was presented separately
when it occurred. 3.1 UTCIs (UTCIavg , UTCI7 h , UTCI14 h )
Thermal indices (HD and HN) were identified on the ba-
sis of the threshold of the maximum and minimum temper- This section presents the results of the heat budget in-
atures. Considering the influence of extreme temperatures, dex UTCI calculated for mean daily (UTCIavg ), morning
as stated by Collins et al. (2000), the following indices were (UTCI7 h ) and midday (UTCI14 h ) data for the period of
marked in relation to the thresholds of maximum and min- 20 years. In particular, physiological stress in the category of
imum temperature: hot days (HD = tmax ≥ 35 ◦ C) and hot “strong heat stress” occurred quite frequently in 1998, 2000,
nights (HN = tmin ≥ 20 ◦ C; Table 2). Such a high tempera- 2004, 2007, 2011, 2012, 2015 and 2017 at Niš (July and Au-
ture (35 ◦ C or higher), taken as a threshold of what is de- gust) and slightly less frequently at Novi Sad, where “strong
fined as a heat wave, is assumed to be related to the very heat stress” occurred more frequently in July and August of
strong heat stress category of the UTCI. It should be taken 2000, 2002, 2006, 2007, 2009, 2013, 2015, 2016 and 2017.
into account that, according to the Serbian National Weather A much smaller amount of strong heat stress was observed
Service, a daily maximum temperature of 30 ◦ C or higher is at Zlatibor. There were periods in which the categories of
taken as the threshold of what is called a tropical day. “moderate” and “strong heat stress” were evenly distributed
For the last stage of the study, with the purpose of identi- in the months of July and August over the period that was
fying thermal discomfort during the period observed, a heat investigated. It is important to emphasize that the category of
wave event (HWE = 3 HDs of tmax ≥ 35 ◦ C) is determined “strong heat stress” occurred most frequently at Zlatibor in
as an illustration of a threshold based on the duration of HDs 2000, 2004, 2007, 2012, 2015 and 2017, which generally co-
and HNs. In addition, as an illustration of a threshold based incided with the other two stations. These are the years when
on the duration of VSHS, a very strong heat stress event significant heat waves were recorded. The results depicted
(VSHSE) is determined, and it is caused by the occurrence in Fig. 2 show the frequency (in percentages) of all stress
of 5 consecutive VSHS days (Table 2). categories for each index (UTCIavg , UTCI7 h , UTCI14 h ) that
https://doi.org/10.5194/nhess-20-2021-2020 Nat. Hazards Earth Syst. Sci., 20, 2021–2036, 20202026 M. M. Pecelj et al.: Analysis of the Universal Thermal Climate Index during heat waves in Serbia
Table 2. Definition of indices used in the study.
Abbreviations UTCIs Definition
UTCIavg Universal Thermal Climate Index UTCIavg = f (t, f, v, tmrt )
UTCI07h Universal Thermal Climate Index07h UTCI7 h = f (t7 h , f7 h , v7 h , tmrt )
UTCI14 h Universal Thermal Climate Index14 h UTCI14 h = f (t14 h , f14 h , v14 h , tmrt )
Abbreviations UTCI heat stress indices Definition
SHS Strong heat stress SHS = UTCI (32 to 38 ◦ C)
VSHS Very strong heat stress VSHS = UTCI (38 to 46 ◦ C)
VSHSE Very strong heat stress event Minimum of 5 VSHS days in a row
EHS Extreme heat stress EHS = UTCI > 46 ◦ C
Abbreviations Thermal indices Definition
HD Hot day tmax ≥ 35 ◦ C
HN Hot night tmin ≥ 20 ◦ C
HWE Heat wave event Minimum of 3 HDs in a row
t : air temperature; f : relative humidity; v : wind speed; tmrt : mean radiant temperature; tmax : maximum air temperature; tmin :
minimum air temperature.
occurred in July, August and September for the period that erate heat stress”, while at the hourly level (UTCI14 h ) the
was observed. most frequent category is “strong heat stress”. This is related
Bioclimatic conditions at Niš are certainly the most un- to the statements made by Di Napoli et al. (2018) about two
pleasant ones given the domination of the “strong heat stress” thermal climates in Europe; one of them is associated with
and not-so-rare “very strong heat stress” categories during heat stress condition and is predominant in the southern part
the period of 20 years. Extreme heat stress for the mid- of Europe, including the Balkans, when moderate and strong
day UTCI14 h was observed on 5 d. The most pleasant bio- heat stress occurs at central daytime hours, which reflects the
climatic conditions can be observed in the morning hours general relationship between heat load and insolation.
(UTCI7 h ), when the dominant categories are “moderate heat Days with very strong heat stress were observed in July
stress” (July and August) and “no thermal stress” in Septem- and August (Fig. 2b), and there was 1 d with extreme heat
ber (Fig. 2a). Niš is located in the south of Serbia and belongs stress in July 2007. Zlatibor has distinctive characteristics of
to the areas that are most endangered by drought and extreme the submountain and mountain climate. Among these three
high temperatures in Serbia. This is confirmed by Tošic and stations, the bioclimatic conditions of Zlatibor are the most
Unkasević (2014) in the study of dry periods in Serbia dur- pleasant, considering the dominant category of “no thermal
ing the period between 1949 and 2011. It was found that stress” at the daily level of the UTCIavg . The thermal con-
the frequency of droughts in the southern part of Serbia was ditions with a morning UTCI7 h are similar to the UTCIavg ,
higher than in the other parts of the country. The most severe while the UTCI14 h shows the prevailing categories of “mod-
drought occurred at Niš and lasted from July 2006 to March erate heat stress” and slightly less significant categories of
2008 (with a duration of 21 months and severity of 63.0). “strong heat stress” and “very strong heat stress”. It is im-
Novi Sad is located in the northern part of Serbia, on the portant to emphasize that the UTCI category of “slight cold
slopes of Fruška Gora, and is characterized by a temperate stress” for all the indices (UTCIavg , UTCI7 h , UTCI14 h ) was
continental and continental climate. Therefore, bioclimatic recorded several times during the 3 months of the period ob-
conditions at Novi Sad are more pleasant than those at Niš. served. The lowest value of the UTCI was −2.84 ◦ C, and it
Nevertheless, this does not rule out the occurrence of high occurred on 5 September 2007 at Zlatibor as moderate cold
temperatures and severe dry periods during the warm part stress (Fig. 2c).
of the year. This idea is based on the findings of Leščešen Of all the calculated UTCIs, mean daily data (UTCIavg ),
et al. (2019), when they analyzed drought periods in Vojvo- morning data (UTCI7 h ) and midday data (UTCI14 h ), the
dina for over 60 years (1956–2016). All the regions of Vo- midday UTCI14 h shows the most extreme values for iden-
jvodina that were investigated experienced at least one ex- tifying heat waves and biothermal heat discomfort. In this
treme drought event over the reference period, in particular regard, for further data analysis in this study, the UTCI14 h is
in 2000, 2001–2002 and 2011–2012. Moreover, the same re- used. To gain better insight into the UTCI14 h values during
sults were obtained in other similar studies (Gocić and Tra- the summer months, for the investigated period, the averaged
jković, 2013, 2014; Milanović, et al., 2014). At the mean monthly UTCI14 h for each year was provided for all three
daily level (UTCIavg ) the most frequent category is “mod- stations. The mean monthly values are presented in Fig. 3
Nat. Hazards Earth Syst. Sci., 20, 2021–2036, 2020 https://doi.org/10.5194/nhess-20-2021-2020M. M. Pecelj et al.: Analysis of the Universal Thermal Climate Index during heat waves in Serbia 2027 Figure 2. Monthly frequency of the days with different UTCI stress classes for mean daily (UTCIavg ), morning (UTCI7 h ) and midday (UTCI14 h ) indices during the period from July to September, 1998–2017: (a) Niš, (b) Novi Sad, (c) Zlatibor. x axis: time (months); y axis: frequency (number of days). together with the trends in the UTCI14 h and mean abso- 3.2 Thermal indices and UTCI heat stress indices lute deviation of the UTCI14 h in order to see how much the UTCI14 h fluctuated in relation to the mean monthly value. This section identifies the midday UTCI14 h heat stress in- The results show a significant increase in the extreme values dices (SHS and VSHS) and thermal indices marked in rela- of the UTCI14 h over the last 10 years, presented mainly as tion to the thresholds of the maximum and minimum temper- VSHS. A series of peaks can be observed in the years that atures in particular (HD and HN). Figure 4 presents the fre- have been marked as extremely warm. In addition, there is quency (number of days) of HDs, HNs, SHS and VSHS for a growing trend of the UTCI14 h in all the summer months each month (July, August and September) in the last 20 years. and all the weather stations, i.e., a series of peaks with suc- The results of the UTCI that were obtained show compatibil- cessively higher values during the investigated period (1998– ity with previous analyses in relation to the occurrence of 2017). The highest trend can be seen in September at Niš and heat waves, especially since 2000 (Basarin et al., 2018; Un- Zlatibor, while the lowest trend can be observed in August at kašević and Tošić, 2009a, b, 2013). Zlatibor. In accordance with the thresholds of maximum temper- As regards the severity of the daily UTCI, there were atures in July, there were several years at Niš with 10 or 5 d recorded at Niš when the UTCI14 h exceeded the limit more HDs in July, when the temperature was above 35 ◦ C, value for EHS. This happened on 5 July 2000 (UTCI14 h = as shown in Fig. 4. This can be observed in July of 2000, 47.08 ◦ C), 24 July 2007 (UTCI14 h = 48.26 ◦ C), 24 August 2007, 2012, 2015 and 2017; in total, it amounts to 10, 18, 16, 2007 (UTCI14 h = 46.29 ◦ C), 5 August 2017 (UTCI14 h = 11 and 11 HDs, respectively, for each year. As regards the 46.75) and 6 August 2017 (UTCI14 h = 46.76 ◦ C). The max- thresholds of maximum temperature at Novi Sad, there were imum value of the UTCI at Novi Sad was recorded on 10 or more HDs with temperatures above 35 ◦ C; more specif- 24 July 2007 (UTCI = 48.42 ◦ C). In the area of Zlatibor, ex- ically there were 10 and 11 HDs in July of 2012 and 2015, treme heat stress has not been recorded in the last 20 years. respectively. At Zlatibor only 2 HDs were recorded in July The highest values of the UTCI at Zlatibor occurred on 2007. In August, this can be observed in 2000, 2007, 2012, 22 and 24 July 2007 (UTCI14 h = 38.62 ◦ C and UTCI14 h = 2013, 2015 and 2017, and in total it amounts to 12, 12, 10, 38.37 ◦ C). The year 2007 is rated as the most unfavorable, 10, 13 and 13 HDs, respectively, for each year at Niš. The particularly the date of 24 July, when the highest temper- highest number of days with a temperature over 35 ◦ C was ature ever in Serbia was recorded (Smederevska Palanka, recorded in 2000, 2012, 2015 and 2017, and in total for each tmax = 44.9 ◦ C, source: Republic Hydrometeorological Ser- year it amounts to 9, 8, 11 and 13, respectively. At Zlatibor vice of Serbia, RHMSS). there are no HDs recorded in August (Fig. 4). https://doi.org/10.5194/nhess-20-2021-2020 Nat. Hazards Earth Syst. Sci., 20, 2021–2036, 2020
2028                    M. M. Pecelj et al.: Analysis of the Universal Thermal Climate Index during heat waves in Serbia

Figure 3. The mean monthly UTCI14 h during the period 1998–2017. x axis: time (years); y axis: UTCI (◦ C).

Figure 4. Number of HDs and HNs as well as SHS and VSHS days at Niš, Novi Sad and Zlatibor (July, August, September 1998–2017). x
axis: time (years); y axis: number of days.

Nat. Hazards Earth Syst. Sci., 20, 2021–2036, 2020                                    https://doi.org/10.5194/nhess-20-2021-2020
M. M. Pecelj et al.: Analysis of the Universal Thermal Climate Index during heat waves in Serbia                          2029

Table 3. Linear correlation of the UTCI14 h and tmax .              For Zlatibor the correlation is slightly lower in July and
                                                                 August, while in September it is weak compared to the urban
         UTCI14 h ∼ tmax      Niš    Novi Sad     Zlatibor       stations, but neither HD nor VSHS indices occurred at Zlati-
         July                0.88         0.97           0.85
                                                                 bor. Similar results of the linear relationship between the air
         August              0.92         0.95           0.77    temperature and the UTCI (r = 83; r = 0.98) were shown in
         September           0.89         0.92           0.41    the studies of Urban and Kyselý (2014) for summer in the
                                                                 urban areas of South Bohemia in the Czech Republic and in
                                                                 the studies of Nassiri et al. (2017) for Iran.

   For the period investigated (1998–2017), the total number     3.3   Heat waves (HWEs and VSHSEs)
of hot days recorded in July, August and September at Niš
was 126, 133 and 21, respectively, while Novi Sad saw about      After UTCI thermal stress was compared to the selected
half of the said number of hot days, namely 52, 63 and 3         thresholds of maximum temperature, biothermal discomfort
HDs, respectively. At Zlatibor 2 HDs were recorded in July.      was identified during extremely high temperatures for the ge-
   As regards HNs, there is generally a lower intensity of       ographical area of Serbia. During the observed period, an
HNs compared to HDs. Generally, during the observed pe-          HWE was determined, caused by 3 consecutive HDs, as was
riod, up to 4 HNs were recorded, although an increase in         a VSHSE, caused by the occurrence of 5 consecutive VSHS
the HNs has been observed in the last 10 years. For exam-        days.
ple, in 2012, 2015 and 2017 the number of HNs recorded at           Table 4 lists the identified heat waves that refer to the
Niš in July was 12, 7 and 7, respectively, and in 2000, 2013,    UTCI14 h VSHS (VSHSEs) and HD index (HWEs). It has a
2015 and 2017 the number of HNs recorded in August was           very similar layout. However, shadowed differences can be
8, 6, 5 and 5, respectively. Since 2010 up to 2 HNs have been    observed, especially in the duration of the heat wave event.
recorded in September. At Novi Sad, in 2010, 2012, 2015 and      The results are presented for Niš and Novi Sad since there
2017 there were 7, 5, 5 and 6 HNs, respectively, recorded in     were no recorded heat waves at Zlatibor. More heat waves,
July, while in August of 2012 and 2017 there were 5 and 7        both HWEs and VSHSEs, have been identified in the last 10
HNs, respectively. In September, 1 HN was recorded in 2009       years.
and 2011 (Fig. 4). The total number of hot nights recorded in       An HWE of 10 d in a row (Niš, from 15 to 24 July 2007)
July, August and September for the investigated period at Niš    represents the maximum number of consecutive days with
was 60, 56 and 6 HNs, respectively, while at Novi Sad there      such high temperatures when all three stations are compared.
was a significantly lower number of hot nights: 41, 38 and 2,    In the same month, HWEs of 3 d in a row (8 to 10 July) and
respectively. At Zlatibor 9 HNs were recorded in July, and 11    4 d in a row (27 to 30 July) were observed (HWE in Table 4).
HNs were recorded in August for the period investigated.         Altogether, HWEs occurred three times, and they lasted 3,
   Midday UTCI14 h SHS occurs most commonly at all three         10 and 4 d in July 2007, which is certainly an extreme for the
stations. For example, SHS is particularly important to Zlati-   observed period. The HWEs, which lasted 3 or 4 d in a row,
bor, located at an altitude above 1000 m, since there has been   occurred in 9 of the 20 years in the observed period. From
an increase in the number of days with SHS at Zlatibor over      that source, HWEs occurred twice and lasted 3 to 4 d in July
the last decade. The best indicator is the increase in SHS       2004 and 2017 (Table 4). It is necessary to point out that heat
in September. Similarly, the indicator of biothermal discom-     waves in July 2002, 2005, 2007, 2012 and 2015 lasted more
fort, VSHS, has been occurring more frequently in the last       than 5 HDs in a row, with tmax above 35 ◦ C, amounting to
decade, reaching a maximum of 17 d in July 2007 and 2012         6, 6, 10, 9 and 7 HDs, respectively. In August HWEs with
and in August 2015 at Niš. The number of VSHS days at            3 to 6 HDs in a row occurred twice in 1999, 2000, 2001,
Novi Sad reached a maximum of 12 d in July 2015 and 14 d         2012, 2015 and 2017. Furthermore, in August, series of heat
in August 2015 and 2017. The total number of VSHS days           wave events with 5 HDs in a row or more were observed in
recorded in July, August and September for the investigated      1998, 2000, 2007, 2012, 2013, 2015 and 2017, amounting to
period at Niš was 167, 174 and 25, respectively, while at Novi   5, 6, 6, 6, 7 and 6 HDs in a row, respectively. As regards the
Sad there was a significantly lower number of VSHS days:         thresholds at Novi Sad, there were two HWEs with 3 and 4
83, 97 and 7, respectively. At Zlatibor 2 VSHS days were         HDs in a row, which occurred in August of 2012 and 2015.
recorded in July and 3 VSHS days were recorded in August.        In 2017 three HWEs occurred with 6, 3 and 3 HDs in a row.
The recorded numbers of VSHS days indicate slightly greater      It is certainly important that two HWEs occurred in Septem-
biothermal discomfort duration in relation to the number of      ber 2015 and lasted 3 and 5 HDs in a row, with tmax above
HDs. The HD and VSHS indices are significantly correlated        35 ◦ C (Table 4). This justifies the finding of Tomczyk (2016)
during the summer months as they are directly derived from       that the heat waves began to occur in September in the last
the maximum air temperatures and the UTCI14 h (Table 3).         decade. As shown in Fig. 4, the number of HDs in Septem-
The UTCI14 h and tmax for the Niš and Novi Sad urban sta-        ber during the period of 20 years increased significantly after
tions have a significantly high linear correlation.              2007, especially at Niš.

https://doi.org/10.5194/nhess-20-2021-2020                              Nat. Hazards Earth Syst. Sci., 20, 2021–2036, 2020
2030 M. M. Pecelj et al.: Analysis of the Universal Thermal Climate Index during heat waves in Serbia
Table 4. Number of HWEs and VSHSEs at Niš and Novi Sad (July, August and September 1998–2017).
HWE July August September VSHSE July August September
Niš Novi Sad Niš Novi Sad Niš Niš Novi Sad Niš Novi Sad Niš
1998 4 – 5 – – 1998 7 – 5 – –
1999 – – 3, 4 – – 1999 – – 5 – –
2000 3 – 4, 6 6 – 2000 – – 6 7 –
2001 3 – 3, 3 – – 2001 – – – – –
2002 6 – – – – 2002 – – – – –
2003 4 – – – – 2003 – – – – –
2004 3, 4 3 – – – 2004 5, 5 – – – –
2005 6 – – – – 2005 6 – – – –
2006 – – 3 – – 2006 – – – – –
2007 3, 10, 4 6 6 – – 2007 10 7 – – –
2008 – – 4 3 3 2008 – – 5 – –
2009 – – 3 – – 2009 – – – – –
2010 – – 4 – – 2010 – – 5 – –
2011 3 4 3 – – 2011 – – – – –
2012 9 6 4, 6 3, 5 – 2012 12 6 5, 6 5, 5 –
2013 – – 7 4 – 2013 – – 8 8 –
2014 – – – – – 2014 – – – – –
2015 7 9 6, 4 4, 5 5, 3 2015 10 8 7 6 5
2016 3 – – – – 2016 – – – – –
2017 4, 4 – 6, 4 6, 3, 3 – 2017 – – 6, 5 6 –
Note: bold cells have more than one HWE and VSHSE and are defined by the number of consecutive days.
There were 21 HDs in September at Niš, and only 1 HD category of VSHS is compared to the selected HWEs, a
was recorded in the first decade (1998–2007) of the investi- subindex is defined. It is called a VSHSE, and it is caused
gated period, while the remaining HDs were recorded over by the occurrence of 5 consecutive VSHS days. The VSHSE
the last decade (2008–2017), especially in 2011 and 2015. In corresponds to a heat wave event and provokes severe bio-
the second decade of the investigated period, the year 2015 thermal discomfort, so it was used as an indicator of ex-
stands out with two HWEs (1–5 and 17–19 September). In tremely unfavorable bioclimatic conditions (biothermal heat
the same year the highest daily temperature was recorded hazard). Along these lines, the VSHSE at Niš occurred in
in September (on 18 September; tmax = 37.5 ◦ C). A similar July of 1998, 2004, 2005, 2007, 2012 and 2015, when 7, 5
situation occurred in the area of Novi Sad. During the first (on two occasions), 6, 10, 12 and 10 VSHS days in a row
10 years, not a single HD was recorded in September, while were recorded, respectively (VSHSE in Table 4). In August,
after 2007, 5 such days were recorded. For Niš and Novi a VSHSE was recorded 5 VSHS days in a row in 1998, 1999,
Sad the year 2015 stands out, and the hottest September days 2008, 2010, 2012 and 2017, while in 2000, 2012, 2013, 2015
were 17 and 18 September, with tmax = 36.7 and 36.4 ◦ C. and 2017, a VSHSE was recorded 6, 6, 8, 7 and 6 VSHS
For both weather stations in the second decade, together days in a row, respectively. It should be emphasized that there
with the increase in the number of HDs, there was also an in- were two VSHSE events in 2012 and 2017, corresponding to
crease in the number of HNs. In September, the daily air tem- 5 and 6 VSHS days in a row, respectively. September 2015
perature increases, so days with temperatures around 30 ◦ C saw a VSHSE with 5 VSHS days in a row. According to
and higher are more frequent. At this weather station, the Unkašević and Tošić (2009b) the highest temperatures ever
year 2015 stands out, with the same date of the hottest day in at Niš were recorded during the summer of 2007 (44.2 ◦ C)
September (18 September; tmax = 33.2 ◦ C). This correlates and the summer of 2000 (42.5 ◦ C), covering the data period
with the heat wave analysis in Athens, where a period of heat from 1948 to 2007. The VSHSE occurred at Novi Sad in July
waves lasted from mid-June to the beginning of September 2007 (7 VSHS days in a row), 2012 (6 VSHS days in a row)
(Papanastasiou et al., 2014). In the area of Zlatibor, there and 2015 (8 VSHS days in a row) as well as in August 2000
was no significant phenomenon of extreme temperatures, and (7 VSHS days in a row), 2013 (8 VSHS days in a row), 2015
therefore no HWEs were recorded. (6 VSHS days in a row) and 2017 (6 VSHS days in a row). In
Bioclimatic conditions analyzed by means of the UTCI August 2012 there were two VSHSEs, and each time 5 VSHS
show that the calculated data observed at 14:00 CET are re- days in a row were recorded. There was no VSHSE recorded
lated to the marked HWEs. When the UTCI14 h thermal stress at Zlatibor.
Nat. Hazards Earth Syst. Sci., 20, 2021–2036, 2020 https://doi.org/10.5194/nhess-20-2021-2020M. M. Pecelj et al.: Analysis of the Universal Thermal Climate Index during heat waves in Serbia 2031
4 Discussion HDs. This is important because there is a difference be-
tween the biothermal heat stress defined by VSHS and po-
The purpose of this study is to investigate biothermal condi- tential heat stress defined by maximum temperatures, where
tions in Serbia during summer and provide a comprehensive the calculation of the UTCI, apart from temperature, includes
assessment of human heat stress connected with the UTCI some other parameters such as humidity, wind speed and di-
during heat waves. The results obtained in the study indi- rect solar radiation together with metabolic rate and cloth-
cate the general increase in biothermal discomfort associated ing insulation. Extremely high temperature does not neces-
with heat waves defined by maximum air temperature above sarily cause heat stress if the wind is strong, and the rela-
35 ◦ C and the UTCI “very strong heat stress” above 38 ◦ C. tive humidity is low if a person is not being physically ac-
The morning, midday and average UTCIs show a signifi- tive. For instance, the situation at Novi Sad on 30 July 2007,
cant occurrence of thermal heat stress (moderate, strong and when the maximum temperature was higher than the calcu-
very strong heat stress) during the summer months and an in- lated UTCI (tmax = 26.9 ◦ C; UTCI14 h = 15.7 ◦ C; no thermal
crease in biothermal discomfort especially for the UTCI14 h . stress), does not necessarily indicate biothermal heat stress if
This is confirmed by the obtained distribution of the aver- the wind speed is high (6.7 m s−1 ) or the relative humidity is
age monthly UTCI14 h showing a significant increase in the lower (52 %). On the other hand, the situation on 26 August
extreme values of the UTCI14 h in the last 10 years, pre- 2002, when the maximum air temperature was lower than the
sented mainly as VSHS together with a growing trend of the calculated UTCI (tmax = 24.5 ◦ C; UTCI14 h = 30.6 ◦ C), indi-
UTCI14 h in all the summer months for all three investigated cates that heat stress may still occur if the wind speed is low
weather stations, primarily at Niš. These findings show that (0.8 m s−1 ) or the relative humidity is higher (57 %). This in-
heat waves and biothermal heat discomfort may be more fre- dicates the sensitivity of the index to environmental param-
quent and longer in the future, and this indicates the need for eters, especially wind speed, humidity, air temperature and
biothermal heat warnings. The increase in extreme biother- solar radiation. In this sense, determining extreme weather
mal heat conditions is the most evident in the number of days events from the aspect of human heat budget indices allows
with UTCI thresholds between 38 and 46 ◦ C, defined in the other meteorological parameters to be taken into account.
study as “very strong heat stress” (VSHS), and maximum air Apart from temperature and humidity, wind and direct so-
temperature thresholds above 35 ◦ C, defined in the study as lar radiation have been considered together with metabolic
“hot days” (HDs). Thus, most HDs (18 d) occurred in 2007 rate and clothing insulation.
and then in 2012 (16 d), meaning that more than half of July The identified heat waves based on the threshold of the
in these years was characterized by extremely high temper- UTCI correspond to the identified heat waves based on the
atures. Of particular importance is the increasing number of threshold of maximum air temperatures. Furthermore, there
HDs and HNs as well as SHS and VSHS days in September has been a significant increase in heat waves (HWEs and
since 2008 (Fig. 4). Similar results about increase in daily VSHSEs) and the duration of such events over the last 10
maximum air temperature were obtained by Unkašević and years at Niš and Novi Sad, especially at Niš. Similar results
Tošić (2011), when record values of the maximum tempera- about the increase in heat waves at Novi Sad defined by an-
tures were observed for almost the whole territory of Serbia other heat budget index, physiological equivalent tempera-
in 2007. As reported by Papanastasiou et al. (2014), the sum- ture (PET), for the period from 1949 to 2012 were reported in
mer of 2007 was the warmest summer in Athens in the last Basarin et al. (2016); the highest number of heat waves was
100 years. This follows the statement made by Di Napoli et observed in the last 2 decades and in the first decade of the in-
al. (2018) about the UTCI reference value from the period vestigated period, while the number of the days above partic-
between 1979 and 2016, when the UTCI at 12:00 UTC was ular thresholds for the period 1961–2014 shows an increase
about 0.5 ◦ C colder in the period between 1980 and 1999, along with the number of heat waves per year since 1981.
while it was 0.5 ◦ C warmer in the period between 2000 and Urban areas have a high risk of heat absorption of buildings
2009 and 1 ◦ C warmer in the period between 2010 and 2016. and asphalt, which results in the formation of high tempera-
The significant findings from this study imply that the tures during the night (Giannopoulou et al., 2014). Rural and
UTCI category of VSHS defines extreme biothermal heat mountainous areas rich in forests and greenery, like Zlatibor,
discomfort that can be considered to be a biothermal heat are less exposed to these phenomena, but during the hottest
hazard. The UTCI14 h category of VSHS correlates with summer months, days and nights with high temperatures can
HDs, and there has been an increase in the number of such occur (Fig. 2c).
days over the last 10 years. Particularly severe biothermal It is important to point out that several heat waves oc-
heat discomfort occurred in 2007 (18 VSHS days) and 2012 curred in summer. The analysis highlights 2007, 2012, 2015
(17 VSHS days). Nevertheless, the total number of VSHS and 2017 as the years with the most heat waves registered
days (558 d) at all three stations for the investigated period as HWEs, with special emphasis on Niš, where the longest
is greater than the total number of HDs (400 d), which in- HWE lasted for 10 d in July 2007, with a UTCI over 38 ◦ C
dicates a slightly longer duration of biothermal heat dis- and maximum temperature over 35 ◦ C (Table 4). This agrees
comfort defined by the UTCI compared to the number of with the findings of Unkašević and Tošić (2011, 2015) that
https://doi.org/10.5194/nhess-20-2021-2020 Nat. Hazards Earth Syst. Sci., 20, 2021–2036, 20202032 M. M. Pecelj et al.: Analysis of the Universal Thermal Climate Index during heat waves in Serbia there has been a growing trend of heat waves in Serbia, es- ple, chronic patients and workers, who are particularly sus- pecially since 2000. In order to justify the present research ceptible to them. for the last 20 years, the earlier results related to the in- However, this study probably has potential limitations. crease in heat waves are discussed in more detail. In that re- The period under observation could be longer for the pur- gard, previous research on heat waves at Niš for the period poses of keeping track of the trend of extremes. This short- from 1949 to 2007, based on the autoregressive–moving- coming was attenuated by referencing a more detailed review average model, observed the warmest years during three pe- of previous studies on the trend of maximum temperatures riods: 1951–1952, 1987–1998 and 2000–2007 (Unkašević in Serbia reported by Unkašević and Tošić (2009a, 2011, and Tošić, 2009b). According to this research, the longest 2015), Drljača et al. (2009), Malinović-Milićević (2013), heat wave was recorded at Niš in 1952, with 21 d, while in and Malinović-Milićević et al. (2016). Furthermore, com- 2003, 29 consecutive tropical days were observed. It should plete hourly weather data are missing, and therefore they be taken into account that, according to the Serbian Na- are not sufficient for a more detailed analysis of UTCI val- tional Weather Service, tropical days are days with a max- ues, which might be used for healthcare purposes. As for the imum temperature over 30 ◦ C. Furthermore, based on the UTCI, it should be emphasized that the model is limited by Heat Wave Duration Index (HWDI), i.e., daily maximum val- a fixed metabolic rate that approximates light physical activ- ues of air temperature, Drljača et al. (2009) determined the ity (1.1 m s−1 ). In other words, biothermal heat discomfort duration and strength of heat waves at Niš during the sum- can cause a stronger heat load in humans if the physical ac- mer season. The analysis showed Niš with a greater number tivity is more intense. However, considering a wide spatial of heat waves compared to the larger urban area of Belgrade. dimension of diverse geographic and climate regions where As stated in the research, since the mid-1980s, heat waves the UTCI has been applied, adaptation to existing biothermal have had a higher frequency, and on average they have oc- conditions, hot or cold, should be excluded. curred every year. Prior to that period heat wave fluctuations Nevertheless, the research results of this study highlight were generally reported in 1 of 2 years (Niš during the sum- the importance that the UTCI as a bioclimatic indicator has mer; Drljača et al., 2009). While studying the characteris- for biothermal heat discomfort, particularly if it is connected tics of the heat waves in central Serbia (1949–2007), Un- to the effects on human health. This study features a human kašević and Tošić (2011) detected an increase in heat wave bioclimatic method of analyzing a biothermal condition with duration in addition to an increase in heat wave frequency special emphasis on heat stress so that the impact on human of occurrence during the period from 1999 to 2007. More- health and well-being can be understood better. over, based on the HWDI, heat waves at Novi Sad show a The application of the standardized bioclimatic heat bud- trend of increasing tropical days (tmax ≥ 30.0 ◦ C) from 1960 get index UTCI helps improve the understanding of bio- to 2010, indicating the years 1994, 1998, 2000, 2003, 2007, thermal conditions related to heat waves. The results ob- 2009 (Malinović-Milićević, 2013). tained from this study show that UTCI14 h heat stress be- Further, two HWEs lasting 5 and 3 d were highlighted in comes more extreme in terms of severity and heat wave dura- September 2015, and a VSHSE that lasted 5 d was also high- tion up to VSHS. The biothermal indices investigated for the lighted. This agrees with the statement of Tomczyk (2016) three weather stations follow the trend of general warming. that, in the last decades, heat waves have begun to occur in As reported by Vuković et al. (2018), future change analysis September in southeastern Europe, where the highest number in Serbia concerning the base period 1986–2005, in compli- of HWEs is usually recorded in July and August. ance with the Intergovernmental Panel on Climate Change Biothermal discomfort identified in July and August as the (IPCC) Fifth Assessment Report (AR5), shows an increase hottest summer months in Serbia could provoke health dis- in temperature by the end of the 21st century, which proves orders more frequently. Human sensitivity to extreme-heat that it is necessary to take immediate measures to alleviate weather can also be seen in the impact of heat waves on daily negative impacts. In light of climatic changes and other neg- mortality in Belgrade during the summer, when the strong ative factors resulting from this global phenomenon, it is be- correlation between heat waves and daily mortality can be coming a true challenge to minimize their effects and im- observed in July 2007 (Stanojević et al., 2014). Similarly, prove living conditions in urban and rural areas (Stevović et Bogdanović et al. (2013) reported a significant short-term al., 2017). Bearing in mind the above, the findings of this excess mortality on 16 July in Belgrade, when the maxi- study indicate the need to make plans regarding adaptation mum daily temperature exceeded 35 ◦ C, leading to 167 ex- and mitigation measures in public weather services, public cess deaths (38 % increase compared to the number of ex- health systems, urban planning, tourism and recreation, and pected deaths) for 9 consecutive days of heat, with a pro- climate impact research. This implies creating a high-density gressive return to almost normal mortality as the maximum network of urban measuring stations for the potential moni- temperature dropped below 35 ◦ C on 25 July. Specific HWE toring of biothermal heat discomfort as long as the UTCI has characteristics such as intensity and duration may have dev- applications in weather forecasting regarding outdoor activi- astating effects on human health and well-being. In certain ties, appropriate behavior and climate therapies, and extreme cases, heat waves cause problems for children, elderly peo- thermal stress alerts. For future research, it is necessary to Nat. Hazards Earth Syst. Sci., 20, 2021–2036, 2020 https://doi.org/10.5194/nhess-20-2021-2020
You can also read


