Gridded pollen-based Holocene regional plant cover in temperate and northern subtropical China suitable for climate modelling
←
→
Page content transcription
If your browser does not render page correctly, please read the page content below
Earth Syst. Sci. Data, 15, 95–112, 2023
https://doi.org/10.5194/essd-15-95-2023
© Author(s) 2023. This work is distributed under
the Creative Commons Attribution 4.0 License.

                 Gridded pollen-based Holocene regional plant
                  cover in temperate and northern subtropical
                      China suitable for climate modelling
         Furong Li1,2 , Marie-José Gaillard2 , Xianyong Cao3 , Ulrike Herzschuh4,5,6 , Shinya Sugita7 , Jian Ni8 ,
           Yan Zhao9,10 , Chengbang An11 , Xiaozhong Huang11 , Yu Li11 , Hongyan Liu12 , Aizhi Sun10 , and
                                                     Yifeng Yao13
                            1 School       of Ecology, Sun Yat-sen University, Shenzhen, 518107, China
             2 Department       of Biology and Environmental Science, Linnaeus University, Kalmar 39182, Sweden
       3 Alpine Paleoecology and Human Adaptation Group (ALPHA), State Key Laboratory of Tibetan Plateau Earth

                   System, and Resources and Environment (TPESRE), Institute of Tibetan Plateau Research,
                                           Chinese Academy of Sciences, Beijing 100101, China
                             4 Alfred Wegener Institute Helmholtz Center for Polar and Marine Research,

                                             Research Unit Potsdam, Potsdam 14473, Germany
            5 Institute of Environmental Science and Geography, University of Potsdam, Potsdam 14476, Germany
                     6 Institute of Biochemistry and Biology, University of Potsdam, Potsdam 14476, Germany
                                   7 Institute of Ecology, University of Tallinn, Tallinn 10120, Estonia
                  8 College of Chemistry and Life Sciences, Zhejiang Normal University, Jinhua 321004, China
                                  9 Institute of Geographic Sciences and Natural Resources Research,

                                           Chinese Academy of Sciences, Beijing 100101, China
                                 10 University of Chinese Academy of Sciences, Beijing 100101, China
                  11 College of Earth and Environmental Sciences, Lanzhou University, Lanzhou 730000, China
              12 College of Urban and Environmental Sciences and MOE Laboratory for Earth Surface Processes,

                                                  Peking University, Beijing 100871, China
                             13 Institute of Botany, Chinese Academy of Sciences, Beijing 100093, China

                                   Correspondence: Furong Li (lifr5@mail.sysu.edu.cn)

                                   Received: 29 April 2022 – Discussion started: 18 July 2022
                     Revised: 15 November 2022 – Accepted: 19 November 2022 – Published: 6 January 2023

      Abstract. We present the first gridded and temporally continuous quantitative pollen-based plant-cover recon-
      struction for temperate and northern subtropical China over the Holocene (11.7 ka to present) obtained by ap-
      plying the Regional Estimates of VEgetation Abundance from Large Sites (REVEALS) model. The objective
      is to provide a dataset of pollen-based land cover for the last ca. 12 millennia that is suitable for palaeoclimate
      modelling and for the evaluation of simulated past vegetation cover from dynamic vegetation models and anthro-
      pogenic land-cover change (ALCC) scenarios. The REVEALS reconstruction was achieved using 94 selected
      pollen records from lakes and bogs at a 1◦ × 1◦ spatial scale and a temporal resolution of 500 years between
      11.7 and 0.7 ka and in three recent time windows (0.7–0.35 ka, 0.35–0.1 ka, and 0.1 ka to present). The dataset
      includes REVEALS estimates of cover and their standard errors (SEs) for 27 plant taxa in 75 1◦ × 1◦ grid cells
      distributed within the study region. The 27 plant taxa were also grouped into 6 plant functional types and 3
      land-cover types (coniferous trees CT, broadleaved trees BT, and C3 herbs/open land (C3 H/OL)), and their RE-
      VEALS estimates of cover and related SEs were calculated. We describe the protocol used for the selection of
      pollen records and the REVEALS application (with parameter settings) and explain the major rationales behind
      the protocol. As an illustration, we present, for eight selected time windows, gridded maps of the pollen-based

Published by Copernicus Publications.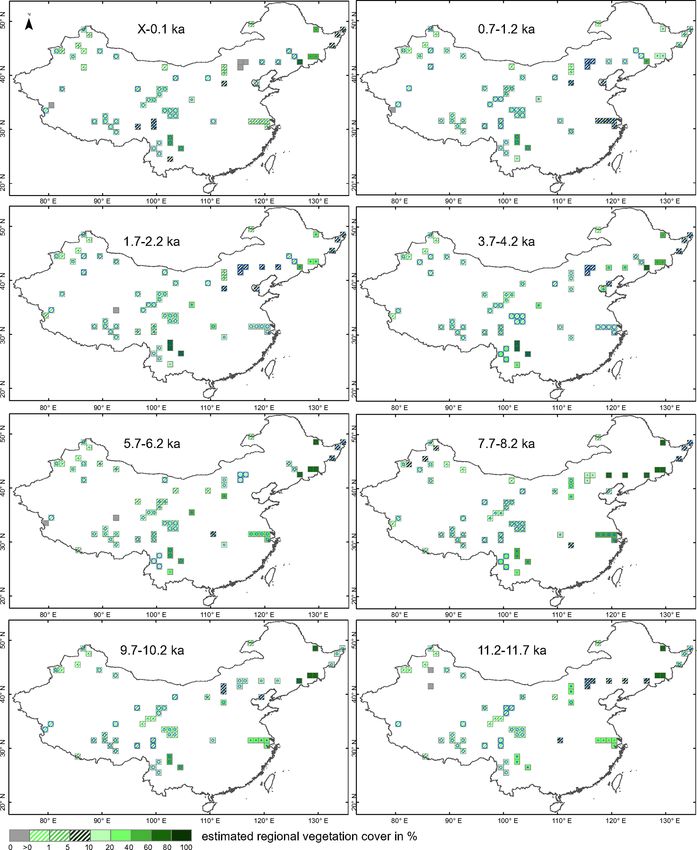
96           F. Li et al.: Gridded pollen-based Holocene regional plant cover in temperate and northern subtropical China

       REVEALS estimates of cover for the three land-cover types (CT, BT, and C3 H/OL). We then discuss the reli-
       ability and limitations of the Chinese dataset of Holocene gridded REVEALS plant cover, and its current and
       potential uses.
          The dataset is available at the National Tibetan Plateau Data Center (TPDC; Li, 2022;
       https://doi.org/10.11888/Paleoenv.tpdc.272292).

1    Introduction                                                      The only gridded pollen-based REVEALS reconstructions
                                                                    of plant cover created for the purpose of climate modelling
Vegetation has undergone changes all over the globe through-        published so far are those for NW-central Europe north of the
out the Holocene as a result of climate change from the             Alps (five time windows of the Holocene) (Trondman et al.,
early Holocene on and disturbance from anthropogenic ac-            2015) and for all of Europe through the Holocene (11.7 ka
tivities from the mid-Holocene on (e.g. Stephens et al., 2019;      to present) (Githumbi et al., 2022a). A comparison of Trond-
Li et al., 2020; Marquer et al., 2017). Pollen data map-            man et al.’s (2015) reconstruction with the ALCC scenarios
ping can provide insights into temporal and spatial vegeta-         from HYDE 3.1 (Klein Goldewijk et al., 2011) and KK10
tion changes at broad continental scales (Huntley and Birks,        (Kaplan et al., 2009) suggests that the KK10-simulated de-
1983; Huntley and Webb, 1988; Ren and Zhang, 1998; Ren              forestation is closer to the REVEALS estimates of open-land
and Beug, 2002). However, the quantification of past vegeta-        (OL) cover than the HYDE 3.1 deforestation (Kaplan et al.,
tion changes based on fossil pollen data is necessary to an-        2017). In a study using a regional climate model (Strand-
swer specific research questions on the relationship between        berg et al., 2014), it was found that the effect on mean sum-
plant cover and e.g. climate or biodiversity. Techniques such       mer and winter temperatures of anthropogenic deforestation
as biomization (Prentice and Webb, 1998) and the modern             equalling the KK10-simulated deforested land in Europe be-
analogue technique (MAT) (Overpeck et al., 1985) have been          tween 6 and 0.2 ka varied between ca. −1 and +1 ◦ C de-
widely applied to reconstruct past continental-scale changes        pending on the season and geographical location. This in-
in vegetation cover. These techniques have the disadvantage         dicates that LULC changes in the past did matter in terms
that they cannot quantify the cover of individual plant taxa.       of climate change, which was further confirmed in a recent
In this paper, we present the first pollen-based quantitative       palaeoclimate modelling study of the climate at 6 ka using
reconstruction of Holocene plant-cover changes in temper-           the latest pollen-based REVEALS reconstruction of plant
ate and northern subtropical China using the Regional Es-           cover in Europe (Githumbi et al., 2022a; Strandberg et al.,
timates of VEgetation Abundance from Large Sites (RE-               2022). Given that the gridded REVEALS reconstructions are
VEALS) model (Sugita, 2007a).                                       not continuous over space, i.e. only some of the grid cells
   The possible effects of anthropogenic land-cover (LC)            have pollen-based REVEALS estimates of plant cover, such
transformation due to past land-use (LU) changes (LULC              a dataset is comparable to a collection of point data in space.
changes) on the Holocene climate is still an issue of debate        This implies that the REVEALS data need to be interpolated
(Harrison et al., 2020). Current earth system models (ESMs)         over space to produce a true gridded dataset with values of
take care of the climate–land vegetation interactions by cou-       plant cover in all grid cells. Such interpolations were per-
pling a dynamic vegetation model (DVM) with the climate             formed using the European gridded REVEALS reconstruc-
model (e.g. Claussen et al., 2013; Lu et al., 2018; Wyser et        tions (e.g. Pirzamanbein et al., 2014; Githumbi et al., 2022b;
al., 2020). DVMs simulate climate-induced (natural) vegeta-         Strandberg et al., 2022) and were used for the first time in
tion. Therefore, past LULC changes have to be estimated to          climate modelling by Strandberg et al. (2022). Besides the
study their effect on past climate. The anthropogenic land-         gridded REVEALS reconstructions at the continental scale
cover change (ALCC) scenarios most commonly used by                 of Europe mentioned above, gridded REVEALS reconstruc-
palaeoclimate modellers are those from the HYDE database            tions along N-S and W-E transects throughout Europe be-
(Klein Goldewijk et al., 2017) and the KK10 dataset of past         tween 11.7 ka and the present were used to disentangle the ef-
deforestation (Kaplan et al., 2009). These scenarios are based      fects of climate and land-use change on Holocene vegetation
on a number of assumptions for population growth, per-              (Marquer et al., 2017). Moreover, gridded maps of pollen-
capita land use, and other parameters that influenced land use      based REVEALS estimates of open-land cover in the North-
over time in the past (e.g. Gaillard et al., 2010; Kaplan et al.,   ern Hemisphere (N of 40◦ ) were published for a couple of
2017). Therefore, a current priority is to produce datasets of      Holocene time windows (Dawson et al., 2018).
pollen- and archaeology-based data of past LU and LC that              Several reconstructions of the biomes (Ni et al., 2010,
can be used in palaeoclimate modelling or the evaluation of         2014) and vegetation cover (Tian et al., 2016) of China dur-
DVMs and ALCCs (PAGES LandCover6k; Gaillard et al.,                 ing the Holocene are available. However, these reconstruc-
2015; Morrison et al., 2016; Harrison et al., 2020).                tions do not provide quantitative information on the spatial

Earth Syst. Sci. Data, 15, 95–112, 2023                                               https://doi.org/10.5194/essd-15-95-2023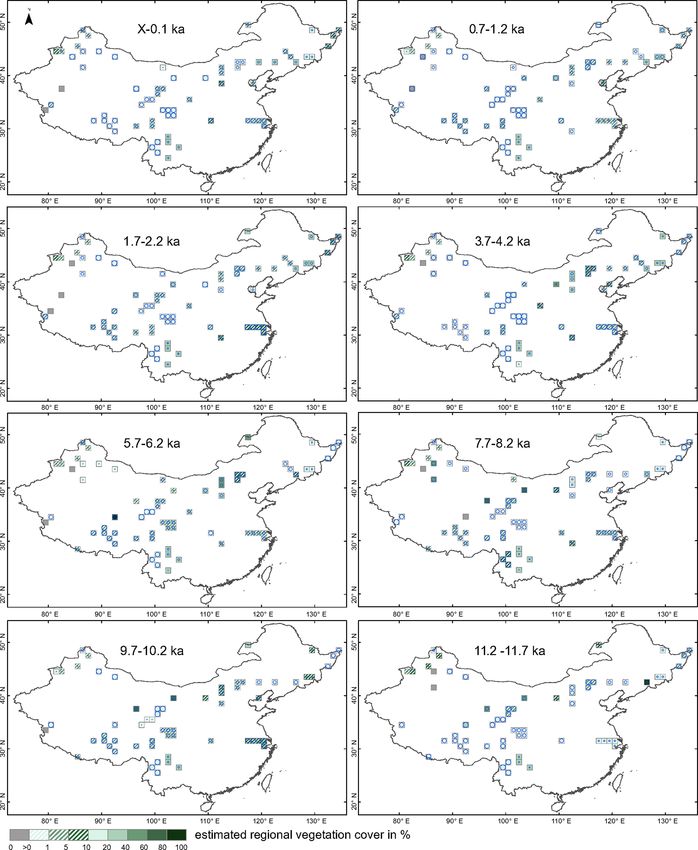
F. Li et al.: Gridded pollen-based Holocene regional plant cover in temperate and northern subtropical China                    97

extent of deforested land within woodland biomes or of veg-        2.1   Pollen data
etation types including both trees and herbs. Therefore, they
are of limited value for use in palaeoclimate modelling or         The pollen records selected for this study are from the pollen-
the evaluation of DVM-simulated vegetation cover or ALCC           data archive published by Cao et al. (2013) and from indi-
scenarios.                                                         vidual contributors. The pollen-data archive includes over
   The dataset of gridded pollen-based REVEALS estimates           230 pollen records for temperate and northern subtropical
of plant cover for temperate and northern subtropical China        China covering all or parts of the Holocene. However, only
presented in this paper is based on the REVEALS esti-              94 pollen records met the criteria required for a contribution
mates published in Li et al. (2020). It includes, for 25 con-      to PAGES LandCover6k (Trondman et al., 2015; Githumbi
secutive time windows of the Holocene, cover estimates             et al., 2022a): i.e. the pollen records are from lake sedi-
for 27 plant taxa that are further grouped into estimates          ments and/or peat deposits in small to large basins, pollen
of cover for 6 plant functional types (PFTs) and 3 land-           identification is of good quality, their chronology is based
cover types (LCTs), i.e. coniferous trees (CT), broadleaved        on ≥ 3 dates (14 C or other types of dates), and they have
trees (BT), and C3 herbs/open land (C3 H/OL). PFTs are             a temporal resolution of a minimum of two pollen counts
either single taxa (mainly genera, such as Pinus, Betula,          per 500 years. All chronologies were carefully examined. If
etc.) or groups of taxa. The REVEALS estimates for the             required, new age-depth models were established using the
27 plant taxa are the same as in Li et al. (2020), while           BACON software (Blaauw and Christen, 2011). Hereafter,
the grouping of taxa into PFTs and LCTs is different. The          all ages are given in ka (1000 years before present, BP, which
latter is explained in the Methods section below. Here,            is 1950 CE).
we briefly describe the methods used and their rationales,            The metadata table (Table S1 in the Supplement) includes,
present a selection of maps of the cover of CT, BT, and            for each pollen record/site, the vegetation zone, the num-
C3 H/OL for eight time windows of the Holocene, and dis-           ber of the site group (Gr; explained below), the site name
cuss the reliability and limitations of the dataset as well as     and its latitude, longitude, and elevation, the province, the
its current and potential uses. The entire dataset is available    site size (area and calculated radius) and type (lake or bog),
at https://doi.org/10.11888/Paleoenv.tpdc.272292 (Li, 2022).       the type of pollen data (original raw pollen counts or pollen
The major differences between Li et al. (2020) and this pa-        counts calculated using information from published pollen
per are the purpose, the visualization of the data, and the        diagrams), the dating method and number of dates, the time-
discussion of the dataset. While Li et al. (2020) visual-          span covered by the pollen record, the mean time resolution
ize the results over time for each reconstruction and focus        of the pollen counts, and the literature reference.
on Holocene changes in open land versus woodland cover
and their interpretation in terms of land-use and/or climate-      2.2   The REVEALS model and rationales for the
induced changes, the major purpose of the present paper is               model-application protocol
to make the data available to users, in particular climate and
vegetation modellers, and to explain their potential and limi-     A full description of the REVEALS model and its assump-
tations. Moreover, it visualizes the results spatially and only    tions is published in Sugita (2007a). The model was devel-
for a few selected times windows to essentially provide an         oped to estimate plant cover at a regional scale using pollen
illustration of the dataset that says more to the reader than an   data from large lakes. It is a modification of the R value
Excel file with numbers.                                           model (Davis, 1963) that corrects pollen percentage biases
                                                                   caused by inter-taxonomic differences in pollen productiv-
2   Data and methodology                                           ity and dispersion. Empirical tests in southern Sweden and
                                                                   northern America suggest that pollen records from lakes
The application of the REVEALS model follows the pro-              ≥ 50 ha in size provide reliable pollen-based REVEALS es-
tocol used for the REVEALS reconstructions performed in            timates of regional plant cover (Hellman et al., 2008a, b;
Europe (Mazier et al., 2012; Trondman et al., 2015) as             Sugita et al., 2010). The rationales behind the general pro-
closely as possible. This was done for the sake of consis-         tocol used for the gridded REVEALS reconstructions are
tency, to facilitate comparisons between regions and con-          presented in detail in Mazier et al. (2012) and Trondman
tinents, and to fulfil the criteria required for a contribu-       et al. (2015). The major rationales are those motivating the
tion to the Past Global Changes (PAGES) LandCover6k                use of a 1◦ × 1◦ spatial resolution (grid-cell size), a 500 year
working group (2015–2021; https://pastglobalchanges.org/           time resolution (except for the three most recent time win-
science/wg/former/landcover6k/intro, last access: 31 De-           dows), and all suitable pollen records from large and small
cember 2022). For the full protocol of the REVEALS recon-          sites. The choice of the spatial scale is based on a test per-
structions for China, see Li et al. (2020).                        formed in southern Sweden demonstrating that REVEALS
                                                                   estimates of modern plant cover using pollen assemblages
                                                                   from surface lake sediments were in good agreement with
                                                                   the actual plant cover within areas of 50 km × 50 km and

https://doi.org/10.5194/essd-15-95-2023                                                Earth Syst. Sci. Data, 15, 95–112, 2023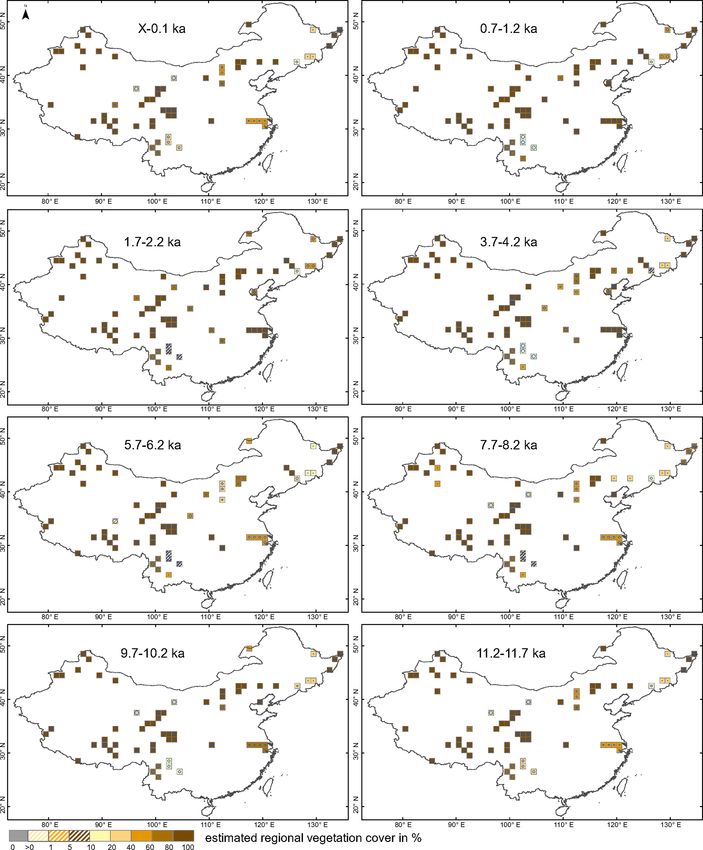
98            F. Li et al.: Gridded pollen-based Holocene regional plant cover in temperate and northern subtropical China

Figure 1. Study region and selected Holocene pollen records. The dashed pink diagonal line indicates the modern Asian summer monsoon
limit according to Chen et al. (2010). (a) Satellite image from PlanetObserver (© Google Earth image), showing the major mountains, rivers,
and geographical regions mentioned in the text. (b) Map of vegetation zones in China following Hou (2019) (from Li et al., 2020, modified).
The South China Sea Islands are shown according to China’s government regulations. The REVEALS reconstructions represent plant cover
in either a single grid cell or several grid cells. Grid cell reliability in terms of REVEALS estimates of plant cover is indicated by the fill
colour: white for reliable reconstruction and black for less reliable reconstruction (five grid cells, also emphasized by a thick dark circle).
Reconstructions based on two small sites (five white grid cells emphasized by a thick black circle) should also be considered with caution. For
detailed explanations of reliability, see the main text. Roman numbers refer to vegetation zones: (I) boreal forest, (II) coniferous-deciduous
mixed forest, (III) temperate deciduous forest, (IV) subtropical broadleaved evergreen and deciduous forest, (V) tropical monsoonal rainfor-
est, (VI) temperate steppe, (VII) temperate desert, (VIII) highland vegetation.

Earth Syst. Sci. Data, 15, 95–112, 2023                                                        https://doi.org/10.5194/essd-15-95-2023
F. Li et al.: Gridded pollen-based Holocene regional plant cover in temperate and northern subtropical China                   99

100 km × 100 km (Hellman et al., 2008b). In addition, this          five are based on one small site or bog site only and are la-
spatial scale is appropriate for palaeoclimate modelling with       belled as being less reliable (black grid cells in Fig. 1b).
either global or regional climate models (e.g. Strandberg et
al., 2014, 2022). The time resolution is motivated by the in-       2.3   Parameter settings, REVEALS runs, and the
fluence of the size of pollen counts on the size of the standard          calculation of cover for groups of plant taxa
errors (SEs) in REVEALS estimates. A time resolution of
500 years ensures that a maximum of the REVEALS recon-              The parameters needed to run the REVEALS model are
structions has a low SE and is still meaningful for the study       the relative pollen productivity (RPP) estimates and their
of past land-cover changes over several millennia. As pollen        standard deviations (SDs), the fall speed of pollen (FSP),
counts are generally available at a higher time resolution for      the maximum extent of regional vegetation (Zmax ; km), the
the last 1000 years, and because land-cover changes were            wind speed (m s−1 ), and atmospheric conditions (expressed
often more rapid during the recent millennium than in ear-          by four parameters, i.e. vertical and horizontal diffusion co-
lier millennia, the lengths of the three most recent time win-      efficients, a dimensionless turbulence parameter, and wind
dows were fixed to 350 (0.7–0.35 ka), 250 (0.35–0.1 ka), and        speed; see Jackson and Lyford, 1999, for details). We used
100 + x years (0.1 ka to present (1950 CE + x years, where x        the mean RPP estimates along with their related SDs and the
is the number of years between 1950 CE and the year of cor-         FSP of 27 plant taxa from the synthesis of available RPP es-
ing)). The relevance and suitability of using pollen records        timates and FSP in temperate China (Li et al., 2018b), a Zmax
from both large and small sites for REVEALS applications in         of 100 km, a wind speed of 3 m s−1 , and neutral atmospheric
order to increase the reliability of the pollen-based estimates     conditions. Note that, in contrast to Cao et al. (2019), Li et
of plant cover within each grid cell were confirmed by simu-        al. (2020) chose to use only RPP estimates obtained from
lation tests in Sugita (2007a) and empirical tests in southern      pollen-vegetation datasets collected in temperate China. This
Sweden (Trondman et al., 2016) (see Li et al., 2020, for more       implies that two important taxa in northwestern China are
details). In the absence of pollen records from large lakes, the    missing from the reconstruction, namely Abies and Picea.
larger the number of small sites (lakes or bogs), the better        Cao et al. (2019) used the RPP estimates of Abies and Picea
the REVEALS result. However, bogs (large and small) vio-            from Europe, assuming that differences in these species be-
late one of the assumptions of the REVEALS model, i.e. that         tween Europe and China would not significantly influence
no vegetation is growing on the deposition basin (Sugita,           their RPP. Given that this assumption has not been tested,
2007a). Violation of this assumption has been shown to bias         we decided to apply the principle used in Li et al. (2020) to
REVEALS results most significantly in the case of large             the dataset we are publishing here. The 27 taxa included in
bogs, while pollen records from multiple small bogs gener-          this REVEALS reconstruction account for > 50 % of the to-
ally provide reliable estimates of plant cover (Mazier et al.,      tal pollen from all pollen taxa in all records and for > 80 %
2012; Trondman et al., 2016).                                       of the total pollen from all pollen taxa in most records.
   Due to the low spatial density of the 94 selected pollen            Other parameters needed are the basin type (lake or bog)
records in this study, the pollen records were grouped for the      and its size (radius in m). We applied two models of pollen
application of the REVEALS model within coherent regions            dispersion and deposition: the Prentice model (Prentice,
with comparable biogeographical characteristics and similar         1985) for bogs and the Prentice–Sugita model (Sugita, 1993)
vegetation histories (see Li et al., 2020, for details). This im-   for lakes.
plies that, in these cases, the grid cells covered by a group of       Before running the REVEALS model, the pollen counts
pollen sites (between two and eight grid cells, Fig. 1) have        of each of the 27 plant taxa within each time window are
the same REVEALS estimates, i.e. the same mean vegeta-              summed in each pollen record. The REVEALS model is run
tion cover (Figs. 2–4). This is a deviation from the standard       separately with pollen records from bogs (using Prentice’s
protocol used in Europe, in which pollen records were never         model) and lakes (using the Prentice–Sugita model) for each
grouped within more than a single 1◦ × 1◦ grid cell. The rea-       group of pollen records. These model runs result in two dif-
son for grouping pollen records over more than one grid cell        ferent mean REVEALS estimates of cover (and their SEs)
(18 groups of grid cells, 57 of 75 grid cells in total) was to      for the 27 plant taxa – one from bog(s) and one from lake(s).
increase the reliability of the REVEALS estimates in areas          The standard deviations (SDs) of the RPP estimates are taken
with a sparse distribution of pollen records. The remaining         into account in the calculation of the REVEALS SEs, as
18 grid cells were isolated, i.e. no additional pollen record(s)    well as are the number of pollen grains counted in the sam-
were available in nearby grid cells, and the REVEALS ap-            ple (Sugita, 2007a). The final mean REVEALS estimates of
plication was performed for each grid cell separately. Eight        cover for the 27 plant taxa (from bog(s) + lake(s)) are then
of these grid cells include one or two large lakes and provide      calculated. The SEs of the final mean REVEALS estimates
reliable REVEALS reconstructions of plant cover. The other          for each group of pollen records are obtained using the delta
10 grid cells (emphasized by a thick black circle in Fig. 1b)       method (Stuart and Ord, 1994) and derived from the sum
include one or two small sites and therefore represent recon-       of the within- and between-site variations in the REVEALS
structions that need to be considered with caution, of which        results in the grid cell (see Li et al., 2020, for details).

https://doi.org/10.5194/essd-15-95-2023                                                Earth Syst. Sci. Data, 15, 95–112, 2023
100 F. Li et al.: Gridded pollen-based Holocene regional plant cover in temperate and northern subtropical China
The latest version of the REVEALS computer program, excel data files and Tables S1 and S2 are available at
LRA.REVEALS.v6.2.4.exe (Shinya Sugita, unpublished), https://doi.org/10.11888/Paleoenv.tpdc.272292 (Li, 2022).
and example files are available at the link https://1drv.ms/u/s!
AkY-0mVRwOaykdgmINfXVsC-4t4n5w?e=7U55hO (last 3 Results
access: 1 January 2023). It implements all the calculations
mentioned above. Below, as an illustration, we describe maps of REVEALS
We also calculated the mean REVEALS estimates of cover reconstructed cover for the three land-cover types CT, BT,
(and their SEs) for groups of taxa, i.e. plant functional types and C3 H/OL in eight selected time windows of the Holocene
(PFTs) and land-cover types (LCTs), for use in climate mod- that provide snapshots in time of significantly different land-
els and the evaluation of HYDE, KK10, and DVMs (see the cover type compositions between 11.7 ka and present. For
Introduction). To do this, the 27 plants were harmonized with each land-cover type, the maps are described from the oldest
six PFTs defined for China by Ni et al. (2010, 2014) and (11.7–11.2 ka) to the youngest (0.1 ka to present) map. The
with the three LCTs CT, BT, and C3 H/OL (Table 1). Note map of each time window is described in comparison to the
that Li et al. (2020) used slightly different PFTs, where Cu- map of the previous time window (e.g. the 9.7–10.2 ka map
pressaceae, Poaceae, Cyperaceae, and Rosaceae were treated is described in comparison to the 11.7–11.2 ka map). Land-
as separate PFTs to make it easier to interpret changes in cover changes (decreases or increases) are expressed in abso-
the amount of conifers and herbs in terms of regional ver- lute fractions, e.g. an increase by 20 % at 9.7–10.2 ka from a
sus local – and natural versus anthropogenic – vegetation. cover of 50 % of the grid cell at 11.7–11.2 ka implies that the
Moreover, Rubiaceae and Elaeagnaceae were classified as cover at 9.7–10.2 BP is 70 % of the grid cell. The descrip-
temperate shade-tolerant broadleaved evergreen trees, and tions start with information extracted from Li et al. (2020)
Castanea and Juglans were grouped with the herbs (open on the modern occurrence and Holocene history (in terms of
land) and anthropogenic indicators (including planted trees). pollen-based REVEALS cover) of the taxa constituent of the
In this paper, we use the PFT classification provided in Ta- land-cover type in question.
ble 1, in which Cupressaceae are grouped together with Pi-
nus as PFT TeNE (temperate shade-intolerant needle-leaved
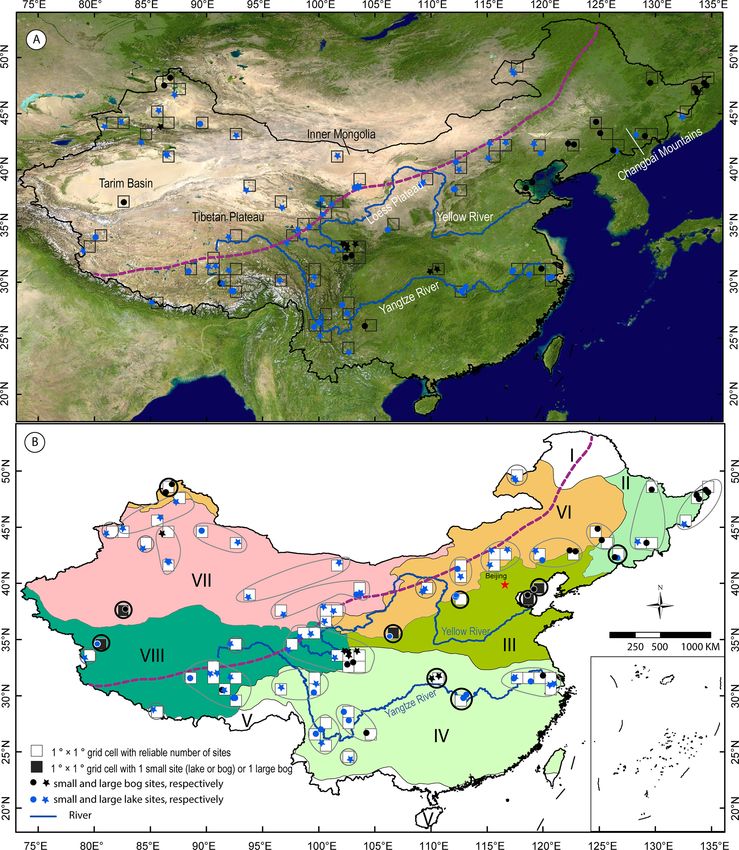
3.1 Open land (C3 H/OL; Fig. 2)
evergreen trees); Elaeagnaceae, Castanea, and Juglans are
grouped along with broadleaved trees as PFT TeBS (tem- OL is the sum of the reconstructed cover of 14 herb taxa
perate shade-tolerant broadleaved summer green trees); and for which RPP estimates are available. Poaceae, Cyper-
Cyperaceae, Poaceae, Rosaceae, and Rubiaceae along with aceae, Amaranthaceae/Chenopodiaceae, and Artemisia are
all herbs are grouped as PFT C3 H/OL (C3 herbs/open land). often represented by high pollen percentages during the
We propose that this classification is more appropriate for Holocene. Other herbs that can be relatively well repre-
use in climate modelling contexts than that used in Li et sented during most of the Holocene are Asteraceae, Bras-
al. (2020), in which the major aim of the study was to in- sicaceae, Ranunculaceae, Rosaceae, and Rubiaceae. Pollen
terpret the pollen-based plant-cover reconstruction in terms from Convolvulaceae, Fabaceae, Lamiaceae, and Liliaceae
of open-land versus woodland cover. can be quite common over some periods of the Holocene,
For more details on the parameter settings, REVEALS while Cannabis/Humulus is not common. Today, these herbs
runs, models of pollen dispersion and deposition, and the primarily characterize open vegetation, i.e. temperate xero-
delta method, the reader is referred to Li et al. (2020). phytic shrubland and grassland, desert, and tundra, as well
as human-induced vegetation (cultivated and grazing land).
The REVEALS reconstructions suggest that the cover of
2.4 Data format Poaceae, Cyperaceae, and Rosaceae during the Holocene is
often equal to or larger than the cover of all remaining 11
The dataset of pollen-based REVEALS estimates of herbs together, although the cover provided by Artemisia and
Holocene plant cover for temperate and northern subtropi- Amaranthaceae/Chenopodiaceae can also be relatively large
cal China comprises four csv files with the REVEALS pro- (Li et al., 2020).
portions of plant cover (and related SEs) in 75 1◦ × 1◦ grid The time window 11.7–11.2 ka is characterized by OL
cells and 25 time windows for 27 taxa (Data1.plants.csv), cover values of > 80 % in most of northwestern China and
6 PFTs classified as in Table 1 (Data2.6PFTs.csv), 3 land- the Tibetan Plateau. OL values of 40 %–60 % or 60 %–80 %
cover types (Data3.LCTs.csv), and 10 PFTs classified as are found in parts of southwestern China and Inner Mongo-
in Li et al. (2020) (Data4.10PFTs.csv). Two additional lia. OL values of 40 %–60 % also occur in the lower reach
files complement the REVEALS dataset: a metadata file of the Yangtze River region, and values of 20 %–40 % or
(Table S1; see Sect. 2.1 on pollen data for details) and 10 %–20 % in northeastern China. The time window 10.2–
a table providing details on the number and types of 9.7 ka shows an increase in OL cover of 10 % in northeastern
sites used in the REVEALS reconstruction for each grid China and an increase to 60 %–80 % or > 80 % in part of
cell and each time window (Table S2). The REVEALS Inner Mongolia and the lower reaches of the Yangtze River
Earth Syst. Sci. Data, 15, 95–112, 2023 https://doi.org/10.5194/essd-15-95-2023F. Li et al.: Gridded pollen-based Holocene regional plant cover in temperate and northern subtropical China 101 Figure 2. Grid-based REVEALS estimates of C3 herbs/open land (C3 H/OL) cover for eight selected time windows of the Holocene. Per- centage cover in intervals of 1 % (> 0 %–1 %), 4 % (> 1 %–5 %), 5 % (> 5 %–10 %), 10 % (> 10 %–20 %), and 20 % (> 20 %–100 %) is represented by increasingly dark colours from > 0 %–1 % to > 5 %–10 % and from > 10 %–20 % to 80 %–100 %. Grid cells without pollen data for the time window but with pollen data in other time windows are shown in grey. Uncertainties in the REVEALS estimates are il- lustrated by blue circles of various sizes corresponding to the coefficient of variation (the standard error (SE) divided by the grid cell mean REVEALS estimate (RE)). If SE ≥ RE, the blue circle fills the entire grid cell. SE ≥ RE also implies that RE is not different from zero, which is the case primarily for low RE values. https://doi.org/10.5194/essd-15-95-2023 Earth Syst. Sci. Data, 15, 95–112, 2023
102            F. Li et al.: Gridded pollen-based Holocene regional plant cover in temperate and northern subtropical China

Table 1. Aggregation of pollen morphological types into land-cover types (LCTs) and plant functional types (PFTs) (following Ni et al.,
2010, 2014). The fall speed of pollen (FSP) is shown along with the mean relative pollen productivity (RPP) and its standard deviation (SD)
in brackets (dataset Alt2 of Li et al., 2018b). The number of values available in the calculation of the mean RPP and the locations of the
RPP studies in terms of vegetation zones are also provided. Roman numbers refer to the vegetation zones: (I) boreal forest, (II) coniferous-
deciduous mixed forest, (III) temperate deciduous forest, (IV) subtropical broadleaved evergreen and deciduous forest, (V) tropical mon-
soonal rainforest, (VI) temperate steppe, (VII) temperate desert, (VIII) highland vegetation. Abbreviations: Amaranth.: Amaranthaceae;
Chenop.: Chenopodiaceae.

  Land cover type     PFT    PFT definition                Plant taxa/pollen          FSP             RPP             Number     Locations of RPP studies
                                                           morphological types     (m s−1 )           (SD)    of RPP estimates   (vegetation zones)
  Coniferous trees    TeNE   Temperate shade-intolerant    Pinus                       0.035   18.37 (0.48)                 4    II, III,
                             needle-leaved evergreen
                             trees                         Cupressaceae                0.010    1.11 (0.09)                 1    III
                      BNS    Boreal needle-leaved sum-     Larix                       0.126    2.14 (0.24)                 3    II, III
                             mer green trees
  Broadleaved trees   IBS    Boreal shade-intolerant       Betula                      0.014   12.42 (0.12)                 3    II, III
                             broadleaved summer green
                             trees
                      TeBS   Temperate shade-tolerant      Castanea                    0.004   11.49 (0.49)                 1    III
                             broadleaved summer green      Elaeagnaceae                0.012    8.88 (1.30)                 1    III
                             trees                         Fraxinus                    0.017    3.94 (0.73)                 1    II
                                                           Juglans                     0.031    7.69 (0.24)                 1    III
                                                           Quercus                     0.019    5.19 (0.07)                 3    II, III
                                                           Tilia                       0.028    0.65 (0.11)                 1    II
                                                           Ulmus                       0.021    4.13 (0.92)                 2    II, III
                      TeBE   Temperate shade-tolerant      Castanopsis                 0.004   11.49 (0.49)                 1    III
                             broadleaved evergreen trees   Cyclobalanopsis             0.019    5.19 (0.07)                 3    II, III
  Open land           C3 H   C3 herbs                      Amaranth./Chenop.           0.013    4.46 (0.68)                 2    VI, VIII
                                                           Artemisia                   0.010   21.15 (0.56)                 4    II, VI
                                                           Asteraceae                  0.019     4.4 (0.29)                 2    VI
                                                           Brassicaceae                0.012    0.89 (0.18)                 1    III
                                                           Cannabis/Humulus            0.010   16.43 (1.00)                 1    III
                                                           Convolvulaceae              0.043    0.18 (0.03)                 1    VI
                                                           Cyperaceae                  0.022    0.44 (0.04)                 2    III, VIII
                                                           Fabaceae                    0.017    0.49 (0.05)                 2    III, VI,
                                                           Lamiaceae                   0.015    1.24 (0.19)                 2    VI
                                                           Liliaceae                   0.013    1.49 (0.11)                 1    VI
                                                           Poaceae                     0.021          1 (0)                 6    II, III, V, VI, VIII
                                                           Ranunculaceae               0.007    7.77 (1.56)                 1    II
                                                           Rosaceae                    0.009    0.22 (0.09)                 1    VI
                                                           Rubiaceae                   0.010    1.23 (0.36)                 1    III

basin, while a decrease by 20 % is seen in part of southwest-                    1.7 ka, OL cover increases in almost all regions, except for a
ern China. At 8.2–7.7 ka, the OL cover declines in most of                       decrease by 20 % in southwestern China. The increase in OL
the reconstructions, most drastically in parts of the Loess                      cover is 40 % in Inner Mongolia and Shanxi and 20 % in part
Plateau, central Inner Mongolia, and the lower reaches of the                    of the Changbai Mountain region. Over the last ca. 100 years
Yangtze River region, where OL decreases by 20 %–40 %,                           (0.1 ka to present), there has been no major change in OL
whilst a decrease by 10 %–20 % is seen in parts of north-                        cover except an increase by 10 % in southwestern China and
western China. At 6.2–5.7 ka, OL shows a further decrease                        a decrease by 20 % in part of northeastern China.
by 20 % in Inner Mongolia, northeastern China, and south-
western China, and a decrease by 60 % on the central Tibetan
                                                                                 3.2     Coniferous trees (CT; Fig. 3)
Plateau. In contrast, an increase by 40 % is observed in part
of northwestern China. At 4.2–3.7 ka, OL cover is > 80 % in                      CT is the sum of the reconstructed cover of three conifer
most of the regions of northwestern China. An increase by                        taxa for which RPP estimates are available, Pinus and Cu-
50 % is observed in the lower reaches of the Yangtze River                       pressaceae (PFT TeNe) and Larix (PFT BNS) (Table 1). We
region and Inner Mongolia, by 20 % in part of the Loess                          chose to use only RPP values estimated in China (RPP syn-
Plateau and southwestern China, and by 10 %–20 % in part                         thesis of Li et al., 2018b) and, therefore, did not produce
of northeastern China. In contrast, a decrease of OL cover                       REVEALS estimates of the cover of Abies and Picea (Li
by 10 %–30 % is seen in part of northeastern China. At 2.2–                      et al., 2020). Today, these two taxa are common together

Earth Syst. Sci. Data, 15, 95–112, 2023                                                                 https://doi.org/10.5194/essd-15-95-2023
F. Li et al.: Gridded pollen-based Holocene regional plant cover in temperate and northern subtropical China 103 with Pinus and Larix in the boreal forests and coniferous- 1.2–0.7 ka, the CT cover decreases with 2 % on the Tibetan broadleaved mixed woodlands (zones I and II, respectively). Plateau, in northwestern China, and the lower reaches of the Abies and Picea also form woodland patches in the western- Yangtze River. An increase in CT cover with ca. 10 % during most part of the subtropical broadleaved evergreen and de- the last century (0.1 ka to present) is found in southwestern, ciduous forest (zone IV), and Abies and Pinus characterize eastern, and most of northeastern China, while a decrease is the woodlands of the southwestern part of zone IV. Of the seen in some parts of northeastern China. three conifer taxa for which REVEALS reconstructions are available, Pinus is the one with significant cover over most 3.3 Broadleaved trees (BT; Fig. 4) of the Holocene in all regions now characterized by conifer- ous woodland (or woodland patches) in central and eastern- BT is the sum of the reconstructed cover of 10 broadleaved northeastern China (Li et al., 2020). Pinus presents relatively tree taxa for which RPP estimates are available: Betula (PFT large cover throughout the Holocene in the southwestern part IBS), Castanea, Eleagnaceae, Fraxinus, Juglans, Quercus, of zone IV, the western part of zone VI, and the central part Tilia, and Ulmus (PFT TeBS), and Castanopsis and Cyclob- of zone II, while it presents lower cover in the eastern part of alanopsis (PFT TeBE) (Table 1). Betula presents signifi- zone IV. Pinus provides some cover from 7 ka in the eastern cant cover throughout the Holocene in zone II and most of part of zone VI and relatively high cover from 4.5 ka in the zone IV (Li et al., 2020). The summer green broadleaved tree southeastern part of zone II and the eastern part of zone III. taxa (TeBS) are characteristic of zones II, III, and IV, where Significant cover of Cupressaceae was reconstructed for the they have relatively large cover throughout the Holocene, and early Holocene from some pollen records in the western part of the southern border of vegetation zone VI, in particular of zone IV and the easternmost part of zone VII (temper- through the mid-Holocene. The evergreen broadleaved tree ate desert), and for most of the Holocene in the western and taxa Castanopsis and Cyclobalanopsis are characteristic of northernmost parts of zone VI (temperate steppe) (Li et al., vegetation zone IV and have relatively large cover in most of 2020). Larix is represented in zones II and VI (central and the zone (Li et al., 2020). northernmost parts) by continuous high cover throughout the The changes in cover of BT during the Holocene show Holocene or the late Holocene only or by scattered occur- similar trends to those for CT: a steady increase during the rences of high cover over time (Li et al., 2020). first half of the Holocene, with the highest values found in There is a consistent increase in CT cover in most the time windows from 8.2–7.7 to 5.2–4.7 ka (depending on grid cells over northern China during the first half of the the region), followed by a steady decrease through the late Holocene, with maximum values occurring sometime be- Holocene. The oldest time window (11.7–11.2 ka) is charac- tween 8 and 5 ka (the timing depends on the region), before terized by the largest BT cover of the Holocene (> 80 %) in a steady decline in the values of CT cover. The time win- northeastern China, and the second largest BT cover (20 %– dow 11.7–11.2 ka is characterized by CT cover values of over 40 %) in parts of Inner Mongolia and the lower reaches of 80 % in part of northeastern China, 10 %–20 % or 20 %–40 % the Yangtze River region. In contrast, the BT cover is < 2 % in southwestern China, and 10 %–20 % in the eastern part of in northwestern China and on the Tibetan Plateau. At 10.2– northwestern China and in the lower reaches of the Yangtze 9.7 ka, the BT cover increases by ca. 10 % in part of north- River region. Elsewhere, CT cover is lower than 10 %. At eastern China, while it decreases by 10 % in part of Inner 10.2–9.7 ka, the CT cover values decrease in almost all re- Mongolia. An increase in BT cover by 10 % or 20 % in the gions, with a declines by 10 % in the lower reaches of the time window 8.2–7.7 ka is seen in part of northeastern China Yangtze River and 10 %–20 % or 20 %–40 % in part of north- and the lower reaches of the Yangtze River, while there is western China. CT cover is slightly higher in the 8.2–7.7 ka a decrease by 5 % in northeastern China. At 6.2–5.7 ka, BT time window in most of northeastern China (10 %–20 %), cover decreases by 20 % in parts of central Inner Mongolia while a small drop is seen in the western part of southwest- and southwestern China. Further decreases in cover by 20 %– ern China and the eastern part of northwestern China. The 30 % in the lower reaches of the Yangtze River and north- time window 6.2–5.7 ka is characterized by a decrease in CT eastern China and by 10 % in Inner Mongolia occur during cover by 10 %–20 % in northeastern China and by 40 % or 4.2–3.7 ka. BT cover further decreases at 2.2–1.7 ka by 10 % 60 % in part of northwestern China. In contrast, CT cover in the western and central parts of northeastern China, and at increases by 20 %–40 % and ca. 5 % in Inner Mongolia and 1.2–0.7 ka by < 10 %, 10 %, or 20 % in northeastern China southwestern China, respectively. From 4.2–3.7 ka, CT cover and the lower reaches of the Yangtze River. In the last cen- exhibits a further decrease by a maximum of 20 % in most of tury (0.1 ka to present), BT cover has increased by 30 % and Inner Mongolia and southwestern China. The CT cover at 20 % in the eastern part of northeastern China and in south- 2.2–1.7 ka is even lower, with declines by 10 % and > 10 %– western China, respectively. In contrast, the western part of 20 % occurring in the eastern part of northwestern China and northeastern China is characterized by a strong decrease in the western part of northeastern China, respectively. There is, BT cover. however, a slight increase in CT cover by 2 % in northwest- ern China and the lower reaches of the Yangtze River. At https://doi.org/10.5194/essd-15-95-2023 Earth Syst. Sci. Data, 15, 95–112, 2023
104           F. Li et al.: Gridded pollen-based Holocene regional plant cover in temperate and northern subtropical China

Figure 3. Grid-based REVEALS estimates of coniferous tree (CT) cover for eight selected time windows of the Holocene. Percentage cover
in intervals of 1 % (> 0 %–1 %), 4 % (> 1 %–5 %), 5 % (> 5 %–10 %), 10 % (> 10 %–20 %), and 20 % (> 20 %–100 %) is represented by
increasingly dark colours from > 0 %–1 % to > 5 %–10 % and from > 10 %–20 % to 80 %–100 %. Grid cells without pollen data for the
time window but with pollen data in other time windows are shown in grey. Uncertainties in the REVEALS estimates are illustrated by
blue circles of various sizes corresponding to the coefficient of variation (the standard error (SE) divided by the grid cell mean REVEALS
estimate (RE)). If SE ≥ RE, the blue circle fills the entire grid cell. SE ≥ RE also implies that RE is not different from zero, which is the case
primarily for low RE values.

Earth Syst. Sci. Data, 15, 95–112, 2023                                                          https://doi.org/10.5194/essd-15-95-2023
F. Li et al.: Gridded pollen-based Holocene regional plant cover in temperate and northern subtropical China                                 105

Figure 4. Grid-based REVEALS estimates of broadleaved tree (BT) cover for eight selected time windows of the Holocene. Percentage
cover in intervals of 1 % (> 0 %–1 %), 4 % (> 1 %–5 %), 5 % (> 5 %–10 %), 10 % (> 10 %–20 %), and 20 % (> 20 %–100 %) is represented
by increasingly dark colours from > 0 %–1 % to > 5 %–10 % and from > 10 %–20 % to 80 %–100 %. Grid cells without pollen data for
the time window but with pollen data in other time windows are shown in grey. Uncertainties in the REVEALS estimates are illustrated by
blue circles of various sizes corresponding to the coefficient of variation (the standard error (SE) divided by the grid cell mean REVEALS
estimate (RE)). If SE ≥ RE, the blue circle fills the entire grid cell. SE ≥ RE also implies that RE is not different from zero, which is the case
primarily for low RE values.

https://doi.org/10.5194/essd-15-95-2023                                                          Earth Syst. Sci. Data, 15, 95–112, 2023
106           F. Li et al.: Gridded pollen-based Holocene regional plant cover in temperate and northern subtropical China

4     Reliability and limitations of the dataset                    differ very significantly from each other. A measure of vari-
                                                                    ability among RPP values is provided by the SD of the mean
4.1    Accuracy and reliability of the REVEALS estimates            RPP, which is in turn imbedded in the REVEALS estimate’s
       of plant cover                                               SE of a plant taxon’s cover. However, none of the SDs are
                                                                    very large in relation to the mean RPP values we are using
For a detailed description of the accuracy and reliability of       (Table 1). The SD is larger than a tenth of the mean RPP
the REVEALS reconstructions, the reader is referred to Li           value for 10 of the 27 taxa used (i.e. Elaeagnaceae, Fraxi-
et al. (2020). The quality of the REVEALS reconstructions           nus, Tilia, Ulmus, Amaranthaceae/Chenopodiaceae, Brassi-
is mainly reliant on the input data (pollen count quality and       caceae, Convolvulaceae, and Ranunculaceae; Table 1); how-
size), reliability of the chronologies of pollen records and        ever, the SD is less than a fifth of the mean RPP value ex-
the relative pollen productivities used, type and size of the       cept for Fraxinus, Ulmus, Brassicaceae, and Ranunculaceae
pollen sites (lakes or bogs), number of pollen records used         (the SD is ca. a fifth of the mean RPP), Rosaceae (the SD
for reconstruction in each grid cell, and variation between         is ca. a third of the mean RPP) and Rubiaceae (the SD is
pollen counts within a grid cell. The standard errors (SEs)         ca. a quarter of the mean RPP). There is no way to mea-
of the REVEALS estimates are a measure of their accuracy            sure the uncertainty that may be caused by the use of a mean
and reliability. If SE < mean REVEALS estimate of cover,            RPP value based on too few RPP values, or RPP values that
the result is considered to be reliable, which is the case for      are not representative of all major vegetation zones of the
over 85 % of the reconstructions. If SE ≥ mean REVEALS              study region. The number of values available in the calcu-
estimate of cover, the result is not different from zero and is,    lation of the mean RPP estimates and the locations of the
therefore, not reliable. The latter occurs mainly in the lower      RPP studies in terms of vegetation zones are provided in Ta-
reaches of the Yangtze River region.                                ble 1. This information can be a means to identify RPP esti-
   Other issues may influence the reliability of the RE-            mates that might be uncertain for REVEALS land-cover re-
VEALS estimates of plant cover. REVEALS was intended                constructions in general or for certain regions in particular.
for pollen records from large lakes (Sugita, 2007a). Pollen         At the time of the analysis, there was only one RPP value for
records from bogs violate the model’s assumption that no            14 of the 27 taxa in this study, i.e. Cupressaceae, Castanea,
plants are growing on the surface of the deposition basin.          Elaeagnaceae, Fraxinus, Juglans, Tilia, Castanopsis, Brassi-
Therefore, the local cover of major plant taxa such as              caceae, Cannabis/Humulus, Convolvulaceae, Liliaceae, Ra-
Poaceae and Cyperaceae may bias pollen-based REVEALS                nunculaceae, Rosaceae, and Rubiaceae. Therefore, the RE-
estimates from bogs, in particular if the bog is large. This        VEALS estimates for these taxa should be considered with
problem is discussed in detail in Li et al. (2020), where           caution. The REVEALS estimates for Castanopsis and Cy-
the cover of open land was considered to be overestimated           clobalanopsis are also uncertain because, in the absence of
in some grid cells due to this phenomenon, in particular in         RPP estimates for these two taxa, we instead used the RPP
northeastern China. This issue and the theoretically inade-         estimates of Castanea and Quercus, respectively, assuming
quate application of REVEALS using a single pollen record           comparable pollen productivities for these taxa (see Li et al.,
from a small site (lake or bog) or a large bog in a grid cell are   2020, for further details on this issue).
indicated as providing less reliable or unreliable REVEALS
reconstructions of plant cover in Fig. 1 (black grid cells).
Moreover, the number of sites and their type (lake or bog)          4.2   Limitations of the pollen-based REVEALS plant
and size (large or small) are provided for each site group                cover
(grid cell) and time window in Table S2. The uncertainty in
the RPP estimates used is another factor influencing the re-        The REVEALS model estimates the proportion of each plant
liability of the REVEALS reconstructions. We use the mean           taxon in relation to the total cover of all taxa with the RPP es-
RPP estimates from the Chinese synthesis published in Li            timates available (in this case, 27 taxa) rather than its actual
et al. (2018b). The assumptions are that the RPP estimates          cover if all existing taxa could be considered. The same con-
are constant through time and that the mean RPP estimates           sideration is valid for the REVEALS cover of the three ma-
are a good approximation for the plant taxa over the entire         jor land-cover types C3 H/OL, CT, and BT. This is a serious
study region. Although we do not know whether the RPP               caveat if the pollen taxa for which no RPP values are avail-
estimates were constant through the Holocene for the plant          able represent a significant part of the pollen assemblages. In
taxa used in the reconstructions, this assumption is neces-         this first dataset of REVEALS land-cover estimates, our deci-
sary if we are to reconstruct changes in the abundance or           sion to use exclusively Chinese RPP estimates and, therefore,
absolute cover of plants from changes in pollen percentages         not to reconstruct the cover of Abies and Picea is a major is-
over time (e.g. Birks and Birks, 1980; Sugita, 2007a). Mean         sue. This may bias the results by overestimating the cover of
RPP estimates are most reliable for large regions if they are       C3 H/OL in particular, but also that of BT. The latter needs to
based on a large number of RPP values that are well dis-            be kept in mind in the interpretation and use of the dataset for
tributed within the study region, and if these values do not        regions where Abies and Picea were common during part of

Earth Syst. Sci. Data, 15, 95–112, 2023                                                https://doi.org/10.5194/essd-15-95-2023
F. Li et al.: Gridded pollen-based Holocene regional plant cover in temperate and northern subtropical China 107
or the entire Holocene, which was the case mainly in vegeta- The time resolution of the REVEALS reconstructions
tion zones II and IV (see the results for CT for more details). (500 years over most of the Holocene) is another limitation in
Another important caveat of all REVEALS reconstruc- terms of the quantification of land-cover change. A relatively
tions is that the cover of bare ground in a landscape can- low time resolution implies that major but rapid land-cover
not be inferred by the model. However, bare ground was changes will be missed or underestimated, as they will be
(and still is) a significant portion of the land cover in regions agglomerated into a mean cover over 500 years. The cho-
characterized by desert, steppe, and high-altitude vegetation sen time resolution is a compromise to improve the qual-
(zones VI, VII, and VIII in this study). So far, there has only ity of the REVEALS estimates by increasing pollen sums
been one attempt at estimating bare ground in the past (Sun for pollen records characterized by a low time resolution of
et al., 2022). It used the modern relationship between tree pollen counts (i.e. decreasing the standard error of the re-
pollen and the cover of bare ground in northern-central China construction; see the Methods section for more details). In-
and the modern analogue technique (MAT) to estimate the creasing the time resolution would be an advantage only for
past cover of bare ground using fossil pollen records from regions and periods of the Holocene for which most of the
the same region. The MAT-estimated cover of bare ground is pollen records have a high time resolution.
then used to correct REVEALS-estimated plant cover from Finally, half of the 36 REVEALS reconstructions are
the same fossil pollen records. The results suggest that bare based on pollen records located within several adjacent
ground covered 40 % to 60 % of the land, and that the uncor- 1◦ × 1◦ grid cells (a total of 57 1◦ × 1◦ grid cells divided into
rected REVEALS reconstructions overestimate the cover of 18 groups of 2 to 5 grid cells; Fig. 1) rather than within single
trees by ca. 50 %, which can have implications if the pollen- 1◦ × 1◦ grid cells (the other half of the reconstructions). This
based REVEALS land cover is used in palaeoclimate model implies that these REVEALS estimates of cover represent a
experiments. In the context of palaeoclimate modelling, the mean cover for areas of 1◦ × 2◦ to 1◦ × 5◦ . The latter can be
interpretation of the open-land fraction (with or without bare a limitation if the dataset of past land cover is used for stud-
ground) in terms of deforestation (a human-induced decrease ies in which the variability of plant cover at a 1◦ × 1◦ spatial
in tree cover) remains problematic due to the possible occur- scale is of importance. We opted for this deviation from the
rence of herb taxa in natural, climate-induced, and human- standard protocol (Trondman et al., 2015; Githumbi et al.,
induced vegetation types, i.e. the reconstructed open-land 2022a) because of the low spatial density of pollen records
cover can be either natural or human-induced or both. This in many parts of China and its negative consequence for the
issue is discussed thoroughly in Li et al. (2020), as is the quality of the REVEALS reconstructions (see the Methods
difficulty of inferring the occurrence of past crops such as section for more details).
rice and millet from pollen records. Although pollen of ce-
reals such as Triticum (wheat), Hordeum (barley), and Zea
mays (corn) can be separated from pollen of wild grasses, 5 Potential applications of the REVEALS estimates
a RPP value for these types of cereals could not be esti-
mated in the study of Li et al. (2018b). Moreover, pollen The quantitative reconstruction of land cover at regional
grains from several crops belonging to the families Fabaceae, to global scales is necessary for the study of climate–land
Brassicaceae, Asteraceae, and Apiaceae cannot be separated cover interactions using both regional and global climate
from the wild species (Ni et al., 2014). The interpretation of models, and for the evaluation of ALCC scenarios and dy-
past changes in open-land cover needs to take into account namic vegetation models. This first dataset of REVEALS
the issues described above. This is a limitation of the grid- land cover for temperate and northern subtropical China
ded REVEALS land-cover dataset if used for the validation is a contribution to PAGES LandCover6k, the purpose of
of ALCC scenarios and in studies of human-induced land- which is to provide datasets of Holocene pollen-based land
cover change as a climate forcing. An overestimation of de- cover and archaeology-based land use that are useful for
forestation in ALCCs can be detected in a comparison with (palaeo)climate modelling (Gaillard et al., 2018; Harrison et
REVEALS estimates of past open land, whereas an under- al., 2020). Such datasets are an alternative to pollen-based
estimation cannot be demonstrated (Harrison et al., 2020). reconstructions of vegetation cover using biomization (Pren-
This issue is particularly problematic in regions of northern tice and Webb, 1998) or the modern analogue technique
China where steppes, desert, and meadows were dominant (Overpeck et al., 1985). REVEALS reconstructions have
over most of the Holocene. Similar limitations exist for the the advantage of providing estimates of cover for individ-
gridded REVEALS land-cover datasets in Europe, although ual plant taxa that can be aggregated into cover of groups
they are less serious, as early agriculture developed primar- of taxa such as PFTs or land-cover units. They can be used
ily on land where woodland was the natural climate-induced for various purposes, such as the evaluation of scenarios of
vegetation cover and only a small fraction of the continent past deforestation (HYDE and KK) (Kaplan et al., 2017) or
was characterized by steppe vegetation (Trondman et al., for comparison with simulations of past vegetation cover us-
2015; Githumbi et al., 2022a; Strandberg et al., 2022). ing dynamic vegetation models (Marquer et al., 2014, 2017).
When used in climate modelling experiments that look into
https://doi.org/10.5194/essd-15-95-2023 Earth Syst. Sci. Data, 15, 95–112, 2023108 F. Li et al.: Gridded pollen-based Holocene regional plant cover in temperate and northern subtropical China
e.g. past human-induced land cover (or land use) as a cli- ation of model-simulated vegetation cover and deforestation
mate forcing, the REVEALS plant-cover data need to be in- from dynamic vegetation models and ALCC scenarios, re-
terpolated over all grid cells of the simulated geographical spectively, as well as studies of past land-use change as a
domain using, for instance, spatial statistics (e.g. Strandberg climate forcing during the Holocene. In all uses of the pre-
et al., 2022; see also the Introduction). Such studies have not sented gridded REVEALS land-cover dataset, the limitations
been performed in China so far, although a comparison of the of the REVEALS reconstructions have to be taken into ac-
REVEALS reconstructions of open-land, CT, and BT cover count carefully (see the Discussion section for more details).
presented here with HYDE 3.2 and KK10 is in progress. Fur- Reconstructions of plant cover at a local spatial scale can be
ther, studies attempting to disentangle the effects of climate of value in archaeological contexts. One of the input data re-
and land-use change on plant cover through the Holocene quired for the application of the LOcal Vegetation Estimates
or looking into changes in diversity indices based on RE- model (LOVE; Sugita, 2007b) to estimate local plant cover
VEALS estimates of past plant cover (e.g. studies by Mar- is the regional plant cover. The dataset of gridded REVEALS
quer et al., 2014, 2017, in Europe) would also be of great in- reconstructions may be a way to achieve reconstructions of
terest in a Chinese context. Another possible use of Holocene local plant cover with the condition that the pollen records
REVEALS-estimated plant cover is the comparison of re- used for the LOVE application are not used in the REVEALS
gional plant-cover change with archaeological data to study reconstructions of the dataset (Cui et al., 2013; Mazier et al.,
the effect of large-scale changes in population growth and 2015).
settlement patterns and density on vegetation cover in the This dataset is the first generation of gridded REVEALS
past. A first attempt at such a comparison in eastern China Holocene land-cover reconstructions for China. We expect
has shown that phases of deforestation as interpreted from that, in the future, new generations of such datasets will de-
the REVEALS estimates of open-land cover between 6 and velop, in which the quality and spatial extent of the RE-
3 ka are well correlated with changes in settlement densities VEALS estimates will be further improved as more pollen
over the same time period, as suggested by archaeological records become available, and additional RPP studies will
data and population growth based on 14 C dates of archaeo- gradually increase both the number of RPP values per taxon
logical artefacts (Li et al., 2018a). and the number of taxa for which RPP estimates are avail-
able.
6 Data availability
Supplement. The supplement related to this article is available
All data files are available for public download at online at: https://doi.org/10.5194/essd-15-95-2023-supplement.
the National Tibetan Plateau Data Center (TPDC;
https://doi.org/10.11888/Paleoenv.tpdc.272292; Li, 2022).
For more details on the files available at the link, see Author contributions. FL and MJG conceptualized and coordi-
Sect. 2.4 on the data format. nated the study as a contribution to the PAGES working group
“LandCover6k”. SS solved all specific issues related to the appli-
cation of REVEALS in the context of China’s vegetation history
7 Conclusions and available pollen records. FL, XC, UH, and JN were responsi-
ble for the collection of new pollen records from individual authors.
This paper describes the first dataset of Holocene grid- YZ contributed several published and unpublished pollen records
ded pollen-based REVEALS reconstructions of plant taxa and made comments and edits to the manuscript. JN, CA, XH, YL,
at a 1◦ × 1◦ spatial scale and a continuous temporal scale HL, AS, and YY contributed pollen data. FL had the major respon-
of 500 years (350, 250, and 100 + x years from 0.7 ka sibility of handling pollen data files, collected related metadata, and
to 1950 CE + x years (x is the number of years between performed the REVEALS application. FL and MJG are responsible
1950 CE and the year of coring)). The reconstructions are for the paper’s main objective and structure, FL prepared the first
based on 94 pollen records in temperate and northern sub- draft of the manuscript and all figures and tables, and finalized the
tropical China and include land-cover estimates for 27 plant manuscript for submission. MJG contributed to the text in all its
versions and checked the content and English language of the final
taxa and aggregation to plant functional types and three land-
manuscript. All co-authors contributed comments about and correc-
cover types. The REVEALS model assumptions and the limi- tions to the manuscript.
tations of this particular application are clearly stated in order
to facilitate a correct and cautious interpretation and assess-
ment of the results. In particular, the consequences of the lack Competing interests. The contact author has declared that none
of estimates for the cover of two major conifer trees (Abies of the authors has any competing interests.
and Picea), bare ground, and crop land need to be taken into
account in any studies using the dataset, in particular for veg-
etation zones II and IV (Abies, Picea) and VI, VII, and VIII
(bare ground, crop land). Examples of its uses are the evalu-
Earth Syst. Sci. Data, 15, 95–112, 2023 https://doi.org/10.5194/essd-15-95-2023You can also read