Impressioning Implants Fixture Level Digital - Kois Center
←
→
Page content transcription
If your browser does not render page correctly, please read the page content below
Impressioning Implants
    Fixture Level
        Digital

           Mini Me
© 2022 Kois Center, LLC
Mini Me         Impressioning Implants - Fixture Level - Conventional                                                                        2 of 41

  Effect of Intraoral Scanning on The Passivity of Fit of Implant-Supported Fixed Dental
  Prostheses
     Karl M, Graef F, Schubinski P, Taylor T.
     Quintessence Int. 2012 Jul-Aug;43(7):555-62.

                                             A

                                             B                                 A                                   B
   FIGURE 1 — Intraoral digitization        FIGURE 4 — Frame of a             FIGURE 5 — Stereolithographic cast generated based on the intraoral
   of the in vitro patient situation with   cement-retained implant-          scan, with individual dies in the mandibular left quadrant, and used to
   two implants in the mandibular           supported three-unit FDP CAD/     conventionally manufacture cast restorations. (A) Cast (B) wax pattern
   left quadrant using the LAVA C.O.S.      CAM fabricated from zirconia      of a three-unit cement-retained superstructure.
   scanner.                                 ceramic based on an intraoral
                                            scan. (A) Buccal aspect, (B)
                                            occlusal aspect.

     A                                                B
   FIGURE 6 — (A) Master cast obtained from a pickup impression with implant analogs and                FIGURE 2 — In vitro patient cast with
   abutments for cement-retained restorations attached to them. (B) The implant manufacturer’s          four strain gauges attached mesially
   plastic copings were used for waxing FDP frames.                                                     and distally adjacent to the implants,
                                                                                                        capturing the strains occurring as a result of
                                                                                                        superstructure fixation.

   FIGURE 3 — Mean absolute strain development at different strain gauge locations for all restoration types investigated. (Am, mesial SG at anterior
   implant; Ad, distal SG at anterior implant; Pm, mesial SG at posterior implant; Pd, distal SG at posterior implant.)

  Conclusion
   Intraoral digitization of dental implants appears to be at least as precise as conventional impression taking and master cast
   fabrication using prefabricated transfer components and laboratory analogs.

© 2022 Kois Center, LLC
Mini Me        Impressioning Implants - Fixture Level - Conventional                                                                   3 of 41

  An In Vitro Comparison of the Accuracy of Implant Impressions With Coded Healing
  Abutments and Different Implant Angulations
     Al-Abdullah K, Zandparsa R, Finkelman M, Hirayama H.
     J Prosthet Dent. 2013 Aug;110(2):90-100.

  Materials and Methods
   A reference epoxy resin cast was fabricated and shaped
   to simulate a dental arch. Two regular platform implant
   replicas (Biomet 3i Certain, 4.1 mm diameter and 15
   mm length) with internal connections were placed 10
   mm apart with a 10-degree convergence for one side of
   the reference resin cast and a 30-degree convergence
   for the other. Coded healing abutments (Encode) were
   placed at 3 different heights above the level of the soft
   tissue replication material (approximately 1, 2, and 4 mm)
   and served as test groups, and open trays with splinted
   impression copings served as a control group. The control
   group was compared to the impressions of the coded
   healing abutments by using a standardized measurement
   protocol. Impressions were made for each group (n=18)
   and poured with vacuum mixed (100 g powder/20 mL
   water) Type IV dental stone. The vertical discrepancy
   (Z axis) between 2 prefabricated passively fitting titanium
   reference frameworks and the platforms of the implant
   replicas was measured with an optical comparator applying
   the 1 screw test.

                                                                         FIGURE 7 — Optical comparator screen on which object’s shadow
                                                                         was magnified for measurement and movable stage (in the X and Y and
                                                                         Z axis) on which specimen position was standardized before recording
                                                                         vertical discrepancy on framework/replica interface.

   FIGURE 8 — Reference lines drawn on reference resin cast with         FIGURE 9 — Proposed measurement locations on each implant
   reference framework seated to standardize framework measurement       replica on which framework/replica interface vertical discrepancies were
   locations. Reference lines were transferred to each specimen for      measured with optical comparator.
   standardized positioning on optical comparator.

© 2022 Kois Center, LLC
Mini Me Impressioning Implants - Fixture Level - Conventional 4 of 41
TABLE 1
Median and Interquartile Range of Vertical Discrepancy Measurements in Micrometers (μm) on Implant Replicas in Each
Group with Different Angulations (10 and 30 Degree Convergence) and Positions (Anterior and Posterior)*
Angulation & Position
Groups
Anterior 10-Degree Anterior 30-Degree Posterior 10-Degree Posterior 30-Degree
Convergent Replicas Convergent Replicas Convergent Replicas Convergent Replicas
Encode healing abutment
at approximately
226.33 (IQR** 193.37) 162.83 (IQR 150.67) 48.17 (IQR 138.83) 110.17 (IQR 188.33)
1 mm above soft tissue
replication material
Encode healing abutment
at approximately
205.17 (IQR 211.42) 86.33 (IQR 286.71) 92.50 (IQR 161.25) 67.00 (IQR 199.42)
2 mm above soft tissue
replication material
Encode healing abutment
at approximately
228.33 (IQR 173.08) 211.67 (IQR 93.17) 157.67 (IQR 139.67) 175.33 (IQR 145.92)
4 mm above soft tissue
replication material
Control
Open trays with splinted 13.83 (IQR 7.25) 18.33 (IQR 7.58) 24.83 (IQR 5.83) 20.50 (IQR 7.00)
impression copings
* Kruskal-Wallis tests comparing groups were statistically significant (P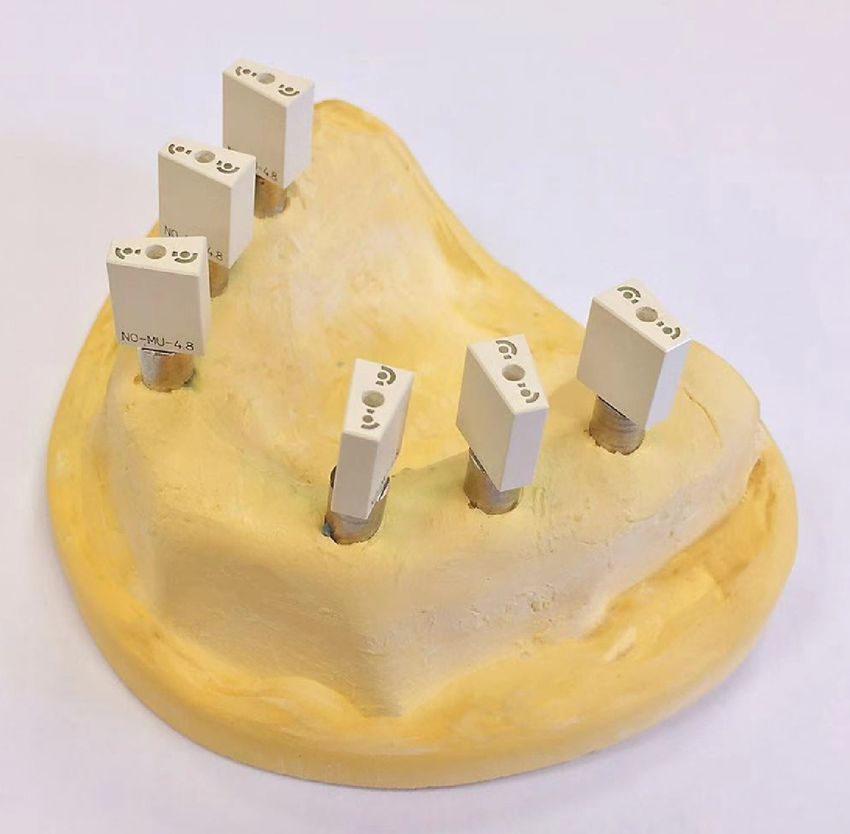
Mini Me        Impressioning Implants - Fixture Level - Conventional                                                                       5 of 41

  Precision of Dental Implant Digitization Using Intraoral Scanners
     Flügge TV, Att W, Metzger MC, Nelson K.
     Int J Prosthodont. 2016 May-Jun;29(3):277-83.

  Materials and Methods
   Two study models with a different number and distribution of dental implant scanbodies were produced from conventional
   implant impressions. The study models were scanned using three different intraoral scanners (iTero, Cadent; Trios, 3Shape;
   and True Definition, 3M ESPE) and a dental lab scanner (D250, 3Shape). For each study model, 10 scans were performed
   per scanner to produce repeated measurements for the calculation of precision. The distance and angulation between the
   respective scanbodies were measured. The results of each scanning system were compared using analysis of variance, and
   post hoc Tukey test was conducted for a pairwise comparison of scanning devices.

  Results
   The precision values of the scanbodies varied according to the distance between the scanbodies and the scanning device. A
   distance of a single tooth space and a jaw-traversing distance between scanbodies produced significantly different results for
   distance and angle measurements between the scanning systems.

     A                                    B

                                                                                A                                     B

   FIGURE 10 — (A) Study model SM1 with one tissue-level implant             FIGURE 11 — (A) Virtual reconstruction of VM1 with implant scanbodies
   analog in region 35 (REF 048.124) and a bone-level implant analog         in the regions of the second premolar and first molar in the left
   (REF 025.4101) in region 36. (B) Study model SM2 with five tissue-level   mandible. (B) Virtual reconstruction of VM2 with implant scanbodies
   implant analogs (REF 048.124) in regions 33, 35, 36, 45, and 47.          VM2.1, VM2.2, VM2.3, VM2.4, and VM2.5 in regions 33, 35, 36, 45, and 47
                                                                             (Table 1). IP = point at the intersection of the horizontal plane and the
                                                                             cylinder axis; DIP = distance between each neighboring scanbody.

   FIGURE 12 — Box-plot diagrams depicting the distances (DIP) between       FIGURE 13 — Box-plot diagrams depicting the angles (ACA) between the
   the central points of neighboring scan bodies in VM1 produced by          cylinder axes (CA) of the neighboring scan bodies in VM1 produced by
   scanning with True Definition, D250, Trios and iTero                      scanning with True Definition, D250, Trios, and iTero.

  Conclusion
   The precision of intraoral scanners and the dental lab scanner was significantly different. The precision of intraoral scanners
   decreased with an increasing distance between the scanbodies, whereas the precision of the dental lab scanner was
   independent of the distance between the scanbodies.

© 2022 Kois Center, LLC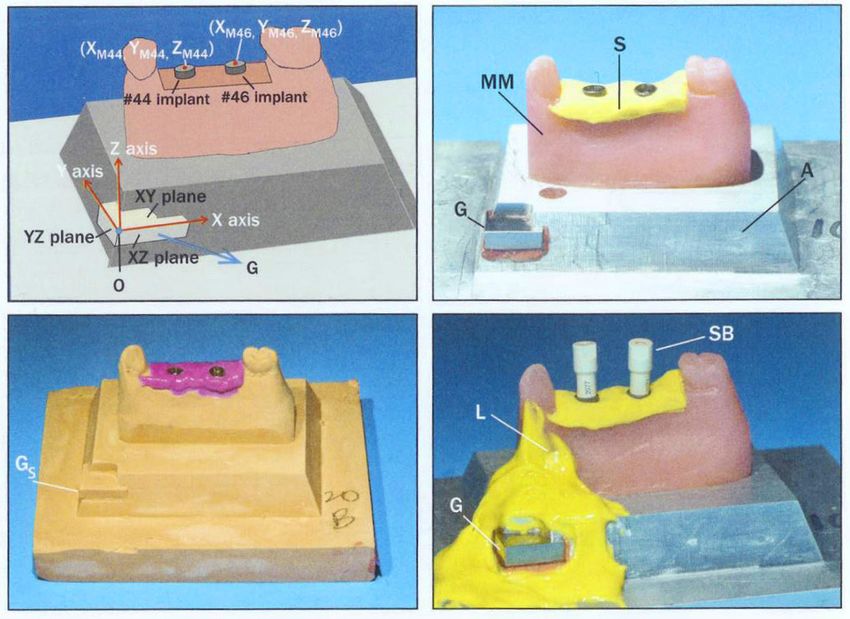
Mini Me        Impressioning Implants - Fixture Level - Conventional                                                                           6 of 41

  In Vivo Precision of Conventional and Digital Methods of Obtaining Complete-Arch Dental
  Impressions
     Ender A, Attin T, Mehl A.
     J Prosthet Dent. 2016 Mar;115(3):313-20.

  Purpose
   The purpose of this systematic review and meta-analysis was to compare cement- and screw-retained retention systems in
   fixed implant-supported restorations in terms of marginal bone loss, implant survival, and prosthetic complications.

  Materials and Methods
   Complete-arch impressions were obtained using 5 conventional (polyether, POE; vinylsiloxanether, VSE; direct scannable
   vinylsiloxanether, VSES; digitized scannable vinylsiloxanether, VSES-D; and irreversible hydrocolloid, ALG) and 7 digital (CEREC
   Bluecam, CER; CEREC Omnicam, OC; Cadent iTero, ITE; Lava COS, LAV; Lava True Definition Scanner, T-Def; 3Shape Trios, TRI;
   and 3Shape Trios Color, TRC) techniques. Impressions were made 3 times each in 5 participants (N=15). The impressions were
   then compared within and between the test groups. The cast surfaces were measured point-to-point using the signed nearest
   neighbor method. Precision was calculated from the (90%-10%)/2 percentile value.

  Results                                                      TABLE 2

                                                               Impression Procedure for Conventional Impression Material
   The precision ranged from 12.3 mm (VSE) to
   167.2 mm (ALG), with the highest precision in                                  Setting         Storage
                                                                                                               Tray                Impression
   the VSE and VSES groups. The deviation pattern              Material            Time            Time
                                                                                                             Adhesive                Method
   varied distinctly according to the impression                                 (Minutes)        (Hours)
   method. Conventional impressions showed                     POE                   10              8           Yes       Monophasic
   the highest accuracy across the complete
   dental arch in all groups, except for the ALG               VSE                   10              8           Yes       2 viscosities
   group.                                                      VSES                  10              8           Yes       Monophasic

                                                                                                                           Monophasic,
                                                               VSES-D                10              8           Yes       Digitization with extraoral
                                                                                                                           impression scanner

                                                               ALG                    5             0.15         No        Monophasic

     TABLE 3

     Impression Procedure for Digital Impression Systems

                    Surface             Scanning
     System                                                               Scan Procedure                                    STL-Export
                  Conditioning          Principle

                                   Active triangulation,    Buccal, occlusal, and oral image from every
     CER          Powder                                                                                     Direct via CEREC-Connect portal
                                   single image shot        tooth, camera flip at midline

                                                            Scan path: occlusal, buccal and oral direction
                                   Active triangulation,
     OC           None                                      of 1 quadrant, adding of second quadrant with    Direct via CEREC-Connect portal
                                   continuous images
                                                            same procedure

                                   Confocal laser, single   Guided scanning according to software            After uploading to Cadent Center and
     ITE          None
                                   image shot               instructions                                     central postprocessing

                                                            Scan path: occlusal, buccal and oral direction
                                   Wave front sampling,                                                      After uploading to 3M Connection Center
     LAV          Dusting                                   of 1 quadrant, adding second quadrant with
                                   continuous images                                                         and central postprocessing
                                                            same procedure

                                   Wave front sampling,                                                      After uploading to 3M Connection Center
     T-Def        Dusting
                                   continuous images                                                         and central postprocessing

                                   Confocal laser,          Scanning according to manufacturer’s manual
     TRI          None                                                                                       Direct via 3Shape Communicate Portal
                                   continuous images        for complete-arch impression

                                   Confocal laser,          Scanning according to manufacturer’s manual
     TRC          None                                                                                       Direct via 3Shape Communicate Portal
                                   continuous images        for complete-arch impression

© 2022 Kois Center, LLC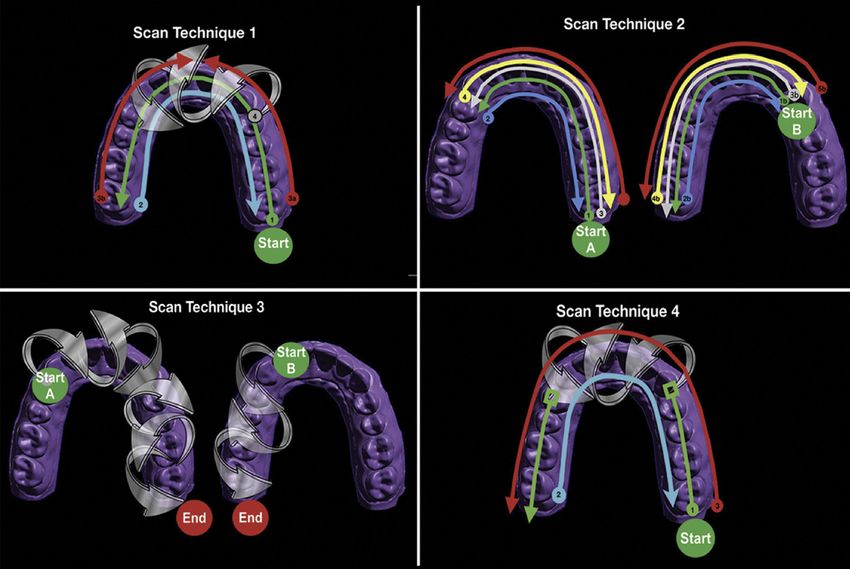
Mini Me        Impressioning Implants - Fixture Level - Conventional                                                7 of 41

     TABLE 4

     Precision of Conventional and Digital Impression (µm)

                                                                95%
     Characteristic          Mean (SD)         Median        Confidence      Minimum   Maximum
                                                              Interval

     VSE                      17.7 (5.1)         17.5          14.6, 20.2      10.0      28.0

     VSES                     18.3 (8.8)         18.0          16.1, 20.5      19.0      23.0

     VSES-dig                 36.7 (3.8)         35.5          34.0, 39.4      32.0      42.5

    POE                       34.9 (8.8)         35.0          29.6, 40.2      19.0      54.0

    ALG                      162.2 (71.3)       146.5         122.7, 201.7     84.0     337.1
                                                                                                                Misleading
    CER                      56.4 (15.4)         53.5          47.9, 64.9      35.7      86.4

     OC                      48.6 (11.6)         45.5          42.2, 55.0      34.3      72.0

     LAV                     82.8 (39.3)         76.5         61.0, 104.6      37.0     170.5

     T-Def                   59.7 (29.4)         52.4          43.4, 76.0      24.9     120.1

     ITE                     68.1 (18.9)         65.9          57.6, 78.6      39.2     103.9

     TRI                     47.5 (21.4)         41.9          35.7, 59.4      25.5      89.3

     TRC                     42.9 (20.4)         41.1          31.6, 54.2      25.2     105.7

  Conclusion
   Conventional and digital impression methods differ significantly in the complete-arch accuracy. Digital impression systems
   had higher local deviations within the complete arch cast; however, they achieve equal and higher precision than some
   conventional impression materials.

© 2022 Kois Center, LLC
Mini Me        Impressioning Implants - Fixture Level - Conventional                                                                  8 of 41

  Digital Versus Conventional Implant Impressions for Edentulous Patients: Accuracy
  Outcomes
     Papaspyridakos P, Gallucci GO, Chen CJ, Hanssen S, Naert I, Vandenberghe B.
     Clin Oral Implants Res. 2016 Apr;27(4):465-72.

  Materials and Methods
   A stone cast of an edentulous mandible with five implants was fabricated to serve as master cast (control) for both implant-
   and abutment-level impressions.
   Digital impressions (n = 10) were taken with an intraoral optical scanner (TRIOS, 3shape, Denmark) after connecting polymer
   scan bodies. For the conventional polyether impressions of the master cast, a splinted and a non-splinted technique were
   used for implant-level and abutment-level impressions (4 cast groups, n = 10 each). Master casts and conventional impression
   casts were digitized with an extraoral high-resolution scanner (IScan D103i, Imetric, Courgenay, Switzerland) to obtain digital
   volumes. Standard tessellation language (STL) datasets from the five groups of digital and conventional impressions were
   superimposed with the STL dataset from the master cast to assess the 3D (global) deviations.
   To compare the master cast with digital and conventional impressions at the implant level, analysis of variance (ANOVA) and
   Scheffe's post hoc test was used, while Wilcoxon's rank-sum test was used for testing the difference between abutment-level
   conventional impressions.

  Results
   Significant 3D deviations were found between Group II (non-splinted, implant level) and control. No significant differences were
   found between Groups I (splinted, implant level), III (digital, implant level), IV (splinted, abutment level), and V (non-splinted,
   abutment level) compared with the control. Implant angulation up to 15° did not affect the 3D accuracy of implant impressions.

    A                                       A

    B                                       B
   FIGURE 14 — Master cast (control)       FIGURE 15 — (A) Splinted implant-   FIGURE 16 — Color-coded gradient from Group III (digital).
   (A) implant-level (B) abutment-level.   level impression. (B) Nonsplinted
                                           implant-level impression.

  Conclusion
   1. Digital implant impressions are as accurate as conventional implant impressions.
   2. The accuracy of digital impressions was not different than the implant-level, splinted impressions for completely edentulous
      patients and both more accurate than the implant-level, non-splinted impressions.
   3. The implant-level, splinted impressions were more accurate than the non-splinted conventional impressions for completely
      edentulous patients.
   4. The accuracy of abutment-level, splinted impressions was not different than the non-splinted impressions for completely
      edentulous patients.
   5. The accuracy of implant impressions is not affected by the implant angulation up to 15° for completely edentulous
      patients. The connection type seems to affect accuracy because abutment-level impressions had no statistically significant
      differences from the control, whereas differences were identified for the implant-level, nonsplinted impressions.

© 2022 Kois Center, LLC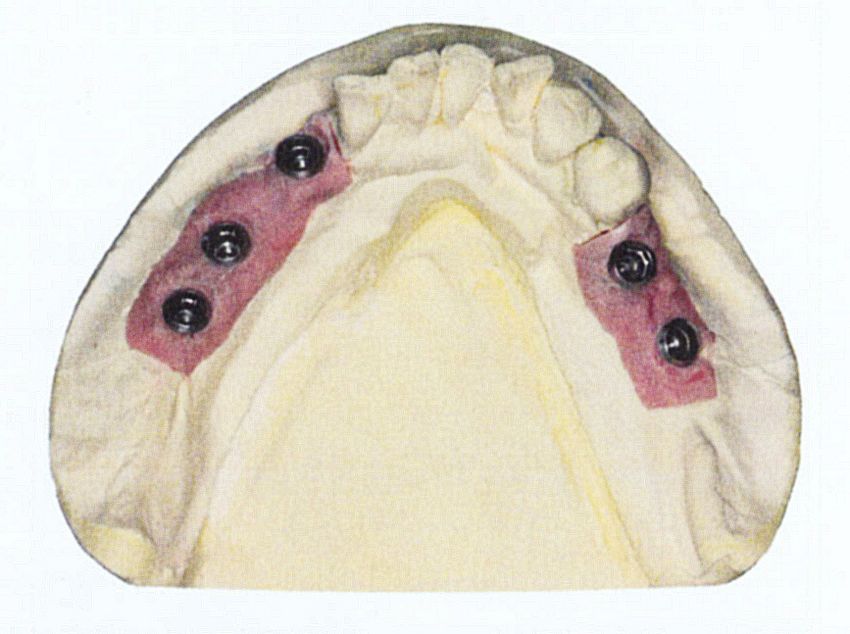
Mini Me        Impressioning Implants - Fixture Level - Conventional                                                                         9 of 41

  Digital Implant Impressions by Cone-Beam Computerized Tomography: A Pilot Study
     Corominas-Delgado C, Espona J, Lorente-Gascón M, Real-Voltas F, Roig M, Costa-Palau S.
     Clin Oral Implants Res. 2016 Nov;27(11):1407-13.

  Materials and Methods
   Thirty implants were placed in five edentulous mandibles of fresh cadaver heads, six per mandible. Special scan bodies were
   screwed in the implants and a cone-beam computerized tomography was taken. DICOM images were converted to STL and
   digitally processed to obtain a digital model of the implants. A Cr-Co structure was designed and milled for each mandible,
   and the adjustment was assessed as in a real clinical situation: passivity while screwing, radiographic fitting, optical fitting,
   and probing.

  Results
   Good adjustment was found in three of the structures, and only slight discrepancies were found in the other two.

                                                                               A                                              B

   FIGURE 17 — Assessment of insertion passivity of the five structures by    FIGURE 18 — Case 1 pictures (A) and (B) from different views and
   two calibrated operators. Results in a scale from 1 (no passivity) to 10   periapical radiographs used to check the fit of the structure once seated.
   (complete passivity).                                                      No gaps were detected by the operators.

  Conclusion
   Cone-beam computerized tomography might be a valid impression-taking method in full-mouth rehabilitations with implants.
   Further evaluations are needed with more implant and cone-beam computerized tomography systems. The radiation dose
   might be considered when deciding to use this impression system. The types of patients appropriate for this treatment option
   should also be determined to fulfill the principles of the ALARA law.

© 2022 Kois Center, LLC
Mini Me Impressioning Implants - Fixture Level - Conventional 10 of 41
In Vitro Three-Dimensional Accuracy of Digital Implant Impressions: The Effect of Implant
Angulation
Chia VA, Esguerra RJ, Teoh KH, Teo JW, Wong KM, Tan KB.
Int J Oral Maxillofac Implants. 2017 Mar/Apr;32(2):313–21.
Materials and Methods
Three master models (MMs) with two implants simulating an
implant-supported three-unit fixed partial denture for bone-level
implants were used. The implants had buccolingual interimplant
angulations of 0, 10, and 20 degrees. Test models for the
conventional impression test groups were made with impression
copings and polyether impressions. Scan bodies (SBs) were
attached to the MMs, tightened to 15-Ncm torque, and scanned
by an intraoral scanner (IOS) for the digital scan (DS) test groups A B
(six test groups, n = 5). A coordinate measuring machine measured
linear distortions (dx, dy, dz), 3D distortions (dR), angular distortions
(dθx, dθy), and absolute angular distortions (Absdθx, Absdθy) of
the physical conventional impression test models and STL files
of the DS virtual models relative to the MMs. Metrology software
allowed both physical and virtual measurement of geometric
targets that were comparable and allowed computation of relative
displacements of implant centroids and axes.
C D
Results FIGURE 19 — Test models. A) Schematic of master model and base block
with local coordinate system with origin (0) and x, y, and z axes setup
Mean dR ranged from 31 ± 14.2 to 45 ± 3.4 μm for DS and 18 ± 8.4
using the gauge block (G). B) Representative master model (MM) with vinyl
to 36 ± 6.5 μm for the conventional impression test groups. Mean polysiloxane peri-implant soft tissue (S) secured onto a milled aluminum
Absdθx ranged from 0.041 ± 0.0318 to 0.794 ± 0.2739 degrees for block (A), consisting of a gauge block (G). C) Cl test model with stone gauge
DS and 0.073 ± 0.0618 to 0.545 ± 0.0615 degrees for the CI test block replica (G,). D) Scan body (SB) assembly on MM with light-body
groups. Mean Absdθy ranged from 0.075 ± 0.0615 to 0.111 ± 0.0639 silicone impression material (L) between the gauge block (G) and SB to
degrees for DS and 0.106 ± 0.0773 to 0.195 ± 0.1317 degrees for allow stitching of three-dimensional scan images.
the CI test groups. Two-way analysis of variance showed that the
impression technique and implant angulations had a significant TABLE 6
effect on dR. Distortions were mostly in the negative direction for
DS test groups. Perfect coaxiality of the SB with the implant was Test Conditions for CI and DS Groups
never achieved. For SB to implant machining tolerances, the mean Total Abbreviation
Interimplant
absolute horizontal displacement ranged from 4 ± 1.2 to 7 ± 2.3 divergence
Condition angulations
μm. The SB dz was -5 ± 3.2 μm, which increased in the negative angle DS
(vs vertical) CI model
(degrees) model
direction to -11 ± 4.9 μm with torque application.
Both implants =
TABLE 5 Parallel 0 CI0 DS0
0 degrees
Machining Tolerance as Mean (SD) Coaxiality, Absolute First premolar =
10 CI10 DS10
5 degrees buccal
dx, Absolute dy, and dz of Six Scan Bodies, with Hand
Tightening or Applied Torque of 15 Ncm First molar =
Buccolingual 5 degrees lingual
Component distortion Hand tightened Applied Torque Angulation First premolar = 10
20 CI20 DS20
degrees buccal
Coaxiality (mm) 0.010 (± 0.00344) 0.009 (± 0.00250)
First molar =
Absolute dx (mm) 0.006 (± 0.00423) 0.004 (± 0.00121) 10 degrees lingual
Absolute dy (mm) 0.005 (± 0.00337) 0.007 (± 0.00232)
CI = conventional impression; DS = digital scan.
dz (mm) -0.005 (± 0.00321) -0.011 (± 0.00498)
Conclusion
1. Impression technique has a significant effect on 3D distortions (dR).
2. However, only the dR for C10 was significantly different from that for DS10 and DS20. This finding may be extrapolated to mean that
in the presence of angulated implants, there is little difference between the techniques.
3. The effect of increasing interimplant angulation has a significant effect on overall dR and the AbsdӨx angular distortion.
4. dz was mostly in the negative direction for the digital scans.
5. The machining tolerance of the intraoral scan body (SB) had a mean absolute horizontal distortion of to 7 μm. The mean dz increased
–5 μm for 15-Ncm torque and may be of clinical significance.
© 2022 Kois Center, LLCMini Me Impressioning Implants - Fixture Level - Conventional 11 of 41
Three-Dimensional Accuracy of Digital Implant Impressions: Effects of Different Scanners
and Implant Level
Chew AA, Esguerra RJ, Teoh KH, Wong KM, Ng SD, Tan KB.
Int J Oral Maxillofac Implants. 2017 Jan/Feb;32(1):70-80.
Materials and Methods
Two-implant master models were used to simulate a threeunit implant-supported fixed dental prosthesis. Conventional test
models were made with direct impression copings and polyether impressions. Scan bodies were hand-tightened onto master
models and scanned with the three scanners. This was done for the tissue level (TL) and bone level (BL) test groups, for a
total of eight test groups (n = 5 each). A coordinate measuring machine measured linear distortions (dx, dy, dz), global linear
distortion (dR), angular distortions (dθy, dθx), and absolute angular distortions (Absdθy, Absdθx) between the master models,
test models, and .stl files of the digital scans.
Results
The mean dR ranged from 35 to 66 μm; mean dθy angular distortions ranged from -0.186 to 0.315 degrees; and mean dθx
angular distortions ranged from -0.206 to 0.164 degrees. Two-way analysis of variance showed that the impression type had a
significant effect on dx, dz, and Absdθy, and the implant level had a significant effect on dx and Absdθx. Among the BL groups,
the mean dR of the conventional group was lower than and significantly different from the digital test groups, while among
the TL groups, there was no statistically significant difference.
FIGURE 20 — Mean global linear distortion (dR) for the eight test groups. FIGURE 21 — Mean absolute angular distortion (AbsdOy and AbsdOx)
Error bars — standard deviation. for the eight test groups. Error bars — standard deviation.
A B C D
FIGURE 22 — Representative .stl files illustrating scan defects. (A) TRIOS Color Digital Impression scan; streaky appearance (S) noted at interproximal
surfaces of scan body. (B, C) iTero scan; incomplete stitching or suture lines (SL) noted on scan bodies. (D) 3M True Definition scan; note the pooling
of powder (P) in scan body crevices.
Conclusion
The 3D accuracy of implant impressions varied according to the impression technique and implant level. For bone level test
groups, the conventional impression group had significantly lower distortion than the digital impression groups. Among the
digital test groups, the TRIOS Color Digital Impression system had comparable mean linear and absolute angular distortions
to the other two systems but exhibited the smallest standard deviations.
© 2022 Kois Center, LLCMini Me Impressioning Implants - Fixture Level - Conventional 12 of 41
Accuracy of Four Intraoral Scanners in Oral Implantology: A Comparative In Vitro
Study
Imburgia M, Logozzo S, Hauschild U, Veronesi G, Mangano C, Mangano FG.
BMC Oral Health. 2017 Jun 2;17(1):92.
Background
The aim of this study was to compare the trueness and precision of four intraoral scanners (IOS) in a partially edentulous
model (PEM) with three implants and in a fully edentulous model (FEM) with six implants.
Materials and Methods
Two gypsum models were prepared with respectively three and six implant analogues, and polyether-ether-ketone cylinders
screwed on. These models were scanned with a reference scanner (ScanRider®), and with four IOS (CS3600®, Trios3®, Omnicam®,
TrueDefinition®); five scans were taken for each model, using each IOS. All IOS datasets were loaded into reverse-engineering
software, where they were superimposed on the reference model, to evaluate trueness, and superimposed on each other
within groups, to determine precision. A detailed statistical analysis was carried out.
Results
In the PEM, CS3600® had the best trueness (45.8 ± 1.6μm), followed by Trios3® (50.2 ± 2.5μm), Omnicam® (58.8 ± 1.6μm) and
TrueDefinition® (61.4 ± 3.0μm). Significant differences were found between CS3600® and Trios3®, CS3600® and Omnicam®,
CS3600® and TrueDefinition®, Trios3® and Omnicam®, Trios3® and TrueDefinition®. In the FEM, CS3600® had the best trueness
(60.6 ± 11.7μm), followed by Omnicam® (66.4 ± 3.9μm), Trios3® (67.2 ± 6.9μm) and TrueDefinition® (106.4 ± 23.1μm). Significant
differences were found between CS3600® and TrueDefinition®, Trios3® and TrueDefinition®, Omnicam® and TrueDefinition®.
For all scanners, the trueness values obtained in the PEM were significantly better than those obtained in the FEM. In the PEM,
TrueDefinition® had the best precision (19.5 ± 3.1μm), followed by Trios3® (24.5 ± 3.7μm), CS3600® (24.8 ± 4.6μm) and Omnicam®
(26.3 ± 1.5μm); no statistically significant differences were found among different IOS. In the FEM, Trios3® had the best precision
(31.5 ± 9.8μm), followed by Omnicam® (57.2 ± 9.1μm), CS3600® (65.5 ± 16.7μm) and TrueDefinition® (75.3 ± 43.8μm); no statistically
significant differences were found among different IOS. For CS3600®, Omnicam® and TrueDefinition®, the values obtained in
the PEM were significantly better than those obtained in the FEM; no significant differences were found for Trios3®.
Trueness and Precision
1. The calculation of trueness and precision of the digitally acquired 3D models was as previously reported. In brief, all the
aforementioned 3D models (the reference R1 models acquired with the powerful desktop scanner, as well as all.STL files
obtained with the four different IOS) were imported into powerful reverse-engineering software (Geomagic Studio 2012®,
Geomagic, Morrisville, NC, USA).
2. First, the “mesh doctor” function was activated, in order to remove any possible small artifacts or independent polygons present
in the models; then, all models were cut and trimmed in order to remove the unnecessary information, using the “cut with
planes” function. In order to cut and trim the models in the most uniform possible way, specially designed preformed templates
were adopted. The trimmed models were therefore saved into specific folders, and were ready for the superimposition.
3. The superimposition method was first validated and tested through the following procedure, repeated for both the PEM and
the FEM. In brief, the reference R1 model was imported into the reverse engineering software, it was duplicated and moved to
another spatial location; these two identical models were then superimposed and registered, and the software calculated the
difference between the two surfaces. These tests were repeated five times for each model, and they certified the reliability of
the superimposition procedure.
4. After these validation tests, it was possible to proceed with the evaluation of trueness and precision of the four IOS, which
proceeded as previously reported. For the evaluation of trueness, the five different 3D surface models obtained from each
IOS were superimposed to the corresponding reference model (R1), obtained with the industrial desktop scanner. The
superimposition consisted of two different procedures. First, the “three point registration” function was used: the three points
were easily identified on the surface of the implant scan bodies. This function allowed a first, rough alignment of the two 3D
surface models to be obtained; after that, the “best fit” alignment function was activated, for the final superimposition and
registration.
© 2022 Kois Center, LLCMini Me Impressioning Implants - Fixture Level - Conventional 13 of 41
5. With this function, after defining the reference dataset (R1), as well the parameters for registration (a minimum of
100 iterations were requested in all cases), the corresponding polygons of the selected models were automatically
superimposed. An “robust-iterative-closest-point” (RICP) algorithm was used for this final registration, and the distances
between the reference R1 and the superimposed models were minimized using a point-to-plane method; congruence
between specific corresponding structures was calculated. With this method, the mean (SD) of the distances between the
two superimposed models was calculated by the software.
6. A similar procedure was followed for the evaluation of precision of the four different IOS. In this case, however, the
reference for superimposition was not the model obtained with the industrial optical desktop scanner (R1), but the 3D
surface model obtained from intraoral scanning that, for each of the four IOS, had obtained the best trueness result.
Basically in this way, all intraoral scans made with the same scanner were superimposed to this selected 3D surface
model; the precision of each IOS could be easily obtained, and again expressed as a mean (SD).
7. Finally, for both the trueness and precision, for an optimal 3D visualization of the results, the distances between
corresponding areas of references and all superimposed models were color coded, using the “3D deviation” function. A
color map was generated, where the distances between specific points of interest were quantified, overall, and in all planes
of space. The color maps indicated in-ward (blue) or out-ward (red) displacement between overlaid structures, whereas
a minimal change was indicated by a green color. Specific parameters were set for the different models: for the PEM, the
color scale ranged from a maximum deviation of +200 and −200 μm microns, with the best result given by deviations
comprised between +20 and −20 μm (green color); for the FEM, the color scale ranged from a maximum deviation of +400
and −400 μm microns, with the best result given by deviations comprised between +40 and −40 μm (green color).
FIGURE 23 — Four different IOS (CS 3600®, Carestream, Rochester, NY, USA; Trios 3®, 3-Shape, Copenhagen, Denmark; Cerec Omnicam®, Sirona Dental
System GmbH, Bensheim, Germany; True Definition®, 3M Espe, S. Paul, MN, USA) were compared in this study, with the purpose to investigate their
trueness and precision in oral implantology
Conclusion
In the present in vitro study, we have compared the trueness and precision of four latest generation IOS (CS3600®, Trios3®,
Omnicam®, TrueDefinition®) in two different situations (in a PEM with three implants and in a FEM with six implants, respectively).
Excellent results in terms of trueness and precision were achieved with all IOS, scanning the two different models. However,
important findings have emerged from our present work. First, significant differences in trueness were found among different
IOS: this may have important clinical implications. Since in digital dentistry modeling and milling depend essentially on the
data acquired through the optical impression, the use of the most accurate IOS would seem preferable, in order to improve
the quality of fit and marginal adaptation of the implant-supported prosthetic restorations. In our present study, CS 3600®
gave the best trueness results, therefore it should be preferable to use it in similar clinical settings. Second, the scanning
accuracy was higher in the PEM than in the FEM. This indicates that, despite the considerable progress made by the latest
generation IOS, scanning a fully edentulous patient remains more difficult than to scan an area of more limited extent, and
consequently the design and milling of full-arch restorations on the basis of these scanning data may still present problems.
Third, no statistically significant differences were found in the precision, among the four different IOS; however, Trios 3®
performed better in the transition from the partially to the fully edentulous model.
© 2022 Kois Center, LLCMini Me Impressioning Implants - Fixture Level - Conventional 14 of 41
Accuracy of Digital Impressions of Multiple Dental Implants: An In Vitro Study
Vandeweghe S, Vervack V, Dierens M, De Bruyn H.
Clin Oral Implants Res. 2017 Jun;28(6):648-653.
Introduction
Studies demonstrated that the accuracy of intra-oral scanners can be compared with conventional impressions for most
indications. However, little is known about their applicability to take impressions of multiple implants.
Aim
The aim of this study was to evaluate the accuracy of four intra-oral scanners when applied for implant impressions in the
edentulous jaw.
Materials and Methods
An acrylic mandibular cast containing six external connection implants (region 36, 34, 32, 42, 44 and 46) with PEEK scanbodies
was scanned using four intra-oral scanners: the Lava C.O.S. and the 3M True Definition, Cerec Omnicam and 3Shape Trios.
Each model was scanned 10 times with every intra-oral scanner. As a reference, a highly accurate laboratory scanner (104i,
Imetric, Courgenay, Switzerland) was used. The scans were imported into metrology software (Geomagic Qualify 12) for
analyses. Accuracy was measured in terms of trueness (comparing test and reference) and precision (determining the
deviation between different test scans). Mann-Whitney U-test and Wilcoxon signed rank test were used to detect statistically
significant differences in trueness and precision respectively.
Results
The mean trueness was 0.112 mm for Lava COS, 0.035 mm for 3M TrueDef, 0.028 mm for Trios and 0.061 mm for Cerec Omnicam.
There was no statistically significant difference between 3M TrueDef and Trios. Cerec Omnicam was less accurate than 3M TrueDef
and Trios, but more accurate compared to Lava COS. Lava COS was also less accurate compared to 3M TrueDef and Trios. The
mean precision was 0.066 mm for Lava COS, 0.030 mm for 3M TrueDef, 0.033 mm for Trios and 0.059 mm for Cerec Omnicam.
There was no statistically significant difference between 3M TrueDef and Trios. Cerec Omnicam was less accurate compared to 3M
TrueDef and Trios, but no difference was found with Lava COS. Lava COS was also less accurate compared to 3M TrueDef and Trios.
FIGURE 24 — The study model represented an edentulous jaw with six FIGURE 25 — Boxplot representing the overall trueness and precision for
external connection implants. The intraoral scanbodies were made in the different scanners.
PEEK (polyether ether ketone).
FIGURE 26 — Graph representing the mean trueness at every implant location for the different scanners.
Conclusion
Based on the findings of this in vitro study, the 3M True Definition and Trios scanner demonstrated the highest accuracy. The
Lava COS was found not suitable for taking implant impressions for a cross-arch bridge in the edentulous jaw.
© 2022 Kois Center, LLCMini Me Impressioning Implants - Fixture Level - Conventional 15 of 41
Comparison of Accuracy between a Conventional and Two Digital Intraoral Impression
Techniques
Malik J, Rodriguez J, Weisbloom M, Petridis H.
Int J Prosthodont. 2018 Mar/Apr;31(2):107-113.
Materials and Methods
Full-arch impressions of a reference model were obtained using addition silicone impression material (Aquasil Ultra; Dentsply
Caulk) and two optical scanners (Trios, 3Shape, and CEREC Omnicam, Sirona). Surface matching software (Geomagic Control,
3D Systems) was used to superimpose the scans within groups to determine the mean deviations in precision and trueness
(μm) between the scans, which were calculated for each group and compared statistically using one-way analysis of variance
with post hoc Bonferroni (trueness) and Games-Howell (precision) tests (IBM SPSS ver 24, IBM UK). Qualitative analysis was
also carried out from three-dimensional maps of differences between scans.
Results
Means and standard deviations (SD) of deviations in precision for conventional, Trios, and Omnicam groups were 21.7 (± 5.4),
49.9 (± 18.3), and 36.5 (± 11.12) μm, respectively. Means and SDs for deviations in trueness were 24.3 (± 5.7), 87.1 (± 7.9), and
80.3 (± 12.1) μm, respectively. The conventional impression showed statistically significantly improved mean precision (P <
.006) and mean trueness (P < .001) compared to both digital impression procedures. There were no statistically significant
differences in precision (P = .153) or trueness (P = .757) between the digital impressions. The qualitative analysis revealed local
deviations along the palatal surfaces of the molars and incisal edges of the anterior teeth of < 100 μm.
A B C
D E F
FIGURE 27 — Process of superimposition. (A) Paired scans prior to superimposition. (B) Initial superimposition FIGURE 28 — Silver-plated
with 50,000 data points. (C) High-precision superimposition with 100,000 data points (D) and (E) careful trimming reference model.
of unwanted data points. (F) Final trimmed model.
TABLE 7 TABLE 8
Precision Deviations of Conventional and Digital Trueness Deviations of Conventional and Digital
Impressions (µm) Impressions (µm)
Mean SD Minimum Maximum Mean SD Minimum Maximum
Reference 4.8 0.7 3.9 5.6 Conventional 24.3 5.7 19.0 32.8
Conventional 21.7 5.4 15.8 30.2 Trios 87.1 7.9 74.9 94.5
Trios 49.9 18.3 21.5 83.3 Omnicam 80.3 12.1 63.3 94.9
Omnicam 36.5 11.2 23.9 53.4 SD = standard deviation
SD = standard deviation
Conclusion
Conventional full-arch polyvinyl siloxane impressions exhibited improved mean accuracy compared to two direct optical
scanners. No significant differences were found between the two digital impression methods.
© 2022 Kois Center, LLCMini Me Impressioning Implants - Fixture Level - Conventional 16 of 41
Comparison of Three-Dimensional Accuracy of Digital and Conventional Implant
Impressions: Effect of Interimplant Distance in an Edentulous Arch
Tan MY, Yee SHX, Wong KM, Tan YH, Tan KBC.
Int J Oral Maxillofac Implants. 2019 March/April;34(2):366–380.
Materials and Methods
Six impression systems comprising one conventional impression material(Impregum), two intraoral scanners (TRIOS and
True Definition), and three dental laboratory scanners (Ceramill Map400, inEos X5, and D900) were evaluated on two
completely edentulous maxillary arch master models (A and B) with six and eight implants, respectively. Centroid positions at
the implant platform level were derived using either physical or virtual probe hits
A
with a coordinate measuring machine. Comparison of centroid positions between
master and test models (n = 5) defined linear distortions (dx, dy, dz), global linear
distortions (dR), and 3D reference distance distortions between implants (ΔR). The
two-dimensional (2D) angles between the central axis of each implant to the x- or
y-axes were compared to derive absolute angular distortions (Absdθx, Absdθy).
Results
Model A mean dR ranged from 8.7 ± 8.3 μm to 731.7 ± 62.3 μm. Model B mean dR ranged
B
from 16.3 ± 9 μm to 620.2 ± 63.2 μm. Model A mean Absdθx ranged from 0.021 ± 0.205
degrees to -2.349 ± 0.166 degrees, and mean Absdθy ranged from -0.002 ± 0.160 degrees
to -0.932 ± 0.290 degrees. Model B mean Absdθx ranged from -0.007 ± 0.076 degrees to
-0.688 ± 0.574 degrees, and mean Absdθy ranged from -0.018 ± 0.048 degrees to -1.052
± 0.297 degrees. One-way analysis of variance (ANOVA) by Impression system revealed
significant differences among test groups for dR and ΔR in both models, with True
Definition exhibiting the poorest accuracy. Independent samples t tests for dR, between FIGURE 29 — (A) Schematic of master model A with six
implants (l, J, K, L, M, N). (B) Schematic of master model B
homologous implant location pairs in Model A versus B, revealed the presence of two with eight implants (P, Q, R, S, T, U, V, W). l, Il, Ill silicon nitride
ball bearings. Local coordinate system axes orientation with
to four significant pairings (out of seven possible) for the intraoral scanner systems, in origin at centroid of implant I in model A and implant P in
model B, respectively. X-axis is defined as I to N centroids
which instances dR was larger in Model A by 110 to 150 μm. and P to W centroids, respectively.
A B C FIGURE 30 — (A) Implant centroid was defined by
constructing a pierce point between the central axis
of the virtual scan body/implant internal cone and the
implant platform plane. (B) Scan-body cylinder (TRIOS,True
Definition, inEos X5, D900) or cone (Ceramill Map400) was
defined by eight virtual probe hits at two levels. (C) Scan-
body topplane was defined by four virtual probe hits. (D)
Virtual scan body with measured features.
D
Conclusion
This in vitro study examined the effect of implant impression system and interimplant distance on the 3D accuracy of implant
positions in the resultant stone or virtual models. Within the limitations of this study, the following conclusions were made.
Impregum consistently exhibited the lowest or second-lowest dR at all implant locations. True Definition exhibited the poorest
accuracy for all linear distortions (dx, dy, dz and dR) and 3D reference distance distortion (ΔR) parameters in both models A and
B, but not for absolute angular distortions (Absdθx and Absdθy). Excluding True Definition, there was no significant difference
among the remaining five impression systems for linear distortion parameters (dx, dy, dz and dR) in both models A and B. The six
impression systems could not be consistently ranked for angular distortions. Reducing interimplant distance may decrease global
linear distortions (dR) for intraoral scanner systems, but had no effect on Impregum and the dental laboratory scanner systems.
© 2022 Kois Center, LLCMini Me Impressioning Implants - Fixture Level - Conventional 17 of 41
Obtaining Reliable Intraoral Digital Scans for an Implant-Supported Complete-Arch
Prosthesis: A Dental Technique
Iturrate M, Minguez R, Pradies G, Solaberrieta E.
J Prosthet Dent. 2019 Feb;121(2):237-241.
Abstract
This article describes a technique for obtaining an accurate complete-arch digital scan for an edentulous patient. To achieve
this, an auxiliary polymeric device that simulates a denture is designed, fabricated, and placed in the mouth. This device,
having the geometry of a typical dental arch, facilitates the digitalization of the edentulous complete arch. This is because the
change in radius of the curvature (change of geometry) enables the scanner to perform a more accurate alignment. Initially,
the necessary location of the implants is acquired, and then the soft tissue is added. This technique can achieve accurate
complete-arch digital scans. Distances between implants are closer to the gold standard when using this auxiliary geometry
piece than those obtained without using it.
A B
FIGURE 31 — (A), Treatment of edentulous patient with 4 scannable copings. (B), STL file after FIGURE 34 — Auxiliary device design process.
scanning. STL, standard tessellation language.
A B
FIGURE 32 — (A), Auxiliary device fixed to edentulous jaw with scannable copings. (B), STL file after
scanning. STL, standard tessellation language.
A B
FIGURE 33 — (A), Selection of auxiliary devices and soft tissues with reverse engineering software.
(B), Reference position of scannable copings after erasing auxiliary device and soft tissues.
© 2022 Kois Center, LLCMini Me Impressioning Implants - Fixture Level - Conventional 18 of 41
A
B C
D E
FIGURE 35 — (A), Virtual partition of digital scan of complete arch. (B)-(E), Each split part of complete
arch.
Conclusion
1. The technique presented in this article improves the accuracy of a complete-arch scanning for an edentulous patient. In
areas with homogeneous geometry, a low-cost and easy-to-fabricate device with auxiliary geometry produced in ABS with
a 3D printer was added.
2. By combining scans and using reverse engineering software, an accurate complete-arch image of an edentulous patient
is achieved.
© 2022 Kois Center, LLCMini Me Impressioning Implants - Fixture Level - Conventional 19 of 41
Accuracy of Different Definitive Impression Techniques with the All-on-4 Protocol
Ozan O, Hamis O.
J Prosthet Dent. 2019 Jun;121(6):941-948.
Materials and Methods
Four maxillary definitive cast models with 4 multiunit analogs (T0 32202; NucleOSS) were fabricated according to the all-on-4
treatment protocol. In the anterior region, the analogs were positioned in a parallel direction, whereas in the posterior region,
they were positioned in different angulations (0, 10, 20, and 30 degrees). One hundred and sixty models were obtained by using
4 different impression techniques (closed tray without plastic cap, closed tray with plastic cap, splinted open tray, sectioned
resplinted open tray) (n=10) and polyvinyl siloxane impression material. Definitive casts and definitive duplicate casts were
scanned using a modified laser scanner (Activity 880; Smart Optics Sensortechnik GmbH), and data were transferred to a
software program (VRMesh Studio; Virtual Grid Inc). The definitive casts and definitive duplicate cast scans were digitally
aligned. Angular and linear deviations in all axes (x, y, and z) of the analogs between definitive and duplicate casts were
calculated and subjected to statistical analyses (α=.05).
Results
Mean angular deviations were in the range of 0.03 to 0.16 degrees, and linear deviations were in the range of 0.10 to 0.75
mm. The increased angulation between impression copings caused higher linear and angular deviations when closed-tray
impression techniques were used.
A B
C D
FIGURE 36 — Definitive casts with different angulations between FIGURE 37 — Reference points defined on definitive casts indicated with
anterior and posterior analogs. (A) Parallel. (B) 10 degrees angulation. (C) asterisk.
20 degrees angulation. (D) 30 degrees angulation.
Conclusion
Within the limitations of this in vitro study, the following conclusions were drawn:
1. All impression techniques provided similar accuracy when impressions of parallel impression copings were made.
2. The use of a plastic cap for closed-tray impressions was not found to improve accuracy.
3. All open-tray impression techniques exhibited lower deviations than closed-tray impression techniques when 20-degree
or greater angulations existed between the impression copings. When high discrepancies among the implants (30 degrees)
are present, the sectioned resplinted open-tray technique can be recommended to improve cast accuracy.
© 2022 Kois Center, LLCMini Me Impressioning Implants - Fixture Level - Conventional 20 of 41
Accuracy of Intraoral Digital Impressions Using Splinted Scan Body on Full-Arch Implant-
Supported Prosthesis
Chaiyabutr Y, Kois JC, Marino E, Kois DE.
Kois Center Research 2019.
Background
Accuracy is the combination of two elements, both important and complementary: "trueness" and "precision". The term
"trueness" refers to the ability of a measurement to match the actual value of the quantity being measured. An IOS should be
able to detect all details of the impression and to generate a virtual 3D model as similar as possible to the initial target, and
that little or nothing deviates from reality. In order to detect the trueness of a 3D model derived from intra-oral scanning, it is
mandatory to have a reference model with error tending to zero, obtained with industrial machines or with powerful industrial
desktop scanners. In fact, only the superimposition of the 3D models obtained with an intraoral device to a reference model,
through the use of specific software, helps to evaluate the actual trueness of an IOS. Although trueness is the key element for
an IOS, it is not sufficient, as it must be accompanied by precision. Precision is defined as the ability of a measurement to be
consistently repeated: in other words, the ability of the scanner to ensure repeatable outcomes, when employed in different
measurements of the same object. The constant repeatability of the result is of great importance: different measurements of
the same object must necessarily be comparable, and differ from each other as little as possible. To measure the precision of
an IOS, no reference models are needed: it is sufficient to superimpose different intraoral scans between them, and evaluate
to what extent they deviate, using dedicated software.
Materials and Methods
The aim of this study was to compare the trueness and precision of intraoral digital impressions for full-arch implant-supported
prostheses using 3 different designs of scan bodies and 3 different intraoral scanners (IOS). A stone model of an edentulous
maxillary with four implants was used as a master model and its dimension measured with a coordinating measuring machine.
Three different designs of a scan body were used: scan body alone (SB), splinted scan body with smooth surface connector (SB-
S), and splinted scan body with rough surface connector (SB-R). Three different IOS were used to generate digital impressions:
Medit500, iTero Element, and Cerec Omnicam. A digital impression from a dental laboratory desktop scanner with a fixed based
position (Zirkonzahn Scanner900 Arti) was used as a digital reference model (control). A software was used to analyze and
compare the digital impression with the digital reference model, obtaining the scanning accuracy. The 3D position and distance
deviation errors in terms of trueness and precision at all screw accesses in three axes were evaluated and recorded.
TABLE 10
TABLE 9
Precision (mean ± SD), in µm, for
Trueness (mean ± SD), in µm, for Implant-Supported Fully Edentulous Maxilla of Implant-Supported Fully Edentulous
Testing Scanners Maxilla of Testing Scanners
SB SB-S SB-R SB-R
Medit500 189.00 ± 12.40 158.78 ± 10.30 125.75 ± 11.50 Medit500 123.50 ± 10.23
iTero 227.00 ± 11.47 172.75 ± 5.26 161.50 ± 31.90 iTero 145.25 ± 20.75
Cerec Omnicam 140.25 ± 7.69 135.75 ± 8.21 88.75 ± 6.91 Cerec Omnicam 108.50 ± 17.05
SB SB-S SB-R
FIGURE 38 — Three different designs of scan body were used: Left, scan abutment alone (SB), Middle, splinted scan abutment with smooth surface
connector (SB-S), Right, splinted scan abutment with rough surface connector (SB-R).
© 2022 Kois Center, LLCMini Me Impressioning Implants - Fixture Level - Conventional 21 of 41
Medit500
iTero
Cerec Omnicam
FIGURE 39 — Trueness of digital impression from different IOS systems comparison to the digital reference model. Note that the blue and green color
represents best trueness value when compared with the digital reference model.
FIGURE 40 — Precision of digital impression from different IOS systems compared when scanning the SB-R models. Left, Medit500; Middle, Itero;
Right, Cerec Omnicam. Note that the blue and green color represents best precision value.
Conclusion
The best results in terms of trueness was achieved using a splinted scan body with a rough surface connector in all IOS for
full-arch implant-supported prostheses. No statistically significant differences were found in the precision among the three
different IOS; however, Cerec Omnicam performed better for a splinted scan body in a fully edentulous model.
© 2022 Kois Center, LLCMini Me Impressioning Implants - Fixture Level - Conventional 22 of 41
Effect of Multiple Use of Impression Copings and Scanbodies on Implant Cast Accuracy
Sawyers J, Baig MR, El-Masoud B.
Int J Oral Maxillofac Implants. 2019 July/August;34(4):891–898.
Materials and Methods
Ten direct polyether impressions were made of a partially dentate mandibular acrylic resin master model fitted with two internal
connection implants (Straumann RC bone level) in the positions of right first premolar and molar, to produce 10 dental stone casts.
A single set of impression copings was utilized for the 10 impressions. The sample casts and the master model were digitized using
a laboratory scanner. Ten digital scans were then performed on an implant stone cast with two bone-level internal connection
implant analogs using one set of scanbodies to produce scans 1 to 10. Measurements were made on all the digitized casts using
computer software and discrepancies calculated in the x-, y-, and z-axes, and in the overall three-dimensional position (R). Data
were statistically analyzed using paired t tests (α = .05), and P values were adjusted using Holm-Bonferroni sequential correction.
FIGURE 41 — Master model consisting of two FIGURE 42 — Master model with impression FIGURE 43 — Impression following separation
internal connection bone-level implant replicas copings attached to 44 and 46 internal from master model.
located in the positions of the right first connection implants.
premolar and first molar.
A B
FIGURE 44 — Scanbodies in place on the master FIGURE 45 — Static images of 3D model casts acquired by scanning dental stone casts with Maestro
model prior to the application of powder spray 3D Scanner. (A) Occlusal view. (B) Buccal view.
for digitization.
© 2022 Kois Center, LLCMini Me Impressioning Implants - Fixture Level - Conventional 23 of 41
FIGURE 46 — Measurements to determine the x and y distances between FIGURE 47 — Measurement to determine the z distance (EH) between
two scanbodies for each scan. AB represents they distance, while CD is two scan bodies for each scan. EF, FG, and EG were measured for
the x distance. CD was calculated using the measurements of AB, AC, and calculation of EH.
BC.
TABLE 11
Means and SDS (μm) of Absolute Differences Between the Sample Casts and the Master Model, in the x-, y-, and z-axes, and
3D (R) with Significance Values
Cast 1 Cast 2 Cast 3 Cast 4 Cast 5 Cast 6 Cast 7 Cast 8 Cast 9 Cast 10
40 ± 26 20 ± 19 10 ± 12 70 ± 19 30 ± 18 50 ± 31 20 ± 8 50 ± 29 30 ± 6 50 ± 29
Δx
(.279) (.123) (.083) (.768) (.539) (.695) (.695) (.331) (.797)
50 ± 38 30 ± 20 30 ± 14 30 ± 19 20 ± 16 70 ± 33* 10 ± 18 20 ± 19 40 ± 32 30 ± 18
Δy
(.485) (.426) (.312) (.164) (.028) (.217) (.272) (.851) (.459)
60 ± 39 30 ± 25 50 ± 25 60 ± 36 20 ± 11 50 ± 34 50 ± 22 30 ± 20 60 ± 39 40 ± 30
Δx
(.194) (.657) (.905) (.067) (.474) (.619) (.103) (.888) (.379)
98 ± 21 56 ± 11* 63 ± 27 104 ± 25 47 ± 15* 107 ± 39 54 ± 22 64 ± 23** 87 ± 32 68 ± 43
ΔR
(.023) (.171) (.652) (.006) (.494) (.062) (.001) (.617) (.256)
*Statistically significant difference in relation to case 1 with paired t test (p < .05).
**Statistically significant difference in relation to case 1 with paired t test (p < .005).
TABLE 12
Means and SDS (μm) of Absolute Differences Between the Repeated Scans with Scanbodies and the Master Scan, in the x-,
y-, and z-axes, and 3D (R) with Significance Values
Cast 1 Cast 2 Cast 3 Cast 4 Cast 5 Cast 6 Cast 7 Cast 8 Cast 9 Cast 10
50 ± 25 20 ± 13 80 ± 9 70 ± 22 60 ± 20 20 ± 16 40 ± 36 60 ± 27 10 ± 7 40 ± 22
Δx
(.084) (.019) (.127) (.349) (.230) (.726) (.021) (.065) (.518)
70 ± 45 30 ± 9 100 ± 4 40 ± 29 60 ± 55 40 ± 24 50 ± 29 40 ± 29 20 ± 22 30 ± 14
Δy
(.121) (.256) (.335) (.741) (.404) (.399) (.026) (.068) (.113)
50 ± 38 20 ± 8 60 ± 53 60 ± 46 30 ± 27 20 ± 12 40 ± 24 20 ± 9 70 ± 39 60 ± 36
Δx
(.123) (.952) (.722) (.340) (.053) (.189) (.101) (.592) (.730)
111 ± 27 39 ± 11* 143 ± 28 113 ± 25 94 ± 50 56 ± 24 82 ± 34 84 ± 30 80 ± 38 80 ± 38
ΔR
(.002) (.068) (.954) (.441) (.047) (.249) (.043) (.245) (.261)
**Statistically significant difference in relation to case 1 with paired t test (p < .005).
Conclusion
Accounting for the limitations in this in vitro study, it can be concluded that: (1) the sterilization and subsequent reuse of open
tray impression copings up to 10 times did not seem to affect the accuracy of most dental implant stone casts, and the few
casts that significantly varied showed 3D deviations in the range of 45 to 65 um, and (2) reuse of scanbodies up to 10 times
did not seem to affect the accuracy of digital implant casts, except for one.
© 2022 Kois Center, LLCYou can also read


