Journal of Experimental Child Psychology - Temple University Sites
←
→
Page content transcription
If your browser does not render page correctly, please read the page content below
Journal of Experimental Child Psychology 212 (2021) 105251

                                         Contents lists available at ScienceDirect

                                 Journal of Experimental Child
                                          Psychology
                               journal homepage: www.elsevier.com/locate/jecp

Relations among spatial skills, number line
estimation, and exact and approximate calculation
in young children
Elizabeth A. Gunderson a,⇑, Lindsey Hildebrand b
a
    Department of Psychology, Temple University, Philadelphia, PA 19122, USA
b
    Department of Psychology and Neuroscience, Boston College, Chestnut Hill, MA 02467, USA

a r t i c l e          i n f o                        a b s t r a c t

Article history:                                      Decades of research have established that spatial skills correlate
Received 11 September 2020                            with numerical skills. However, because both spatial and numeri-
Revised 25 June 2021                                  cal skills are multidimensional, we sought to determine how speci-
                                                      fic spatial skills relate to specific numeracy skills. We used a
                                                      cohort-sequential design, assessing a large diverse sample of stu-
Keywords:
                                                      dents (N = 612, initially in pre-kindergarten [pre-K]–3rd grade,
Spatial skills
Numeracy                                              4–9 years of age) at four time points spanning 2 years. We exam-
Calculation                                           ined how initial levels of five spatial skills (visuospatial working
Mental rotation                                       memory [VSWM], mental transformation, mental rotation, propor-
Proportional Reasoning                                tional reasoning, and analog magnitude system [AMS] acuity)
Number line                                           related to initial levels and growth rates in exact and approximate
                                                      calculation skills, and we further investigated number line estima-
                                                      tion as a potential mediator. We found unique patterns of relations
                                                      between spatial skills and numeracy. Initial levels of mental rota-
                                                      tion, proportional reasoning, and AMS acuity related to initial
                                                      levels of exact calculation skill; initial levels of AMS acuity related
                                                      to initial levels of approximate calculation; and initial levels of pro-
                                                      portional reasoning related to initial levels of number line estima-
                                                      tion. VSWM and mental transformation did not relate to numeracy
                                                      skills after controlling for other spatial skills. Initial levels of num-
                                                      ber line estimation related to both exact and approximate calcula-
                                                      tion after controlling for spatial skills. Notably, neither spatial skills
                                                      nor number line estimation predicted growth in exact or approxi-
                                                      mate calculation skills. These results indicate that there is speci-
                                                      ficity in the time-invariant relations between spatial skills and
                                                      numeracy, and they suggest that researchers and educators should

    ⇑ Corresponding author.
      E-mail address: liz.gunderson@temple.edu (E.A. Gunderson).

https://doi.org/10.1016/j.jecp.2021.105251
0022-0965/Ó 2021 Elsevier Inc. All rights reserved.
E.A. Gunderson and L. Hildebrand                          Journal of Experimental Child Psychology 212 (2021) 105251

                                            treat spatial skills and numeracy as multidimensional constructs
                                            with complex and unique interrelations.
                                                                       Ó 2021 Elsevier Inc. All rights reserved.

Introduction

    Mathematics achievement is a critical predictor of academic success and career outcomes, includ-
ing adulthood income (Ritchie & Bates, 2013; Watts, Duncan, Siegler, & Davis-Kean, 2014). Spatial
skills—a suite of abilities that allow individuals to encode, hold in mind, and mentally manipulate spa-
tial information—are a major predictor of achievement, interest, and success in mathematics as early
as 4 years of age (Casey, Nuttall, Pezaris, & Benbow, 1995; Kyttälä, Aunio, Lehto, Van Luit, &
Hautamäki, 2003; Lachance & Mazzocco, 2006). Importantly, spatial skills can be substantially
improved through training at all ages (Uttal et al., 2013). Therefore, enhancing spatial skills may rep-
resent a powerful and currently underutilized leverage point for enhancing children’s early numeracy
skills (Hawes, Moss, Caswell, Naqvi, & MacKinnon, 2017).
    However, to leverage spatial skills to create effective interventions, it is critical to first understand
how and why spatial skills are related to specific numerical abilities (Mix & Cheng, 2012; Uttal &
Cohen, 2012). Despite more than 50 years of research establishing the relation between spatial skills
and later STEM (science, technology, engineering, and mathematics) achievement (Wai, Lubinski, &
Benbow, 2009), researchers have only recently begun to delineate the specific mechanisms through
which spatial skills relate to symbolic numeracy (Gunderson, Ramirez, Beilock, & Levine, 2012; Mix
et al., 2016).
    The current study used a large 2-year cohort-sequential study of children in pre-kindergarten (pre-
K) to 4th grade (4–10 years of age) to test predictions about how specific spatial skills relate to specific
aspects of symbolic numeracy (approximate and exact calculation). Furthermore, we examined why
spatial skills relate to symbolic numeracy by testing one proposed mechanism—that spatial skills
improve children’s spatial–numeric representation of numbers (e.g., a mental number line)—which
in turn improves other numerical skills (Gunderson et al., 2012; LeFevre et al., 2013). With this pro-
posed mechanism in mind, we examined spatial skills that have been theoretically and empirically
linked to number line estimation skill: visuospatial working memory (VSWM), mental transformation,
mental rotation, proportional reasoning, and analog magnitude system (AMS) acuity.

Exact and approximate symbolic numeracy skills

   We define ‘‘symbolic numeracy skills” as mathematical concepts and procedures that involve num-
ber symbols (i.e., Arabic numerals or number words; e.g., De Smedt, Noël, Gilmore, & Ansari, 2013). In
pre-K to 4th grade, these skills typically involve understanding the magnitudes represented by num-
ber symbols and manipulating these number symbols using arithmetic operations. A salient cleavage
in symbolic numeracy skills is the distinction between approximate and exact symbolic numeracy
skills (Caviola, Mammarella, Cornoldi, & Lucangeli, 2012; Spelke & Tsivkin, 2001; Waring & Penner-
Wilger, 2017).
   Approximate symbolic numeracy skills, also referred to as ‘‘estimation” or ‘‘number sense,” rely
heavily on children’s knowledge of the magnitudes represented by number symbols. A hallmark of
approximate symbolic numeracy skill is that when comparing two numbers, performance is better
the larger the ratio between the two numbers to be compared (i.e., ratio dependent; De Smedt
et al., 2013). Children can also perform arithmetic operations approximately even before formal
instruction (Gilmore, McCarthy, & Spelke, 2007; Xenidou-Dervou, De Smedt, van der Schoot, & van
Lieshout, 2013). For example, 5- and 6-year-olds can successfully choose the larger of ‘‘21 + 30 versus
34” without being able to say that ‘‘21 + 30 = 51” (Gilmore et al., 2007). This approximate symbolic
calculation skill is correlated with general math achievement (Xenidou-Dervou et al., 2013) and is
                                                      2
E.A. Gunderson and L. Hildebrand                         Journal of Experimental Child Psychology 212 (2021) 105251

predicted by children’s earlier spatial skills, a relation that is mediated by number line estimation
skills (Gunderson et al., 2012).
    In contrast to approximate symbolic numeracy skills, exact numerical skills involve manipulating
number symbols to arrive at a precise answer, typically using a combination of retrieval and procedu-
ral rules. In the United States, a focus on exact calculation ability is present during the first years of
formal schooling, and most standardized math assessments involve exact calculations (National
Governors Association Center for Best Practices, Council of Chief State School Officers, 2010). Impor-
tantly, both approximate and exact numerical skills are strong predictors of math achievement (e.g.,
Siegler et al., 2012; Xenidou-Dervou et al., 2013). Yet, these are distinct numerical skills that we expect
to have distinct relations to specific spatial skills.

Role of number line estimation in math achievement

    Prior research has identified number line estimation as a potential mediator of relations between
spatial skills and symbolic numeracy skills (Gunderson et al., 2012). Number line estimation skill—the
ability to represent the magnitude of a target number on a line with two labeled end points—is
strongly related to other numerical skills, including recalling numbers, fraction knowledge, approxi-
mate calculation, and symbolic estimation (for a review, see Siegler & Lortie-Forgues, 2014). Further-
more, a recent meta-analysis found that number line estimation skill was positively related to math
achievement during childhood (r = .443) (Schneider et al., 2018). Here, we expected number line esti-
mation skill to be more strongly related to approximate symbolic numeracy skill than to exact sym-
bolic numeracy skill because increased precision of the symbolic number sense is particularly
important for success on symbolic approximation tasks. Indeed, children’s number line knowledge
predicts their later approximate symbolic calculation skill (Gunderson et al., 2012), and training num-
ber line knowledge leads to improvements in other symbolic approximation skills such as magnitude
comparison (Ramani & Siegler, 2008) and approximate arithmetic (Booth & Siegler, 2008).
    In contrast to approximate symbolic calculation, exact calculation requires knowledge of specific
math facts and procedures. Although children’s number magnitude representations may indirectly
benefit their exact calculation skills (e.g., by helping them to quickly check whether a calculated solu-
tion is reasonable), number magnitude representations alone cannot be used to perform exact calcu-
lations. Consistent with this, approximate (but not exact) numerical instruction has been shown to
improve children’s approximate calculation performance (Obersteiner, Reiss, & Ufer, 2013). Therefore,
we expected to find weaker (or no) relations between number line estimation and exact calculation
skills given the approximate nature of number line estimation.

Specific spatial skills

   Past work comparing spatial and numerical skills suggests that skills in these two domains are dis-
tinct but related. For example, researchers have used factor analyses to show that math and spatial
skills load onto distinct but related factors during early and middle childhood (Hawes, Moss,
Caswell, Seo, & Ansari, 2019; Mix et al., 2016, 2017). Furthermore, work examining relations between
multiple spatial skills and math achievement suggests unique relations between specific spatial skills
and math outcomes (Geer, Quinn, & Ganley, 2019; Gilligan, Hodgkiss, Thomas, & Farran, 2019). These
findings highlight the importance of taking a broad approach to studying the multidimensional inter-
play between spatial and mathematical development.
   Studies examining psychometrically defined ‘‘spatial skills,” such as mental rotation, have often been
conducted in isolation from other spatially relevant skills. The current study considered spatial skills
more broadly and included both psychometrically defined skills (mental rotation and mental transfor-
mation) and other spatially relevant skills with strong ties to symbolic numeracy, including VSWM, pro-
portional reasoning, and acuity of the AMS. Including a broad set of spatially relevant skills in a single
study is critical for a robust understanding of the unique contributions of spatial skills to symbolic
numeracy. We chose these spatial skills because of their theoretical and empirical relations to number
line estimation and predicted that each skill would have an indirect effect on approximate symbolic
numeracy via number line estimation skills. In addition, we expected that some of these spatial skills
                                                    3
E.A. Gunderson and L. Hildebrand Journal of Experimental Child Psychology 212 (2021) 105251
(VSWM, mental rotation, and mental transformation) would also have direct effects on exact symbolic
numeracy skills. Here, we explain the theorized mechanisms underlying these predictions.
Mental transformation and mental rotation
Mental rotation is the ability to hold in mind and mentally rotate representations of two- or three-
dimensional visual stimuli (e.g., identifying a rotated letter; Shepard & Metzler, 1971). We use the
term ‘‘mental rotation” to refer strictly to tasks that require children to distinguish between rotated
versions of mirror-reversed images; this eliminates the possibility of strategies based on matching
specific features of the images. We use the term ‘‘mental transformation” to refer to tasks that may
involve mentally rotating or mentally translating visual stimuli but can also be solved using percep-
tual information such as feature matching (e.g., identifying which puzzle piece would fit in a puzzle).
Most prior work relating spatial skills to numeracy treats mental transformation and mental rotation
as interchangeable. In a recent exception, Frick (2019) found that kindergartners’ mental transforma-
tion and mental rotation skills were not correlated after controlling for age, verbal IQ, and socioeco-
nomic status (SES). Furthermore, these skills loaded on different spatial factors with distinct
relations to numeracy, suggesting that these are in fact distinct skills. We included measures of both
skills to test whether one is a more robust predictor of children’s symbolic numeracy skills.
We expected mental transformation and mental rotation to contribute to approximate symbolic
numeracy indirectly via number line estimation skills. Theoretically, visual transformation strategies
such as ‘‘zooming” between more and less familiar scales, a strategy children use on nonsymbolic scal-
ing tasks (Möhring, Newcombe, & Frick, 2014), may enhance children’s ability to visualize magnitudes
on the number line task. Empirically, spatial skills requiring mental transformation and mental rota-
tion predict later number line estimation skill during early childhood (Gunderson et al., 2012; LeFevre
et al., 2013). As noted above, we expected number line estimation skills in turn to predict children’s
approximate (but not exact) symbolic calculation skills. We did not have a priori predictions regarding
whether mental rotation alone, mental transformation alone, or both would drive these predicted
relations, and we included both types of measures to explore these relations.
In addition, we expected mental transformation and mental rotation to relate directly to exact
symbolic numeracy skills by supporting the mental models through which children solve novel math
problems (referred to as the ‘‘spatial modeling hypothesis”; Hawes, Moss, et al., 2019; Mix, 2019). Spa-
tial mental models can ground novel problems in a visuospatial representation that is easier for learn-
ers to reason about and manipulate than the symbolic equivalent and, as such, can support learning of
new mathematical concepts at all ages (Uttal & Cohen, 2012). For example, when first learning addi-
tion, children may create a mental model of three objects coming together with two objects to solve
the problem ‘‘3 + 2.” At an older age, constructing a schematic spatial model via sketching was ben-
eficial for 6th-graders solving complex word problems (Hegarty & Kozhevnikov, 1999). Therefore,
we expected mental transformation and mental rotation skills to directly relate to exact calculation
skills. Consistent with this prediction, elementary school students’ mental rotation skill correlates
with their exact calculation skills (Georges, Cornu, & Schiltz, 2019; Skagerlund & Träff, 2016), and
mental transformation training can lead to improvements in arithmetic calculation (Cheng & Mix,
2014; Mix, Levine, Cheng, Stockton, & Bower, 2021).
Visuospatial working memory
VSWM is a cognitive system that stores and processes information in terms of visual and spatial
features (Baddeley & Hitch, 1974). VSWM robustly predicts numeracy skills, including counting and
arithmetic, in pre-K to 3rd grade (4–9 years of age; Kyttälä et al., 2003; Meyer, Salimpoor, Wu,
Geary, & Menon, 2010). Like mental rotation and transformation, we expected VSWM to affect sym-
bolic numeracy skills both indirectly (via number line estimation) and directly. We suggest that
VSWM may aid number line estimation by helping children to hold in mind locations associated with
specific numbers. Consistent with this, 8- to 10-year-olds’ VSWM, mental rotation, disembedding, and
visuomotor integration all correlated with 0–1000 number line estimation (Simms, Clayton, Cragg,
Gilmore, & Johnson, 2016). However, to our knowledge, no study has established whether VSWM is
4E.A. Gunderson and L. Hildebrand Journal of Experimental Child Psychology 212 (2021) 105251
a unique predictor of number line estimation over and above other spatial skills. We predicted that
VSWM would relate to number line estimation skill, which in turn would predict approximate (but
not exact) symbolic calculation skills.
Children may use VSWM to hold in mind and manipulate relevant spatial information when
grounding new concepts with spatial mental models. Indeed, ample empirical evidence indicates that
VSWM is a strong predictor of overall math achievement (Raghubar, Barnes, & Hecht, 2010) and a
specific predictor of exact calculation skills during childhood (e.g., Foley, Vasilyeva, & Laski, 2017).
For example, 6- to 9-year-olds rely on VSWM as a mental sketchpad while performing simple mental
arithmetic problems (McKenzie, Bull, & Gray, 2003). Furthermore, VSWM can improve children’s abil-
ity to interpret and mentally manipulate symbols, including Arabic numerals (Mix, 2019). Indeed,
recent evidence provides causal support for improvements in 1st- and 6th-graders’ arithmetic perfor-
mance following VSWM training (Mix et al., 2021). Thus, we also expected VSWM to directly relate to
exact calculation skills.
Proportional reasoning
Proportional reasoning requires reasoning about visual relations between nonsymbolic spatial
extents (e.g., line lengths; Möhring, Newcombe, & Frick, 2015). Early studies by Piaget and Inhelder
(1975) suggested that proportional reasoning emerges at around 11 years of age, but more recent
research suggests that proportional reasoning may emerge in 4- to 6-year-olds if the presentation
of the proportion judgments are continuous amounts (e.g., Boyer, Levine, & Huttenlocher, 2008). Basic
proportional reasoning is evident in 3- and 4-year-olds when asked to produce equivalent amounts
(e.g., half a pizza equals half a chocolate bar; Singer-Freeman & Goswami, 2001). Here, we hypothe-
sized that proportional reasoning may be one of the most important skills underlying number line
estimation skill and in turn would affect approximate symbolic calculation skills.
There are strong theoretical and empirical reasons to believe that number line estimation relies on
proportional reasoning skill. Theoretically, proportional reasoning may provide a spatial strategy for
reasoning about symbolic numerical magnitudes. Accurate proportional reasoning requires the ability
to compare and map relations between continuous spatial magnitudes. Like proportional reasoning,
number line estimation requires considering the relations between a part (i.e., the magnitude of the
number to be estimated) and a whole (i.e., the total numerical magnitude of the number line as
defined by its end points). This numerical part–whole relation must then be mapped onto an equiv-
alent spatial part–whole relation with respect to the linear spatial extent of the number line. Thus,
the ability to reason about relations between spatial magnitudes (indexed by nonsymbolic propor-
tional reasoning) should be beneficial for mathematics, especially for tasks like number line estima-
tion that require the mapping of discrete quantities onto continuous extents (Rouder & Geary,
2014). It is worth noting that we do not see the existence of a proportional strategy on number line
estimation as being in conflict with a zooming strategy (discussed previously). Rather, consistent with
overlapping waves theory (Chen & Siegler, 2000), we expect that there are multiple number line esti-
mation strategies available to children, and the selection of a particular spatial strategy may vary as a
function of individual differences, item types, salience, and other factors.
Empirically, proportion judgments in nonsymbolic tasks show a specific pattern of bias, where
large proportions are underestimated and smaller proportions are overestimated (Hollands & Dyre,
2000), and mature performance on number line estimation tasks follows the same pattern of response
bias (Slusser, Santiago, & Barth, 2013). In one prior study, both number line estimation and a propor-
tion matching task loaded onto a mathematics factor but not a spatial factor, suggesting that there
may be similar magnitude mechanisms that drive a relation between the two skills (Mix et al.,
2017). Here, we predicted that proportional reasoning would relate to number line estimation over
and above other key spatial skills (mental rotation, mental transformation, VSWM, and AMS acuity).
Analog magnitude system acuity
The AMS is a quick, imprecise system of magnitude estimation (Dehaene, 2003) and is typically
assessed by asking children to select the more numerous of two dot arrays. The AMS is evolutionarily
5E.A. Gunderson and L. Hildebrand Journal of Experimental Child Psychology 212 (2021) 105251
old (Nieder, Freedman, & Miller, 2002), is present during infancy (Xu & Spelke, 2000), and improves
substantially in acuity during early childhood (Halberda & Feigenson, 2008). Although often described
as a numerical skill (and indeed the AMS is often referred to as the ‘‘approximate number system” or
ANS), AMS performance has a clear spatial component, such that children perform worse when spatial
extent contrasts with numerical extent and perform better when spatial and numerical extents coin-
cide (Cantrell & Smith, 2013).
AMS acuity correlates with school math achievement in children as young as 3 years (Bonny &
Lourenco, 2013; Libertus, Feigenson, & Halberda, 2011). Individual differences in AMS acuity at
6 months of age predict later math test scores in pre-K (4–5 years of age), which strongly suggests that
this capacity—present even before children learn to speak—forms a foundation for symbolic numeracy
(Starr, Libertus, & Brannon, 2013).
Much debate has centered on whether the nonsymbolic AMS or symbolic number sense (e.g., speed
at comparing Arabic numerals) underlies formal math achievement (De Smedt et al., 2013). This
debate largely stems from inconsistent findings on the relation between the AMS and math achieve-
ment. These discrepancies may arise from factors such as variations across measures, the type of for-
mal math achievement assessed, and developmental patterns (e.g., De Smedt et al., 2013; Inglis,
Attridge, Batchelor, & Gilmore, 2011; Schneider et al., 2017). Notably, relations between the AMS
and math achievement are most consistent for math tasks that benefit from the ability to quickly
choose and flexibly switch between mental calculation strategies, especially early in childhood (e.g.,
Linsen, Verschaffel, Reynvoet, & De Smedt, 2014; Nys & Content, 2010). Here, we propose that the pre-
cision of the AMS facilitates mapping between spatial magnitudes and symbolic numbers (i.e., number
line estimation). Number line estimation requires precision of symbolic numerical representations,
which in turn relies on a mapping between symbolic numerals and the nonsymbolic AMS (Siegler &
Opfer, 2003). Similarly, approximate symbolic calculation skill, which shows the signature ratio
dependency of the AMS (Gilmore et al., 2007), is thought to rely on both the precision of the nonsym-
bolic AMS and the precision of the nonsymbolic-to-symbolic mappings indexed by number line
estimation (e.g., Gilmore, Attridge, De Smedt, & Inglis, 2014; Gilmore et al., 2007; Waring &
Penner-Wilger, 2017). Therefore, we predicted that children with more precise nonsymbolic AMS acu-
ity would have better performance on number line estimation and approximate symbolic calculation
tasks.
The current study
The current study examined the relations between multiple measures of spatial skills, number line
knowledge, and numeracy skills, with the goals of examining how (through what specific links) and
why (through what mechanism) spatial skills predict numerical development. We used a cohort-
sequential design in which we recruited a large, racially and socioeconomically diverse cross-
sectional sample of children in pre-K to 3rd grade (4–9 years of age), who we assessed twice per year
for 2 years. We chose these grade levels because this represents an important time for the develop-
ment of both spatial and numerical cognition (Uttal & Cohen, 2012). We identified five spatial skills
that we believed would predict symbolic numeracy via number line estimation: VSWM, mental trans-
formation, mental rotation, proportional reasoning, and AMS acuity. We examined how these skills
related to approximate symbolic calculation as well as exact calculation. We also investigated number
line estimation as a potential mediator of the relation of spatial skills to approximate symbolic calcu-
lation. We predicted that number line estimation would relate more strongly to approximate calcula-
tion than to exact calculation because both number line estimation and approximate calculation are
theorized to rely on the precision of symbolic magnitude knowledge (e.g., Gunderson et al., 2012).
Nevertheless, we also tested the relation of number line estimation to exact calculation, based on prior
empirical findings supporting such a relation (Schneider et al., 2018).
This study presents a unique contribution in its comprehensive examination of a theoretical model
(Fig. 1) delineating specific relations between spatial and numerical skills in children using a large-
scale longitudinal design. We included several covariates to control for other possible influences on
numerical development: reading achievement, verbal IQ, child gender, and parents’ SES. We paid spe-
cial attention to the covariate of child gender given the large literature on the role of gender in math
6E.A. Gunderson and L. Hildebrand Journal of Experimental Child Psychology 212 (2021) 105251
Fig. 1. Theoretical model of relations between spatial and numerical skills. This model summarizes hypothesized links among
spatial skills, number line estimation, and symbolic numeracy skills. VSWM, visuospatial working memory; AMS, analog
magnitude system.
and spatial development. Specifically, there is a divergence in evidence for gender differences between
math and spatial domains. Evidence for gender differences in math skills is minimal (e.g., Bakker,
Torbeyns, Wijns, Verschaffel, & De Smedt, 2019; Kersey, Braham, Csumitta, Libertus, & Cantlon,
2018; Spelke, 2005), with some suggesting that findings of gender differences should be considered
exceptions rather than the rule (Hutchison, Lyons, & Ansari, 2019). Conversely, there is evidence of
a male advantage for spatial skills, especially mental rotation (for a review, see Lauer, Yhang, &
Lourenco, 2019). Despite these differences, girls benefit as much as boys from spatial training in
improving their spatial and math skills (Uttal et al., 2013), and some evidence suggests that spatial
training may even narrow gender gaps (Miller & Halpern, 2013). As such, it is critical to examine
the role of gender in studying relations between spatial and numerical skills, especially during this
important period of development.
We summarize our theoretical model in Fig. 1. We hypothesized that each spatial skill would
uniquely relate to number line estimation. We further expected that number line estimation would
relate to approximate symbolic calculation skill and would mediate relations between spatial skills
and approximate symbolic calculation but not exact calculation. We predicted that VSWM and mental
transformation and/or mental rotation would also relate directly to exact calculation.
We used hierarchical linear models, with time nested within person, to examine whether initial
levels of these five spatial skills predicted initial levels and growth rates (i.e., intercepts and slopes)
in approximate calculation and exact calculation skills. Finding that specific spatial skills related to
the initial levels of specific numeracy skills would provide support for the hypothesis of multiple dis-
tinct links between space and numeracy and would establish the importance of considering both
space and numeracy as multidimensional constructs. Finding that specific initial spatial skills pre-
dicted growth in specific numeracy skills would establish temporal precedence, consistent with the
theory that spatial skills lead to enhancements in symbolic numeracy skills.
Although a number of prior studies have reported that earlier spatial skills predict later numerical
skills (e.g., Frick, 2019; Gunderson et al., 2012; LeFevre et al., 2013; Verdine, Golinkoff, Hirsh-Pasek, &
Newcombe, 2017), others have argued that these longitudinal relations do not reflect true temporal
precedence and instead are artifacts of relations between spatial skills and numeracy that are stable
over time (e.g., Bailey, 2017). Indeed, most studies showing relations between earlier spatial skills
and later numerical skills have used linear regression or path analyses, which do not separate stable
time-invariant relations from time-varying predictive relations. Our modeling approach separates
these relations by treating both the intercept (initial level of numerical skill) and slope (growth rate
of numerical skill) as random effects that may vary across individuals. Prior studies using similar sta-
tistical approaches, such as by incorporating random intercepts or latent trait components, have found
robust time-invariant relations between spatial skills and numeracy and either less robust relations
7E.A. Gunderson and L. Hildebrand Journal of Experimental Child Psychology 212 (2021) 105251
(Geer et al., 2019) or no evidence for relations that vary over time (Bailey, 2017). Our analytic
approach allows us to determine which of two competing hypotheses best characterizes spatial–nu-
meric relations. If spatial–numeric relations are stable over time, as some have argued, this would
implicate correlations between stable traits or stable environments—what we call the time-invariant
hypothesis. Alternatively, spatial–numeric relations may be better characterized by a spatial–numeric
growth hypothesis, such that early spatial skills not only relate to initial numerical skills but also pre-
dict growth rates in numeracy over time. Based on the spatial–numeric growth account, we hypoth-
esized that initial spatial skills would predict both initial levels and growth rates in numerical skills,
consistent with a causal relation between these skills.
Method
Participants
We recruited participants in fall 2015 (Year 1) from 61 pre-K to 3rd-grade classrooms in 11 schools
(N = 564). In participating schools, students typically enter pre-K at 4 years of age and enter 3rd grade
at 8 years of age (at Time 1 [T1] Session 1, Mage = 6.74 years, SD = 1.37, nage = 531; see Appendix
Table C1 for mean ages by grade). Students were included in the study if their parents provided
informed consent and the children assented to participate. We assessed participants twice per year
for 2 consecutive school years (T1 to Time 4 [T4]). We recruited additional participants within these
schools between T1 and Time 2 (T2) (n = 23) and between T2 and Time 3 (T3) (n = 40) and did not
contact students who left their school during the study (see Appendix A for an enrollment flow chart).
Of the 627 consented participants, we excluded children who did not complete at least one cognitive
task (n = 10; see Appendix A for details), whose grade level was not recorded (n = 2), or who repeated a
grade during the study (n = 3). Therefore, the analytic sample included 612 children. Based on this
sample size, to achieve 80% power with a = .05, the minimum detectable effect size in multiple linear
regression is f2 = .013, a small effect size (Cohen, 1988).
Students in the analytic sample (N = 612) were 338 girls, 273 boys, and 1 child whose gender was
not recorded. Parents self-reported family demographics. Children were 51.4% Black/African
American, 20.1% White, 11.4% Hispanic, 4.2% Asian/Asian American, 0.4% American Indian/Alaskan
Native, 0.4% Native Hawaiian/other Pacific Islander, and 12.1% multiple races/ethnicities (nrace/ethnic-
ity = 543). Parents’ highest level of education averaged 14.67 years, where 14 years is an associate’s
degree (SD = 2.38, neducation = 544) and levels ranged from less than high school to a graduate degree.
Family annual income ranged from less than $15,000 to more than $100,000 (M = $48,524,
SD = $31,633, nincome = 520). We created a factor score for family SES by entering parents’ education
and family income into a principal components analysis. The resulting SES factor explained 81% of
the variance in parents’ education and family income.
Materials and procedure
Students completed assessments of spatial skills, numerical skills, and control measures at each of
four time points (see Appendix B for additional task details, including sample trials) approximately 5–
7 months apart (T1 to T2: M = 4.74 months, SD = 0.69; T2 to T3: M = 7.16 months, SD = 1.91; T3 to T4:
M = 4.82 months, SD = 0.32). At each time point, students completed two 30- to 45-min sessions one
on one with a trained experimenter (mean time between sessions = 6.55 days, SD = 8.56). At each time
point, students completed assessments in one of four pseudorandom orders.1 All measures were
1
The measures reported here represent the focal measures that were collected for all grade levels at all time points of this study.
The larger longitudinal study included a number of other measures that varied by grade level and/or time point, including
measures of whole-number comparison, fraction comparison, 0–10 number line estimation, fraction number line estimation,
decimal comparison, linear measurement, counting, cardinality, multiple-choice proportional reasoning, inhibitory control,
theories of intelligence, gender stereotypes, academic anxieties, academic self-concepts, academic motivation, and strategy self-
reports for spatial and numeric tasks. There is one other published study using this dataset, focusing on the relations between
inhibitory control and linear measurement (Ren, Lin, & Gunderson, 2019).
8E.A. Gunderson and L. Hildebrand Journal of Experimental Child Psychology 212 (2021) 105251
assessed at all four time points with the exception of verbal IQ (assessed only at T1). On tasks with prac-
tice trials, participants proceeded to the test trials regardless of their performance on the practice items.
No time limits were imposed on any task. See Table 1 for test–retest reliability for each task.
Visuospatial working memory
All participants completed the Dot Matrix subtest of the computerized Automated Work Memory
Assessment (AWMA; Alloway, 2007). On each trial, a red dot appeared briefly in a sequence of loca-
tions on a 4 4 grid, and children were asked to point to the dots’ locations in order. This task con-
tained 3 practice trials with feedback. Children received 6 test trials at each span length (number of
dots per trial), starting with one dot. The task ended after children gave three wrong answers at the
same span length. Each child received a standardized score, normed for 5–69 years of age, computed
by the AWMA software. The published test–retest reliability for this task is r = .85 (Alloway, 2007).
Mental transformation
Because there was no measure of mental transformation appropriate for the full age range, we gave
a different age-appropriate measure of two-dimensional mental transformation to pre-K and kinder-
garten children (Children’s Mental Transformation Task) than to 1st- to 3rd-graders (Thurstone’s Pri-
mary Mental Abilities Test). Both tasks were presented on paper, and the experimenter recorded
children’s responses.
Children’s Mental Transformation Task. Pre-K and kindergarten children were asked to determine
which of four shapes would be formed by fitting two pieces (presented above the shapes) together
(Levine, Huttenlocher, Taylor, & Langrock, 1999). Some items required mental rotation, and others
required only mental translation. Participants completed 24 items, and mean accuracy was recorded
(there were no practice trials on this task). We calculated internal reliability at T1 using McDonald’s
omega (x = .73) (Dunn, Baguley, & Brunsden, 2014).
Thurstone’s Primary Mental Abilities test, Mental Rotation subtest. Children in 1st to 4th grades were
asked to choose one of four shapes, each rotated at different angles that would form a square when
put together with the target shape (Thurstone, 1938). Before the task, the experimenter explained
the definitions of square and rectangle, and children completed 4 practice items with feedback. Chil-
dren completed 16 test trials without feedback, and mean accuracy was recorded (T1 reliability,
x = .57).
Table 1
Test–retest reliability across tasks.
Sample size per time point Test–retest reliability
Measure Time Time Time Time Time 1 to Time Time 2 to Time Time 3 to Time
1 2 3 4 2 3 4
VSWM 435 457 453 429 .45 .38 .44
Mental transformation 501 487 443 429 .57 .53 .56
Mental rotation 507 500 464 441 .52 .61 .61
Proportional reasoning 499 489 461 422 .43 .41 .49
AMS acuity 387 405 393 379 .47 .51 .55
Number line estimation 444 455 433 388 .58 .61 .66
Approximate symbolic 449 461 432 391 .32 .31 .39
calculation
Exact calculation 465 451 405 399 .61 .53 .61
Reading achievement 461 460 423 407 .84 .82 .90
Verbal IQ 454 NA NA NA NA NA NA
Note. Sample size and test–retest reliability for each task (total N = 612) are shown. All test–retest reliabilities were significantly
different from zero (p < .001). Number line estimation and proportional reasoning percentage absolute error scores were arcsine
transformed. VSWM, visuospatial working memory; AMS, analog magnitude system; NA, not applicable (assessed only at Time 1).
9E.A. Gunderson and L. Hildebrand Journal of Experimental Child Psychology 212 (2021) 105251
Mental rotation
We gave different age-appropriate mental rotation tasks to pre-K and kindergarten children (Ghost
Puzzle) than to 1st- to 4th-graders (Letter Rotation). Both tasks were presented on paper, and
responses were recorded by the experimenter.
Ghost Puzzle task. In this task, pre-K and kindergarten children were asked to mentally rotate two
ghosts to determine which would fit into a circle with a hole in the middle that was the same shape
as one of the ghosts (Frick, Hansen, & Newcombe, 2013). On each trial, the choices were the correct
answer and its mirror image, rotated at different angles with respect to the hole. Before the test items,
children completed 2 practice trials with feedback (the first involved manipulating foam board pieces
to fit into a hole, and the second involved mentally rotating the same images). Participants then com-
pleted 22 test trials without feedback, and mean accuracy was calculated (T1 reliability, x = .76).
Letter Rotation task. In this task, 1st- to 4th-graders were shown a target letter in a box on the left and
four rotated letters on the right (Quaiser-Pohl, Neuburger, Heil, Jansen, & Schmelter, 2014). Children
were instructed to decide which two of the four rotated letters were identical to the one on the left
when it was spun right side up; the two incorrect letters were mirror-reversed. Prior to the test trials,
participants were given two worked examples and 2 practice items with feedback. Participants then
completed 16 test trials without feedback. A trial was scored as correct only if children chose both cor-
rect letters and no others. Mean accuracy was recorded (T1 reliability, x = .88).
Proportional reasoning
We assessed proportional reasoning at all grade levels using a computerized task that has been pre-
viously used in 4- to 10-year-olds (Möhring et al., 2015; Möhring, Newcombe, Levine, & Frick, 2016).
Participants were told a story about a bear named Paul who likes to drink mixtures of cherry juice and
water. Children saw a vertical rectangle (‘‘cup”) divided into blue (‘‘water”) and red (‘‘cherry juice”)
sections. The total height of the rectangle, as well as the proportion of red and blue segments, varied
between trials. Participants were asked to click on a horizontal line below the cup to indicate how
much each drink would taste like cherry on a scale from one cherry (not at all like cherries) on the left
to many cherries (a lot like cherries) on the right. Children completed 2 practice trials with feedback
and then completed 15 test items without feedback; item order was randomized across participants.
We excluded participants’ scores if 90% of their responses fell within 10% of the line’s length, following
prior work on removing repetitive responses from number line estimation data (Slusser et al., 2013).
We calculated the percentage absolute error (PAE) between the target and the response for each item
(PAE = | response correct | / total line range) and then calculated an average PAE score for each
participant (T1 reliability, x = .87). We then reverse-scored PAE so that higher scores would indicate
better performance.
Analog magnitude system acuity
Precision of children’s AMS was assessed using Panamath software (Halberda, Mazzocco, &
Feigenson, 2008). In this computerized task, children saw blue dots on one side of the screen and yel-
low dots on the other and were asked which color had more dots. Children were instructed that more
dots meant a larger number of dots regardless of the size of the dots. Participants completed 1 practice
trial on paper with feedback. For all children, half the items were size-controlled and half were not,
and the number of dots per side ranged from 5 to 21. The number of items, display time, and ratios
differed according to children’s grade level.2 We examined percentage accuracy because this is a more
stable and reliable measure than the Weber fraction (Inglis & Gilmore, 2014). Published reliability with
children and adults is from .69 to .74 (Spearman–Brown corrected random split-half reliability; Libertus,
Odic, Feigenson, & Halberda, 2016; Libertus, Odic, & Halberda, 2012). In addition, work with adults
2
Children in pre-K and kindergarten completed 48 items with a display time of 2128 ms and ratios from 1.23 to 3.00. Children in
1st and 2nd grades completed 56 items with a display time of 1789 ms and ratios from 1.20 to 2.86. Children in 3rd and 4th grades
in Year 1 completed 56 items with a display time of 1506 ms and ratios from 1.17 to 2.71, and those in Year 2 completed 64 items
with a display time of 1269 ms and ratios from 1.17 to 2.67.
10E.A. Gunderson and L. Hildebrand Journal of Experimental Child Psychology 212 (2021) 105251
suggests that dot discrimination tasks like Panamath are the most reliable measures of AMS acuity
(Chesney, Bjalkebring, & Peters, 2015).
Number line estimation
Number line estimation was assessed using a computerized, bounded number-to-position task
with labeled end points (Fazio, Bailey, Thompson, & Siegler, 2014; Siegler & Opfer, 2003). Pre-K
and kindergarten children completed a 0–100 number line task, and 1st- to 3rd-graders completed
the 0–1000 number line task, appropriate for assessing individual differences at these ages
(Gunderson et al., 2012). Each task had 18 items presented in a randomized order (see Appendix
B for all items).3 There were no practice trials. For each item, children clicked on the line to indicate
where a specific number should be positioned. The experimenter asked children not to spend too
long thinking about each number in an effort to encourage estimation. Consistent with prior research
(Slusser et al., 2013), we excluded participants’ scores on this task if 90% of their responses fell
within 10% of the line’s length. We chose to use mean PAE in our analyses because it is a widely
used, theory-neutral method of examining accuracy on the task. Reliabilities at T1 were
x0–100 = .77 and x0–1000 = .87. We reverse-scored PAE so that higher scores would indicate better
performance on all tasks.
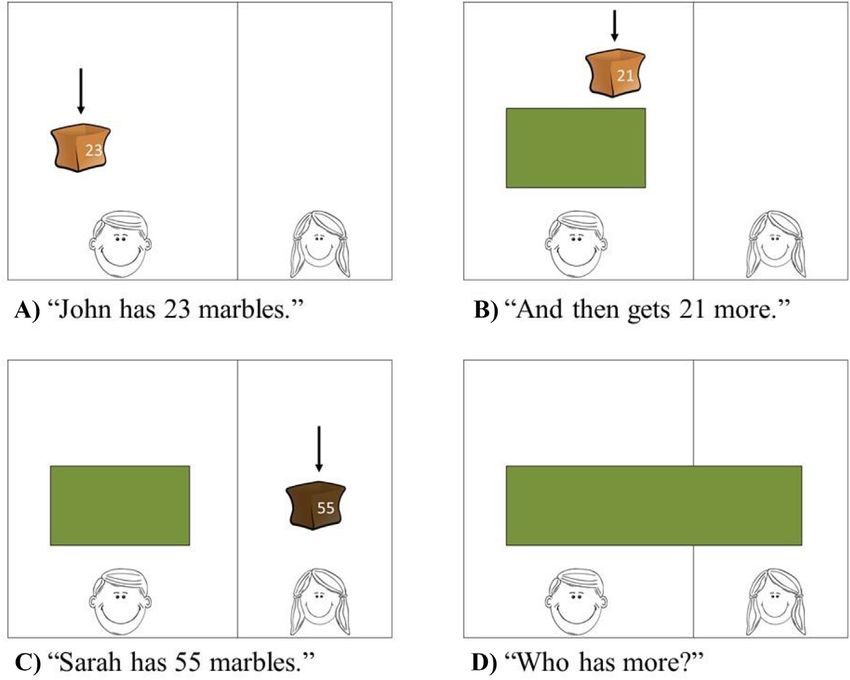
Approximate symbolic calculation
Children completed a computerized approximate symbolic calculation task adapted from Gilmore
et al. (2007). See Appendix B for all items. On each trial, children saw two characters, Sarah and John,
and the experimenter explained that each character would receive some marbles, which were repre-
sented by bags labeled with Arabic numerals (see Fig. 2). On addition trials, one character received two
bags of marbles consecutively. On subtraction trials, one character received a bag of marbles and then
lost a bag of marbles. On all trials, the other character then received one bag of marbles. Children’s task
was to say which character had more marbles. The correct answer differed from the comparison total
by one of two ratios (pre-K and kindergarten: 4:7 and 2:3; 1st and 2nd grades: 2:3 and 4:5; 3rd and
4th grades: 4:5 and 6:7). Addition items and subtraction items were blocked and counterbalanced.
Each block contained 2 practice trials with feedback, followed by 10 test trials (4 easier ratio, 4 harder
ratio, and 2 check trials described below). This resulted in 16 approximate calculation test trials (8
addition and 8 subtraction).4 We examined percentage accuracy on these 16 items in our analyses
(T1 reliabilities were calculated within grade-level groups, xpre-K and kindergarten = .67, x1st and 2nd
grades = .56, and x3rd grade = .55).
We employed several strategies to encourage children to approximate on this task; the bags of
marbles were occluded after being briefly presented, experimenters encouraged children to choose
quickly, and the numbers represented in each trial varied by grade level and were chosen to be more
difficult than children could typically complete exactly. We also included check trials (2 per block) in
which the characters’ total number of marbles differed by exactly one. Children did not perform sig-
nificantly above chance on these check trials, based on one-sample t tests within grade and time point
with correction for multiple comparisons (mean accuracy ranged from 43.4% to 55.5%). Chance-level
performance on check trials indicates that, as a group, children were not able to perform these calcu-
lations exactly.
Exact calculation
To assess exact calculation, children in pre-K and kindergarten completed the story
problems task, and children in 1st to 4th grades completed the Woodcock–Johnson IV Calculation
subtest.
3
At T1, some children received a version of the task with different numbers or more trials. We included data from these
children. Details can be found in Appendix A.
4
Due to an error in stimulus design, 3rd- and 4th-graders completed 7 approximate addition trials (3 6:7 ratio items and 4 4:5
ratio items) and 3 exact addition check trials. The 3rd- and 4th-graders completed the correct number of subtraction trials of each
type (8 approximate subtraction items and 2 exact subtraction check trials). For each item type, we included all available items of
that type in our analyses.
11E.A. Gunderson and L. Hildebrand Journal of Experimental Child Psychology 212 (2021) 105251
Fig. 2. Sample trial from approximate symbolic calculation task. Images were animated and appeared sequentially (in order
from A to D). Arrows were not shown to participants but are included in the figure to indicate direction of motion in the
animated sequence. (Adapted from C. K. Gilmore, S. E. McCarthy, & E. S. Spelke, 2007, ‘‘Symbolic arithmetic knowledge without
instruction,” Nature, 447, p. 589. Copyright 2007 by Nature Publishing Group.)
Story problems. Pre-K and kindergarten children completed an orally presented story problems task
adapted from Levine, Jordan, and Huttenlocher (1992). The experimenter read each problem to chil-
dren and recorded their verbal response. A total of 14 problems were presented in a single pseudoran-
dom order (7 addition and 7 subtraction; see Appendix B). Operands and solutions ranged from 1 to 7;
for example, ‘‘Eric has 4 balloons. Tiffany takes away 2 of his balloons. How many balloons does Eric
have left?” Mean accuracy was recorded (T1 reliability, x = .84).
Woodcock–Johnson IV Calculation. In this nationally normed paper-and-pencil test, 1st- to 4th-graders
were asked to complete written arithmetic problems of increasing difficulty (Schrank, Mather, &
McGrew, 2014). The items typically included addition, subtraction, multiplication, and division involv-
ing whole numbers and fractions. Testing continued until both basal criteria (6 lowest-numbered
items administered were correct) and ceiling criteria (6 highest-numbered items administered were
incorrect) were met. Scores were excluded if the experimenter discontinued testing before adminis-
tering enough items to meet these basal and ceiling criteria (a type of experimenter error). Published
reliability for 5- to 10-year-olds is greater than .90 (McGrew, LaForte, & Schrank, 2014). We analyzed
children’s W scores, which are Rasch-scaled scores suitable for assessing growth over time
(Woodcock, 1999).
Reading achievement
As a control measure, we assessed reading achievement using the Woodcock–Johnson IV
Letter–Word Identification subtest (Schrank et al., 2014). In this nationally normed test, children must
12E.A. Gunderson and L. Hildebrand Journal of Experimental Child Psychology 212 (2021) 105251
identify individual letters and read words of increasing difficulty. We excluded children’s scores if the
basal and ceiling criteria were not met due to experimenter error. Reliability for 4- to 10-year-olds is
greater than .94 (McGrew et al., 2014). We analyzed children’s W scores on this test.
Verbal IQ
As a control measure, we assessed verbal IQ using the Kaufman Brief Intelligence Test–Second Edi-
tion (KBIT-2; Kaufman & Kaufman, 2004) at T1 only. Children were asked to point to one of six pictures
that best matched a word or phrase and to provide a one-word answer to verbal riddles (e.g., ‘‘What is
something that wags its tail and barks?” dog). The test contains items of increasing difficulty, and test-
ing continued until basal and ceiling criteria were established. Published internal reliability on this
measure for children aged 4–10 years is from .86 to .91 (Kaufman & Kaufman, 2004). We excluded
children’s scores on this task if basal and ceiling criteria were not met due to experimenter error.
We examined standard scores based on age.
Analytic approach
All analyses were conducted in R (R Core Team, 2020). Prior to our analyses, we visually examined
histograms of each measure. Because PAEs are expected to be non-normally distributed, we used an
arcsine transformation on number line estimation and proportional reasoning PAE scores. All mea-
sures (including arcsine transformed PAEs) were approximately normally distributed with no evi-
dence of floor or ceiling effects. In addition, we examined skewness and kurtosis as indicators of
normality, with absolute values of skewness less than 2 and absolute values of kurtosis less than 7
considered acceptable (Curran, West, & Finch, 1996). All measures had values in the acceptable range.
We did not exclude any values as outliers (after confirming that all values were valid scores on each
measure) because values more than 3 standard deviations from the mean were expected given our
large sample size.
Missing data
Missing data occurred for reasons such as attrition, child absence, child refusal, and experimenter
error. For each task, a child’s data were excluded if the child completed fewer than half the items on
that task. There were no missing data for grade level, school, or time point, and there was 1 missing
data point for child gender. For other variables, the percentage of missing data ranged from 16.7% to
36.8%. To examine the nature of the missing data, we performed Little’s missing completely at random
(MCAR) test, which was significantly different from zero, v2(5959) = 5720, p = .014, indicating that the
data were not MCAR. Therefore, for our main analyses, we used multiple imputation (MI) using the R
package mice (van Buuren & Groothuis-Oudshoorn, 2011). MI reduces bias compared with listwise
deletion, especially when data are not MCAR (van Ginkel, Linting, Rippe, & van der Voort, 2020).
We used 20 imputations, the recommended number of imputations when the overall fraction of miss-
ing information is less than 30% (Graham, Olchowski, & Gilreath, 2007). Our MI model accounted for
the nesting of longitudinal observations within participants. We used predictive mean matching,
which allows for missing data to be imputed based on the observed data without making assumptions
about the distribution of each variable (van Buuren, 2018).
Main analyses
Our main analyses examined the role of initial spatial skills in predicting children’s initial levels
and growth in exact calculation, approximate calculation, and number line estimation. We ran sepa-
rate multilevel models for each numeracy outcome, with observations nested within children, using
the R package lme4 (Bates, Maechler, Bolker, & Walker, 2015). In each model, the focal predictors were
the five T1 spatial skills, which we entered as predictors of both the intercept (initial level) and the
slope (growth rate) of the target numeracy skill. Because measures were standardized within grade
level, a positive slope would indicate that a child improved relative to his or her grade-level peers
on a given task. We entered time as a continuous variable based on each child’s date of testing (where
the intercept [time = 0] was the start date of the study) to account for variability in testing dates
within a time point. In all models, we included a strict set of covariates (grade level, gender, school
13E.A. Gunderson and L. Hildebrand Journal of Experimental Child Psychology 212 (2021) 105251
fixed effects, SES, initial reading achievement, and initial verbal IQ) as predictors of both the slope and
intercept. We report pooled estimates from the multiply imputed datasets.
Results
Preliminary analyses
We conducted preliminary analyses on raw scores to establish the expected pattern of improve-
ment with grade level. (Note that we only conducted these analyses among participants who com-
pleted the same task; e.g., comparing pre-K with kindergarten on the Ghost Puzzle Task, comparing
1st-graders with 2nd-graders on the Letter Rotation Task.) Grade level was significantly correlated
with higher performance on all tasks (with the exception that T1 Panamath scores did not significantly
differ between 1st and 2nd grades). See Appendix Table C1 for descriptive statistics of raw scores by
grade level.
For several of our measures of spatial skills and numeracy, different tasks (or different levels of dif-
ficulty within a task) were administered to different grade levels. To analyze all participants’ data on a
single scale, we standardized children’s scores by creating z scores within each grade level on each
measure. These scores represent how many standard deviations each student scored above or below
the mean score in their grade. These grade-standardized scores were positively correlated for all T1
spatial and numeric measures (.15 < r < .44; ps < .01; small to moderate effects5) (see Appendix
Table C2 for correlations among key study variables). We confirmed that mental transformation and
mental rotation were not highly related, r(491) = .38, p < .001, a moderate effect; therefore, we included
these as separate predictors in our main analyses. We examined gender differences using t tests with
Holm’s adjustment for multiple comparisons (see Appendix Table C3). Boys performed significantly bet-
ter than girls on number line estimation at T2, T3, and T4 (.34 < d < .59, ps < .01, small to moderate
effects); there were no other significant gender differences.
Main analyses
Exact calculation
We first examined which specific initial spatial skills were most related to children’s initial levels
and growth rates in exact calculation. Model 1 (Table 2) included our five focal measures of initial spa-
tial skills (VSWM, mental transformation, mental rotation, proportional reasoning, and AMS acuity) as
predictors of initial levels and growth rates in exact calculation. We found that mental rotation, pro-
portional reasoning, and AMS acuity each significantly contributed to children’s initial levels of exact
calculation skill, with small but significant effect sizes, in which a 1-SD increase in spatial skill was
related to a .10- to .15-SD increase in initial exact calculation skill. However, contrary to our expecta-
tions, none of these spatial skills predicted growth rates in children’s exact calculation skills. Further-
more, VSWM and mental transformation skills did not significantly relate to initial levels or growth
rates in exact calculation skills.
We also asked whether number line estimation skill was a significant predictor of exact calculation
over and above all the measured spatial skills and covariates (Table 2, Model 2). We found that initial
number line estimation skill was a significant predictor of initial levels of exact calculation skill
(B = .17, SE = .05, p < .001, a small effect size) but did not significantly predict growth in exact calcu-
lation skill.
Approximate calculation
We next examined the impact of initial spatial skills on approximate symbolic calculation levels
and growth rates (Table 2, Model 3). In contrast to exact calculation skill, for approximate calculation
5
We interpret correlation coefficients and standardized regression coefficients as follows. We interpret values of .10 to .30 as
small, values greater than .30 to .50 as moderate, and values greater than .50 as large (Cohen, 1988; Peterson & Brown, 2005). We
interpret Cohen’s d values of .20 to .50 as small, values greater than .50 to .80 as moderate, and values greater than .80 as large
(Cohen, 1988).
14You can also read